
Agriculture in BrazilOverview | April 2010

Los Grobo Overview
Section 1
3
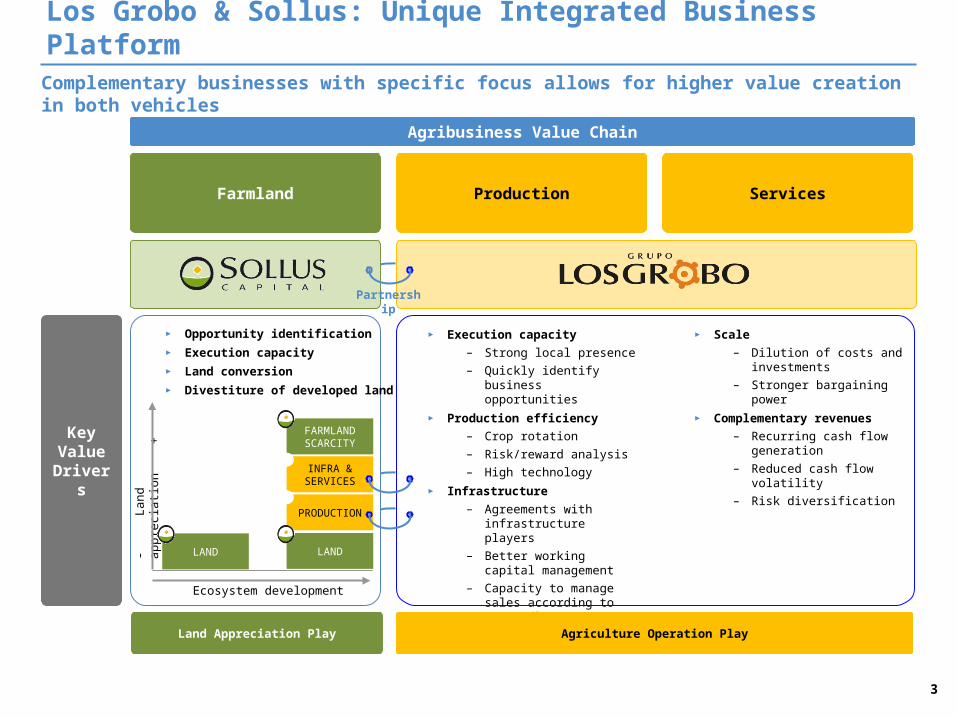
► Execution capacity
– Strong local presence
– Quickly identify business opportunities
► Production efficiency
– Crop rotation
– Risk/reward analysis
– High technology► Infrastructure
– Agreements with infrastructure players
– Better working capital management
– Capacity to manage sales according to price fluctuation
– Lower logistic costs
Los Grobo & Sollus: Unique Integrated Business Platform
ProductionFarmland Services
Agribusiness Value Chain
Key Value
Drivers
► Scale
– Dilution of costs and investments
– Stronger bargaining power ► Complementary revenues
– Recurring cash flow generation
– Reduced cash flow volatility
– Risk diversification
Complementary businesses with specific focus allows for higher value creation in both vehicles
Land Appreciation Play Agriculture Operation Play
Partnership
LAND
PRODUCTION
INFRA & SERVICES
FARMLAND SCARCITY
-
La
nd
ap
pre
cia
tion
+
LAND
Ecosystem development
► Opportunity identification► Execution capacity ► Land conversion► Divestiture of developed land
4
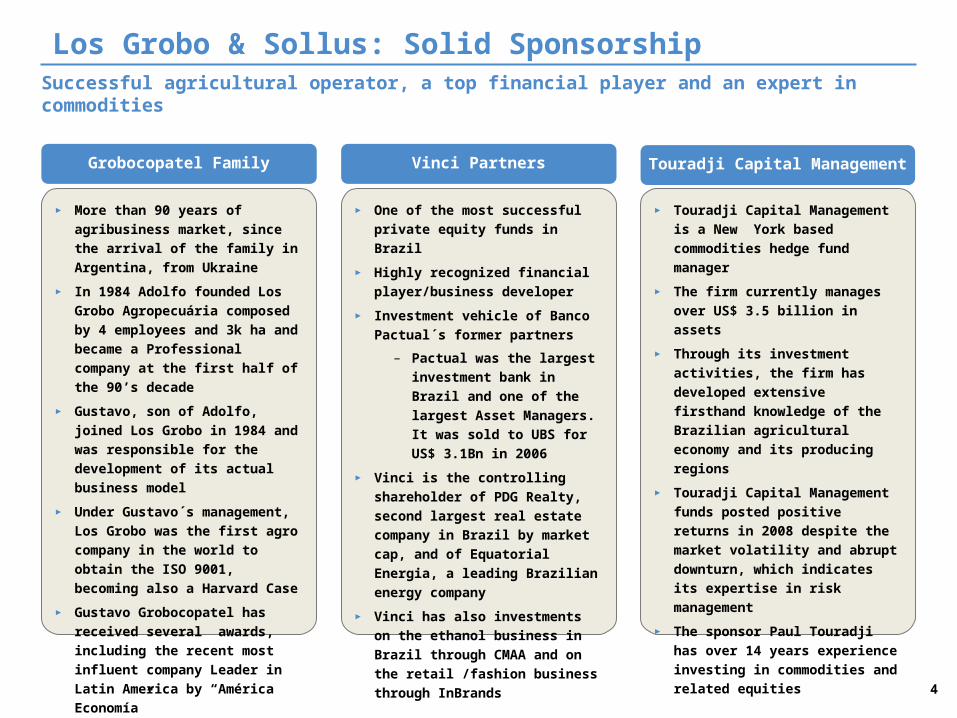
Los Grobo & Sollus: Solid SponsorshipSuccessful agricultural operator, a top financial player and an expert in commodities
► One of the most successful private
equity funds in Brazil
► Highly recognized financial
player/business developer
► Investment vehicle of Banco
Pactual´s former partners
– Pactual was the largest
investment bank in Brazil and
one of the largest Asset
Managers. It was sold to UBS
for US$ 3.1Bn in 2006
► Vinci is the controlling shareholder
of PDG Realty, second largest real
estate company in Brazil by market
cap, and of Equatorial Energia, a
leading Brazilian energy company
► Vinci has also investments on the
ethanol business in Brazil through
CMAA and on the retail /fashion
business through InBrands
Vinci Partners
► Touradji Capital Management is a
New York based commodities
hedge fund manager
► The firm currently manages over
US$ 3.5 billion in assets
► Through its investment activities,
the firm has developed extensive
firsthand knowledge of the
Brazilian agricultural economy and
its producing regions
► Touradji Capital Management funds
posted positive returns in 2008
despite the market volatility and
abrupt downturn, which indicates
its expertise in risk management
► The sponsor Paul Touradji has over
14 years experience investing in
commodities and related equities
Touradji Capital ManagementGrobocopatel Family
► More than 90 years of agribusiness
market, since the arrival of the
family in Argentina, from Ukraine
► In 1984 Adolfo founded Los Grobo
Agropecuária composed by 4
employees and 3k ha and became a
Professional company at the first
half of the 90’s decade
► Gustavo, son of Adolfo, joined Los
Grobo in 1984 and was responsible
for the development of its actual
business model
► Under Gustavo´s management, Los
Grobo was the first agro company
in the world to obtain the ISO 9001,
becoming also a Harvard Case
► Gustavo Grobocopatel has received
several awards, including the
recent most influent company
Leader in Latin America by
“América Economía”

5
Uruguay
Argentina
Chile
Brazil
Venezuela
Peru
Bolivia
Paraguay
MA
PITO
MT
GO
MS
PR
MG
Colombia
Geographically Diversified Production – 2009/2010
Los Grobo: Sizeable and Diversified LatAm Player
Planted Area (k ha)¹
Los Grobo is the 2nd largest LatAm grain producer, with more than 250k ha of productive land throughout Brazil, Argentina, Uruguay and Paraguay…
Brazil:
Production Area: 55k haInput Sales: US$ 50 mmGrain Origination: 800 tonCrushing: 90 ton
Argentina:
Production Area: 90k haInput Sales: US$ 25 mmGrain Origination: 1,000k tonCrushing: 266 ton
Uruguay:
Production Area: 90k haInput Sales: US$ 15 mmGrain Origination: 440k ton
Paraguay:
Production Area: 16k haGrain Origination: 35k ton
Total:
Production Area: 251k haInput Sales: US$ 99 mmGrain Origination: 2,255k tonCrushing: 170k ton
CAGR 02 / 03 – 09 / 10 E: 21%
Grain Origination (k tons)¹
CAGR 02 / 03 – 09 / 10 E: 20%
BA
… also servicing over 500k Ha of production through its services business
486594
8331,030
1,389
1,7631,868
2,255
02 / 03 03 / 04 04 / 05 05 / 06 06 / 07 07 / 08 08 / 09 09 / 10E
Clients Own
Soybean Wheat Corn Others
64
02 / 03
43%
31%
13%
81
03 / 04
53%
27%
10%
105
04 / 05
49%
29%
12%
118
05 / 06
54%
24%
14%
154
06 / 07
53%
27%
13%
173
07 / 08
47%
26%
18%
247
08 / 09
51%
23%
21%
251
09 / 10E
62%
24%
9%
Global Agribusiness Outlook
Section 2

7
0
40
80
120
160
2000
2001
2002
2003
2004
2005
2006
2007
2008
2009
2010
2011
2012
Ethanol
Biodiesel
Per Capita Meat Consumption (2009=100)2
Population Growth
► Global population will rise by 1.5
billion people over the next 20
years
► Migration to urban areas, specially
in the developing countries
Global Agribusiness Outlook: Increasing and Sustainable Demand
Economic and Income Growth
► Consistent personal income
growth in developing countries
► Income growth increases meat
consumption and food demand
Development of Global Biofuels
► Development of viable and
environmental friendly fuels
globally
► Increase in blending of biofuels
with gasoline
► Fuel crops are crowding out food
crops, constraining food supply
Increasing demand for food and biofuels are the main pillars for bullish commodities outlook…
World Biofuels Production (Liters – billions)3
Urbanization (Million of people)1
Source:1. OECD2. FAPRI3. MB Agro
90
100
110
120
130
2009 2010 2011 2012 2013 2014 2015 2016 2017 2018
Brazil China EU Russia
-
1,000
2,000
3,000
4,000
1950
1955
1960
1965
1970
1975
1980
1985
1990
1995
2000
2005
2010
2015
Developing urban population
Developed urban population

8
17% 5%
10%
22%
16%
22%
47%
47%
55%
8%
25% 22%
Series1 Series2
0
200
400
600
800
South andCentralAmerica
Sub-Saaharan
Africa
NorthAmerica
Europe Asia andP acific
North Asia,East Urals
NorthAfrica andNear East
Potential Arable Land
Actual Arable Land
► All-year-round crops
Long Term Competitive Advantages
Land Availability (k ha)2
Leading Producer of Major Products (% of Global Production)1
South America: The Natural Supplier… and South America is likely to consolidate its position as the global preeminent farming region…
Coffee
Soybean
Sugar
Poultry
Beef
Corn
Orange Juice
Source: 1. USDA 2008/2009 Estimates2. FAO
Source: 1. USDA 2008/2009 Estimates2. FAO
1st
1st
2nd
1st
3rd
► Highly favorable geographic and climate conditions
► Competitive production costs
► Favorable regulatory environment
3rd
2nd 5th
3rd 6th
... due to its competitive advantages and abundant resources
20%

9
South America: Upside PotentialDespite the bullish scenario for agribusiness, land prices are still lower when compared to other main productive areas…
… and are likely to appreciate as farmland becomes more scarce
Farmland Price Dynamics and Appreciation Estimates
( -
)
Dev
elo
pm
en
t S
tag
es
(+)
Raw Land
Production
Infra &Services
Scarce Land
► Agriculture potential
► No agricultural utilization
► Lack of services /
infrastructure
► Crop is implemented
► Lack of services /
infrastructure
► Developed crops
► Availability of services /
infrastructure
► Successful prior crops
► Well developed region
► Lack of available
properties nearby
STAGE CONDITIONSAPPRECIATION
ESTIMATES¹
► Balsas – MA
► US$ 1.1k / ha
► Luis Eduardo – BA
► US$ 3.0k / ha
► Rio Verde – GO
► US$ 4.0k / ha
► Ribeirão Preto – SP
► US$ 7.5k / ha
► Traditional producing area► Arbitrage opportunities rising
► Highly developed infrastructure for exports and logistics
► Concentration of high yield products
► Significant soybeans and sugarcane crops expansion
► Limited infrastructural integration
► Several infrastructure developments expected
► Further development of exports and logistics facilities
Average Agricultural Farmland Price (US$ / ha)
USA 11,000
6,000 4,000
3,000
5,900
5,300
3,500
2,300
1,400
3,500
► Long cattle tradition► Northern provinces: best promises in
acreage increase
5
1
2
► Paraguay is growing its agricultural acreage steadily
3
4
6
5
1
23
4
6
Source: FNP, Iowa State University and Sollus

The Soybean in the World
EUA32%
Brasil28%
Argentina21%
China7%
Outros12%
EUA25%
Brasil15%
China19%
Argentina18%
UE 7%
Outros16%
EUA40%
Brasil35%
Argentina15%
Outros10%
Soybeans
EUA14%
Brasil22%
Índia7%
Argentina49%
Outros8%
Soymeal
UE 20%
Japão6%
Méximo5%
China45%
Outros24%
Soybeans
Soybean Production
Soybeans Crushing
Exports
Imports
Índia10%
China28%
Outros62%
SoyOil

11
Historical Soybeans Yield
Historical Soybeans Yield (tons/ha) vs. Modeled (LS)
Linear trend grow in Soybeans Yield
Argentina Uruguay
Paraguay Brazil

Production Cost BreakdownProduction Cost Breakdown
SOYBEANS BRAZIL ARGENTINA URUGUAY PARAGUAY
Cost per Ha Seeds 7% 10% 11% 9%
Chemicals 15% 9% 10% 12%
Fertilizer 22% 5% 17% 16%
Land Lease 19% 45% 32% 28%
G&A 6% 11% 5% 9%
Labor/Machinery 22% 10% 14% 15%
Harvest 9% 10% 11% 11%
Production Costs - SOYBEAN
Grain Production in Brazil
Section 3
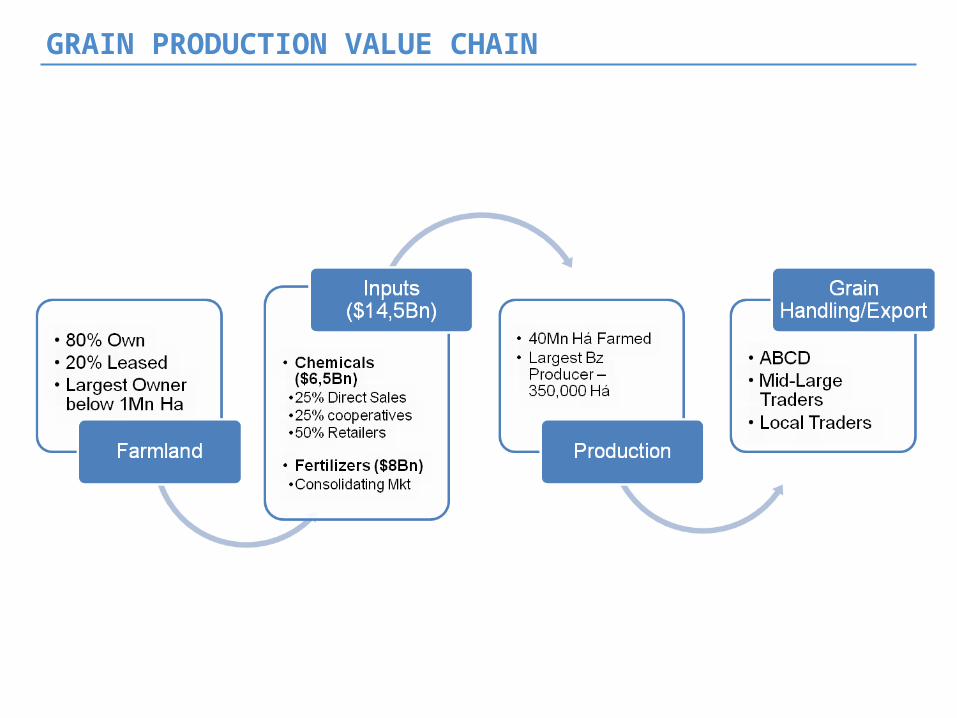
GRAIN PRODUCTION VALUE CHAIN
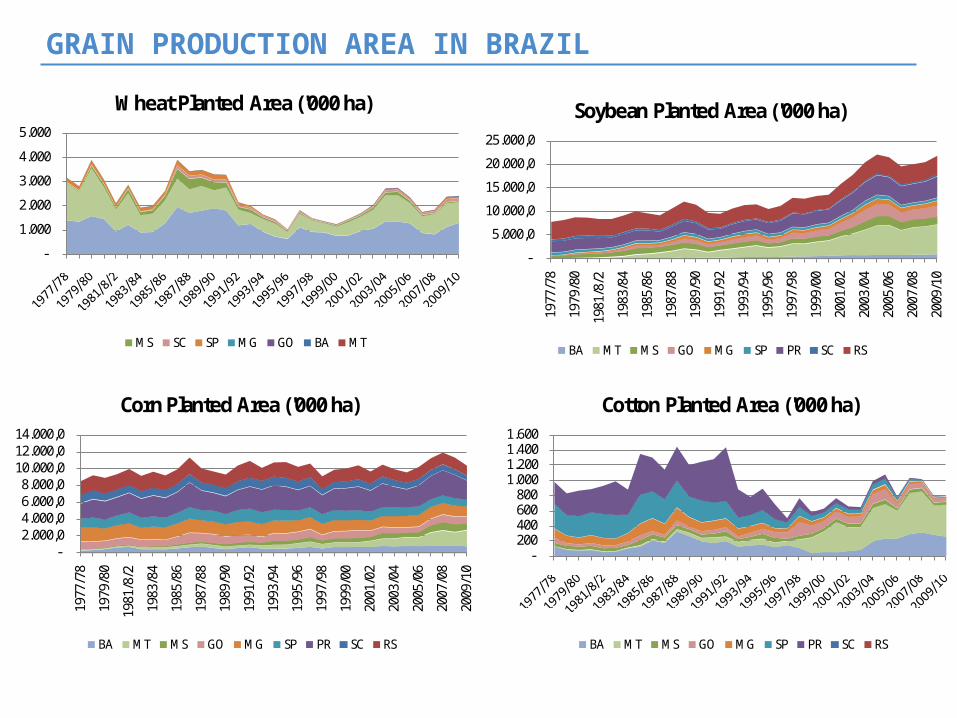
GRAIN PRODUCTION AREA IN BRAZIL
-2.000,0 4.000,0 6.000,0 8.000,0
10.000,0 12.000,0 14.000,0
1977
/78
1979
/80
1981
/8/2
1983
/84
1985
/86
1987
/88
1989
/90
1991
/92
1993
/94
1995
/96
1997
/98
1999
/00
2001
/02
2003
/04
2005
/06
2007
/08
2009
/10
Corn Planted Area ('000 ha)
BA MT MS GO MG SP PR SC RS
-
5.000,0
10.000,0
15.000,0
20.000,0
25.000,0
1977
/78
1979
/80
1981
/8/2
1983
/84
1985
/86
1987
/88
1989
/90
1991
/92
1993
/94
1995
/96
1997
/98
1999
/00
2001
/02
2003
/04
2005
/06
2007
/08
2009
/10
Soybean Planted Area ('000 ha)
BA MT MS GO MG SP PR SC RS
-200 400 600 800
1.000 1.200 1.400 1.600
Cotton Planted Area ('000 ha)
BA MT MS GO MG SP PR SC RS
-
1.000
2.000
3.000
4.000
5.000
Wheat Planted Area ('000 ha)
MS SC SP MG GO BA MT
Interno57%
Exportação43%
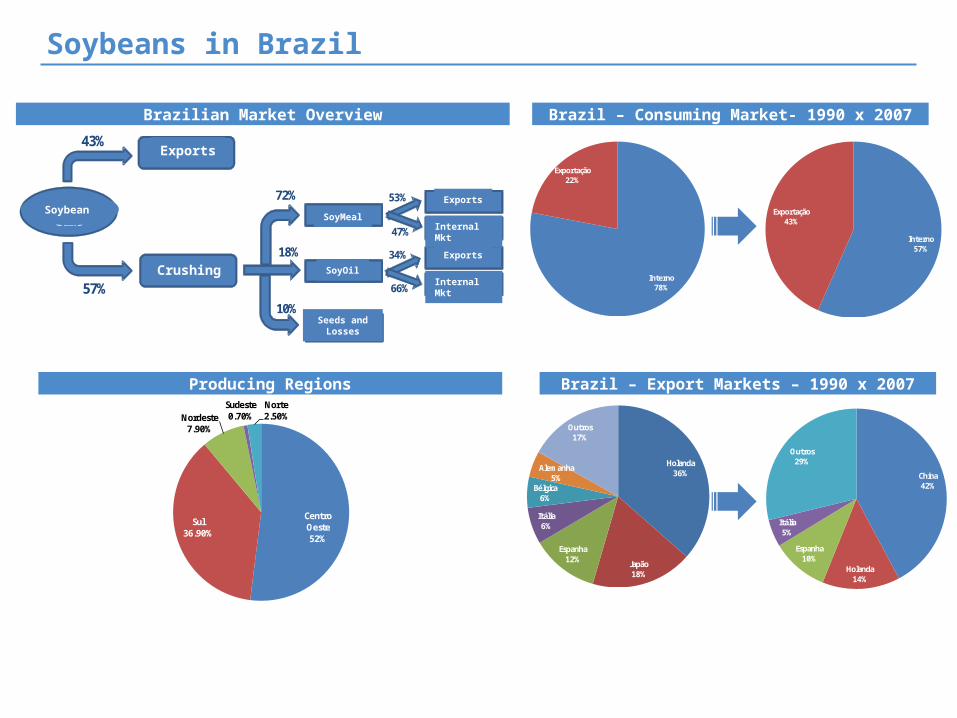
Soybeans in Brazil
Brazilian Market Overview Brazil – Consuming Market- 1990 x 2007
Producing Regions
Soja em Grão
Exportação
Moagem
Farelo
Óleo
Perda e Sementes
Exportação
Mercado Interno
Exportação
Mercado Interno
43%
57%10%
18%
72% 53%
47%
34%
66%
Centro Oeste52%
Sul36.90%
Nordeste7.90%
Sudeste0.70%
Norte2.50%
Interno78%
Exportação22%
Holanda36%
Japão18%
Espanha12%
Itália6%
Bélgica6%
Alemanha5%
Outros17%
China42%
Holanda14%
Espanha10%
Itália5%
Outros29%
Brazil – Export Markets – 1990 x 2007
Exports
Soybean
Crushing
SoyMeal
SoyOil
Seeds and Losses
Exports
Internal Mkt
Exports
Internal Mkt

17
Brazilian States Risk Reward Analisys
Historical Data
Different Risk and Risk x Reward relationships
10
Y W
ors
t G
ross
Ma
rgin
0%
5%
10%
15%
20%
25%
30%
35%
0% 5% 10% 15% 20% 25% 30%
RS
GO
MS
MAPR
GOMT
MAPR
-70%
-60%
-50%
-40%
-30%
-20%
-10%
0%
10%
GO MS MT PR RS MA
10
Y Y
ield
Vo
latil
ity
Gross Margin
Too Risky
Best Risk x Reward
Good Risk x Reward
Hard to Scale Up
Good Risk x Reward
Lowest Risk and Margin

18
Los Grobo: LatAm Agribusiness Preeminent Agriculture Company
+
+
+
+
+
Sizeable and Diversified LatAm Player
One-Stop-Shop
Network Model
Superior Productivity and Efficiency
Proven Track Record with Strength Financials
Sponsors & Fully Aligned Management Team With Strong
Execution Capacity
Structured and scalable growth platform with secured
access to relevant grain production/origination
… leading to a highly synergistic business to maximize value creation throughout the Agribusiness Value Chain
Antonio Oliva [email protected]+55 62 3018-2700
Gustavo [email protected]+55 21 2554-1300
Contacts


