

Airport of the Future
Public Policy View
Hans Mohrmann
March 30th, 2006
5th International Seminar on Airport Planning

Rank Country Population GDP/capita GDP
1 United States 296 $41,800 $12,361,686,801,200
2 European Union 457 $25,000 $11,423,831,450,000
3 China 1,306 $6,200 $8,099,145,634,400
4 Japan 127 $30,400 $3,873,484,217,600
5 India 1,080 $3,400 $3,672,898,919,200
6 Germany 82 $29,700 $2,448,212,283,000
7 United Kingdom 60 $30,900 $1,867,641,021,300
8 France 61 $29,900 $1,813,619,722,200
9 Italy 58 $28,300 $1,644,315,833,900
10 Brazil 186 $8,500 $1,581,958,749,000
11 Russia 143 $10,700 $1,534,597,306,300
12 Canada 33 $32,800 $1,076,005,344,800
13 Mexico 106 $10,000 $1,062,029,030,000
14 Spain 40 $25,100 $1,012,570,696,200
15 Korea, South 49 $20,300 $987,405,621,300
16 Indonesia 242 $3,700 $895,303,352,300
17 Australia 20 $32,000 $642,893,984,000
18 Taiwan 23 $26,700 $611,280,052,800
19 Iran 68 $8,100 $550,944,666,000
20 Turkey 70 $7,900 $550,318,416,100
21 Argentina 40 $13,600 $537,716,024,800
22 Thailand 64 $8,300 $532,739,666,600
23 South Africa 44 $11,900 $527,695,218,400
24 Netherlands 16 $30,500 $500,428,475,500
25 Poland 39 $12,700 $489,686,396,800


Ongoing Urbanization 80%

RankPopulation of city (proper)
Population of metropolitan
area
Percentage foreign born [4]
Cost of living [5]
Metro systems by annual passenger ridership
Airports by annual
passenger traffic
Number of skyscrapers
[6]
Number of billionaires [7]
1 Shanghai Tokyo Miami Tokyo Moscow Atlanta Hong Kong London
2 Mumbai Mexico City Toronto Osaka Tokyo Chicago New York CityNew York City
3 Karachi New York City Los Angeles London Paris London Singapore Moscow
4 Buenos Aires Mumbai Vancouver Moscow Seoul Tokyo São Paulo Geneva
5 Delhi Sao Paulo New York City Seoul Mexico City Los Angeles Seoul Los Angeles
6 Manila Delhi Singapore Geneva New York City Dallas Tokyo Hong Kong
7 Moscow Calcutta Sydney Zürich Osaka Paris IstanbulSan Francisco
8 Seoul Buenos Aires Abidjan Copenhagen London Frankfurt Rio de Janeiro Paris
9 São Paulo Jakarta London Hong Kong Hong Kong Philadelphia Toronto Tokyo
10 Istanbul Shanghai Paris Oslo St.Petersburg Las Vegas Buenos Aires Chicago
Urban Metropolis Nodes - Global City Regions (*) …
Source Mercer
Source Expedia
(*) Prof. Gerlach Cerfontaine

EU / NL Population Growth 1993 - 2005
Source: Eurostat
NL Slow Down?
EU Acceleration?

Netherlands: + 3,5%
Poland : +3%
Aging Population 1993 – 2005

Hungary
Bulgaria
Poland
Lithuania
Latvia
Estonia
Source: Eurostat
“New” Europe Population Growth 2000 -2005

Ongoing Urbanization in the Netherlands 1999–2004
5 % occurred within the existing urban footprint; 95 % occurred by enlargement.
Growth occurred in Urban aera’s of s Noord-Holland and Zuid-Holland
In Limburg 1999- 2004 experienced an absolute decrease in population

Location: Closer to work ?
Preferred Mode: Car Work Distance: 20 KM
Prof. Gaudry Univ. Montreal quote French stats: constant 30 minute travel time since 1800
Average Commute: 30 minutes

Airport Centreof
Delta Metropolis

Evolution of a transportation facility:Grand Central New York
• Grand Central at the edge of the city • GC earned revenues by selling Air Rights to developers

• Beginning: facilitating traffic / passengers• Today: a social meeting place, shops, restaurants, bars….and transportation
Evolution of a transportation facility:Grand Central New York

Evolution of a transportation facility:Another Railway Station? (IV)

Concentrating in larger Metropolis
0
10
20
30
40
50
60
70
80
ACI 2004
ACI 1994
Mil
lio
n A
nn
ual
Pas
sen
ger
s
Average growth: 18,5 MAP
Average growth: 3,6 MAP Average growth:
1,2 MAP

Maximize Value under Urban Tsunami
Infra Driven Value Driven
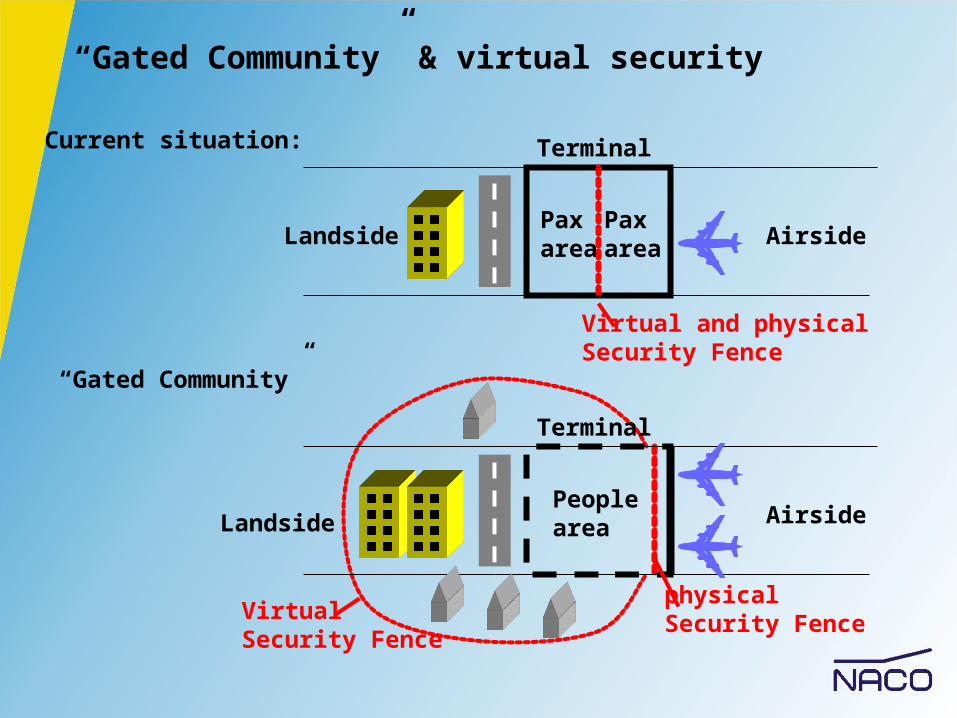
“Gated Community” & virtual security
Landside Airside
TerminalCurrent situation:
Pax area
Pax area
Virtual and physical Security Fence
Landside Airside
Terminal
“Gated Community”
People area
physical Security FenceVirtual
Security Fence

A new Airport Definition:
a high mobility & 24 h services placea social meeting & gathering placea gated communitya prime AAA+ locationa Living City.
Great Skies!My Penthouse has an Airport…
Yours? Ah, I see …an old one with a Golf Course!
Great Skies!My Penthouse has an Airport…
Yours? Ah, I see …an old one with a Golf Course!
Elzenhof Park City ?

Conclusions:
1. Urbanization is ongoing in industrialized world2. Global Metropolis are specialized nodes in a global
network of City Regions 3. Urbanization = City Tsunami for airports 4. Role and character airport changes with Global City
Regions integration5. City Integration requires maximization of landside6. Airport bizz models evolve:
Infra => Bizz => Real Estate

Thank You!


