
1
Altimetry Applications to Transboundary River Basin Management
Elizabeth A. Clark(1), Sylvain Biancamaria(2), Faisal Hossain(1), Jean-François Crétaux(3),
and Dennis P. Lettenmaier(1)
1Civil and Environmental Engineering, University of Washington, Box 352700, Seattle, WA
98195, U.S.A., Emails: [email protected], [email protected], [email protected] 2CNRS /LEGOS, 14 avenue Édouard Belin, 31400 Toulouse, France, Email:
[email protected] 3CNES /LEGOS, 18 avenue Édouard Belin, 31401 Toulouse Cédex 9, France,
Email: [email protected]
For the Springer Book on INLAND WATER ALTIMETRY
Editors: J. Benveniste, S. Vignudelli, A. Kostianoy
Corresponding Author:
Dennis P. Lettenmaier

2
Table of Contents
1. Introduction
2. Advances in Satellite Altimetry
3. Ganges-Brahmaputra-Meghna Basins
4. Indus Basin
5. Niger Basin
6. Conclusions
Keywords: transboundary river, river management, altimetry, flood forecasting, hydrologic
modeling
Abbreviations
ABN L’Autorité du bassin du Niger (Niger Basin Authority)
CNES Centre National d’Études Spatiales
CSA Canadian Space Agency
Envisat Environmental Satellite
ERS-2 European Remote Sensing Satellite-2
ESA European Space Agency
EUMETSAT European Organisation for the Exploitation of Meteorological Satellites
FFWC Flood Forecasting and Warning Center
GBM Ganges-Brahmaputra-Meghna
GFO Geosat Follow-On
GMES Global Monitoring for Environment and Security
GOHS Geodesy, Oceanography and Hydrology from Space
HEC-RAS Hydrologic Engineering Center-River Analysis System
IAHS International Association of Hydrological Sciences
HYCOS Hydrological Cycle Observing System
ISRO Indian Space Research Organisation
3
IWM Institute of Water Modeling
Jason-1/2 Joint Altimetry Satellite Oceanography Network-1/2
JERS-1 Japanese Earth Resources Satellite-1 KaRIN Ka-band Radar Interferometer
LEGOS Laboratoire d’Études en Géophysique et Océanographie Spatiales
MODIS Moderate Resolution Imaging Spectroradiometer
NASA National Aeronautics and Space Administration
NOAA National Oceanic and Atmospheric Administration
Poseidon Positioning, Ocean, Solid Earth, Ice Dynamics, Orbital Navigator
RMSE Root Mean Square Error
SAR Synthetic Aperture Radar
SARAL Satellite with ARGOS and AltiKa
SRTM Shuttle Radar Topography Mission
SWOT Surface Water and Ocean Topography
TFDD Transboundary Freshwater Dispute Database
TOPEX TOPography Experiment
T/P TOPEX/Poseidon
UNECA United Nations Economic Commission for Africa
UNEP United Nations Environment Programme
USDA United States Department of Agriculture
WCD World Commission on Dams
1. Introduction
In order to meet basic human needs for freshwater, accurate estimates of temporal and
spatial variations in river discharge, as well as the water stored in lakes, wetlands, and manmade
reservoirs, are essential. However, current in situ networks do not adequately observe these
variables globally, and prospects for their expansion are not promising (e.g., Shiklomanov et al.
2002; IAHS 2001; Stokstad 1999). Furthermore, many of the world’s largest river basins, in
terms of discharge, contain vast wetlands that lack flow convergence, thus leading to highly
uncertain estimates of their discharge, and contributing to uncertainty in the most basic quantities
4
in the global water balance, such as the runoff from the continents to the oceans.
Physical limitations on in situ networks are further exacerbated by the hydro-politics of
transboundary rivers, i.e., those rivers that cross one or more international boundaries. Most
political boundaries do not match the topographically-determined boundaries of river basins. As
a result, more than 260 major river systems worldwide cross international political boundaries
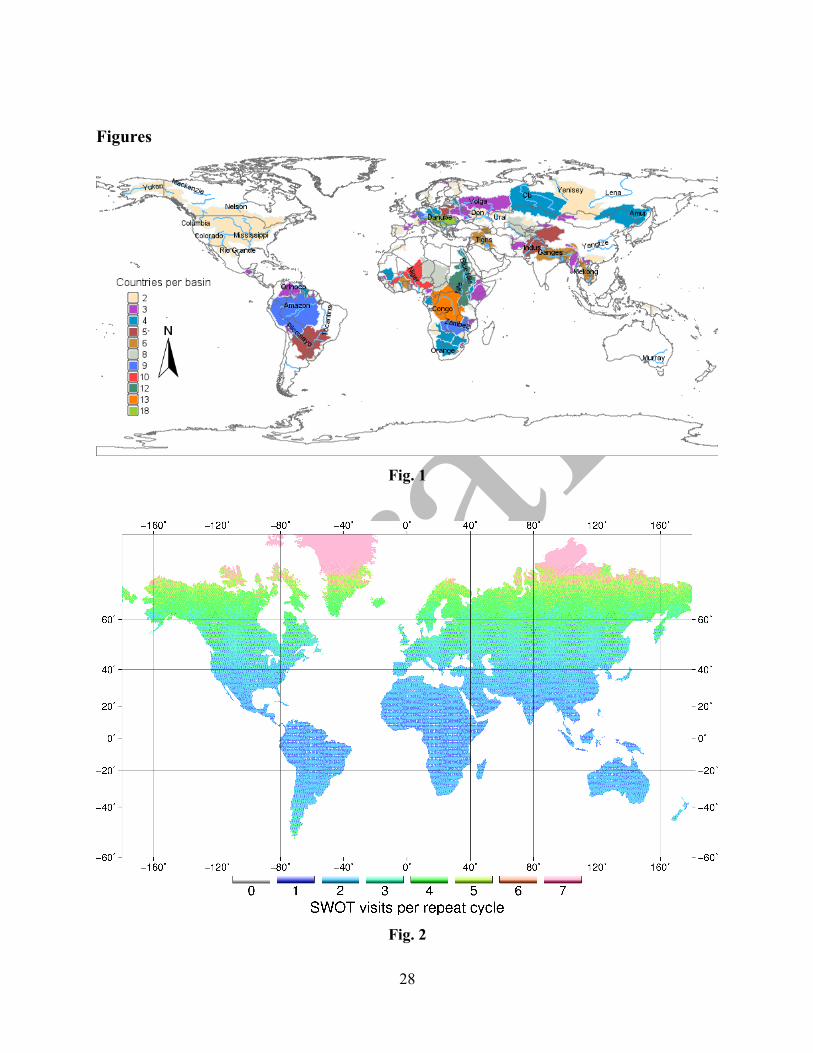
(Wolf et al., 1999; Fig. 1). Today, transboundary rivers account for more than 50% of global
streamflow, and, based on 2007 estimates, more than 40% of the world’s population lives in
transboundary river basins (Wolf et al., 1999; Oregon State University, 2013; Oak Ridge
National Laboratory, 2008; U.S. Census Bureau, 2013). Water management activities in the
headwaters of transboundary river basins can have vital implications for water supply in other
nations in the downstream regions. The World Commission on Dams (WCD, 2000) reports that
there have been at least 45,000 large dams built since the 1930s worldwide. It is estimated that
half of the world’s major rivers have at least one dam somewhere within their drainage area
(WCD, 2000). With a changing climate and increasing water scarcity due to population growth
and economic development (Vörösmarty et al., 2005; Gleick, 2002), more reservoirs are likely to
be commissioned or maintained (rather than removed) in this century in order to secure reliable
supplies of fresh water for human use. Recent examples of constructed or planned reservoirs on
major transboundary rivers include the Gabcíkovo-Nagymaros Project built on the Danube River
by Slovakia (formerly Czechoslovakia) in Europe, the Southeast Anatolia Project or GAP
(Turkish acronym) plan in Turkey for reservoirs in the headwaters area of the Euphrates river in
Asia, and the Namibian plan to impound water from the Okavango River in Africa (De Villiers,
2000).

5
Fig. 1: Location of the world’s major rivers (blue lines labeled with river names) and
transboundary river basins (colored based on the number of countries that contain a portion of
the basin). Countries per basin and transboundary basin boundaries are a product of the
Transboundary Freshwater Dispute Database (TFDD), Department of Geosciences, Oregon State
University, updated to include Southern Sudan. Additional information about the TFDD can be
found at: http://www.transboundarywaters.orst.edu.
Historically, information about reservoir storage (or level) and releases has been
controlled by nations in which the reservoir and river reaches are located. Without adequate
treaties for transboundary cooperation for water resources management at operational time scales
(Balthrop and Hossain, 2010), the controlling nation has no legal obligation to share reservoir
storage and release information with downstream nations in a timely manner. This has made
forecasting water supply and flooding in some downstream nations a challenging task (Hossain
and Katiyar, 2006). Balthrop and Hossain (2010) and Bakker (2009) argue that even with bi-
lateral treaties and comprehensive ground networks among all riparian nations, the issue of water
resources monitoring and flood hazard warning will always remain fundamentally elusive.
2. Advances in Satellite Altimetry
Since the launch of Seasat in 1978, satellite altimetry has been used to monitor the
heights of the world’s oceans. Through a long heritage of altimetry (see chapter 1 by Benveniste,
this volume), the ability to measure heights over some large lakes, reservoirs, and rivers was
developed. Which water bodies are observed and at what frequency depends on the satellite
orbits, the instrument characteristics, and, over land, the size of the water bodies and their
surrounding topography (Crétaux and Birkett 2006; Calmant et al. 2008). At present, however,
observations of inland water bodies are generally limited to large water bodies. Satellite
observations are independent of political boundaries, in contrast to in situ networks, which are
primarily managed at the national scale. For this reason, satellite altimetry data are potentially
useful in the context of transboundary water issues, as a complement to existing in situ networks.
Satellite altimetry data could add valuable information for regions with no gages or for which
6
ground measurements are not shared or are unreliable, even given limitations due to the overpass
time frequency and coverage.
Current nadir altimeters provide one-dimensional measurements of water elevation along
the satellite ground tracks, which typically are separated by several hundred km. These
limitations are reduced somewhat during periods when multiple satellites have been in orbit. For
example, during the years 2002 to 2010 several radar altimeters were in orbit for overlapping
periods: TOPEX/Poseidon (TOPography Experiment/Positioning, Ocean, Solid Earth, Ice
Dynamics, Orbital Navigator) (T/P, 1992-2005), Jason-1 (2002-2011), Envisat (Environmental
Satellite) (2002-2012), Geosat Follow-On (GFO, 2002-2008) and Jason-2 (2008-present) (USDA
2014). Such nadir altimeter constellations make it possible to monitor a large number of lakes
and rivers with temporal sampling that is considerably improved relative to the pre-2002 period
for the largest inland water bodies. As a part of the capacity-building efforts of the European
Union’s new Copernicus program (formerly known as Global Monitoring for Environment and
Security, GMES), a panel of new satellites, dedicated to land monitoring from multispectral
sensor, Sentinel-2, and radar altimetry in dual Ku-C bands (12-18 GHz and 4-8 GHz
electromagnetic bands, respectively), Sentinel-3, has been planned for the next few years.
Sentinel-3 will be composed of a pair of satellites (Sentinel-3A and Sentinel-3B), with the first
launch expected between 2014 and 2015. In addition to the Sentinel series, early 2013, the
Centre National d’Études Spatiales (CNES) and Indian Space Research Organisation (ISRO)
launched the SARAL (Satellite with ARGOS and AltiKa)/AltiKa mission, which is the first
altimeter operating in Ka-band, the portion of the electromagnetic spectrum at 26.5-40 GHz. The
main advance of SARAL/AltiKa is a better spatial resolution than previous instruments due to
the radar signal’s smaller footprint, which allows better discrimination of water in small lakes
and reservoirs and in anastomosed rivers with a large number of small channels. In the future,
CNES, the European Organisation for the Exploitation of Meteorological Satellites
(EUMETSAT), the National Oceanic and Atmospheric Administration (NOAA) and the
National Aeronautics and Space Administration (NASA) will continue the Jason (Joint Altimetry
Satellite Oceanography Network) program, with the launch of the Jason-3 radar altimeter. More
information on upcoming satellite missions is included in chapter 6 (Benveniste, this volume).
Considered separately, these missions will not significantly alleviate the problem noted above of
sparse and infrequent crossings of inland water bodies, but taken together, in synergy with other
7
remote sensing techniques, like satellite imagery, they will enhance satellite altimetry’s role in
surveying and predicting the hydrological regime of the world’s major rivers, including the
transboundary ones. An important characteristic of these new missions for water management
purposes is that all but SARAL/AltiKa have been developed for use in an operational
framework.
Notwithstanding the development of the new nadir altimeters described above, coverage
in space and time of all but the largest inland water bodies remains problematic. Furthermore,
nadir altimeters provide information only about the water surface height, and not extent, both of
which are necessary for estimation of storage change, a critical variable for water management.
For this reason, a new satellite mission, the Surface Water and Ocean Topography (SWOT)
mission, is under development jointly by the U.S. (NASA) and France (CNES), with support
from Canada (Canadian Space Agency, CSA). SWOT is intended to monitor, over essentially all
land areas of the globe, the surface elevations and extents of water bodies with surface areas
larger than about 1 km2 during each satellite repeat period (22 days1). In addition, SWOT will
provide unprecedented spatial resolution in the open ocean and near coastal waters that will help
to resolve ocean circulation anomalies (eddies) at much smaller spatial scales than is possible
with nadir altimeters. The result over the global land areas will be unprecedented spatial
resolution for monitoring of inland water bodies, and two-dimensional maps (as contrasted with
tracks from nadir altimeters) of water surface elevations. Methods have been proposed to
estimate streamflow based on SWOT observations of water surface elevation, water surface
slope, and river width; these approaches include data assimilation into hydrodynamics models,
an optimization based on continuity and Manning’s equation, and properties implicit to
downstream hydraulic geometry (e.g., Andreadis et al. 2007; Biancamaria et al. 2011a; Durand et
al. 2014; Yoon et al. 2012; and chapter 4 by Durand et al., this volume). At the equator, most
water bodies will be observed two times per 22 days (the satellite repeat period), but
observations will be much more frequent at high latitudes (Fig. 2). SWOT will be the first
satellite mission dedicated to the observation of both the oceanic and continental water surfaces.
SWOT is currently planned for launch around 2020. 1 Although the planned orbit at the time that this document was prepared had a 22-day repeat period, the project has since decided to use a 21-day repeat period. All figures presented here are based on a 22-day repeat period; the implications of the difference in planned orbit for most of the results shown herein are modest. Also note that the exact location of each satellite swath will depend on the timing of launch.

8
Fig. 2: Number of SWOT observations per 22-day repeat period over the global land areas.
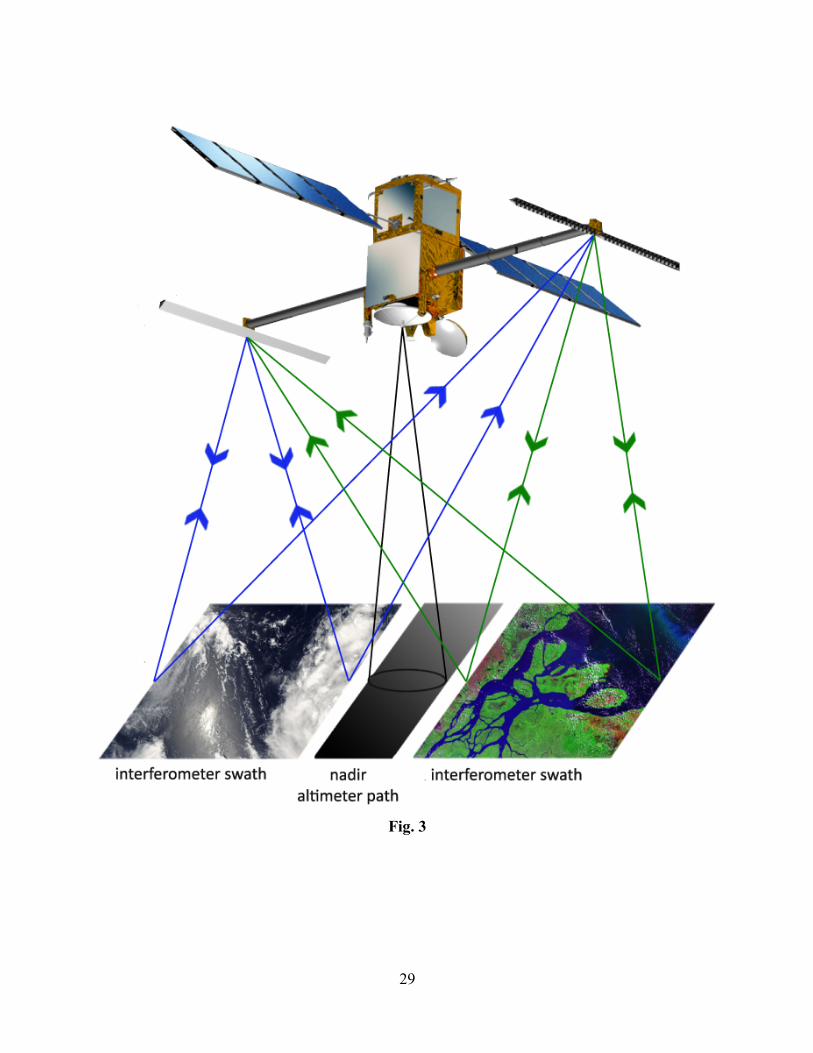
The main SWOT payload will be a Ka-band wide swath radar interferometer (KaRIN;
Ka-band Radar Interferometer). Two antennas, separated by a 10-m boom will result in two 50-
km-wide ground swaths on each side of nadir, separated by a 20 km gap (Fig. 3). The area
between the two swaths may be partially covered by a separate nadir altimeter. KaRIN’s intrinsic
pixel resolution will vary from 70 m (near range) to 10 m (far range) across-track and will be at
best around 5 m along-track (this value will be a function of decorrelation time). Temporal
decorrelation comes from changes of the observed surface between consecutive observation
times. The Synthetic Aperture processing technique uses multiple “looks” at a given point on the
surface to improve the image’s resolution, and as a result, if the surface changes very quickly
(i.e., short decorrelation time due to a choppy water surface), the image resolution will be
coarser. In the end, the pixels will be averaged which will result, for each 1 km2 in surface water
area, in accuracy of at least 10 cm in water surface elevation (Rodríguez 2012). The relative error
in surface extent using the SWOT water mask will be less than 20% of the total water body area
(Rodríguez 2012). Table 1 summarizes SWOT science requirements for hydrology. At present,
the nominal SWOT orbit is a 78° inclination and 22-day repeat period, which implies that the
KaRIN instrument will observe at least 90% of the global land area between 78°N/S and that the
satellite will fly over the same point every 22 days. However, considering the total 140-km swath
width, many locations will be seen at least twice during one repeat period (Fig. 2).
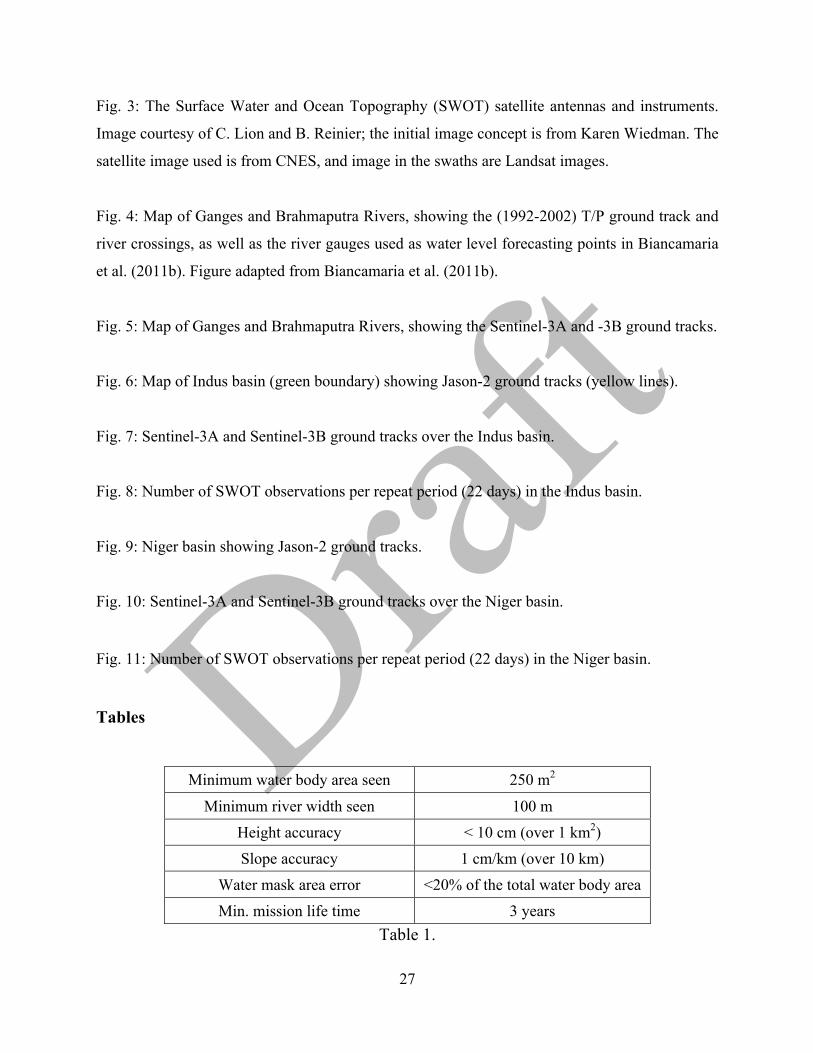
Fig. 3: The Surface Water and Ocean Topography (SWOT) satellite antennas and instruments.
Image courtesy of C. Lion and B. Reinier; the initial image concept is from Karen Wiedman. The
satellite image used is from CNES, and image in the swaths are Landsat images.
Table 1: SWOT hydrology science requirements (for more details, see Rodríguez 2012).
The new measurements that SWOT will provide have potentially far-reaching
implications for transboundary rivers, as the observations are not constrained by international
9
boundaries. The major questions motivated by the SWOT mission in the context of
transboundary rivers are:
• How will globally and freely available reservoir storage, streamflow, and water level
information produced by SWOT affect the management of water resources in a
changing climate?
• Will this change in data availability help to resolve what are in some cases now
fundamentally intractable problems, such as real-time forecasting of transboundary
streamflow, management of transboundary water resources in a basin-wide manner,
and equitable allocation of water resources for riparian nations?
• Will nations in transboundary river basins become more independent and sovereign in
their ability to forecast and manage water resources flowing from and to other
nations?
• Will the increased transparency of information increase trust among nations for
greater cooperation on transboundary water issues?
Some recent studies suggest that there is a direct relationship between the institutional capacity
of nations to gather surface water information and the effectiveness of operational water
resources management, particularly in the area of transboundary flooding (Bakker 2009).
In the remainder of this chapter, we explore three transboundary case studies in Asia and
Africa to show how satellite altimetry (current generation nadir altimeters and the proposed
SWOT swath altimeter) can potentially overcome the limitations of current in situ observations
in the context of transboundary rivers.2 Our discussion focuses primarily on altimetric
measurements of river levels, though it is worth noting that important benefits are anticipated
from the remote sensing of reservoir storage change as well. In the first case, the Ganges-
Brahmaputra-Meghna (GBM) basins, the potential for improved flood forecasting in Bangladesh
based on currently available altimetry data has been demonstrated in an operational context
(Hossain et al. 2013; Papa et al. 2012), and swath altimetry from the Shuttle Radar Topography
Mission (SRTM) has been used to estimate streamflow (Jung et al. 2010; Woldemichael et al.
2010). In the second case, a single currently operational altimeter, Jason-2, is able to provide
2 The Amazon River basin is an excellent example of a transboundary river basin in which altimetry observations have shown a great deal of potential. However, insofar as chapter 11 (Calmant et al., this volume), is dedicated to inland altimetry applications in the Amazon River basin, we do not discuss the Amazon in this chapter.
10
sparse observations of the Indus River; however, it is expected that new missions like Sentinel-
3A/-3B and SWOT will provide valuable information about the effects of the construction and
operation of planned reservoirs in the basin’s headwaters. In the third case, the countries of the
Niger River basin support joint management and planning; however, a lack of infrastructure for
monitoring and transmitting in situ hydrologic data limits these efforts. Studies suggest that
altimetry data can supplement the existing in situ observations to and will lead to improved
modeling and predictions in the Niger basin (e.g., Pedinotti et al. 2012). In the cases of the GBM
and the Niger River, existing altimetry data have been used to complement in situ monitoring
networks to aid in water management in transboundary basins, and in all cases, further advances
are expected to result from even greater data availability from the upcoming SWOT mission.
3. Ganges-Brahmaputra-Meghna Basins
The GBM river basins are primarily located in India (62% of basin area), China (20%),
Nepal (9%), and Bangladesh (7%) (Oregon State University 2013). Because Bangladesh lies at
the mouth of this massive river system, it receives more than 90% of its surface water from
nations upstream in the GBM (Nishat and Rahman 2009). Bangladesh is particularly susceptible
to flooding because floodplains comprise approximately 80% of its land area; furthermore,
flooding in Bangladesh is expected to increase due to sea level rise associated with climate
change (Ahmad and Ahmed 2003). The hydroclimatology of the GBM is strongly driven by the
June-October monsoon, which produces nearly 85% of Bangladesh’s rainfall; however, the most
intense floods occur when flood peaks travel across national boundaries through two or more
rivers simultaneously (Ahmad and Ahmed 2003). Because data is effectively not shared between
India, which has the largest contributing drainage area, and Bangladesh, the Bangladesh
government has very little advance notice of likely flood conditions. Furthermore, several cases
of dam construction further complicate the ability to predict flood conditions because dams mean
that river flows are dependent not only on precipitation, which can be estimated from existing
satellites, but also on human decisions. Some examples of basin “replumbing” include the
recently revived mega-project concept by the Indian Government called the Indian River Linking
Project. This project proposes to divert surface water from humid northern regions to the arid
southern regions through a network of canals and dams connecting the rivers of Brahmaputra and
11
Ganges (Misra et al. 2007). Some other pertinent examples are the Farakka barrage (on Ganges
river; Mirza 1998), Gozaldoba Barrage (on Teesta River – a tributary of Brahmaputra; Nishat
and Faisal 2000), and the now-shelved Tipaimukh Dam (on the Meghna River in India; Sinha
1995).
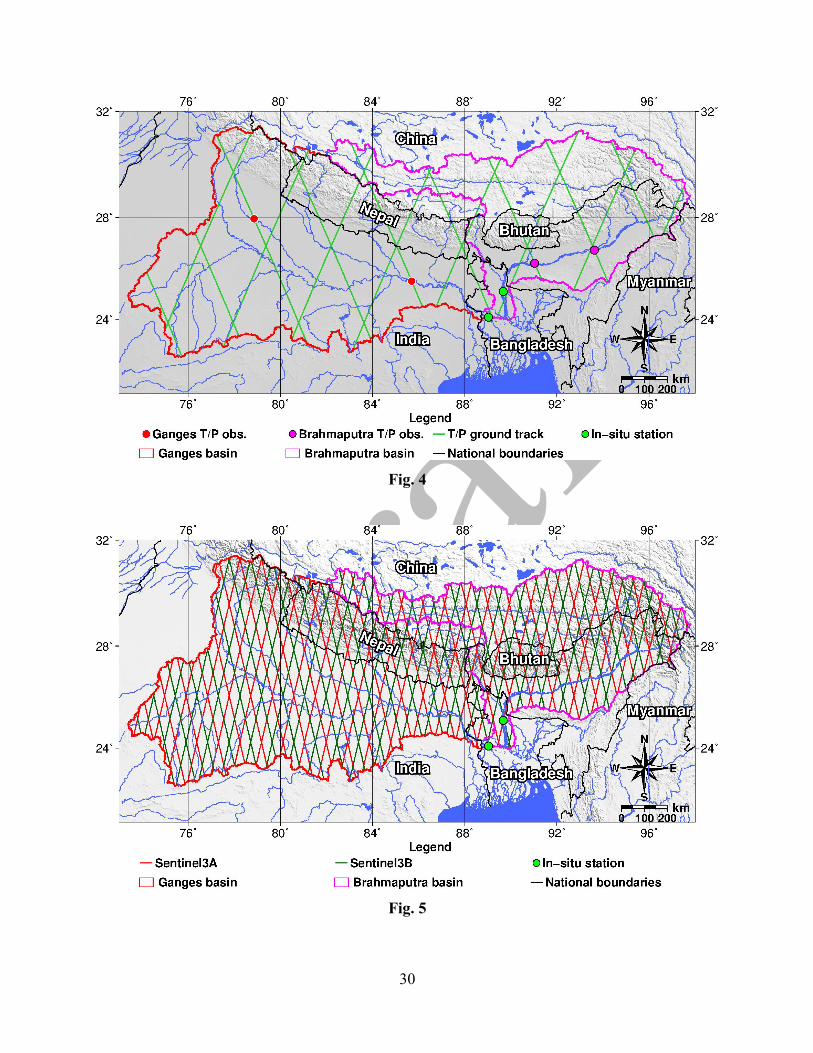
On the Ganges and Brahmaputra Rivers, flood waves propagate from the uplands
downstream to Bangladesh over the course of several days. Nadir altimetry has the potential to
forecast water levels in Bangladesh based on satellite crossings of the river further upstream
(Fig. 4). Biancamaria et al. (2011b) showed that because most of the streamflow is generated in
the upper reaches of the Ganges and Brahmaputra Rivers, water levels are highly correlated
along the lower reaches of the rivers. They found using T/P altimetry, forecasts of water level
anomalies at 5-day and 10-day lead times are possible with Root Mean Square Error (RMSE) of
around 0.40 m and 0.60-0.80 m, respectively, depending on which virtual stations were used.
Higher RMSE values were estimated for the Ganges River because correlations on the Ganges
are degraded somewhat by local and short-term variations in water level due to its lower mean
annual flow. They also identified options for constraining forecast errors and extending forecast
lead times by including information from weather, hydrological, and hydrodynamic forecasts, as
well as by adding data from multiple altimeters. Over the same river basin, Papa et al. (2012)
used a combination of T/P, ERS-2 (European Remote Sensing Satellite-2), Envisat, and near
real-time Jason-2 data to reconstruct long-term time series of river discharge in the delta, using
past in situ data (over the Ganges and the Brahmaputra). The river discharge estimates were then
used as inputs to model ocean circulation in the Bay of Bengal, which is important in improved
understanding of salinity in the Bay of Bengal, which is linked to regional climate variability.
Fig. 4: Map of Ganges and Brahmaputra Rivers, showing the (1992-2002) T/P ground track and
river crossings, as well as the river gauges used as water level forecasting points in Biancamaria
et al. (2011b). Figure adapted from Biancamaria et al. (2011b).
The approach of Biancamaria et al. (2011b) was extended by Hossain et al. (2013), who
tested an operational forecasting system based on Jason-2 altimetry data on the Ganges-
Brahmaputra Rivers. They tested forecasting capabilities at 17 locations for which the Flood
Forecasting and Warning Center (FFWC) of the Bangladesh government issues official water
12
level forecasts at a 3-day lead time. In this system, Hossain et al. (2013) used historic Jason-2
river crossings (virtual stations) to develop rating curves between in situ measurements of
discharge at Hardinge Bridge and Bahadurabad and water levels at the virtual stations upstream.
For each day, a 5-day forecast of discharge at these two sites was developed from the most recent
Jason-2 observations. These discharge forecasts provided the upstream boundary conditions to
the 1-D hydrodynamic model, Hydrologic Engineering Center-River Analysis System (HEC-
RAS, version 4.0; developed at the Hydrologic Engineering Center, a division of the Institute of
Water Resources at the U.S. Army Corps of Engineers;
http://www.hec.usace.army.mil/software/hec-ras/), that was implemented in Bangladesh by
Siddique-E-Akbor et al. (2011). The HEC-RAS hydrodynamic model was used to propagate the
5-day lead forecast discharge to the 17 FFWC sites.
The forecast water levels from the Jason-2 5-day forecast were compared to the “5-day
later” nowcast water levels, which were estimated by using in situ observations as boundary
conditions to the HEC-RAS model. Hossain et al. (2013) found that the 5-day forecasts were
able to capture the same trends and peak events as the nowcasts. In fact, because the HEC-RAS
model tended to overestimate water levels and the Jason-2 forecast tended to underestimate
discharge at Hardinge Bridge and Bahadurabad, the 5-day forecasts slightly better matched in
situ river level data.
The results of this proof-of-concept study were tested in real-time operational water level
forecasting, performed by the staff of the Institute of Water Modeling (IWM), Dhaka,
Bangladesh. Over the period from 1 Aug. 2012 to 20 Aug. 2012, average forecast errors,
compared to in situ observed water levels at Bahadurabad and Sirajganj on the Brahmaputra
River and Hardinge Bridge on the Ganges River, ranged from -0.4 m to 0.4 m. The skill of the 5-
day Jason-2 based forecasts was more accurate during this period than the standard 5-day later
nowcast (Hossain et al. 2013). Interested readers wishing to access this real-time operational
flood forecasting system that is managed entirely by a stakeholder agency are referred to
http://apps.geoportal.icimod.org/BDFloodforecasting and http://apps.iwmbd.com/satfor.
Fig. 5 shows Sentinel-3A/-3B ground tracks on the Ganges-Brahmaputra basins, showing
improved coverage from the constellation of these nadir altimeters compared to a single
altimeter, like T/P or Jason-2. The distance between ascending (or descending) tracks for T/P and
Jason-2 is 315 km at the equator. The distance between two ascending (or descending) tracks for
13
one of the Sentinel-3 satellite’s is 104 km at the equator; however, the distance between one
ascending (or descending) track of Sentinel-3A and the adjacent ascending (or descending) track
of Sentinel-3B is only 52 km. One result of the improved coverage of Sentinel-3 is that there will
be more virtual stations (river crossings) at a wider range of distances from the in situ stations.
This should improve forecasting over a range of lead times. Also, when a virtual station has a
temporal gap in its data record, which could result from errors in the tropospheric correction,
retracking algorithm, or instrument errors (Biancamaria et al. 2011b), the higher density of
virtual stations increases the likelihood of a neighboring station having a useable observation
sooner than the next overpass.
Fig. 5: Map of Ganges and Brahmaputra Rivers, showing the Sentinel-3A and -3B ground tracks.
While nadir altimetry as exploited by Hossain et al. (2013) enables a robust approach to
operational flood forecasting in this hydropolitical region, further opportunities are expected with
the advent of swath-based satellite altimetry. Jung et al. (2010) and Woldemichael et al. (2010)
demonstrate the application of SRTM-derived elevations and water surface slope, Landsat-
derived water mask, and in situ measurements of bathymetry to estimate instantaneous discharge
along the Brahmaputra River. Jung et al. (2010) used Manning’s equation with a constant
roughness coefficient of 0.025 and were able to estimate discharge with an error of only 2.3%,
relative to in situ gage discharge, by averaging satellite-based discharge estimates at four cross
sections within 24-km flow distance of the gage. Upon closer examination, Woldemichael et al.
(2010) identified three distinct outliers in these estimates along the river length. They suggested
two primary sources of error: 1) errors in the water mask and 2) errors in the assumed Manning’s
roughness coefficient.
In the approach employed by Jung et al. (2010), the water mask from Landsat is used to
identify the SRTM heights that are attributable to water for the purposes of slope estimation and
also—in combination with the in situ bathymetry data—for the calculation of cross-sectional
area and hydraulic radius. Woldemichael et al. (2010) addressed the water mask errors by testing
a set of data filtering schemes to enforce a relatively uniform water level along each channel
cross section; they find that filtering for the minimum water level across a transect produces the
best estimates of discharge. Because SWOT’s high incidence angle enhances the return signal
14
from water surfaces, SWOT will be able to provide concurrent measurements of water surface
elevation and a water mask, which should minimize these types of classification errors.
Woldemichael et al. (2010) also note that calibration of Manning’s roughness with gage
discharge, where available, can improve discharge estimates along a given reach.
An alternative forecasting method, which is more complex and computationally intensive
than those discussed above, is to assimilate altimetric observations into a hydrology or hydraulic
model. For example, Michailovsky et al. (2013) developed and applied an Ensemble Kalman
Filter to adjust predictions from a routing model of the main reach of the Brahmaputra River
(forced with a calibrated rainfall/runoff model) by assimilating Envisat observations, over the
2008-2010 period. With this method, the discharge Nash-Sutcliff coefficient increased from 0.78
(no assimilation) to 0.84 (with assimilation) and discharge RMSE improved by over 15% in the
first 4 days after assimilation of altimetric observations. This method seems promising, but it has
not yet been used operationally for transboundary basins. More discussion of assimilation of
altimetry data is included in chapter 15 by Bauer-Gotwein et al., this volume.
4. Indus Basin
The Indus basin (Fig. 6) drains 1,140,000 km2 and is shared among Pakistan (53% of the
watershed), India (34%), China (7%) and Afghanistan (6%) (Wolf et al. 1999; Oregon State
University 2013). More than 300 million people live in the basin, mainly in Pakistan (190
million) and India (110 million) (Oregon State University 2013; Oak Ridge National Laboratory
2008). In 1960, India and Pakistan signed the Indus Waters Treaty, which defined the minimum
amount of water that should be split between the two countries. At the same time, the Permanent
Indus Commission was established, and 80% of the flow of the Indus was allocated to Pakistan
(Bagla 2010).
Fig. 6: Map of Indus basin (green boundary) showing Jason-2 ground tracks (yellow lines).
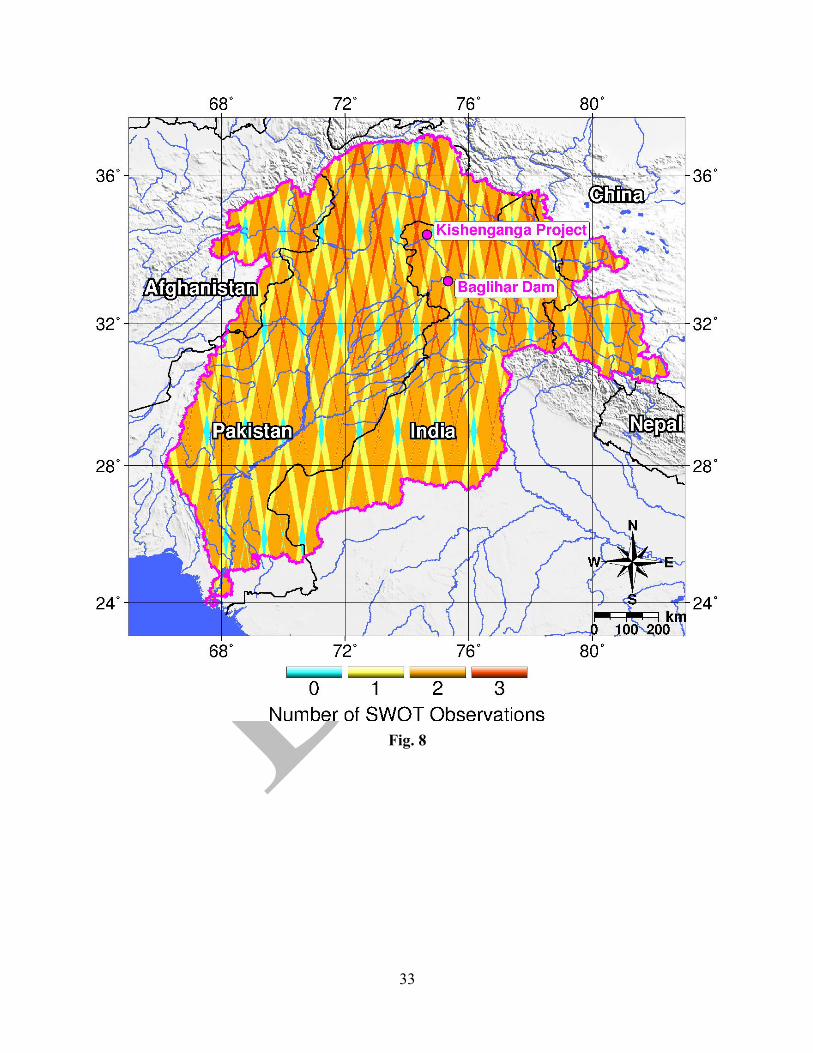
In 2005, India began to build the Baglihar Dam (southern magenta dot on Fig. 6) on the
Chenab River (Bagla 2010). Even though the Indus Waters Treaty gives full control of the
Chenab River to Pakistan, it also allows India to build run-of-river power plants, as long as some
15
criteria are met. Pakistan has claimed that the Baglihar Dam does not fulfill these criteria. In
2007, an independent expert appointed by the Permanent Indus Commission recognized India’s
right to build the dam, but asked for some design changes. However, this decision did not
completely resolve the issue. The timing of the filling (in August 2008) of the reservoir has been
criticized by Pakistan, as it significantly decreased the flow of the Chenab River during the
period of reservoir filling and thus negatively impacted farmers in Pakistan. According to India,
the initial filling date of the Baglihar Dam is in agreement with the Indus Waters Treaty (Bagla
2010).
More recently, in 2009, India began construction of a dam on the Kishenganga River
(northern magenta dot in Fig. 6), a tributary of the Jhelum River (Bagla 2010). However, the
management of the Jhelum River is entirely assigned to Pakistan according to the Indus Waters
Treaty. For this reason, Pakistan has expressed concerns about the impact of the Jhelum
hydropower project on the river’s discharge. Pakistan’s claims have been rejected by India, and
the issue was brought before the International Court of Arbitration. On Feb. 18, 2013, a Partial
Award was rendered, which specifies that India may operate Kishenganga Hydro-Electric Project
as a Run-of-River plant but may not reduce levels in the reservoir below its dead storage level
(Permanent Court of Arbitration 2013).
The green lines on Fig. 6 correspond to Jason-2 satellite ground tracks, and show that
current nadir altimeters can only provide sparse measurements of water elevations along the river
network. In contrast, Sentinel-3 will have a better coverage (Fig. 7) providing measurements in
near real-time. It will therefore allow estimation of the impact of the Baglihar and Jhelum dams
on the river flows in real time, with data that have a homogeneous accuracy over the entire basin
and that cannot be considered as biased toward one or the other of the riparian countries. As for
SWOT, it will measure both elevation and surface area (hence volume) changes of each
reservoir, as well as water elevation and slope variations for the Indus and its tributaries both in
India and in Pakistan. Fig. 8 shows the number of SWOT observations over the study region per
repeat period (i.e., during a 22 days time span). According to satellite images on Google Earth,
widths of the Chenab and Kishenganga Rivers were between 40 m and 50 m in October 2003,
which was during the low flow period and before the filling of the Baglihar Reservoir. Thus,
SWOT might be able to provide critical information, even if not in real time, that will allow
estimation of the discharge of these rivers during the high flow season (SWOT will require river

16
widths of 50-100 m to provide accurate estimates of river width, slope, and surface height,
critical variables for discharge estimation). The Baglihar Reservoir pondage volume (i.e., the live
storage for a run-of-river plant) necessary for operation should be around 16×106 m3 and the
maximum pondage should be around 32×106 m3, according to the independent expert appointed
by the Permanent Indus Commission (Lafitte 2007). Assuming an average depth of the order of
10 m, the surface area of the reservoir should be several km2 and thus should be “seen” by
SWOT.
Fig. 7: Sentinel-3A and Sentinel-3B ground tracks over the Indus basin.
Fig. 8: Number of SWOT observations per repeat period (22 days) in the Indus basin.
Because these reservoirs are located in a mountainous region (Fig. 6), some or even all
SWOT images of these reservoirs might be not usable because of the surrounding mountains,
which could “mask” the water surface (this effect is called layover). Layover is a geometric
distortion that occurs when the radar beam reaches the top of a tall feature before it reaches the
base. As a result, within the radar image, the slope of the mountain “lays over” the valley. It
depends on the instrument angle of observation, mountain heights, and water extent. This issue is
currently being studied at NASA and CNES. Another consideration is that the planned lifetime
of the SWOT mission is relatively short (nominally 3 years), and its revisit time (which could be
more than 10 days in some locations) might be problematic for some water management
applications.
5. Niger Basin
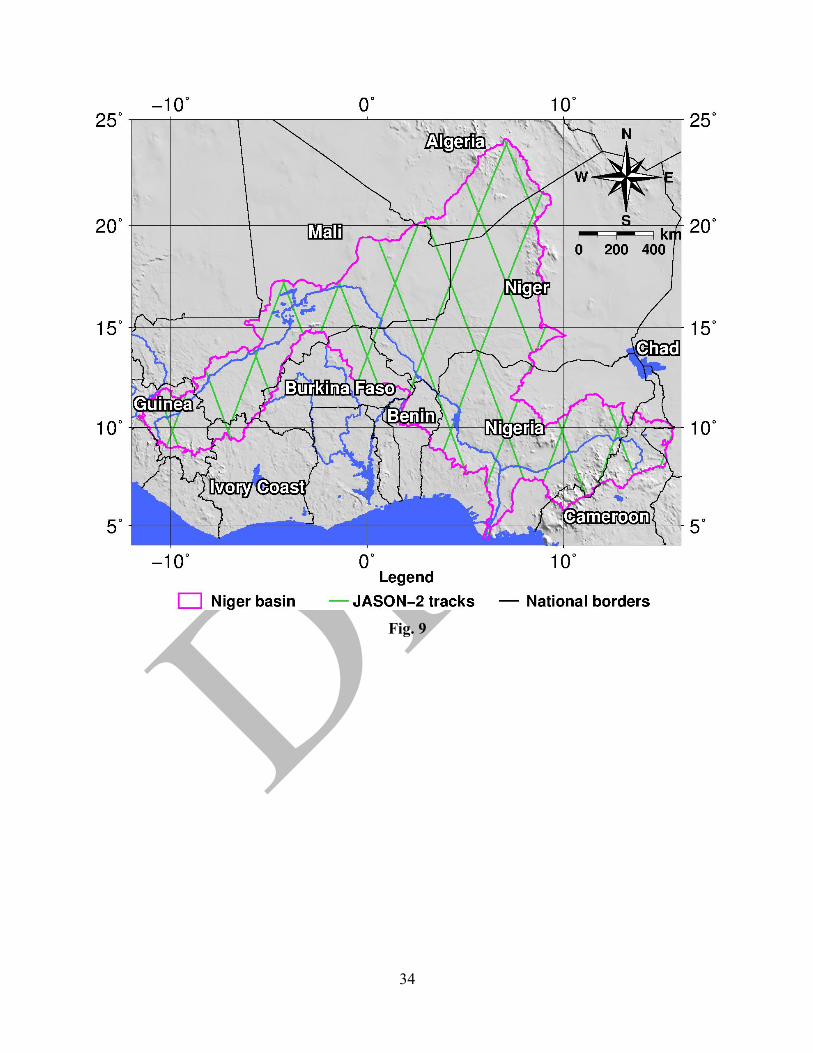
The Niger River basin located in West Africa is shared by 10 countries: Nigeria (28%),
Mali (25%), Niger (24%), Algeria (8%), Guinea (5%), Cameroon (4%), Burkina Faso (4%),
Benin (2%), Ivory Coast (1%) and Chad (1%) (Wolf et al. 1999 – updated 2012; Fig. 9). Around
100 million people live inside this basin, more than half of them (67 million) in Nigeria (UNEP
(United Nations Environment Programme) 2010). Most of the basin’s precipitation falls in the

17
southern part (Guinea and Nigeria). For example, Guinea represents 5% of the basin area, but
accounts for around 30% of the basin’s runoff (UNEP 2010). In the 1970s and 1980s, the Sahel
region was affected by severe droughts, which had devastating impacts on agricultural self-
sufficiency of the basin’s population.
Fig. 9: Niger basin showing Jason-2 ground tracks.
As in the case of Bangladesh, around 90% of the waters flowing into Niger comes from
upstream countries (Mali, Burkina Faso and Benin) (UNECA (United Nations Economic
Commission for Africa) 2000); however, there appears to be a greater political will for data
sharing in the Niger than the in the GBM basin. According to the Transboundary Freshwater
Dispute Database (Oregon State University 2013), countries in the Niger River basin signed 14
international water agreements during the post-colonial period, starting in the early 1960s. Two
of these focused on hydrologic monitoring and data, and one on cost-sharing. Efforts for
sustainable development and environmental conservation have been incorporated into more
recent agreements (Lautze et al. 2005). The Niger Basin Authority (L’Autorité du bassin du
Niger, ABN, http://www.abn.ne/) oversees river basin planning and collects data provided by its
member countries—Benin, Burkina Faso, Côte d’Ivoire, Guinea, Cameroon, Mali, Niger,
Nigeria, and Chad. Beginning in 1979, the “Hydroniger Project was designed to make real-time
hydrological forecasts that would be used to issue flood warnings, inform on the navigability and
to facilitate dam regulation in the member countries” (Grossmann 2009). Although 65 data
collection platforms in support of this effort were installed by 1987, the network began
deteriorating by 1988. Current efforts are underway to restore the observation network as part of
the Niger-HYCOS (Hydrological Cycle Observing System) Program. One of the most important
reasons that previous attempts to build and maintain an observation network and comprehensive
water management modeling system faltered was the lack of sustainable funding (Grossmann
2009). Since 2011, the nine members countries of the ABN decided any hydraulic facility with
substantial impact on river flow will have to be discussed prior to its construction, coordinated
by the ABN.
The Niger basin contains an inner delta (around -4°E and 16°N), located in Mali, where
the river splits into several branches. The inner delta is the largest Western Africa wetland, along
18
an approximately 200-km long reach of the river, in the Sahel region. There are around one
million people living in the inner delta (UNEP 2010). It is an extremely complex hydrologic
system, with important evapotranspiration and infiltration fluxes; therefore, the delta highly
impacts the water cycle of the entire basin. Discharge above the inner delta is almost twice as
large as discharge below the delta, due largely to evaporative losses (Pedinotti et al. 2012). Goita
and Diepkile (2012) showed that a “consistent long-term water level time series could be
established” from three T/P tracks and eight Envisat tracks despite the complexity of the
environmental conditions. On the basis of their analysis of altimetry data, they found that over a
17-year period, July-August precipitation strongly influenced the delta’s flooding processes.
In order to quantify the impact of delta flooding in the Niger, Pedinotti et al. (2012) used
distributed measurements of water extent and height from remote sensing to test whether
changes to processes represented by the ISBA-TRIP (Interaction Sol-Biosphère-Atmosphère-
Total Runoff Integrating Pathways) model (Noilhan and Planton 1989; for details of specific
implementation used, see Pedinotti et al. 2012) reflect the true spatial and temporal structure of
hydrology in the region. They tested different rainfall inputs, a simple aquifer representation,
and a flooding scheme in the ISBA-TRIP model with: 1) MODIS (Moderate Resolution Imaging
Spectroradiometer) observations of flooded areas (Crétaux et al. 2011), 2) height changes from
altimetry processed by Calmant et al. (2008) as part of the LEGOS/GOHS (Laboratoire d’Études
en Géophysique et Océanographie Spatiales)/Geodesie, Oceanographie et Hydrologie from
Spatiales) HYDROWEB database and 3) in situ discharge measurements provided by the ABN.
They found that including aquifers in ISBA-TRIP reduced the predicted flooded fraction and
better captured the duration of the floods. The inclusion of a flooding scheme improved the
simulation of water level changes, as compared to altimetric observations of water levels. This
work is a good example of usefulness of remote sensing data in general and altimetry data in
particular, in combination with in situ measurements, to calibrate and validate hydrological
models, which can be extremely useful for water managers in transboundary basins. In particular,
using remote sensing data could be beneficial in studies of the inner delta because that region is
extremely difficult to monitor with in situ networks and to model with current hydrological
models.
One issue in simulating Niger River streamflow is that within the Niger River basin there
are substantial wetland areas (mostly in the delta area) that do not contribute much runoff to the
19
river (Coe 1998). Areas of local ponding, including those that interact with the river, are also
important contributors to evaporative losses in this basin; Nijssen et al. (2001) point out that
observed flows decrease by more than 25% between Koulikoro, Mali and Gaya, Niger, despite a
ten-fold increase in drainage area. Furthermore, the planned Fomi dam, to be constructed in
Guinea for hydropower generation, will increase dry season discharge and decrease wet season
discharge into the delta, which will likely impact the floodplain area (Liersch et al. 2012).
Without knowledge of the hydrologic mechanisms and distribution of floodplain-channel
interconnectivity in the delta, it is difficult to estimate the downstream implications of this
construction.
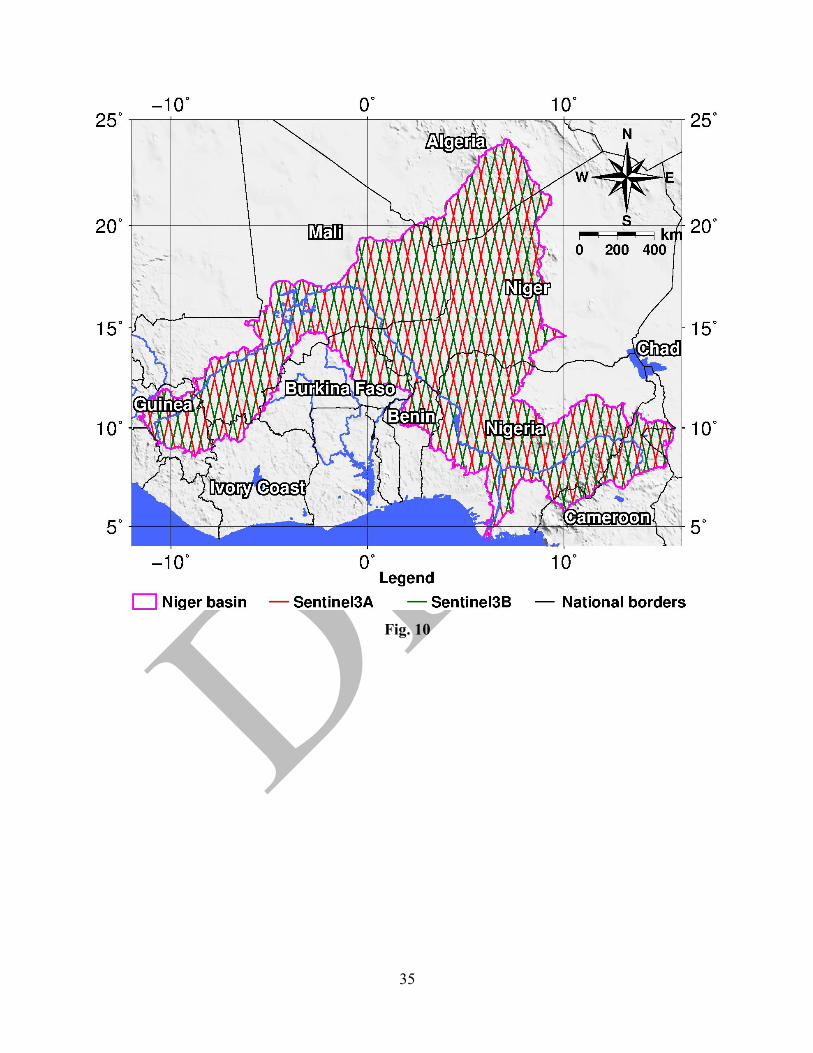
As shown in Fig. 9, only two Jason-2 tracks cross the inner delta, and much of the
remaining lowland areas are not observed at all. Dozens of Sentinel-3 tracks will cross the inner
delta, and the greater density of tracks increases the chances of viewing ponded water bodies
elsewhere (Fig. 10). Still, to map the locations of hydrologically-closed sections of the basin, and
to track periods in which ponded areas might connect to the river’s drainage, a water mask is
needed. In the case of the inner delta, the question of connectivity between the river and ponded
areas, and its impact on the hydrologic cycle of the basin as a whole, requires observations of
storage change. Although space-based observations of inundated fraction are currently available,
concurrent observations of height are required to quantify storage change. Jung et al. (2010)
demonstrated the utility of interferometric SAR (Synthetic Aperture Radar) measurements in
characterizing floodplain processes by applying Japanese Earth Resources Satellite-1 (JERS-1)
measurements to map water level changes, between wet and dry seasons, in the floodplains of
the Congo and Amazon Rivers. Based on relationships between water height changes, SRTM
topography, and the water mask, they were able to identify fundamentally different processes
and degrees of interconnectivity between each river and its neighboring wetlands. At present,
altimetric studies of the Niger River wetlands have primarily focused on assessing and
improving the quality of hydrologic and hydrodynamic model simulations. Similar to JERS-1,
SWOT will provide concurrent measurements of the water extent and height for the entire
region, but with greater frequency (1 to 2 observations over the Niger River basin per 22-day
repeat period; Fig. 11) and finer spatial resolution, which will allow the identification of small-
scale features, like floodplain channels. These observations should provide the opportunity to

20
assess spatial and temporal (monthly) variations in channel-floodplain interconnectivity in the
Niger River basin.
Fig. 10: Sentinel-3A and Sentinel-3B ground tracks over the Niger basin.
Fig. 11: Number of SWOT observations per repeat period (22 days) in the Niger basin.
6. Conclusions
Few studies have evaluated the utility of river and reservoir height measurements from
past and current nadir altimeters for transboundary water management; however, important
progress has been made. There appears to be great potential as a number of new nadir altimeters
are launched, especially with the new Sentinel-3 program (launch around 2014/2015) and the
expected launch of SWOT later this decade. Initial testing of an operational flood prediction
system in Bangladesh, based on altimetric measurements of water levels on the Ganges and
Brahmaputra in India, has shown potential for improvements over the existing system based
entirely on in situ data. Current generation altimeters have also played an important role in
supplementing in situ observations in the calibration and validation of hydrologic models, as in
the difficult-to-model Niger basin. Still, the nadir configuration of current single altimeters
means that many rivers and reservoirs are poorly observed, as is the case, for instance, for the
Indus basin. Similarly, for some applications, such as discharge estimation, a water mask is
needed; merging imagery and heights from multiple platforms with different viewing angles and
observation times introduces errors.
The problem of coverage should be dramatically improved by the advent of nadir
altimeter constellations, such as Sentinel-3. Furthermore, SWOT is expected to have tremendous
potential to monitor reservoir water storage change in transboundary river basins, where in a
number of important cases, data are not presently available to both (or all) riparian countries. In
addition to providing storage change information, SWOT will also provide river water level and
slope variations over most or all of these river basins and therefore can help to assess the impact
of upstream reservoirs on the downstream reaches of the river. These data will be freely

21
available, which could have major impacts on the nature of the management of these systems.
Under the likely scenario of Sentinel-3 launching between 2014 and 2015 and SWOT becoming
a reality around 2020, a current unknown is how India and Pakistan will leverage this
information on storage changes and water levels of the impounded Indus basin for adaptation,
mitigation and more equitable resource allocation as demand for water rises on both sides of the
border. In regions like the Niger River basin, where in situ monitoring is largely cost-prohibitive,
or in Bangladesh, where upstream data are not available on the GBM for political reasons, the
availability of spatially distributed data from Sentinel-3 and SWOT is expected to vastly improve
the knowledge base for model development and has potential for improved flood and water
supply forecasting, flood mapping, model calibration and other water management applications
such as reservoir operations.
Acknowledgements
The digital elevation data shown as the background in Fig. 4-11 is the 2-minute Gridded
Global Relief Data (ETOPO2v2) of the U.S. Department of Commerce, National Oceanic and
Atmospheric Administration, National Geophysical Data Center, 2006,
http://www.ngdc.noaa.gov/mgg/fliers/06mgg01.html.
This research was supported, in part, by a NASA Graduate Student Education
Fellowship, by NASA Grant No. NNX13AD98G to the University of Washington, and also by
CNES through TOSCA funding to the “SWOT and transboundary basins management” project.
References
Ahmad QK, Ahmed AU (2003) Regional cooperation in flood management in the Ganges‐
Brahmaputra‐Meghna region: Bangladesh perspective. Nat Hazards 28:191–198.
doi:10.1023/A:1021186203100
Andreadis KM, Clark EA, Lettenmaier DP, Alsdorf DE (2007) Prospects for river discharge and
depth estimation through assimilation of swath-altimetry into a raster-based hydrodynamics
model. Geophys Res Lett 34(L10403). doi:10.1029/2007GL029721
22
Bagla P (2010) Along the Indus River, saber rattling over water security. Science 328:1226-
1227. doi:10.1126/science.328.5983.1226-a
Balthrop C, Hossain F (2010) A review of state of the art on treaties in relation to management
of transboundary flooding in international river basins and the Global Precipitation
Measurement Mission. Water Policy 12:635-640. doi:10.2166/wp.2009.117
Bakker MHN (2009) Transboundary river floods and institutional capacity. J Am Water Resour
Assoc 45:553-566. doi:10.1111/j.1752-1688.2009.00325.x
Biancamaria S, Durand M, Andreadis KM, Bates PD, Boone A, Mognard NM, Rodriguez E,
Alsdorf DE, Lettenmaier DP, Clark EA (2011a) Assimilation of virtual wide swath altimetry
to improve Arctic river modeling. Remote Sens Environ 115(2):373-381
Biancamaria S, Hossain F, Lettenmaier DP (2011b) Forecasting transboundary river water
elevations from space. Geophys Res Lett 38(L11401). doi:10.1029/2011GL047290
Calmant S, Seyler F, Crétaux JF (2008) Monitoring continental surface waters by satellite
altimetry. Surv Geophys 29:247-269
Coe MT (1998) A linked global model of terrestrial hydrologic processes: Simulation of modern
rivers, lakes, and wetlands. J Geophys Res 103:8885-8899. doi:10.1029/98JD00347
Crétaux JF, Birkett C (2006) Lake studies from satellite altimetry. C R Geoscience 338:1098-
1112. doi:10.1016/J.cre.2006.08.002
Crétaux JF, Bergé-Nguyen M, Leblanc M, Abarca Del Rio R, Delclaux F, Mognard N, Lion C,
Pandey RK, Tweed S, Calmant S, Maisongrande P (2011) Flood mapping inferred from
remote sensing data. Int Water Technol J 1:48-62
De Villiers M (2000) Water: The Fate of our Most Precious Resource. Mariner Books USA
Durand M, Neal J, Rodríguez E, Andreadis KM, Smith LC, Yoon Y (2014) Estimating reach-
averaged discharge for the River Severn from measurements of river water surface elevation
and slope. J Hydrol 511:92-104. doi:10.1016/j.jhydrol.2013.12.050
Gleick PH (2002) The World’s Water: The Biennial Report on Freshwater Resources (2002-
2003). Island Press Washington DC
Goita K, Diepkile AT (2012) Radar altimetry of water level variability in the Inner Delta of
Niger River. Geosci Remote Sens Symposium (IGARSS).
doi:10.1109/IGARSS.2012.6352422

23
Grossmann M (2009) Cooperation on Africa’s international waterbodies: Information needs and
the role of information-sharing. In: Scheumann W, Neubert, S (Eds), Transboundary Water
Management in Africa: Challenges for Development Cooperation, German Development
Institute/Deutsches Institut für Entwicklungspolitik (DIE)
Hossain F, Katiyar N (2006) Improving flood forecasting in international river basins. In: Eos,
Trans AGU 87:49-50. doi:10.1029/2006EO050001
Hossain F, Siddique-E-Akbor AH, Mazumdar LC, ShahNewaz SM, Biancamaria S, Lee H,
Shum CK (2013) Proof of concept of an altimeter-based river forecasting system for
transboundary flow inside Bangladesh. IEEE J Sel Topics in Appl Earth Observ PP(99):1-15.
doi:10.1109/JSTARS.2013.2283402
IAHS Ad Hoc Group on Global Water Data Sets (2001) Global water data: A newly endangered
species. Eos Trans AGU, 82:54-58. doi:10.1029/01EO00031
Jung HC, Hamski J, Durand M, Alsdorf D, Hossain F, Lee H, Azad Hossain AKM, Hasan K,
Khan AS, Zeaul Hoque AKM (2010) Characterization of complex fluvial systems using
remote sensing of spatial and temporal water level variations in the Amazon, Congo, and
Brahmaputra Rivers. Earth Surf Process Landforms 35:294-304. doi:10.1002/esp.1914
Lafitte R (2007) Executive Summary: BAGLIHAR Hydroelectric Plant - Expert determination
on points of difference referred by the Government of Pakistan under the provisions of the
Indus Waters Treaty (12 Feb. 2007). Available online at
http://water.worldbank.org/publications/indus-waters-treaty-articles-and-annexures-baglihar-
decision-expert-determination
Lautze J, Giordano M, Borghese M (2005) Driving forces behind African transboundary water
law: Internal, external, and implications. In: International workshop on African Water Laws:
Plural Legislative Frameworks for Rural Water Management in Africa, Johannesburg, South
Africa, 26-28 January 2005, 26-1 – 26-13
Liersch S, Cools J, Kone B, Koch H, Diallo M, Reinhardt J, Fournet S, Aich V, Hattermann FF
(2012) Vulnerability of rice production in the Inner Niger Delta to water resources
management under climate variability and change. Environ Sci Policy 34:18-33.
doi:10.1016/j.envsci.2012.10.014

24
Michailovsky CI, Milzow C, Bauer-Gottwein P (2013) Assimilation of radar altimetry to a
routing model of the Brahmaputra River. Water Resour Res 49:4807-4816.
doi:10.1002/wrcr.20345
Mirza MQM (1998) Diversion of the Ganges water at Farakka and its effects on salinity in
Bangladesh. Environ Manage 22:711-722. doi:10.1007/s002679900141
Misra AK, Saxena A, Yaduvanshi M, Mishra A, Bhauduriya Y, Takur A (2007) Proposed river
linking project of India: Boon or bane to nature? Environ Geol 51:1361-1376.
doi:10.1007/s00254-006-0434-7
Nijssen B, GM O’Donnell, Lettenmaier DP (2001) Predicting the discharge of global rivers. J
Climate 14:3307-3323
Nishat A, Faisal IM (2000) An Assessment of the institutional mechanisms for water
negotiations in the Ganges-Brahmaputra-Meghna system. Int Negotiation 5:289-310
Nishat B, Rahman SMM (2009) Water resources modeling of the Ganges-Brahmaputra-Meghna
river basins using satellite remote sensing data. J Am Water Resour Assoc 45:1313-1327.
doi:10.1111/j.1752-1688.2009.00374.x
Noilhan J, Planton S (1989) A simple parameterization of land surface processes for
meteorological models. Mon Weather Rev 117(3):536-549
Oak Ridge National Laboratory (2008) LANDSCAN 2007 Global Population Dataset,
http://www.ornl.gov/sci/landscan
Oregon State University (2013) Transboundary Freshwater Dispute Database (TFDD),
http://www.transboundarywaters.orst.edu/, last access: 10 Sep. 2013
Papa F, Bala SK, Pandey RK, Durand F, Gopalakrishna VV, Rahman A, Rossow, WB (2012)
Ganga-Brahmaputra river discharge from Jason-2 radar altimetry: An update to the long-term
satellite-derived estimates of continental freshwater forcing flux into the Bay of Bengal. J
Geophys Res Oceans 117:C11021. doi:10.1029/2012JC008158
Pedinotti V, Boone A, Decharme B, Crétaux JF, Mognard N, Panthou G, Papa F, Tanimoun BA
(2012) Evaluation of the ISBA-TRIP continental hydrologic system over the Niger basin
using in situ and satellite derived datasets. Hydrol Earth Syst Sci 16:1745-1773.
doi:10.5194/hess-16-1745-2012
Permanent Court of Arbitration (2013) PCA Press Release, Indus Waters Kishenganga
Arbitration: Court of Arbitration Issues Partial Award in First Arbitration under the Indus

25
Waters Treaty 1960. www.pca-cpa.org/showpage.asp?pag_id=1392, last access: 27 June
2013
Rodríguez E (2012) SWOT Science Requirements Document, JPL document, Second Release (v.
1.1), available online at
http://swot.jpl.nasa.gov/files/swot/SWOT_science_reqs_release2_v1.14.pdf
Shiklomanov AI, Lammers RB, Vörösmarty CJ (2002) Widespread decline in hydrological
monitoring threatens Pan-Arctic research. Eos Trans AGU 83:13-16.
Siddique-E-Akbor AH, Hossain F, Lee H, Shum CK (2011) Inter-comparison study of water
level estimates derived from hydrodynamic-hydrologic model and satellite altimetry for a
complex deltaic environment. Remote Sens Environ 115:1522-1531.
doi:10.1016/j.rse.2011.02.011
Sinha IN (1995) Opportunity, delay and policy planning vision in the synergic development of
Eastern Himalayan Rivers: A conspectus. Int J Water Resour D 11.
doi:10.1080/07900629550042254
Stokstad E (1999) Scarcity of rain, stream gages threatens forecasts. Science, 285:1199
U.S. Census Bureau, International Data Base,
http://www.census.gov/population/international/data/idb/informationGateway.php, last
access: 17 Sep. 2013.
UNECA (2000) Transboundary river/lake basin water development in Africa: prospects,
problems and achievements. United Nations Economic Commission for Africa Addis Ababa
Ethiopia, 60 pp, available at
http://www.uneca.org/sites/default/files/publications/transboundary_v2.pdf
UNEP (2010) Africa World Atlas. Division of Early Warning and Assessment (DEWA) United
Nations Environment Programme (UNEP) Nairobi Kenya
USDA (United States Department of Agriculture) Foreign Agricultural Service (2014) Crop
explorer, Global reservoirs and lakes,
http://www.pecad.fas.usda.gov/cropexplorer/global_reservoir/#SatelliteRadarAltimetry,
accessed on 7 Jan. 2014
Woldemichael AT, Degu AM, Siddique-E-Akbor AHM, Hossain F (2010) Role of land-water
classification and Manning’s roughness parameter in space-borne estimation of discharge for

26
braided rivers: A case study of the Brahmaputra River in Bangladesh. IEEE J Sel Top Appl
3:395-403. doi:10.1109/JSTARS.2010.2050579
Wolf A, Nathrius J, Danielson J, Ward B, Pender J (1999) International river basis of the world.
Int J Water Resour D 15:387-427
World Commission on Dams (2000) Dams and development: A new framework for decision-
making. World Commission on Dams Report, Earthscan London England, available online at
http://www.internationalrivers.org/files/attached-
files/world_commission_on_dams_final_report.pdf, last access: 10 Sep. 2013
Vörösmarty CJ, Douglas EM, Green PA, Revenga C (2005) Geospatial indicators of emerging
water stress: An application to Africa. AMBIO 34, 230-236
Yoon Y, Durand M, Merry CJ, Clark EA, Andreadis KM, Alsdorf DE (2012) Estimating river
bathymetry from data assimilation of synthetic SWOT measurements. J Hydrol 464-465:363-
375. doi:10.1016/j.jhydrol.2012.07.028
Captions of tables
Table 2: SWOT hydrology science requirements (for more details, see Rodríguez 2012).
Captions of figures
Fig. 1: Location of the world’s major rivers (blue lines labeled with river names) and
transboundary river basins (colored based on the number of countries that contain a portion of
the basin). Countries per basin and transboundary basin boundaries are a product of the
Transboundary Freshwater Dispute Database (TFDD), Department of Geosciences, Oregon State
University, updated to include Southern Sudan. Additional information about the TFDD can be
found at: http://www.transboundarywaters.orst.edu.
Fig. 2: Number of SWOT observations per 22-day repeat period over the global land areas.
27
Fig. 3: The Surface Water and Ocean Topography (SWOT) satellite antennas and instruments.
Image courtesy of C. Lion and B. Reinier; the initial image concept is from Karen Wiedman. The
satellite image used is from CNES, and image in the swaths are Landsat images.
Fig. 4: Map of Ganges and Brahmaputra Rivers, showing the (1992-2002) T/P ground track and
river crossings, as well as the river gauges used as water level forecasting points in Biancamaria
et al. (2011b). Figure adapted from Biancamaria et al. (2011b).
Fig. 5: Map of Ganges and Brahmaputra Rivers, showing the Sentinel-3A and -3B ground tracks.
Fig. 6: Map of Indus basin (green boundary) showing Jason-2 ground tracks (yellow lines).
Fig. 7: Sentinel-3A and Sentinel-3B ground tracks over the Indus basin.
Fig. 8: Number of SWOT observations per repeat period (22 days) in the Indus basin.
Fig. 9: Niger basin showing Jason-2 ground tracks.
Fig. 10: Sentinel-3A and Sentinel-3B ground tracks over the Niger basin.
Fig. 11: Number of SWOT observations per repeat period (22 days) in the Niger basin.
Tables
Minimum water body area seen 250 m2
Minimum river width seen 100 m Height accuracy < 10 cm (over 1 km2) Slope accuracy 1 cm/km (over 10 km)
Water mask area error <20% of the total water body area Min. mission life time 3 years
Table 1.
28
Figures
Fig. 1
Fig. 2
29
Fig. 3
30
Fig. 4
Fig. 5

31
Fig. 6

32
Fig. 7
33
Fig. 8
34
Fig. 9
35
Fig. 10

36
Fig. 11


