
Company No. 8515–D
AmBank (M) Berhad(Company No. 8515–D)
(Incorporated in Malaysia)And Its Subsidiaries
Interim Financial StatementsFor the Financial Period
1 April 2010 to30 September 2010(In Ringgit Malaysia)
Company No. 8515–D
AmBank (M) Berhad (Incorporated in Malaysia) And Its Subsidiaries
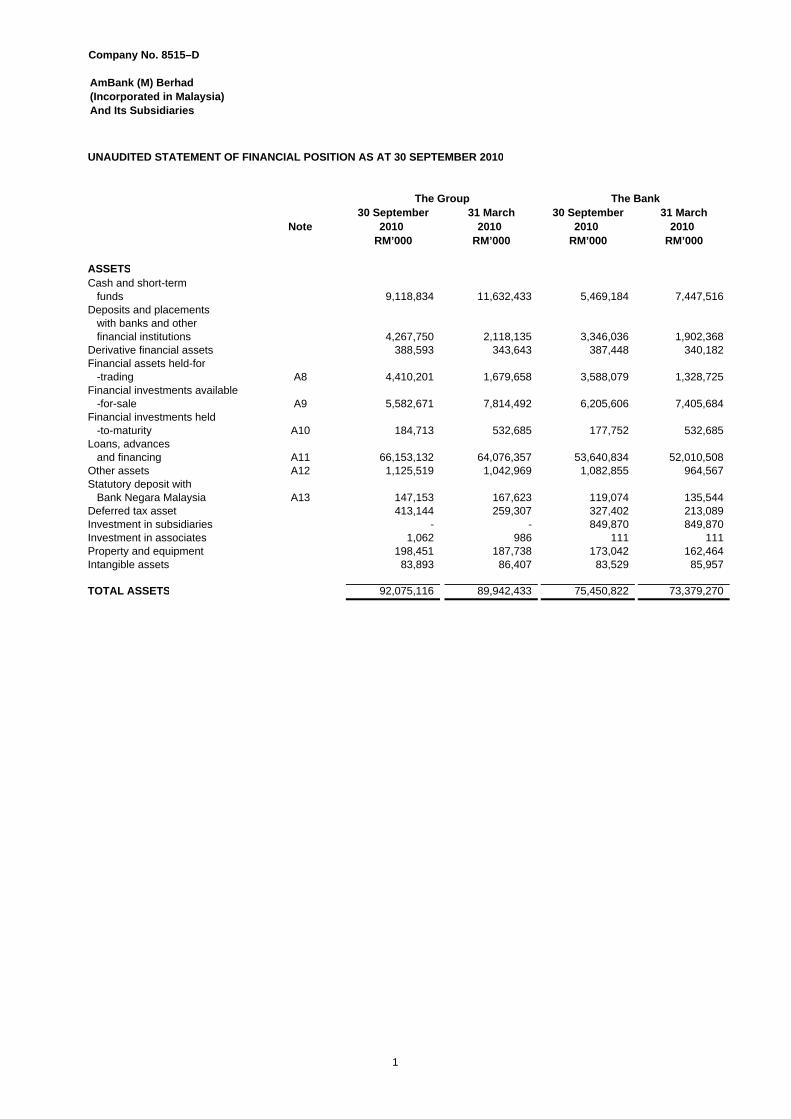
UNAUDITED STATEMENT OF FINANCIAL POSITION AS AT 30 SEPTEMBER 2010
30 September 31 March 30 September 31 MarchNote 2010 2010 2010 2010
RM’000 RM’000 RM’000 RM’000
ASSETSCash and short-term funds 9,118,834 11,632,433 5,469,184 7,447,516 Deposits and placements with banks and other financial institutions 4,267,750 2,118,135 3,346,036 1,902,368 Derivative financial assets 388,593 343,643 387,448 340,182 Financial assets held-for -trading A8 4,410,201 1,679,658 3,588,079 1,328,725 Financial investments available -for-sale A9 5,582,671 7,814,492 6,205,606 7,405,684 Financial investments held -to-maturity A10 184,713 532,685 177,752 532,685 Loans, advances and financing A11 66,153,132 64,076,357 53,640,834 52,010,508 Other assets A12 1,125,519 1,042,969 1,082,855 964,567 Statutory deposit with Bank Negara Malaysia A13 147,153 167,623 119,074 135,544 Deferred tax asset 413,144 259,307 327,402 213,089 Investment in subsidiaries - - 849,870 849,870 Investment in associates 1,062 986 111 111 Property and equipment 198,451 187,738 173,042 162,464 Intangible assets 83,893 86,407 83,529 85,957
TOTAL ASSETS 92,075,116 89,942,433 75,450,822 73,379,270
The BankThe Group
1
Company No. 8515–D
AmBank (M) Berhad (Incorporated in Malaysia) And Its Subsidiaries
30 September 31 March 30 September 31 MarchNote 2010 2010 2010 2010
RM’000 RM’000 RM’000 RM’000
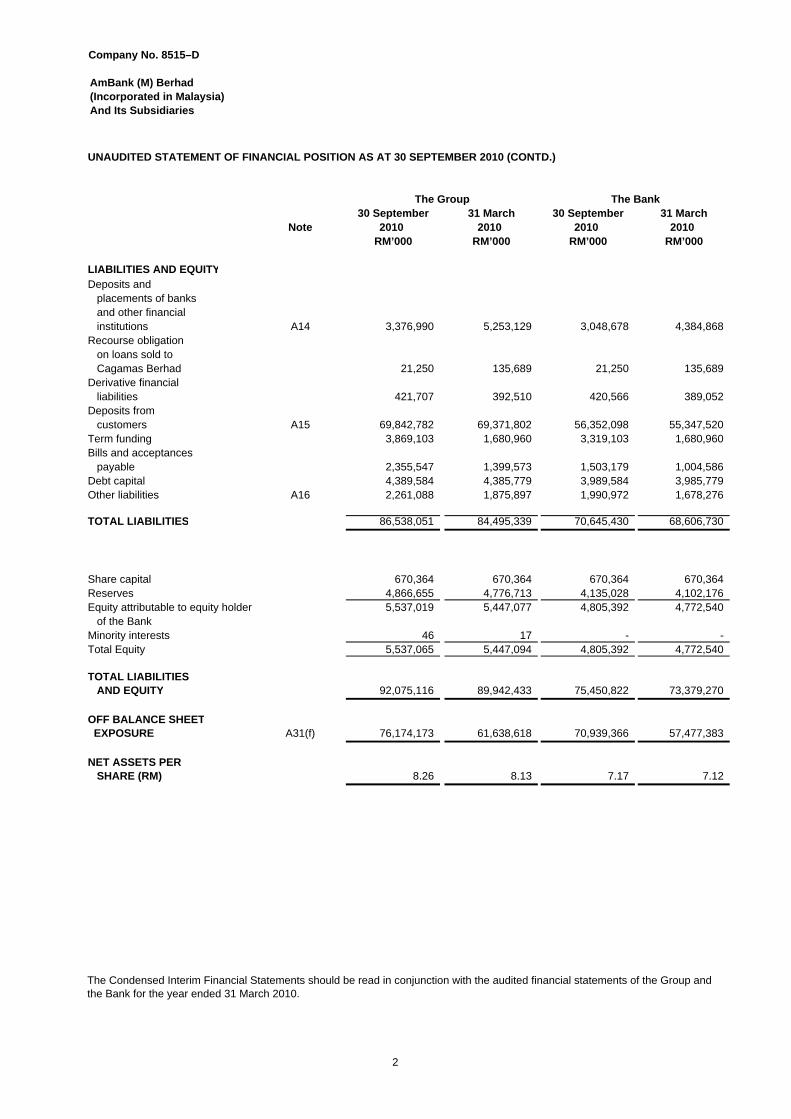
LIABILITIES AND EQUITYDeposits and placements of banks and other financial institutions A14 3,376,990 5,253,129 3,048,678 4,384,868 Recourse obligation on loans sold to Cagamas Berhad 21,250 135,689 21,250 135,689 Derivative financial liabilities 421,707 392,510 420,566 389,052 Deposits from customers A15 69,842,782 69,371,802 56,352,098 55,347,520 Term funding 3,869,103 1,680,960 3,319,103 1,680,960 Bills and acceptances payable 2,355,547 1,399,573 1,503,179 1,004,586 Debt capital 4,389,584 4,385,779 3,989,584 3,985,779 Other liabilities A16 2,261,088 1,875,897 1,990,972 1,678,276
TOTAL LIABILITIES 86,538,051 84,495,339 70,645,430 68,606,730
Share capital 670,364 670,364 670,364 670,364 Reserves 4,866,655 4,776,713 4,135,028 4,102,176 Equity attributable to equity holder 5,537,019 5,447,077 4,805,392 4,772,540 of the BankMinority interests 46 17 - - Total Equity 5,537,065 5,447,094 4,805,392 4,772,540
TOTAL LIABILITIES AND EQUITY 92,075,116 89,942,433 75,450,822 73,379,270
OFF BALANCE SHEET EXPOSURE A31(f) 76,174,173 61,638,618 70,939,366 57,477,383
NET ASSETS PER SHARE (RM) 8.26 8.13 7.17 7.12
The BankThe Group
UNAUDITED STATEMENT OF FINANCIAL POSITION AS AT 30 SEPTEMBER 2010 (CONTD.)
The Condensed Interim Financial Statements should be read in conjunction with the audited financial statements of the Group and the Bank for the year ended 31 March 2010.
2
Company No. 8515–D
AmBank (M) Berhad (Incorporated in Malaysia) And Its Subsidiaries
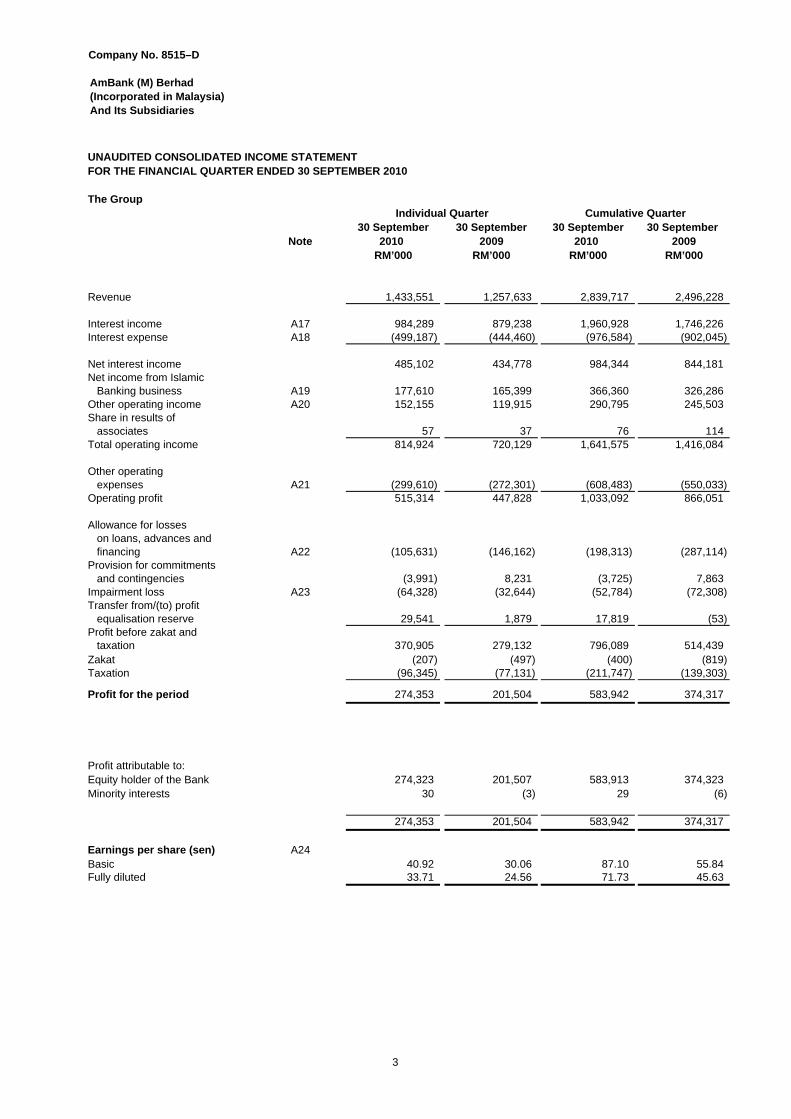
UNAUDITED CONSOLIDATED INCOME STATEMENT
The Group
30 September 30 September 30 September 30 September Note 2010 2009 2010 2009
RM’000 RM’000 RM’000 RM’000
Revenue 1,433,551 1,257,633 2,839,717 2,496,228
Interest income A17 984,289 879,238 1,960,928 1,746,226 Interest expense A18 (499,187) (444,460) (976,584) (902,045)
Net interest income 485,102 434,778 984,344 844,181 Net income from Islamic Banking business A19 177,610 165,399 366,360 326,286 Other operating income A20 152,155 119,915 290,795 245,503 Share in results of associates 57 37 76 114 Total operating income 814,924 720,129 1,641,575 1,416,084
Other operating expenses A21 (299,610) (272,301) (608,483) (550,033) Operating profit 515,314 447,828 1,033,092 866,051
Allowance for losses on loans, advances and financing A22 (105,631) (146,162) (198,313) (287,114) Provision for commitments and contingencies (3,991) 8,231 (3,725) 7,863 Impairment loss A23 (64,328) (32,644) (52,784) (72,308) Transfer from/(to) profit equalisation reserve 29,541 1,879 17,819 (53)Profit before zakat and taxation 370,905 279,132 796,089 514,439 Zakat (207) (497) (400) (819) Taxation (96,345) (77,131) (211,747) (139,303)
Profit for the period 274,353 201,504 583,942 374,317
Profit attributable to:Equity holder of the Bank 274,323 201,507 583,913 374,323 Minority interests 30 (3) 29 (6)
274,353 201,504 583,942 374,317
Earnings per share (sen) A24Basic 40.92 30.06 87.10 55.84 Fully diluted 33.71 24.56 71.73 45.63
Cumulative QuarterIndividual Quarter
FOR THE FINANCIAL QUARTER ENDED 30 SEPTEMBER 2010
3
Company No. 8515–D
AmBank (M) Berhad (Incorporated in Malaysia) And Its Subsidiaries
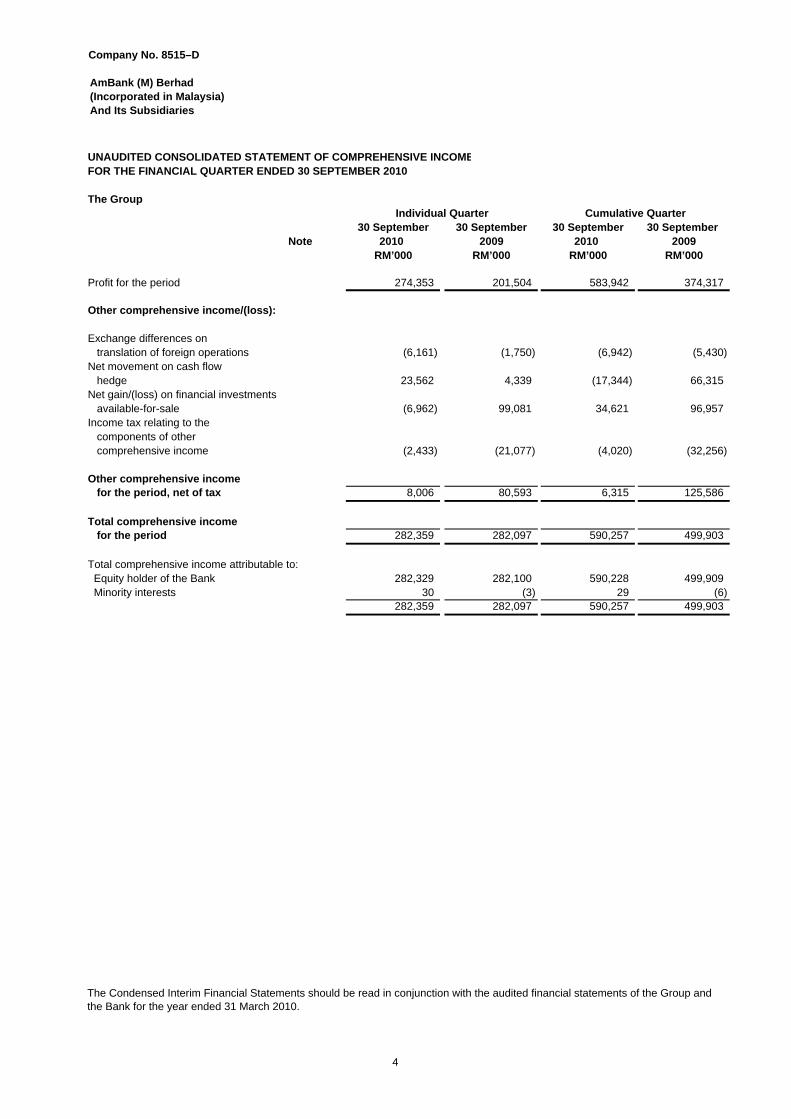
UNAUDITED CONSOLIDATED STATEMENT OF COMPREHENSIVE INCOME
The Group
30 September 30 September 30 September 30 September Note 2010 2009 2010 2009
RM’000 RM’000 RM’000 RM’000
Profit for the period 274,353 201,504 583,942 374,317
Other comprehensive income/(loss):
Exchange differences on translation of foreign operations (6,161) (1,750) (6,942) (5,430)Net movement on cash flow hedge 23,562 4,339 (17,344) 66,315Net gain/(loss) on financial investments available-for-sale (6,962) 99,081 34,621 96,957Income tax relating to the components of other comprehensive income (2,433) (21,077) (4,020) (32,256)
Other comprehensive income for the period, net of tax 8,006 80,593 6,315 125,586
Total comprehensive income for the period 282,359 282,097 590,257 499,903
Total comprehensive income attributable to: Equity holder of the Bank 282,329 282,100 590,228 499,909 Minority interests 30 (3) 29 (6)
282,359 282,097 590,257 499,903
Individual Quarter Cumulative Quarter
FOR THE FINANCIAL QUARTER ENDED 30 SEPTEMBER 2010
The Condensed Interim Financial Statements should be read in conjunction with the audited financial statements of the Group and the Bank for the year ended 31 March 2010.
4
Company No. 8515–D
AmBank (M) Berhad (Incorporated in Malaysia) And Its Subsidiaries
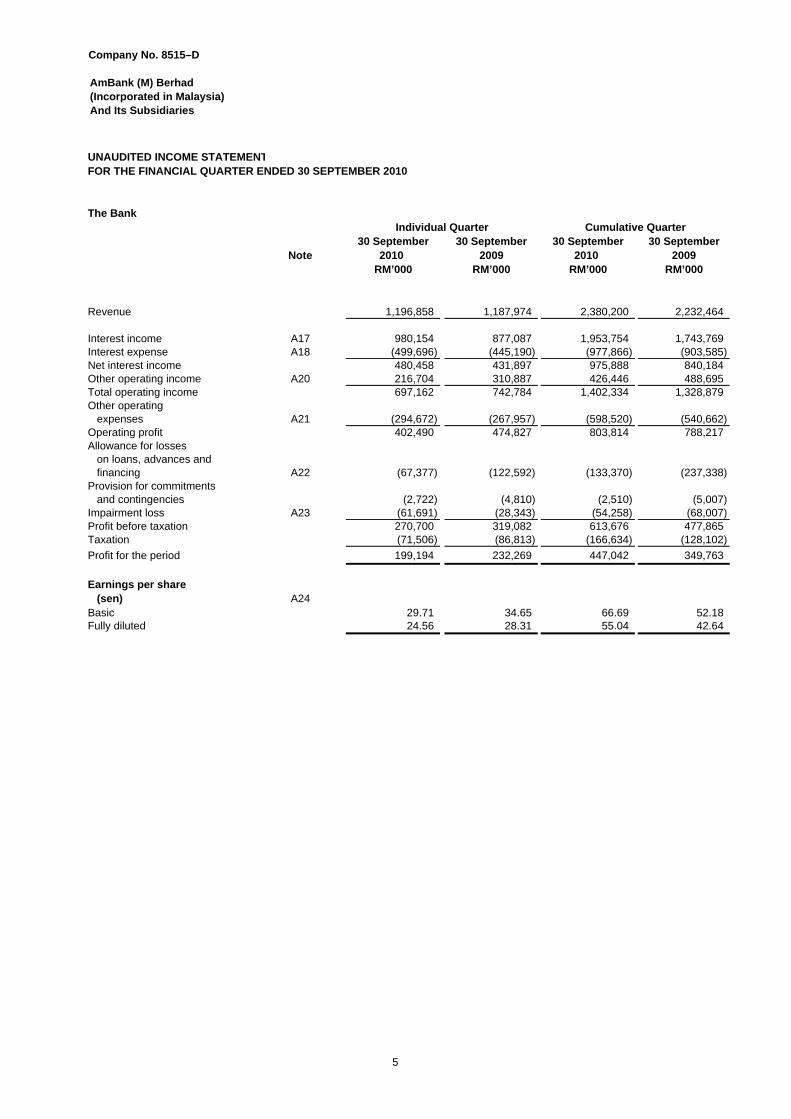
UNAUDITED INCOME STATEMENT
The Bank
30 September 30 September 30 September 30 SeptemberNote 2010 2009 2010 2009
RM’000 RM’000 RM’000 RM’000
Revenue 1,196,858 1,187,974 2,380,200 2,232,464
Interest income A17 980,154 877,087 1,953,754 1,743,769 Interest expense A18 (499,696) (445,190) (977,866) (903,585) Net interest income 480,458 431,897 975,888 840,184 Other operating income A20 216,704 310,887 426,446 488,695 Total operating income 697,162 742,784 1,402,334 1,328,879 Other operating expenses A21 (294,672) (267,957) (598,520) (540,662) Operating profit 402,490 474,827 803,814 788,217 Allowance for losses on loans, advances and financing A22 (67,377) (122,592) (133,370) (237,338) Provision for commitments and contingencies (2,722) (4,810) (2,510) (5,007) Impairment loss A23 (61,691) (28,343) (54,258) (68,007) Profit before taxation 270,700 319,082 613,676 477,865 Taxation (71,506) (86,813) (166,634) (128,102)
Profit for the period 199,194 232,269 447,042 349,763
Earnings per share (sen) A24 Basic 29.71 34.65 66.69 52.18 Fully diluted 24.56 28.31 55.04 42.64
Individual Quarter Cumulative Quarter
FOR THE FINANCIAL QUARTER ENDED 30 SEPTEMBER 2010
5
Company No. 8515–D
AmBank (M) Berhad (Incorporated in Malaysia) And Its Subsidiaries
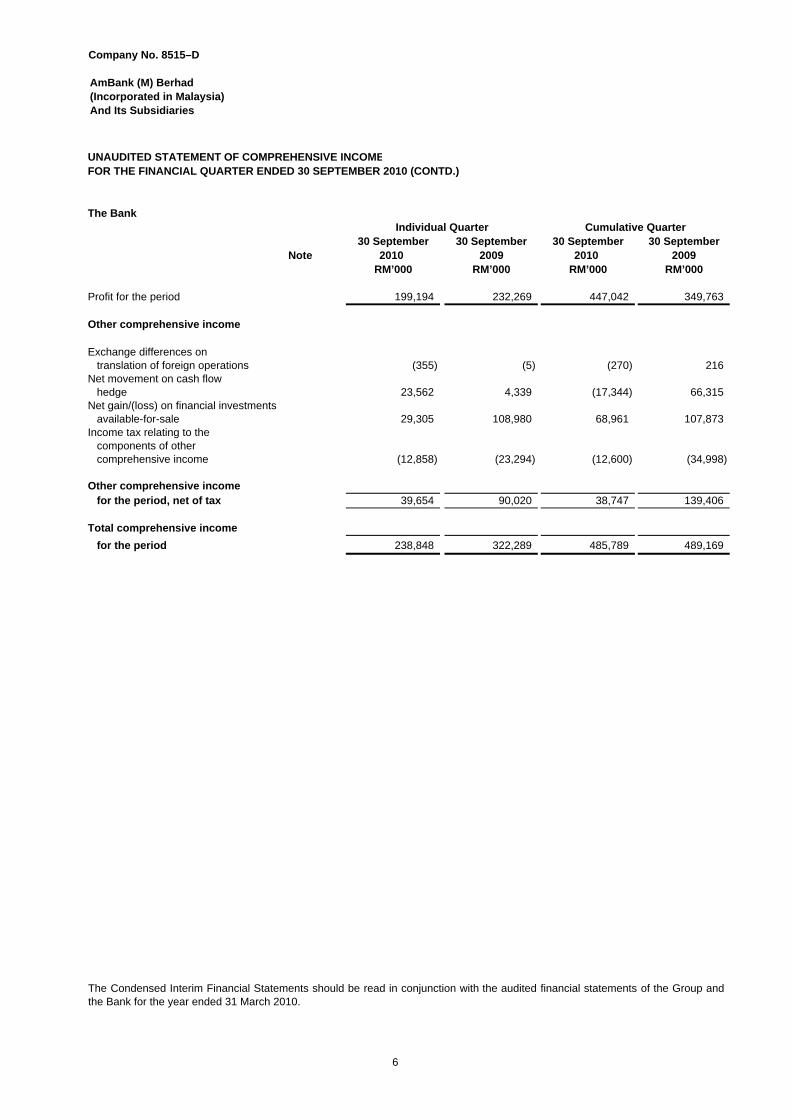
UNAUDITED STATEMENT OF COMPREHENSIVE INCOME
The Bank
30 September 30 September 30 September 30 SeptemberNote 2010 2009 2010 2009
RM’000 RM’000 RM’000 RM’000
Profit for the period 199,194 232,269 447,042 349,763
Other comprehensive income
Exchange differences on translation of foreign operations (355) (5) (270) 216 Net movement on cash flow hedge 23,562 4,339 (17,344) 66,315Net gain/(loss) on financial investments available-for-sale 29,305 108,980 68,961 107,873Income tax relating to the components of other comprehensive income (12,858) (23,294) (12,600) (34,998)
Other comprehensive income for the period, net of tax 39,654 90,020 38,747 139,406
Total comprehensive income
for the period 238,848 322,289 485,789 489,169
Cumulative QuarterIndividual Quarter
FOR THE FINANCIAL QUARTER ENDED 30 SEPTEMBER 2010 (CONTD.)
The Condensed Interim Financial Statements should be read in conjunction with the audited financial statements of the Group andthe Bank for the year ended 31 March 2010.
6
Company No. 8515–D
AmBank (M) Berhad(Incorporated in Malaysia)And Its Subsidiaries
FOR THE FINANCIAL QUARTER ENDED 30 SEPTEMBER 2010
Distributable
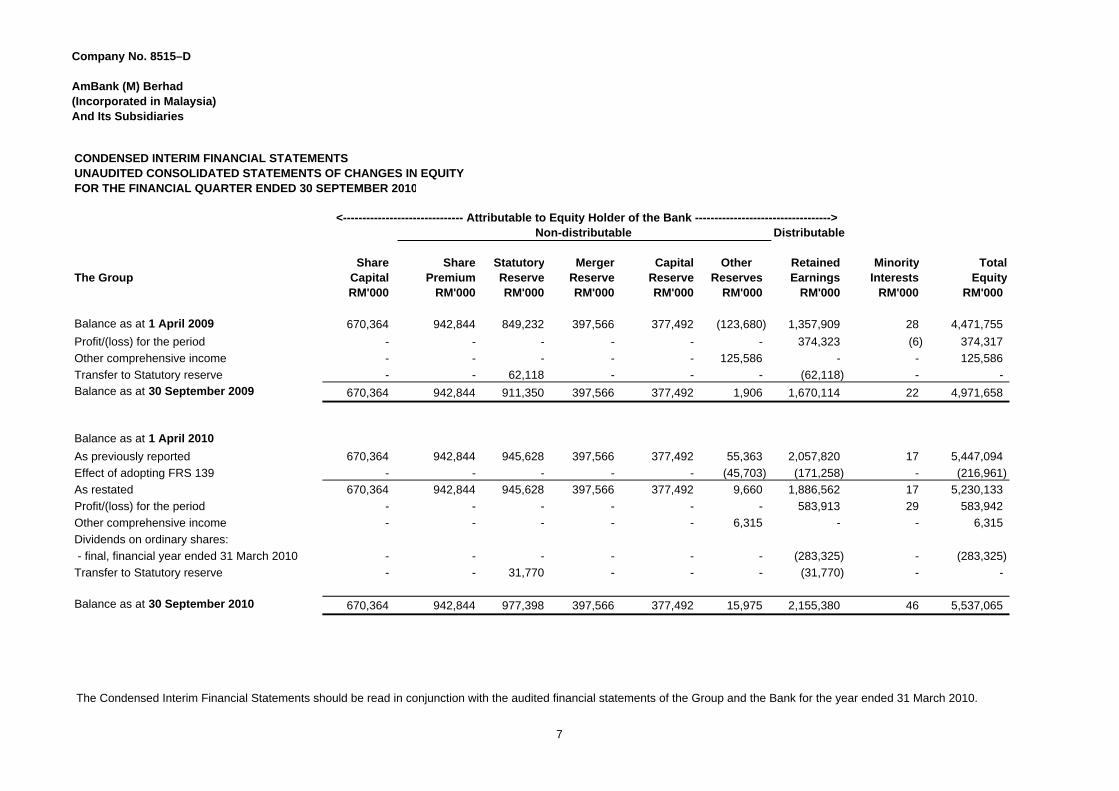
Share Share Statutory Merger Capital Other Retained Minority TotalThe Group Capital Premium Reserve Reserve Reserve Reserves Earnings Interests Equity
RM'000 RM'000 RM'000 RM'000 RM'000 RM'000 RM'000 RM'000 RM'000
Balance as at 1 April 2009 670,364 942,844 849,232 397,566 377,492 (123,680) 1,357,909 28 4,471,755
Profit/(loss) for the period - - - - - - 374,323 (6) 374,317
Other comprehensive income - - - - - 125,586 - - 125,586
Transfer to Statutory reserve - - 62,118 - - - (62,118) - -
Balance as at 30 September 2009 670,364 942,844 911,350 397,566 377,492 1,906 1,670,114 22 4,971,658
Balance as at 1 April 2010
As previously reported 670,364 942,844 945,628 397,566 377,492 55,363 2,057,820 17 5,447,094
Effect of adopting FRS 139 - - - - - (45,703) (171,258) - (216,961)
As restated 670,364 942,844 945,628 397,566 377,492 9,660 1,886,562 17 5,230,133
Profit/(loss) for the period - - - - - - 583,913 29 583,942
Other comprehensive income - - - - - 6,315 - - 6,315
Dividends on ordinary shares:
- final, financial year ended 31 March 2010 - - - - - - (283,325) - (283,325)
Transfer to Statutory reserve - - 31,770 - - - (31,770) - -
Balance as at 30 September 2010 670,364 942,844 977,398 397,566 377,492 15,975 2,155,380 46 5,537,065
Non-distributable<------------------------------- Attributable to Equity Holder of the Bank ----------------------------------->
CONDENSED INTERIM FINANCIAL STATEMENTSUNAUDITED CONSOLIDATED STATEMENTS OF CHANGES IN EQUITY
The Condensed Interim Financial Statements should be read in conjunction with the audited financial statements of the Group and the Bank for the year ended 31 March 2010.
7
Company No. 8515–D
AmBank (M) Berhad (Incorporated in Malaysia) And Its Subsidiaries
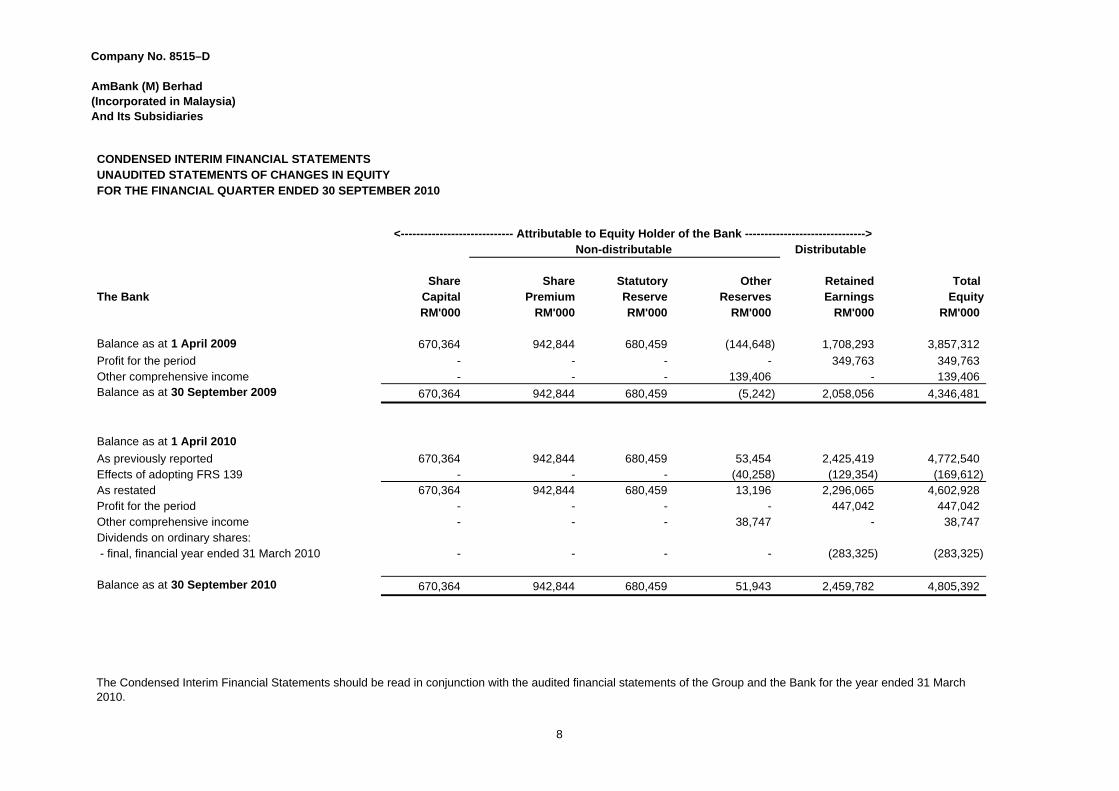
CONDENSED INTERIM FINANCIAL STATEMENTSUNAUDITED STATEMENTS OF CHANGES IN EQUITYFOR THE FINANCIAL QUARTER ENDED 30 SEPTEMBER 2010
Distributable
Share Share Statutory Other Retained Total The Bank Capital Premium Reserve Reserves Earnings Equity
RM'000 RM'000 RM'000 RM'000 RM'000 RM'000
Balance as at 1 April 2009 670,364 942,844 680,459 (144,648) 1,708,293 3,857,312
Profit for the period - - - - 349,763 349,763 Other comprehensive income - - - 139,406 - 139,406 Balance as at 30 September 2009 670,364 942,844 680,459 (5,242) 2,058,056 4,346,481
Balance as at 1 April 2010
As previously reported 670,364 942,844 680,459 53,454 2,425,419 4,772,540Effects of adopting FRS 139 - - - (40,258) (129,354) (169,612)As restated 670,364 942,844 680,459 13,196 2,296,065 4,602,928 Profit for the period - - - - 447,042 447,042Other comprehensive income - - - 38,747 - 38,747Dividends on ordinary shares: - final, financial year ended 31 March 2010 - - - - (283,325) (283,325)
Balance as at 30 September 2010 670,364 942,844 680,459 51,943 2,459,782 4,805,392
Non-distributable<----------------------------- Attributable to Equity Holder of the Bank ------------------------------->
The Condensed Interim Financial Statements should be read in conjunction with the audited financial statements of the Group and the Bank for the year ended 31 March 2010.
8
Company No. 8515–D
AmBank (M) Berhad (Incorporated in Malaysia) And Its Subsidiaries
30 September 30 September 30 September 30 September2010 2009 2010 2009
RM’000 RM’000 RM’000 RM’000
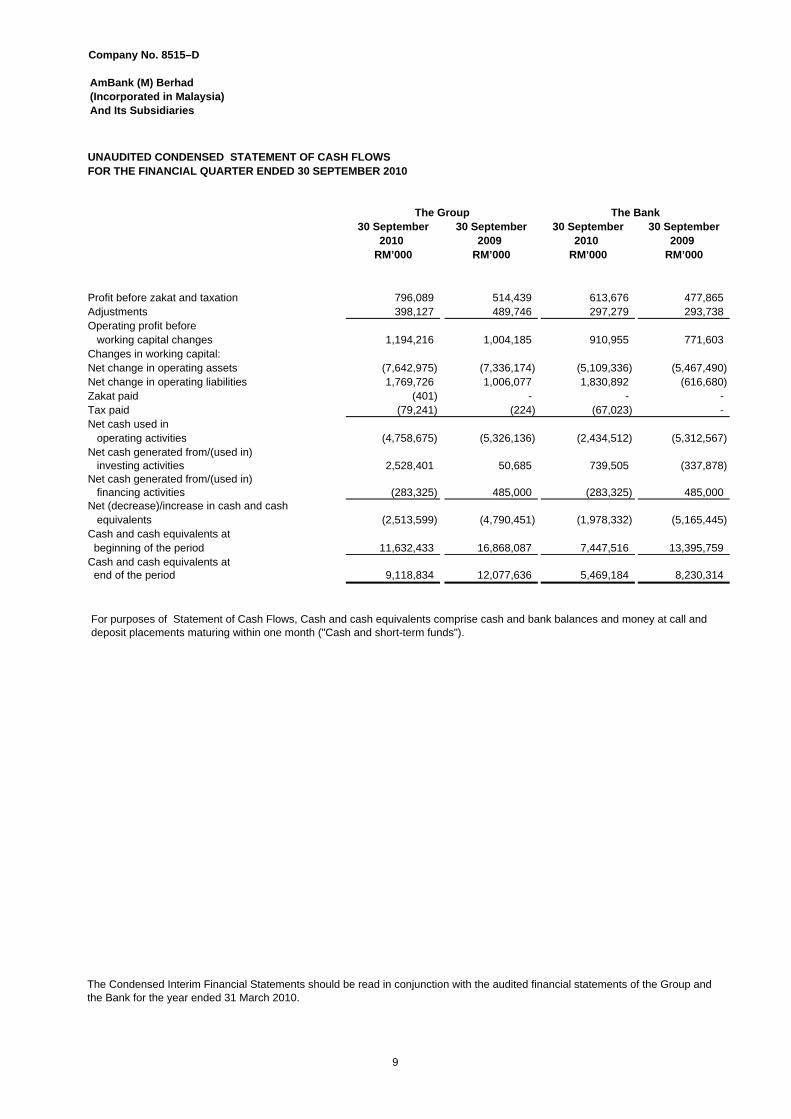
Profit before zakat and taxation 796,089 514,439 613,676 477,865 Adjustments 398,127 489,746 297,279 293,738 Operating profit before working capital changes 1,194,216 1,004,185 910,955 771,603 Changes in working capital:Net change in operating assets (7,642,975) (7,336,174) (5,109,336) (5,467,490) Net change in operating liabilities 1,769,726 1,006,077 1,830,892 (616,680) Zakat paid (401) - - - Tax paid (79,241) (224) (67,023) -Net cash used in operating activities (4,758,675) (5,326,136) (2,434,512) (5,312,567) Net cash generated from/(used in) investing activities 2,528,401 50,685 739,505 (337,878) Net cash generated from/(used in) financing activities (283,325) 485,000 (283,325) 485,000Net (decrease)/increase in cash and cash equivalents (2,513,599) (4,790,451) (1,978,332) (5,165,445) Cash and cash equivalents at beginning of the period 11,632,433 16,868,087 7,447,516 13,395,759 Cash and cash equivalents at end of the period 9,118,834 12,077,636 5,469,184 8,230,314
FOR THE FINANCIAL QUARTER ENDED 30 SEPTEMBER 2010UNAUDITED CONDENSED STATEMENT OF CASH FLOWS
The BankThe Group
The Condensed Interim Financial Statements should be read in conjunction with the audited financial statements of the Group and the Bank for the year ended 31 March 2010.
For purposes of Statement of Cash Flows, Cash and cash equivalents comprise cash and bank balances and money at call and deposit placements maturing within one month ("Cash and short-term funds").
9
Company No. 8515–D
AmBank (M) Berhad (Incorporated in Malaysia) And Its Subsidiaries
Explanatory Notes
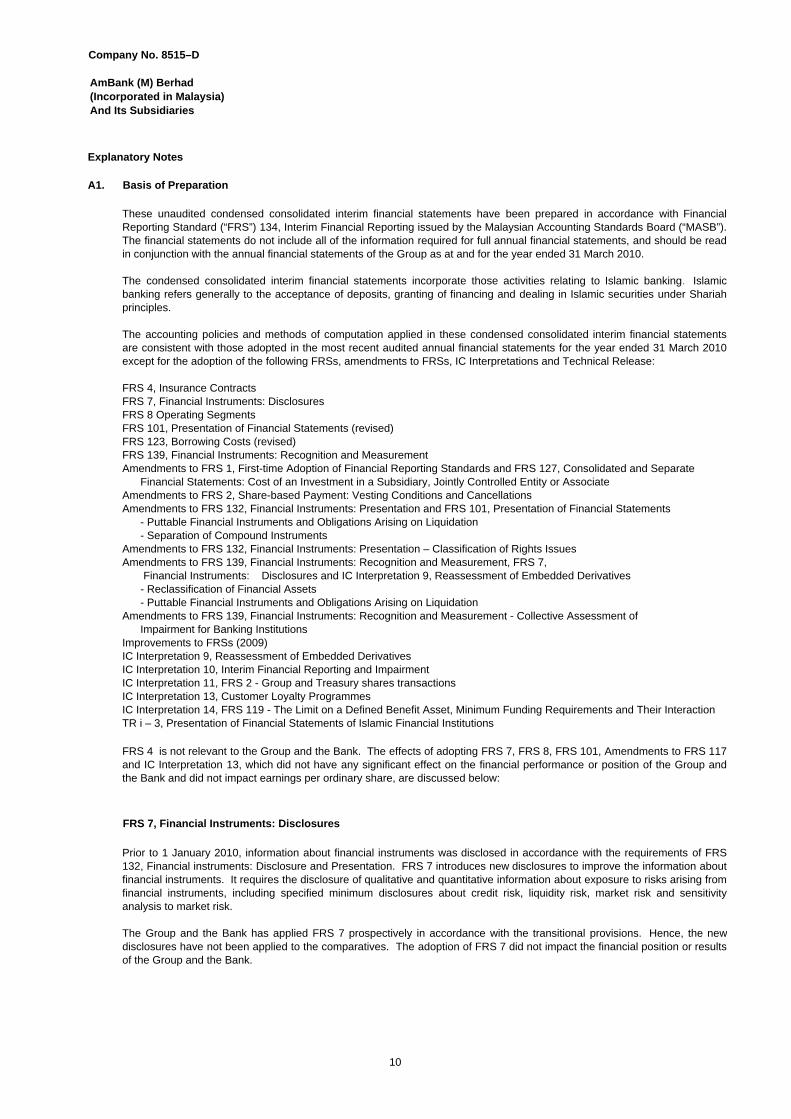
A1. Basis of Preparation
FRS 7, Financial Instruments: Disclosures
These unaudited condensed consolidated interim financial statements have been prepared in accordance with FinancialReporting Standard (“FRS”) 134, Interim Financial Reporting issued by the Malaysian Accounting Standards Board (“MASB”).The financial statements do not include all of the information required for full annual financial statements, and should be readin conjunction with the annual financial statements of the Group as at and for the year ended 31 March 2010.
The condensed consolidated interim financial statements incorporate those activities relating to Islamic banking. Islamicbanking refers generally to the acceptance of deposits, granting of financing and dealing in Islamic securities under Shariahprinciples.
The accounting policies and methods of computation applied in these condensed consolidated interim financial statementsare consistent with those adopted in the most recent audited annual financial statements for the year ended 31 March 2010except for the adoption of the following FRSs, amendments to FRSs, IC Interpretations and Technical Release:
FRS 4, Insurance ContractsFRS 7, Financial Instruments: DisclosuresFRS 8 Operating SegmentsFRS 101, Presentation of Financial Statements (revised)FRS 123, Borrowing Costs (revised)FRS 139, Financial Instruments: Recognition and MeasurementAmendments to FRS 1, First-time Adoption of Financial Reporting Standards and FRS 127, Consolidated and Separate Financial Statements: Cost of an Investment in a Subsidiary, Jointly Controlled Entity or AssociateAmendments to FRS 2, Share-based Payment: Vesting Conditions and CancellationsAmendments to FRS 132, Financial Instruments: Presentation and FRS 101, Presentation of Financial Statements - Puttable Financial Instruments and Obligations Arising on Liquidation - Separation of Compound InstrumentsAmendments to FRS 132, Financial Instruments: Presentation – Classification of Rights IssuesAmendments to FRS 139, Financial Instruments: Recognition and Measurement, FRS 7, Financial Instruments: Disclosures and IC Interpretation 9, Reassessment of Embedded Derivatives - Reclassification of Financial Assets - Puttable Financial Instruments and Obligations Arising on LiquidationAmendments to FRS 139, Financial Instruments: Recognition and Measurement - Collective Assessment of Impairment for Banking InstitutionsImprovements to FRSs (2009)IC Interpretation 9, Reassessment of Embedded DerivativesIC Interpretation 10, Interim Financial Reporting and ImpairmentIC Interpretation 11, FRS 2 - Group and Treasury shares transactionsIC Interpretation 13, Customer Loyalty ProgrammesIC Interpretation 14, FRS 119 - The Limit on a Defined Benefit Asset, Minimum Funding Requirements and Their InteractionTR i – 3, Presentation of Financial Statements of Islamic Financial Institutions
Prior to 1 January 2010, information about financial instruments was disclosed in accordance with the requirements of FRS132, Financial instruments: Disclosure and Presentation. FRS 7 introduces new disclosures to improve the information aboutfinancial instruments. It requires the disclosure of qualitative and quantitative information about exposure to risks arising fromfinancial instruments, including specified minimum disclosures about credit risk, liquidity risk, market risk and sensitivityanalysis to market risk.
The Group and the Bank has applied FRS 7 prospectively in accordance with the transitional provisions. Hence, the newdisclosures have not been applied to the comparatives. The adoption of FRS 7 did not impact the financial position or resultsof the Group and the Bank.
FRS 4 is not relevant to the Group and the Bank. The effects of adopting FRS 7, FRS 8, FRS 101, Amendments to FRS 117and IC Interpretation 13, which did not have any significant effect on the financial performance or position of the Group andthe Bank and did not impact earnings per ordinary share, are discussed below:
10
Company No. 8515–D
AmBank (M) Berhad (Incorporated in Malaysia) And Its Subsidiaries
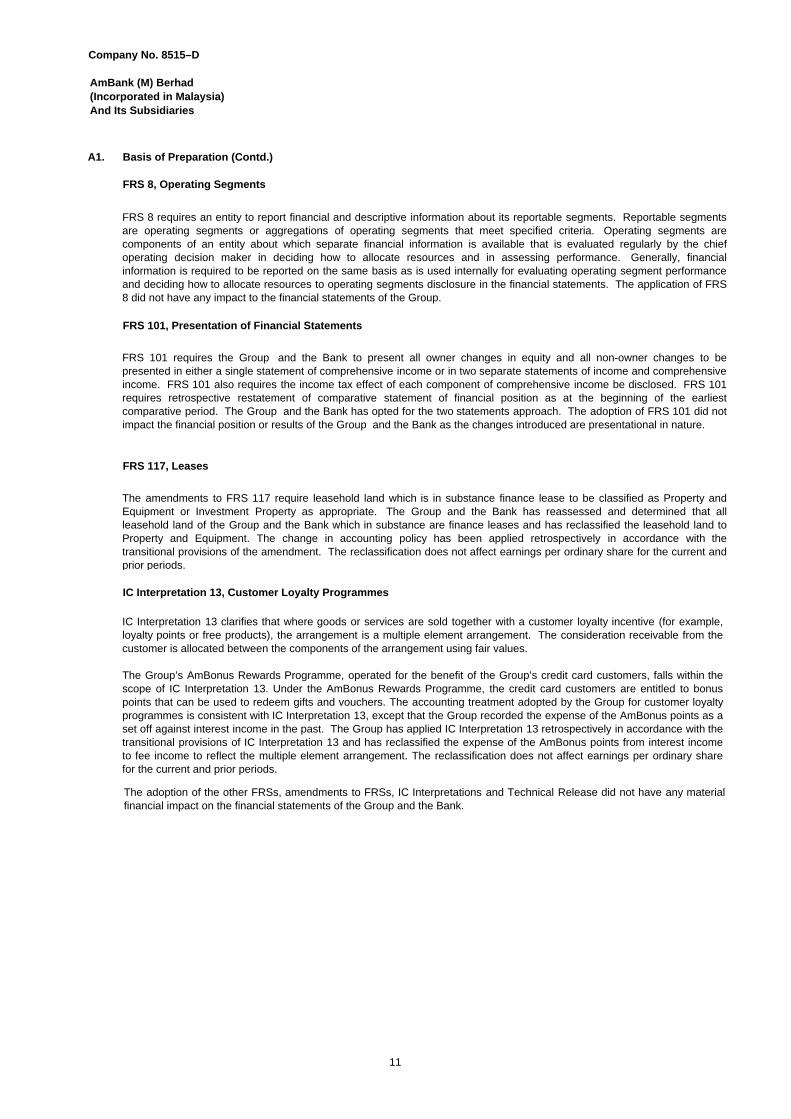
A1. Basis of Preparation (Contd.)
FRS 8, Operating Segments
FRS 101, Presentation of Financial Statements
FRS 117, Leases
IC Interpretation 13, Customer Loyalty Programmes
FRS 101 requires the Group and the Bank to present all owner changes in equity and all non-owner changes to bepresented in either a single statement of comprehensive income or in two separate statements of income and comprehensiveincome. FRS 101 also requires the income tax effect of each component of comprehensive income be disclosed. FRS 101requires retrospective restatement of comparative statement of financial position as at the beginning of the earliestcomparative period. The Group and the Bank has opted for the two statements approach. The adoption of FRS 101 did notimpact the financial position or results of the Group and the Bank as the changes introduced are presentational in nature.
The amendments to FRS 117 require leasehold land which is in substance finance lease to be classified as Property andEquipment or Investment Property as appropriate. The Group and the Bank has reassessed and determined that allleasehold land of the Group and the Bank which in substance are finance leases and has reclassified the leasehold land toProperty and Equipment. The change in accounting policy has been applied retrospectively in accordance with thetransitional provisions of the amendment. The reclassification does not affect earnings per ordinary share for the current andprior periods.
FRS 8 requires an entity to report financial and descriptive information about its reportable segments. Reportable segmentsare operating segments or aggregations of operating segments that meet specified criteria. Operating segments arecomponents of an entity about which separate financial information is available that is evaluated regularly by the chiefoperating decision maker in deciding how to allocate resources and in assessing performance. Generally, financialinformation is required to be reported on the same basis as is used internally for evaluating operating segment performanceand deciding how to allocate resources to operating segments disclosure in the financial statements. The application of FRS8 did not have any impact to the financial statements of the Group.
The adoption of the other FRSs, amendments to FRSs, IC Interpretations and Technical Release did not have any materialfinancial impact on the financial statements of the Group and the Bank.
IC Interpretation 13 clarifies that where goods or services are sold together with a customer loyalty incentive (for example,loyalty points or free products), the arrangement is a multiple element arrangement. The consideration receivable from thecustomer is allocated between the components of the arrangement using fair values.
The Group’s AmBonus Rewards Programme, operated for the benefit of the Group’s credit card customers, falls within thescope of IC Interpretation 13. Under the AmBonus Rewards Programme, the credit card customers are entitled to bonuspoints that can be used to redeem gifts and vouchers. The accounting treatment adopted by the Group for customer loyaltyprogrammes is consistent with IC Interpretation 13, except that the Group recorded the expense of the AmBonus points as aset off against interest income in the past. The Group has applied IC Interpretation 13 retrospectively in accordance with thetransitional provisions of IC Interpretation 13 and has reclassified the expense of the AmBonus points from interest incometo fee income to reflect the multiple element arrangement. The reclassification does not affect earnings per ordinary sharefor the current and prior periods.
11
Company No. 8515–D
AmBank (M) Berhad (Incorporated in Malaysia) And Its Subsidiaries
A1. Basis of Preparation (Contd.)
TR 3, Guidance on Disclosures of Transition to IFRSs
FRSs, IC Interpretations and amendments effective for annual periods beginning on or after 1 January 2011
FRSs, IC Interpretations and amendments effective for annual periods beginning on or after 1 January 2012
Amendment to IC Interpretation 15, Agreements for the Construction of Real Estate
Change in accounting policies
(i) FRS 139, Financial Instruments: Recognition and Measurement(ii) IC Interpretation 9, Reassessment of Embedded Derivatives(iii)
‐ Reclassification of Financial Assets‐ Puttable Financial Instruments and Obligations Arising on Liquidation
(iv)
(v) IC Interpretation 13, Customer Loyalty Programmes
FRSs, IC Interpretations and amendments effective for annual periods beginning on or after 1 July 2010
FRS 1, First-time Adoption of Financial Reporting Standards (revised)FRS 3, Business Combinations (revised)FRS 127, Consolidated and Separate Financial Statements (revised)Amendments to FRS 2, Share-based PaymentAmendments to FRS 5, Non-current Assets Held for Sale and Discontinued OperationsAmendments to FRS138, Intangible AssetsAmendments to IC Interpretation 9, Reassessment of Embedded DerivativesIC Interpretation 12, Service Concession ArrangementsIC Interpretation I5, Agreements for the Construction of Real EstateIC Interpretation 16, Hedges of a Net Investment in a Foreign OperationIC Interpretation 17, Distributions of Non-cash Assets to Owners
Technical Release effective for annual periods ending on or after 31 December 2010
Amendments to FRS 1, First-time Adoption of Financial Reporting Standards - Limited Exemption from Comparative FRS 7 Disclosures for First-time Adopters- Additional Exemptions for First-time AdoptersAmendments to FRS 2, Share-based Payment – Group Cash-settled Share-based Payment TransactionsAmendments to FRS 7, Financial Instruments: Disclosures – Improving Disclosures about Financial InstrumentsIC Interpretation 4, Determining whether an Arrangement contains a LeaseIC Interpretation 18, Transfers of Assets from CustomersTR i – 4, Shariah Compliant Sale Contracts
The adoption of new and revised FRSs during the financial period have resulted in changes to the following accountingpolicies:
Amendments to FRS 139, Financial Instruments: Recognition and Measurement, FRS 7, Financial Instruments:Disclosures and IC Interpretation 9, Reassessment of Embedded Derivatives
Amendments to FRS 139, Financial Instruments: Recognition and Measurement - Collective Assessment ofImpairment for Banking Institutions
At the date of authorisation of these condensed consolidated interim financial statements, the following revised FRSs, new ICInterpretations and Amendments to certain FRSs and IC Interpretations have been issued by the MASB but are not yeteffective for, and have not been applied by, the Group and the Bank:
12
Company No. 8515–D
AmBank (M) Berhad (Incorporated in Malaysia) And Its Subsidiaries
A1. Basis of Preparation (Contd.)
FRS 139, Financial Instruments: Recognition and Measurement
(i) Impairment of Loans, Advances and Financing
(ii) Interest Income Recognition
FRS 139 establishes the principles for the recognition, derecognition and measurement of an entity's financial instrumentsand for hedge accounting. However, since the adoption of BNM's revised BNM/GP8 – Guidelines on Financial Reporting forLicensed Institutions on 1 January 2005, certain principles in connection with the recognition, derecognition andmeasurement of financial instruments, including derivative instruments, and hedge accounting which are similar to thoseprescribed by FRS 139 have already been adopted by the Group and the Bank. Therefore, the adoption of the full FRS 139on 1 April 2010 resulted in changes in the following areas:
The adoption of FRS 139 changes the accounting policy relating to the assessment for impairment of financialassets, particularly loans, advances and financing. The existing accounting policies on the assessment ofimpairment of other financial assets of the Group are generally in line with those of FRS 139. Prior to the adoptionof FRS 139, allowances for impaired loans, advances and financing (previously referred to as non-performing loans)were computed in conformity with the BNM/GP3 Guidelines on Classification of Non-Performing Loans andProvision for Substandard, Bad and Doubtful Debts. On adoption of FRS 139, the Group and the Bank assesses, atthe end of each reporting period, whether there is any objective evidence that a loan or group of loans is impaired.The loan or group of loans is deemed to be impaired if, and only if, there is objective evidence of impairment as aresult of one or more events that has occurred after the initial recognition of the loan (an incurred 'loss event') andthat the loss event has an impact on the estimated future cash flows of the loan or group of loans that can bereliably estimated.
The Group and the Bank first assesses individually whether objective evidence of impairment exists individually forloans which are individually significant, and collectively for loans which are not individually significant. If it isdetermined that no objective evidence of impairment exists for an individually assessed loan, the loan is included ina group of loans with similar credit risk characteristics for purposes of calculating an estimated collective loss.Future cash flows on a group of financial assets that are collectively assessed for impairment are estimated on thebasis of historical loss experience for assets with credit risk characteristics similar to those in the group.
If there is objective evidence that an impairment loss has been incurred, the amount of the loss is measured as thedifference between the loan's carrying amount and the present value of the estimated future cash flows. Thecarrying amount of the loan is reduced through the use of an allowance account and the amount of the loss isrecognised in profit or loss.
The Group and the Bank is currently reporting under BNM’s transitional arrangement as prescribed in its guidelineson Classification and Impairment Provisions for Loans/Financing issued on 8 January 2010 and as allowed by theMASB in its Amendments to FRS 139 issued on the same date. Pursuant to this transitional arrangement, bankinginstitutions are required to maintain collective assessment impairment allowances of at least 1.5% of totaloutstanding loans/financing, net of individual impairment allowance.
The changes in accounting policies above have been accounted for prospectively, in line with the transitionalarrangements in paragraph 103AA of FRS 139, with adjustments to the carrying values of financial assets affectingprofit or loss as at the beginning of the current financial period being adjusted to opening retained earnings.
FRS 139 prescribes that financial assets classified as held-to-maturity and loans and receivables are measured atamortised cost using the effective interest method. On adoption of FRS 139 on 1 April 2010, interest income on itsloans, advances and financing is no longer recognised based on contractual interest rates but the effective interestrate ("EIR") is applied instead. EIR refers to the rate that exactly discounts estimated future cash receipts throughthe expected life of the loan or, when appropriate, a shorter period to the net carrying amount of the loan.
This change in accounting policy has been accounted for prospectively in line with the transitional arrangements inparagraph 103AA of FRS 139 with resulting adjustments being adjusted to opening retained earnings.
13
Company No. 8515–D
AmBank (M) Berhad (Incorporated in Malaysia) And Its Subsidiaries
A1. Basis of Preparation (Contd.)
FRS 139, Financial Instruments: Recognition and Measurement (Contd.)
(ii) Interest Income Recognition (Contd.)
(iii) Recognition of Embedded Derivatives
A2. Audit Qualification
A3. Seasonality or Cyclicality of Operations
A4. Unusual Items
A5. Use of Estimates
A6.
There were no issuance, cancellation, repurchase, resale and repayment of debt securities during the financial quarter andperiod.
There were no share buy-backs, share cancellations, shares held as treasury shares nor resale of treasury shares by theBank during the financial quarter and period.
The auditors’ report on the audited annual financial statements for the financial year ended 31 March 2010 was not qualified.
The operations of the Group are not subject to seasonal or cyclical fluctuation in the current financial quarter and period.
There were no unusual items during the current financial quarter and period.
There was no material change in estimates of amounts reported in prior financial years that have a material effect on thefinancial quarter and period ended 30 September 2010.
Issuance, Cancellation, Repurchase, Resale and Repayment of Debt and Equity Securities
On adoption of FRS 139, embedded derivatives are to be separated from the host contract and accounted for as aderivative if the economic characteristics and risks of the embedded derivatives are not closely related to that of thehost contract and the fair value of the resulting derivative can be reliably measured.
The Group and the Bank has assessed the impact of this requirement on adoption of FRS 139 on 1 April 2010 andconcluded that there were no material embedded derivatives which were not closely related to the host contractsand which required bifurcation.
The adoption of FRS 139 and its related amendments did not impact earnings per ordinary share.
Prior to the adoption of FRS 139, interest accrued and recognised as income prior to the date that a loan isclassified as non-performing is reversed out of income and set-off against the interest receivable account in thestatement of financial position. Thereafter, interest on the non-performing loan is recognised as income on a cashbasis. On adoption of FRS 139, once a loan has been written down for impairment loss, subsequent interest incomethereon is thereafter recognised using the rate of interest used to discount the future cash flows for the purpose ofmeasuring the impairment loss. As a result of this change, the resulting adjustments have been taken up in theopening retained earnings.
14
Company No. 8515–D
AmBank (M) Berhad (Incorporated in Malaysia) And Its Subsidiaries
A7. Dividends Paid
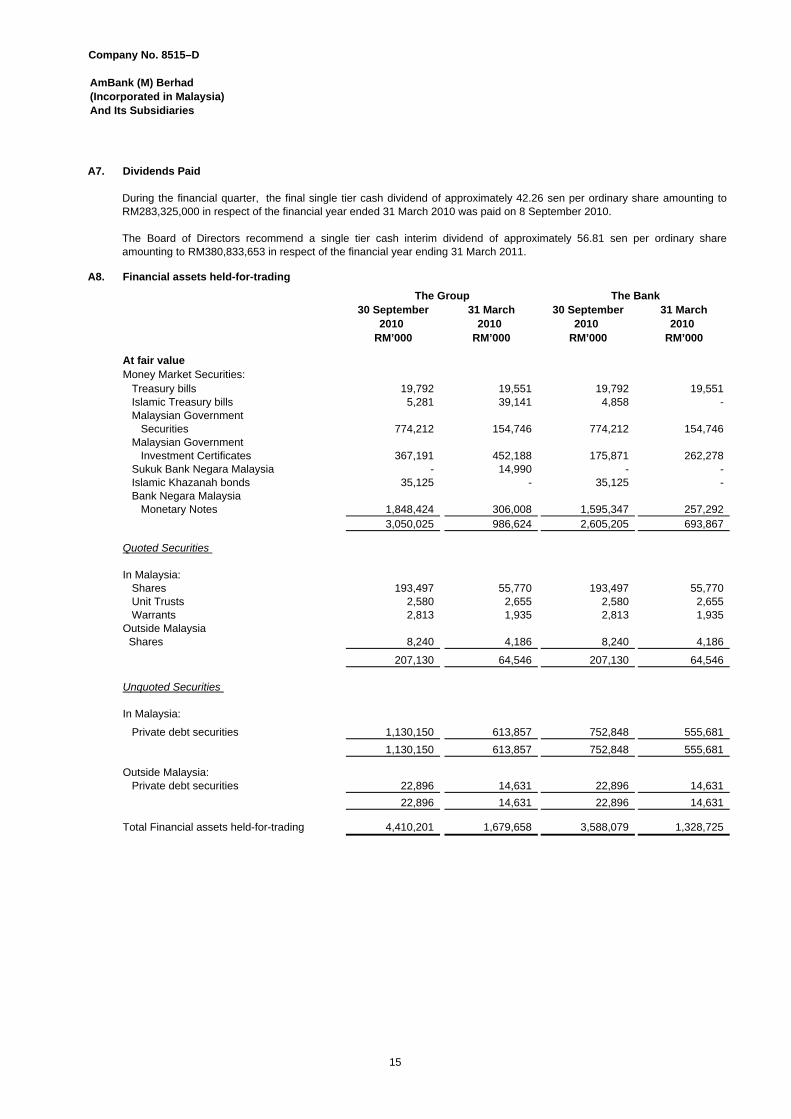
A8. Financial assets held-for-trading
30 September 31 March 30 September 31 March2010 2010 2010 2010
RM’000 RM’000 RM’000 RM’000
At fair valueMoney Market Securities: Treasury bills 19,792 19,551 19,792 19,551 Islamic Treasury bills 5,281 39,141 4,858 - Malaysian Government Securities 774,212 154,746 774,212 154,746 Malaysian Government Investment Certificates 367,191 452,188 175,871 262,278 Sukuk Bank Negara Malaysia - 14,990 - - Islamic Khazanah bonds 35,125 - 35,125 - Bank Negara Malaysia Monetary Notes 1,848,424 306,008 1,595,347 257,292
3,050,025 986,624 2,605,205 693,867
Quoted Securities
In Malaysia: Shares 193,497 55,770 193,497 55,770 Unit Trusts 2,580 2,655 2,580 2,655 Warrants 2,813 1,935 2,813 1,935 Outside Malaysia Shares 8,240 4,186 8,240 4,186
207,130 64,546 207,130 64,546
Unquoted Securities
In Malaysia:
Private debt securities 1,130,150 613,857 752,848 555,681
1,130,150 613,857 752,848 555,681
Outside Malaysia: Private debt securities 22,896 14,631 22,896 14,631
22,896 14,631 22,896 14,631
Total Financial assets held-for-trading 4,410,201 1,679,658 3,588,079 1,328,725
The BankThe Group
During the financial quarter, the final single tier cash dividend of approximately 42.26 sen per ordinary share amounting toRM283,325,000 in respect of the financial year ended 31 March 2010 was paid on 8 September 2010.
The Board of Directors recommend a single tier cash interim dividend of approximately 56.81 sen per ordinary shareamounting to RM380,833,653 in respect of the financial year ending 31 March 2011.
15
Company No. 8515–D
AmBank (M) Berhad (Incorporated in Malaysia) And Its Subsidiaries
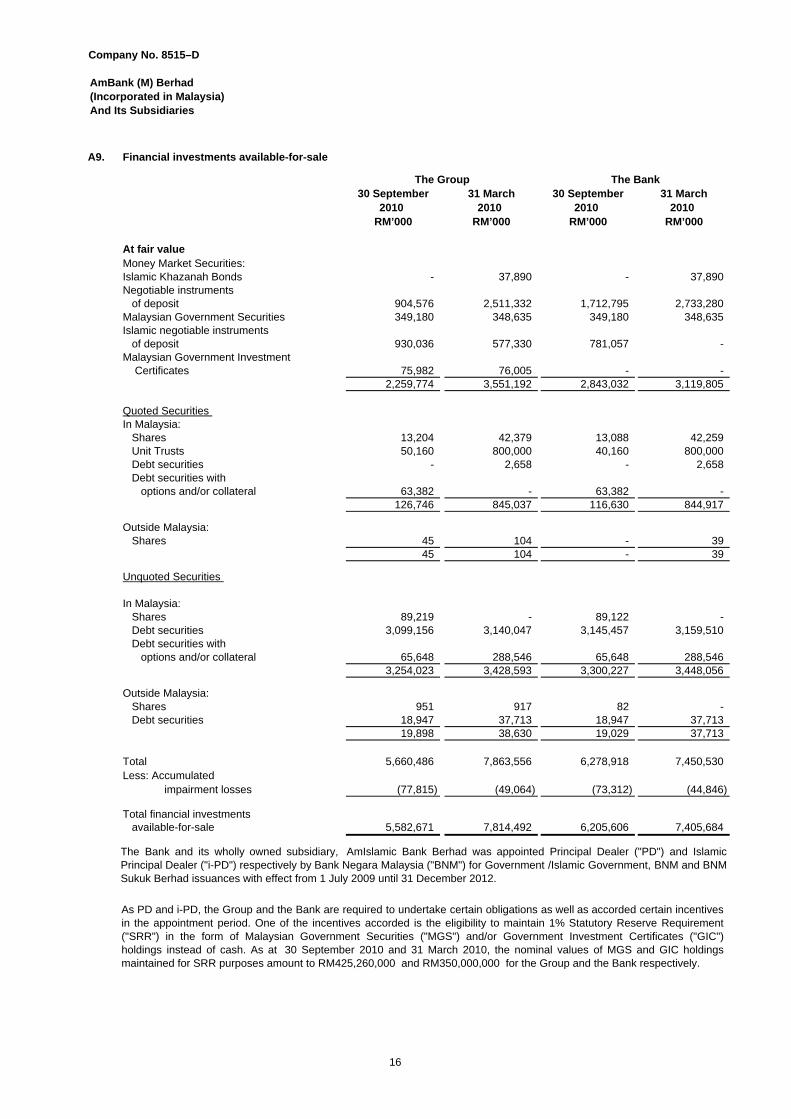
A9.
30 September 31 March 30 September 31 March2010 2010 2010 2010
RM’000 RM’000 RM’000 RM’000
At fair valueMoney Market Securities:Islamic Khazanah Bonds - 37,890 - 37,890 Negotiable instruments of deposit 904,576 2,511,332 1,712,795 2,733,280 Malaysian Government Securities 349,180 348,635 349,180 348,635 Islamic negotiable instruments of deposit 930,036 577,330 781,057 - Malaysian Government Investment Certificates 75,982 76,005 - -
2,259,774 3,551,192 2,843,032 3,119,805
Quoted Securities In Malaysia: Shares 13,204 42,379 13,088 42,259 Unit Trusts 50,160 800,000 40,160 800,000 Debt securities - 2,658 - 2,658 Debt securities with options and/or collateral 63,382 - 63,382 -
126,746 845,037 116,630 844,917
Outside Malaysia: Shares 45 104 - 39
45 104 - 39
Unquoted Securities
In Malaysia: Shares 89,219 - 89,122 - Debt securities 3,099,156 3,140,047 3,145,457 3,159,510 Debt securities with options and/or collateral 65,648 288,546 65,648 288,546
3,254,023 3,428,593 3,300,227 3,448,056
Outside Malaysia: Shares 951 917 82 - Debt securities 18,947 37,713 18,947 37,713
19,898 38,630 19,029 37,713
Total 5,660,486 7,863,556 6,278,918 7,450,530 Less: Accumulated
impairment losses (77,815) (49,064) (73,312) (44,846)
Total financial investments available-for-sale 5,582,671 7,814,492 6,205,606 7,405,684
The Group
Financial investments available-for-sale
The Bank
As PD and i-PD, the Group and the Bank are required to undertake certain obligations as well as accorded certain incentivesin the appointment period. One of the incentives accorded is the eligibility to maintain 1% Statutory Reserve Requirement("SRR") in the form of Malaysian Government Securities ("MGS") and/or Government Investment Certificates ("GIC")holdings instead of cash. As at 30 September 2010 and 31 March 2010, the nominal values of MGS and GIC holdingsmaintained for SRR purposes amount to RM425,260,000 and RM350,000,000 for the Group and the Bank respectively.
The Bank and its wholly owned subsidiary, AmIslamic Bank Berhad was appointed Principal Dealer ("PD") and IslamicPrincipal Dealer ("i-PD") respectively by Bank Negara Malaysia ("BNM") for Government /Islamic Government, BNM and BNMSukuk Berhad issuances with effect from 1 July 2009 until 31 December 2012.
16
Company No. 8515–D
AmBank (M) Berhad (Incorporated in Malaysia) And Its Subsidiaries
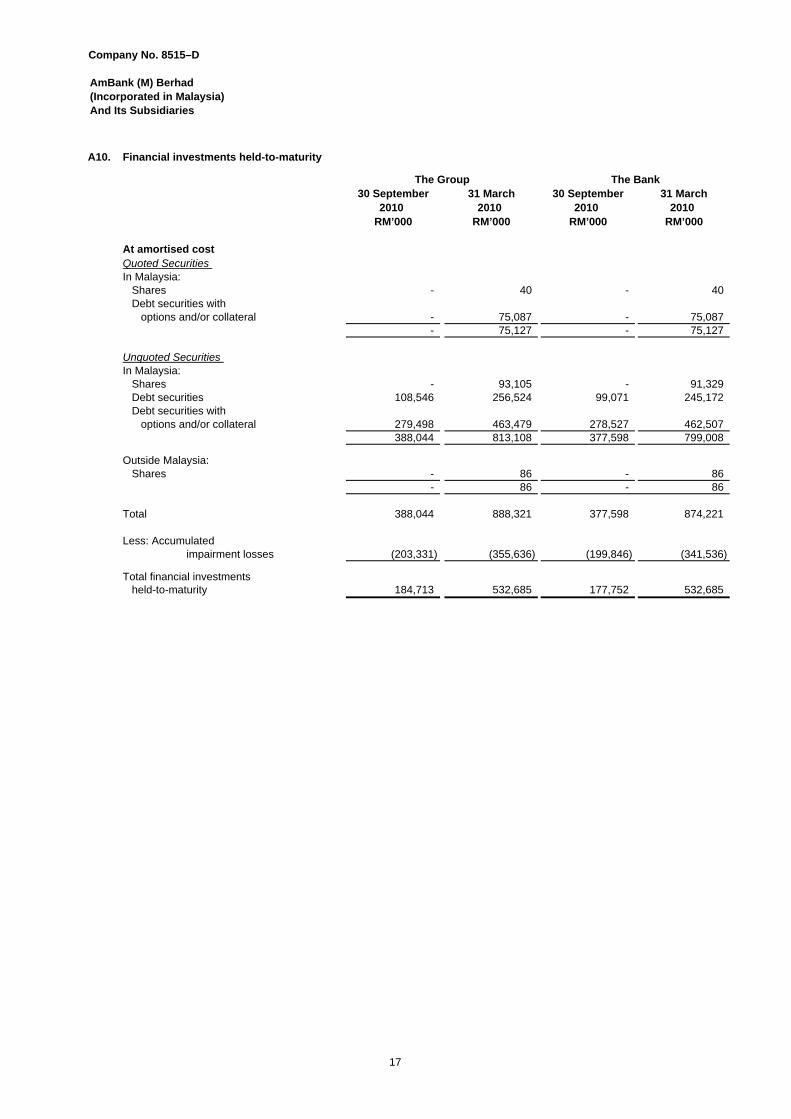
A10. Financial investments held-to-maturity
30 September 31 March 30 September 31 March2010 2010 2010 2010
RM’000 RM’000 RM’000 RM’000
At amortised costQuoted Securities In Malaysia: Shares - 40 - 40 Debt securities with options and/or collateral - 75,087 - 75,087
- 75,127 - 75,127
Unquoted Securities In Malaysia: Shares - 93,105 - 91,329 Debt securities 108,546 256,524 99,071 245,172 Debt securities with options and/or collateral 279,498 463,479 278,527 462,507
388,044 813,108 377,598 799,008
Outside Malaysia: Shares - 86 - 86
- 86 - 86
Total 388,044 888,321 377,598 874,221
Less: Accumulated impairment losses (203,331) (355,636) (199,846) (341,536)
Total financial investments held-to-maturity 184,713 532,685 177,752 532,685
The Group The Bank
17
Company No. 8515–D
AmBank (M) Berhad (Incorporated in Malaysia) And Its Subsidiaries
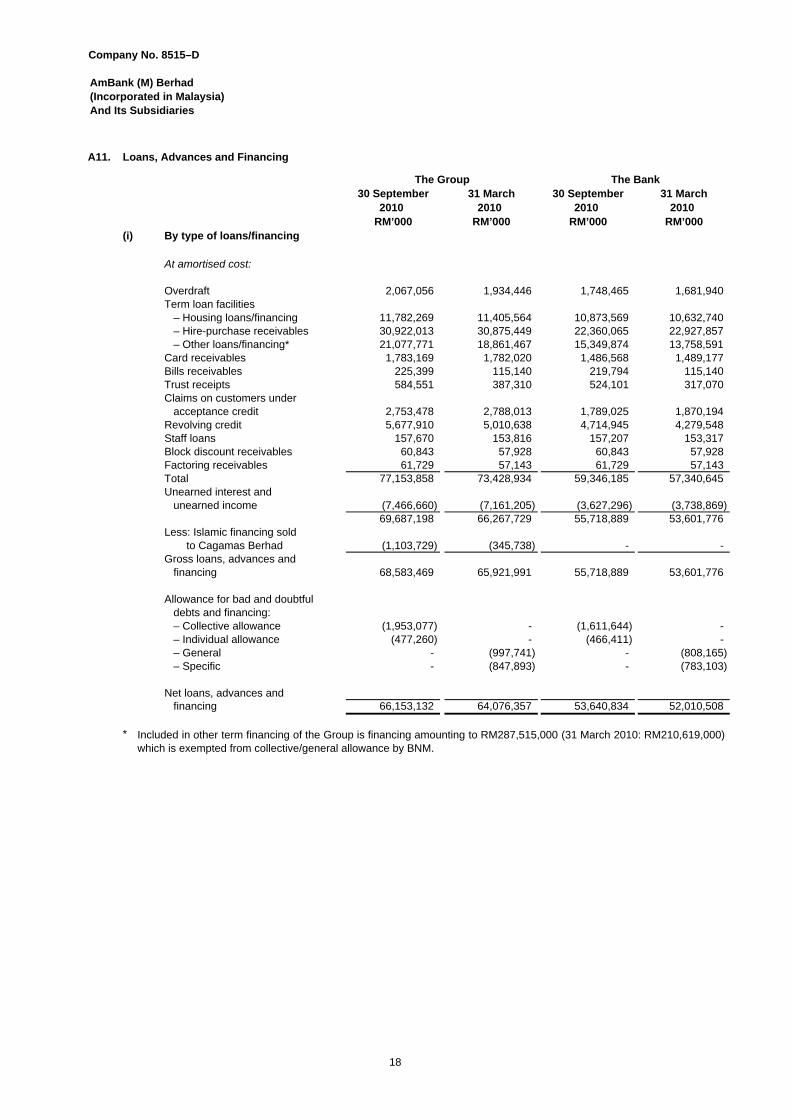
A11. Loans, Advances and Financing
30 September 31 March 30 September 31 March2010 2010 2010 2010
RM’000 RM’000 RM’000 RM’000(i) By type of loans/financing
At amortised cost:
Overdraft 2,067,056 1,934,446 1,748,465 1,681,940 Term loan facilities – Housing loans/financing 11,782,269 11,405,564 10,873,569 10,632,740 – Hire-purchase receivables 30,922,013 30,875,449 22,360,065 22,927,857 – Other loans/financing* 21,077,771 18,861,467 15,349,874 13,758,591 Card receivables 1,783,169 1,782,020 1,486,568 1,489,177 Bills receivables 225,399 115,140 219,794 115,140 Trust receipts 584,551 387,310 524,101 317,070 Claims on customers under acceptance credit 2,753,478 2,788,013 1,789,025 1,870,194 Revolving credit 5,677,910 5,010,638 4,714,945 4,279,548 Staff loans 157,670 153,816 157,207 153,317 Block discount receivables 60,843 57,928 60,843 57,928 Factoring receivables 61,729 57,143 61,729 57,143 Total 77,153,858 73,428,934 59,346,185 57,340,645 Unearned interest and unearned income (7,466,660) (7,161,205) (3,627,296) (3,738,869)
69,687,198 66,267,729 55,718,889 53,601,776 Less: Islamic financing sold
to Cagamas Berhad (1,103,729) (345,738) - -Gross loans, advances and financing 68,583,469 65,921,991 55,718,889 53,601,776
Allowance for bad and doubtful debts and financing: – Collective allowance (1,953,077) - (1,611,644) - – Individual allowance (477,260) - (466,411) - – General - (997,741) - (808,165) – Specific - (847,893) - (783,103)
Net loans, advances and financing 66,153,132 64,076,357 53,640,834 52,010,508
*
The BankThe Group
Included in other term financing of the Group is financing amounting to RM287,515,000 (31 March 2010: RM210,619,000)which is exempted from collective/general allowance by BNM.
18
Company No. 8515–D
AmBank (M) Berhad (Incorporated in Malaysia) And Its Subsidiaries
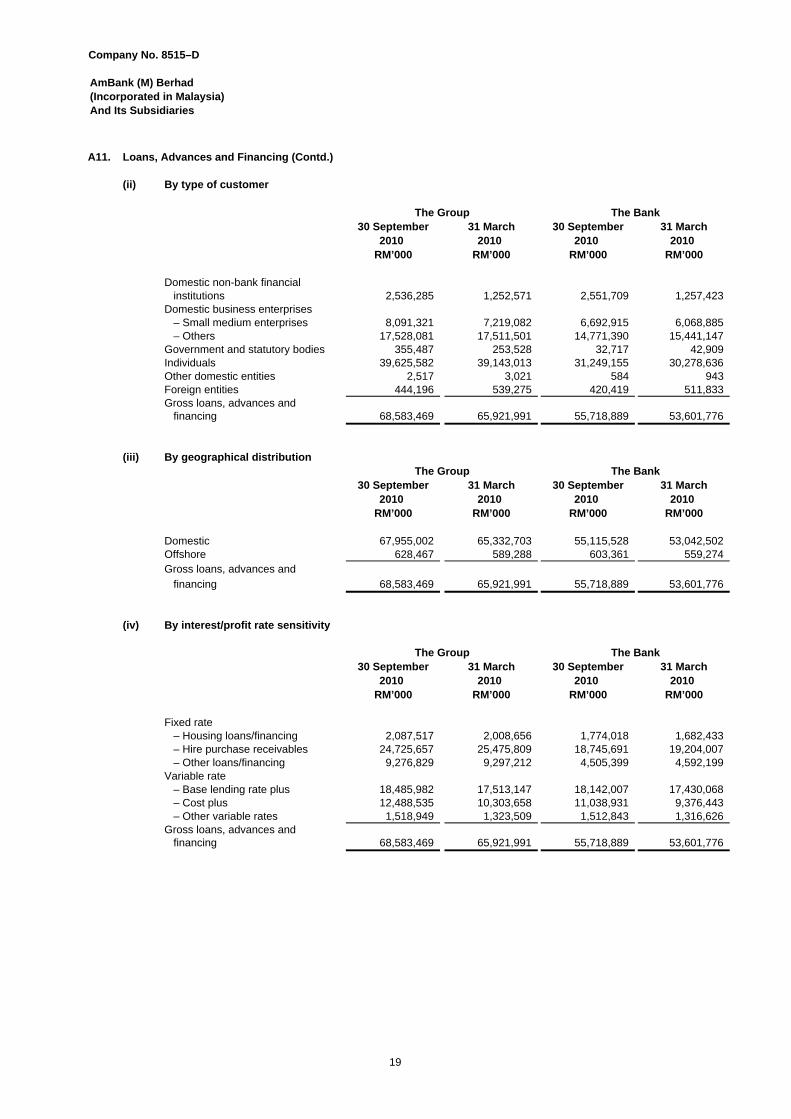
A11. Loans, Advances and Financing (Contd.)
(ii) By type of customer
30 September 31 March 30 September 31 March2010 2010 2010 2010
RM’000 RM’000 RM’000 RM’000
Domestic non-bank financial institutions 2,536,285 1,252,571 2,551,709 1,257,423 Domestic business enterprises – Small medium enterprises 8,091,321 7,219,082 6,692,915 6,068,885 – Others 17,528,081 17,511,501 14,771,390 15,441,147 Government and statutory bodies 355,487 253,528 32,717 42,909 Individuals 39,625,582 39,143,013 31,249,155 30,278,636 Other domestic entities 2,517 3,021 584 943 Foreign entities 444,196 539,275 420,419 511,833 Gross loans, advances and financing 68,583,469 65,921,991 55,718,889 53,601,776
(iii) By geographical distribution
30 September 31 March 30 September 31 March2010 2010 2010 2010
RM’000 RM’000 RM’000 RM’000
Domestic 67,955,002 65,332,703 55,115,528 53,042,502 Offshore 628,467 589,288 603,361 559,274 Gross loans, advances and
financing 68,583,469 65,921,991 55,718,889 53,601,776
(iv) By interest/profit rate sensitivity
30 September 31 March 30 September 31 March2010 2010 2010 2010
RM’000 RM’000 RM’000 RM’000
Fixed rate – Housing loans/financing 2,087,517 2,008,656 1,774,018 1,682,433 – Hire purchase receivables 24,725,657 25,475,809 18,745,691 19,204,007 – Other loans/financing 9,276,829 9,297,212 4,505,399 4,592,199 Variable rate – Base lending rate plus 18,485,982 17,513,147 18,142,007 17,430,068 – Cost plus 12,488,535 10,303,658 11,038,931 9,376,443 – Other variable rates 1,518,949 1,323,509 1,512,843 1,316,626 Gross loans, advances and financing 68,583,469 65,921,991 55,718,889 53,601,776
The Group The Bank
The Group The Bank
The Group The Bank
19
Company No. 8515–D
AmBank (M) Berhad (Incorporated in Malaysia) And Its Subsidiaries
A11. Loans, Advances and Financing (Contd.)
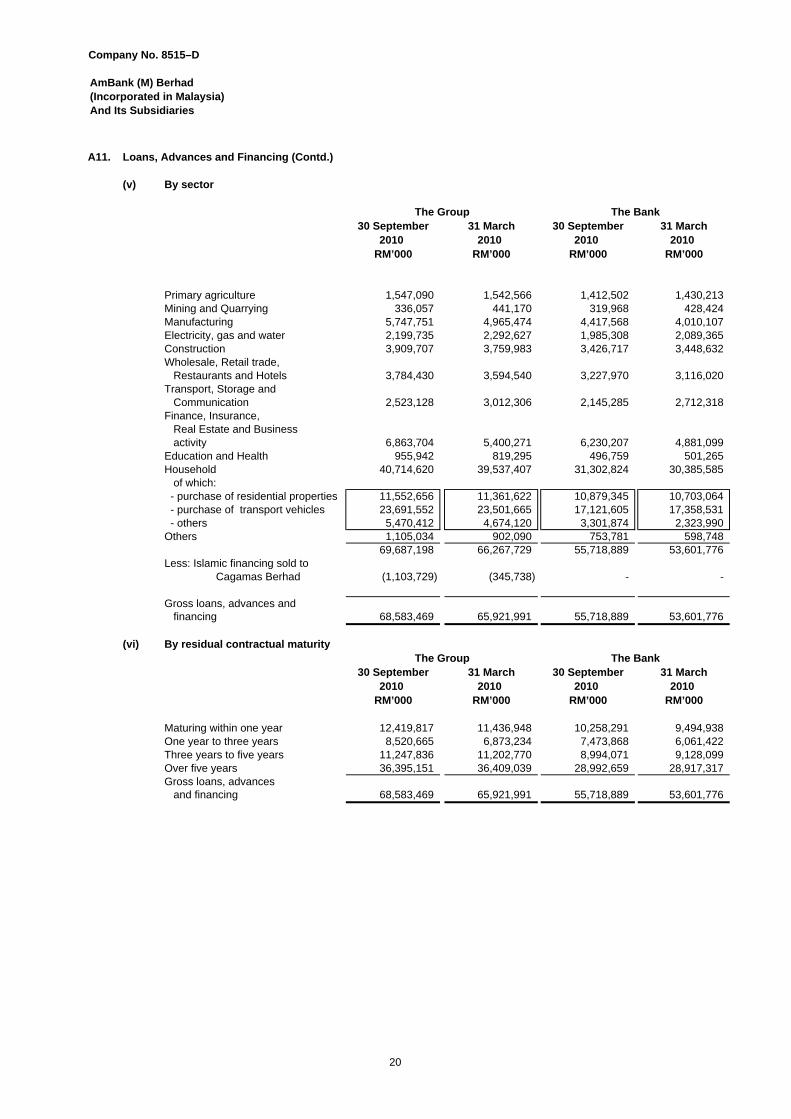
(v) By sector
30 September 31 March 30 September 31 March2010 2010 2010 2010
RM’000 RM’000 RM’000 RM’000
Primary agriculture 1,547,090 1,542,566 1,412,502 1,430,213Mining and Quarrying 336,057 441,170 319,968 428,424Manufacturing 5,747,751 4,965,474 4,417,568 4,010,107Electricity, gas and water 2,199,735 2,292,627 1,985,308 2,089,365Construction 3,909,707 3,759,983 3,426,717 3,448,632Wholesale, Retail trade, Restaurants and Hotels 3,784,430 3,594,540 3,227,970 3,116,020Transport, Storage and Communication 2,523,128 3,012,306 2,145,285 2,712,318Finance, Insurance, Real Estate and Business activity 6,863,704 5,400,271 6,230,207 4,881,099Education and Health 955,942 819,295 496,759 501,265Household 40,714,620 39,537,407 31,302,824 30,385,585 of which: - purchase of residential properties 11,552,656 11,361,622 10,879,345 10,703,064 - purchase of transport vehicles 23,691,552 23,501,665 17,121,605 17,358,531 - others 5,470,412 4,674,120 3,301,874 2,323,990Others 1,105,034 902,090 753,781 598,748
69,687,198 66,267,729 55,718,889 53,601,776 Less: Islamic financing sold to
Cagamas Berhad (1,103,729) (345,738) - -
Gross loans, advances and financing 68,583,469 65,921,991 55,718,889 53,601,776
(vi) By residual contractual maturity
30 September 31 March 30 September 31 March2010 2010 2010 2010
RM’000 RM’000 RM’000 RM’000
Maturing within one year 12,419,817 11,436,948 10,258,291 9,494,938 One year to three years 8,520,665 6,873,234 7,473,868 6,061,422 Three years to five years 11,247,836 11,202,770 8,994,071 9,128,099 Over five years 36,395,151 36,409,039 28,992,659 28,917,317 Gross loans, advances and financing 68,583,469 65,921,991 55,718,889 53,601,776
The Group The Bank
The BankThe Group
20
Company No. 8515–D
AmBank (M) Berhad (Incorporated in Malaysia) And Its Subsidiaries
A11. Loans, Advances and Financing (Contd.)
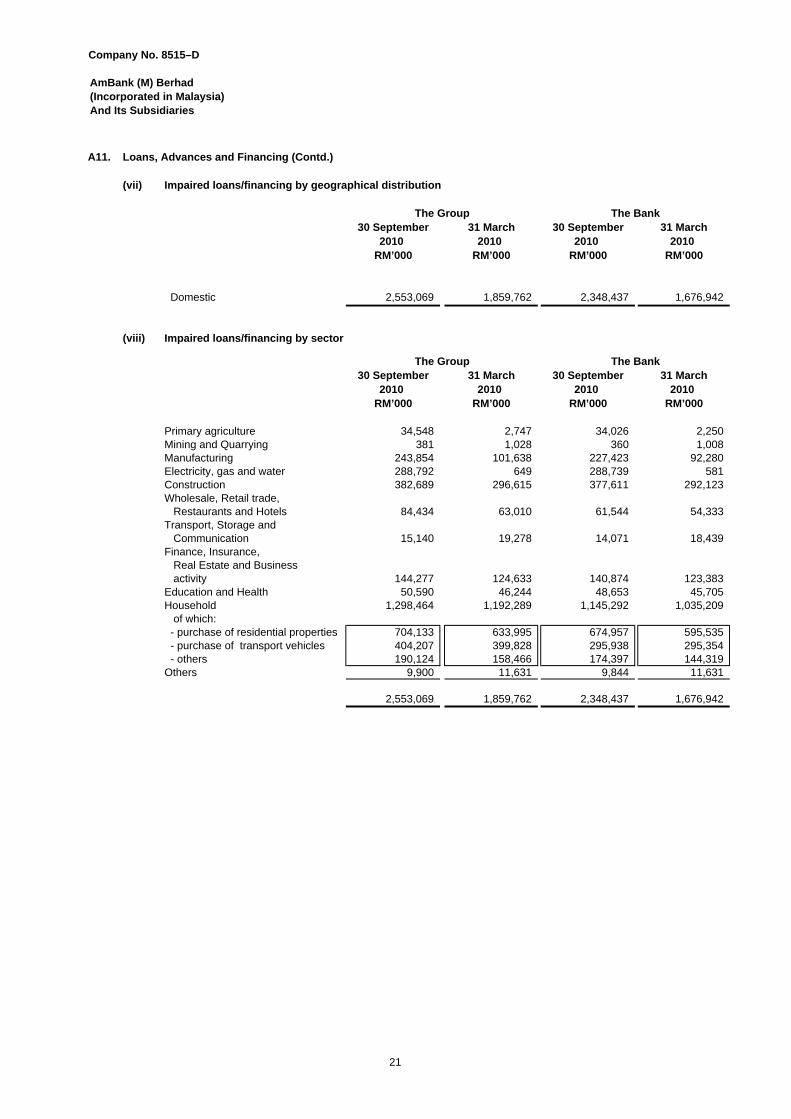
(vii) Impaired loans/financing by geographical distribution
30 September 31 March 30 September 31 March2010 2010 2010 2010
RM’000 RM’000 RM’000 RM’000
Domestic 2,553,069 1,859,762 2,348,437 1,676,942
(viii) Impaired loans/financing by sector
30 September 31 March 30 September 31 March2010 2010 2010 2010
RM’000 RM’000 RM’000 RM’000
Primary agriculture 34,548 2,747 34,026 2,250Mining and Quarrying 381 1,028 360 1,008Manufacturing 243,854 101,638 227,423 92,280Electricity, gas and water 288,792 649 288,739 581Construction 382,689 296,615 377,611 292,123Wholesale, Retail trade, Restaurants and Hotels 84,434 63,010 61,544 54,333Transport, Storage and Communication 15,140 19,278 14,071 18,439Finance, Insurance, Real Estate and Business activity 144,277 124,633 140,874 123,383Education and Health 50,590 46,244 48,653 45,705Household 1,298,464 1,192,289 1,145,292 1,035,209 of which: - purchase of residential properties 704,133 633,995 674,957 595,535 - purchase of transport vehicles 404,207 399,828 295,938 295,354 - others 190,124 158,466 174,397 144,319Others 9,900 11,631 9,844 11,631
2,553,069 1,859,762 2,348,437 1,676,942
The Bank
The Group
The Group
The Bank
21
Company No. 8515–D
AmBank (M) Berhad (Incorporated in Malaysia) And Its Subsidiaries
A11. Loans, Advances and Financing (Contd.)
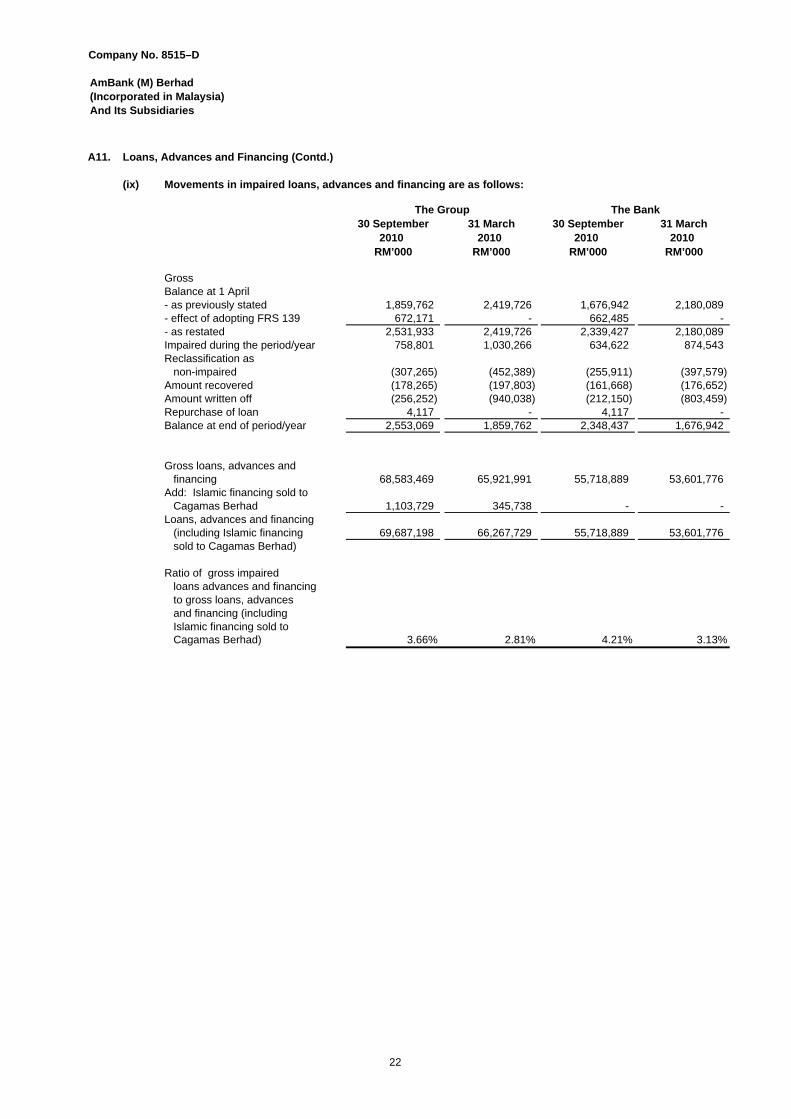
(ix) Movements in impaired loans, advances and financing are as follows:
30 September 31 March 30 September 31 March2010 2010 2010 2010
RM’000 RM’000 RM’000 RM’000
GrossBalance at 1 April- as previously stated 1,859,762 2,419,726 1,676,942 2,180,089 - effect of adopting FRS 139 672,171 - 662,485 - - as restated 2,531,933 2,419,726 2,339,427 2,180,089 Impaired during the period/year 758,801 1,030,266 634,622 874,543 Reclassification as non-impaired (307,265) (452,389) (255,911) (397,579) Amount recovered (178,265) (197,803) (161,668) (176,652) Amount written off (256,252) (940,038) (212,150) (803,459) Repurchase of loan 4,117 - 4,117 - Balance at end of period/year 2,553,069 1,859,762 2,348,437 1,676,942
Gross loans, advances and financing 68,583,469 65,921,991 55,718,889 53,601,776 Add: Islamic financing sold to Cagamas Berhad 1,103,729 345,738 - - Loans, advances and financing (including Islamic financing 69,687,198 66,267,729 55,718,889 53,601,776 sold to Cagamas Berhad)
Ratio of gross impaired loans advances and financing to gross loans, advances and financing (including Islamic financing sold to Cagamas Berhad) 3.66% 2.81% 4.21% 3.13%
The Group The Bank
22
Company No. 8515–D
AmBank (M) Berhad (Incorporated in Malaysia) And Its Subsidiaries
A11. Loans, Advances and Financing (Contd.)
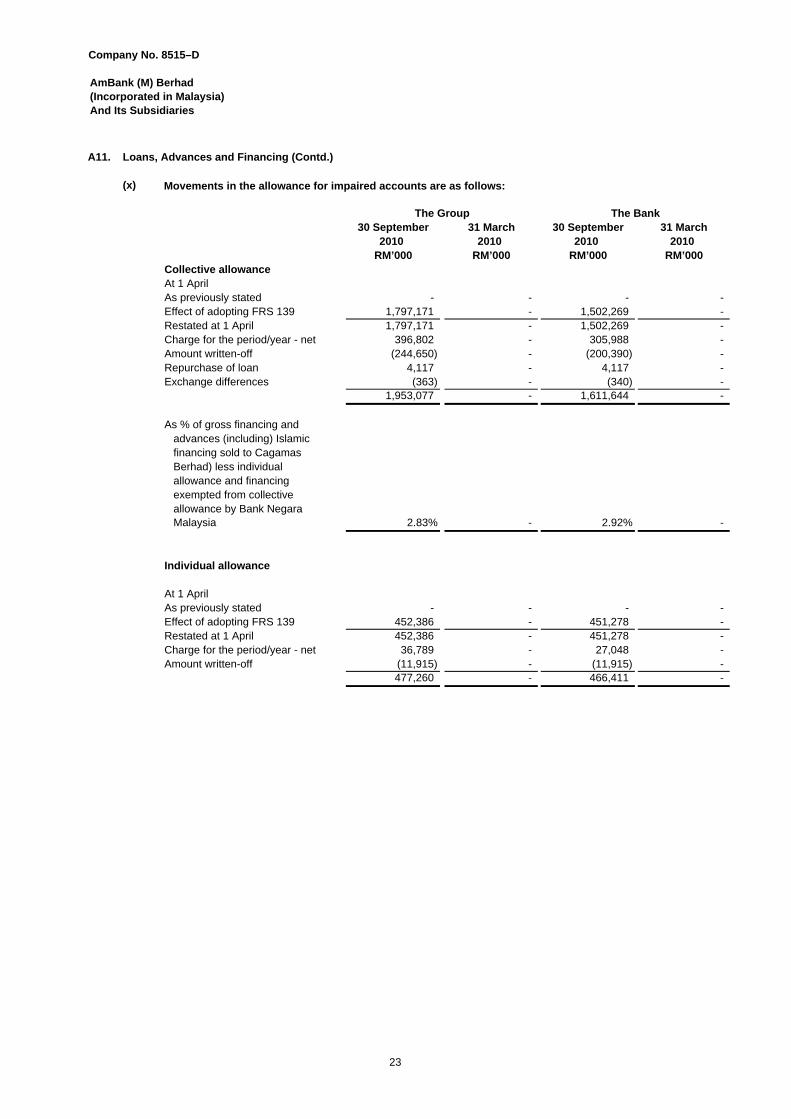
(x)
30 September 31 March 30 September 31 March2010 2010 2010 2010
RM’000 RM’000 RM’000 RM’000Collective allowanceAt 1 AprilAs previously stated - - - - Effect of adopting FRS 139 1,797,171 - 1,502,269 - Restated at 1 April 1,797,171 - 1,502,269 - Charge for the period/year - net 396,802 - 305,988 - Amount written-off (244,650) - (200,390) - Repurchase of loan 4,117 - 4,117 - Exchange differences (363) - (340) -
1,953,077 - 1,611,644 -
As % of gross financing and advances (including) Islamic financing sold to Cagamas Berhad) less individual allowance and financing exempted from collective allowance by Bank Negara Malaysia 2.83% - 2.92% -
Individual allowance
At 1 AprilAs previously stated - - - - Effect of adopting FRS 139 452,386 - 451,278 - Restated at 1 April 452,386 - 451,278 - Charge for the period/year - net 36,789 - 27,048 - Amount written-off (11,915) - (11,915) -
477,260 - 466,411 -
The Group The Bank
Movements in the allowance for impaired accounts are as follows:
23
Company No. 8515–D
AmBank (M) Berhad (Incorporated in Malaysia) And Its Subsidiaries
A11. Loans, Advances and Financing (Contd.)
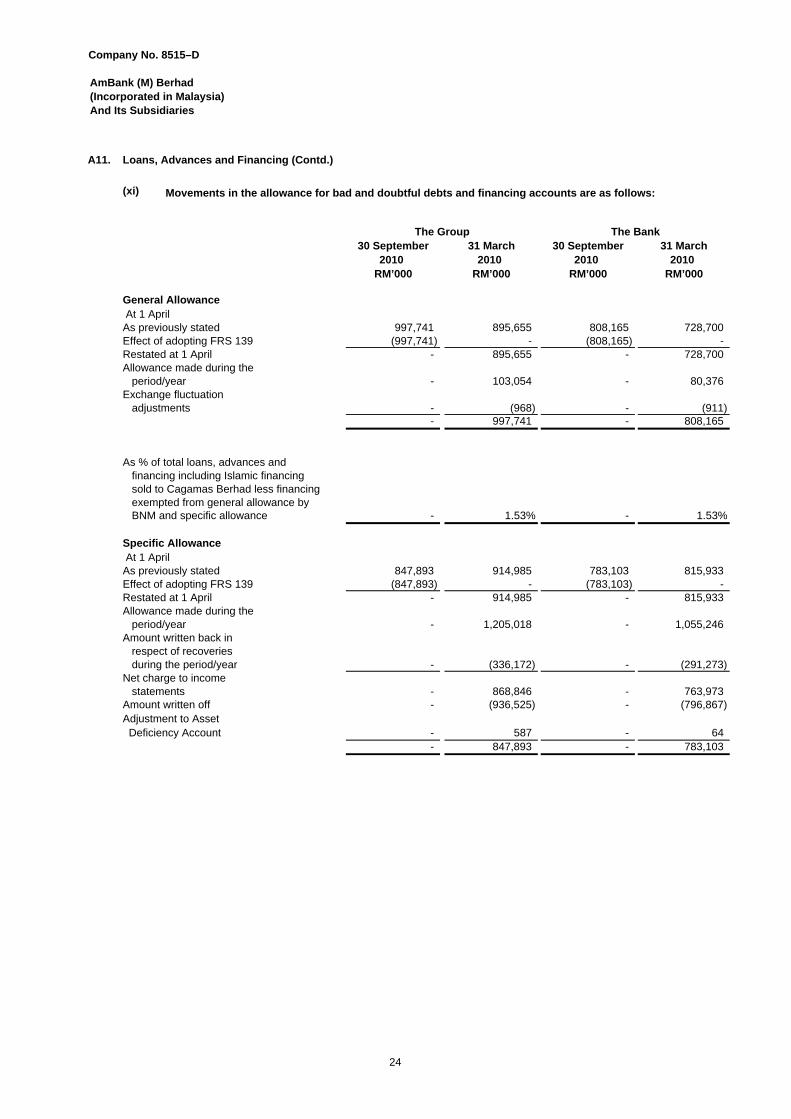
(xi)
30 September 31 March 30 September 31 March2010 2010 2010 2010
RM’000 RM’000 RM’000 RM’000
General Allowance At 1 AprilAs previously stated 997,741 895,655 808,165 728,700 Effect of adopting FRS 139 (997,741) - (808,165) - Restated at 1 April - 895,655 - 728,700 Allowance made during the period/year - 103,054 - 80,376 Exchange fluctuation adjustments - (968) - (911)
- 997,741 - 808,165
As % of total loans, advances and financing including Islamic financing sold to Cagamas Berhad less financing exempted from general allowance by BNM and specific allowance - 1.53% - 1.53%
Specific Allowance At 1 AprilAs previously stated 847,893 914,985 783,103 815,933 Effect of adopting FRS 139 (847,893) - (783,103) - Restated at 1 April - 914,985 - 815,933 Allowance made during the period/year - 1,205,018 - 1,055,246 Amount written back in respect of recoveries during the period/year - (336,172) - (291,273) Net charge to income statements - 868,846 - 763,973 Amount written off - (936,525) - (796,867) Adjustment to Asset Deficiency Account - 587 - 64
- 847,893 - 783,103
The BankThe Group
Movements in the allowance for bad and doubtful debts and financing accounts are as follows:
24
Company No. 8515–D
AmBank (M) Berhad (Incorporated in Malaysia) And Its Subsidiaries
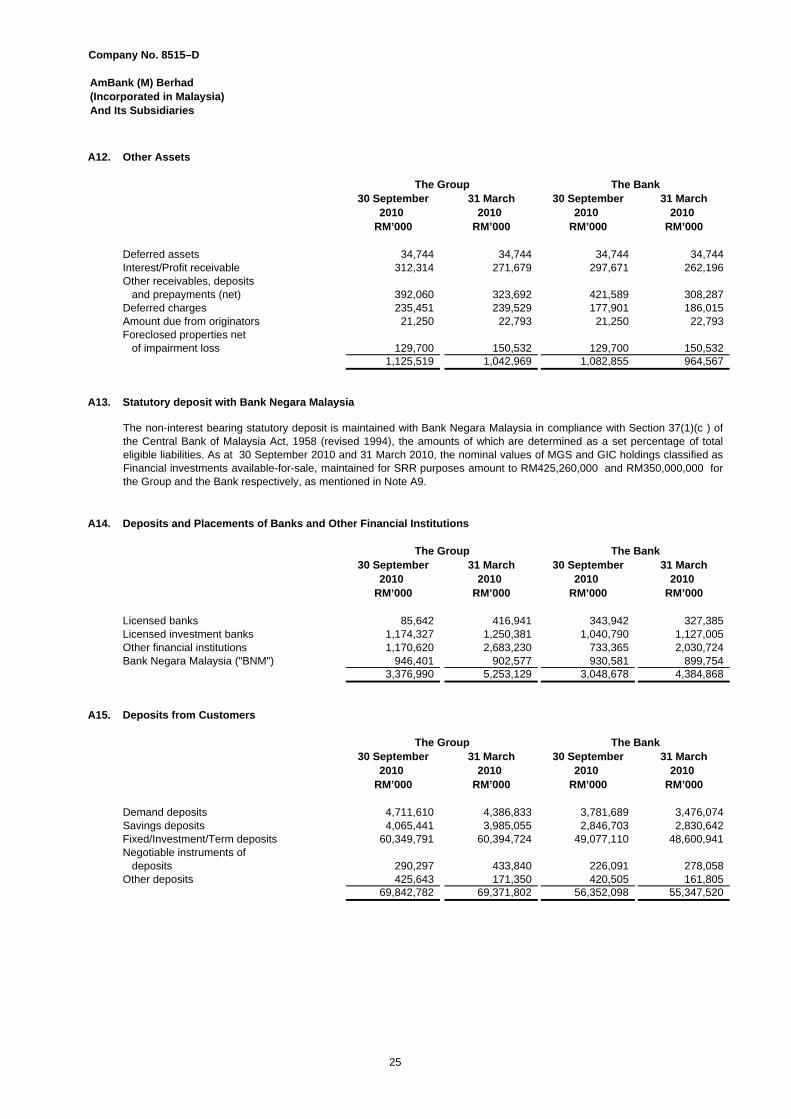
A12. Other Assets
30 September 31 March 30 September 31 March2010 2010 2010 2010
RM’000 RM’000 RM’000 RM’000
Deferred assets 34,744 34,744 34,744 34,744 Interest/Profit receivable 312,314 271,679 297,671 262,196 Other receivables, deposits and prepayments (net) 392,060 323,692 421,589 308,287 Deferred charges 235,451 239,529 177,901 186,015 Amount due from originators 21,250 22,793 21,250 22,793 Foreclosed properties net of impairment loss 129,700 150,532 129,700 150,532
1,125,519 1,042,969 1,082,855 964,567
A13. Statutory deposit with Bank Negara Malaysia
A14. Deposits and Placements of Banks and Other Financial Institutions
30 September 31 March 30 September 31 March2010 2010 2010 2010
RM’000 RM’000 RM’000 RM’000
Licensed banks 85,642 416,941 343,942 327,385 Licensed investment banks 1,174,327 1,250,381 1,040,790 1,127,005 Other financial institutions 1,170,620 2,683,230 733,365 2,030,724 Bank Negara Malaysia ("BNM") 946,401 902,577 930,581 899,754
3,376,990 5,253,129 3,048,678 4,384,868
A15. Deposits from Customers
30 September 31 March 30 September 31 March2010 2010 2010 2010
RM’000 RM’000 RM’000 RM’000
Demand deposits 4,711,610 4,386,833 3,781,689 3,476,074 Savings deposits 4,065,441 3,985,055 2,846,703 2,830,642 Fixed/Investment/Term deposits 60,349,791 60,394,724 49,077,110 48,600,941 Negotiable instruments of deposits 290,297 433,840 226,091 278,058 Other deposits 425,643 171,350 420,505 161,805
69,842,782 69,371,802 56,352,098 55,347,520
The Bank
The Group
The Group The Bank
The Group
The Bank
The non-interest bearing statutory deposit is maintained with Bank Negara Malaysia in compliance with Section 37(1)(c ) ofthe Central Bank of Malaysia Act, 1958 (revised 1994), the amounts of which are determined as a set percentage of totaleligible liabilities. As at 30 September 2010 and 31 March 2010, the nominal values of MGS and GIC holdings classified asFinancial investments available-for-sale, maintained for SRR purposes amount to RM425,260,000 and RM350,000,000 forthe Group and the Bank respectively, as mentioned in Note A9.
25
Company No. 8515–D
AmBank (M) Berhad (Incorporated in Malaysia) And Its Subsidiaries
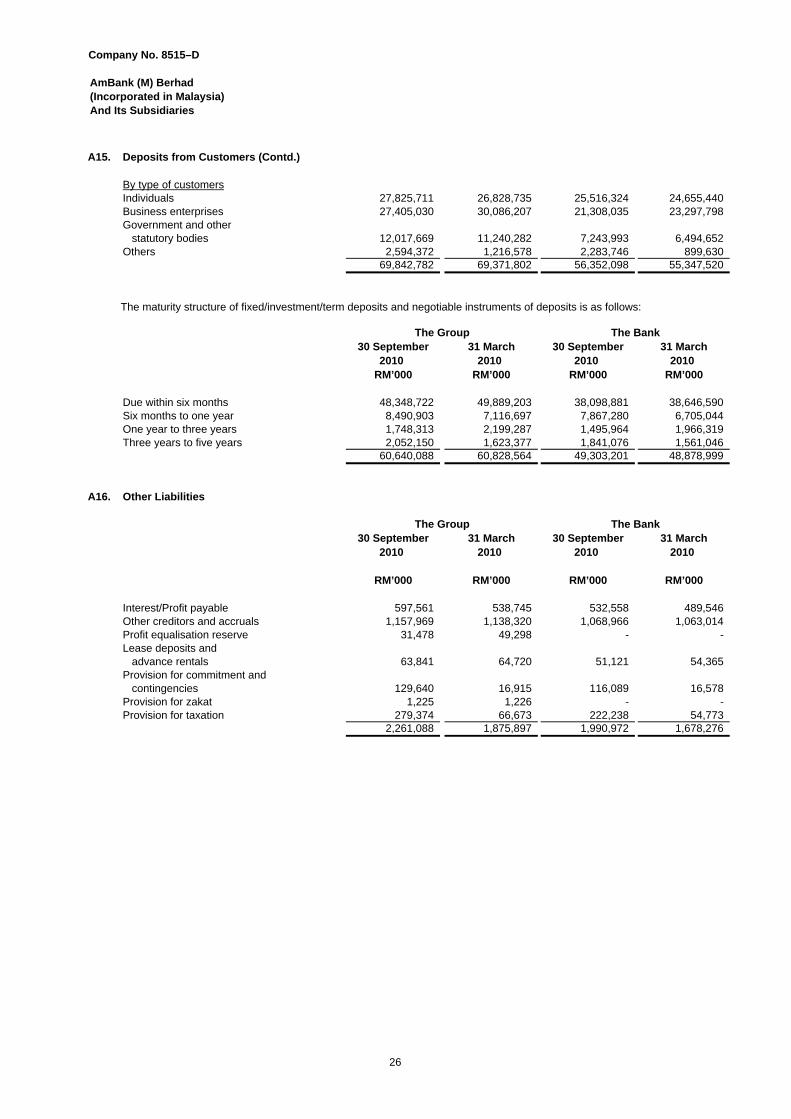
A15. Deposits from Customers (Contd.)
By type of customersIndividuals 27,825,711 26,828,735 25,516,324 24,655,440 Business enterprises 27,405,030 30,086,207 21,308,035 23,297,798 Government and other statutory bodies 12,017,669 11,240,282 7,243,993 6,494,652 Others 2,594,372 1,216,578 2,283,746 899,630
69,842,782 69,371,802 56,352,098 55,347,520
30 September 31 March 30 September 31 March2010 2010 2010 2010
RM’000 RM’000 RM’000 RM’000
Due within six months 48,348,722 49,889,203 38,098,881 38,646,590Six months to one year 8,490,903 7,116,697 7,867,280 6,705,044One year to three years 1,748,313 2,199,287 1,495,964 1,966,319Three years to five years 2,052,150 1,623,377 1,841,076 1,561,046
60,640,088 60,828,564 49,303,201 48,878,999
A16. Other Liabilities
30 September 31 March 30 September 31 March2010 2010 2010 2010
RM’000 RM’000 RM’000 RM’000
Interest/Profit payable 597,561 538,745 532,558 489,546 Other creditors and accruals 1,157,969 1,138,320 1,068,966 1,063,014 Profit equalisation reserve 31,478 49,298 - - Lease deposits and advance rentals 63,841 64,720 51,121 54,365 Provision for commitment and contingencies 129,640 16,915 116,089 16,578 Provision for zakat 1,225 1,226 - - Provision for taxation 279,374 66,673 222,238 54,773
2,261,088 1,875,897 1,990,972 1,678,276
The Bank
The Bank
The Group
The Group
The maturity structure of fixed/investment/term deposits and negotiable instruments of deposits is as follows:
26
Company No. 8515–D
AmBank (M) Berhad (Incorporated in Malaysia) And Its Subsidiaries
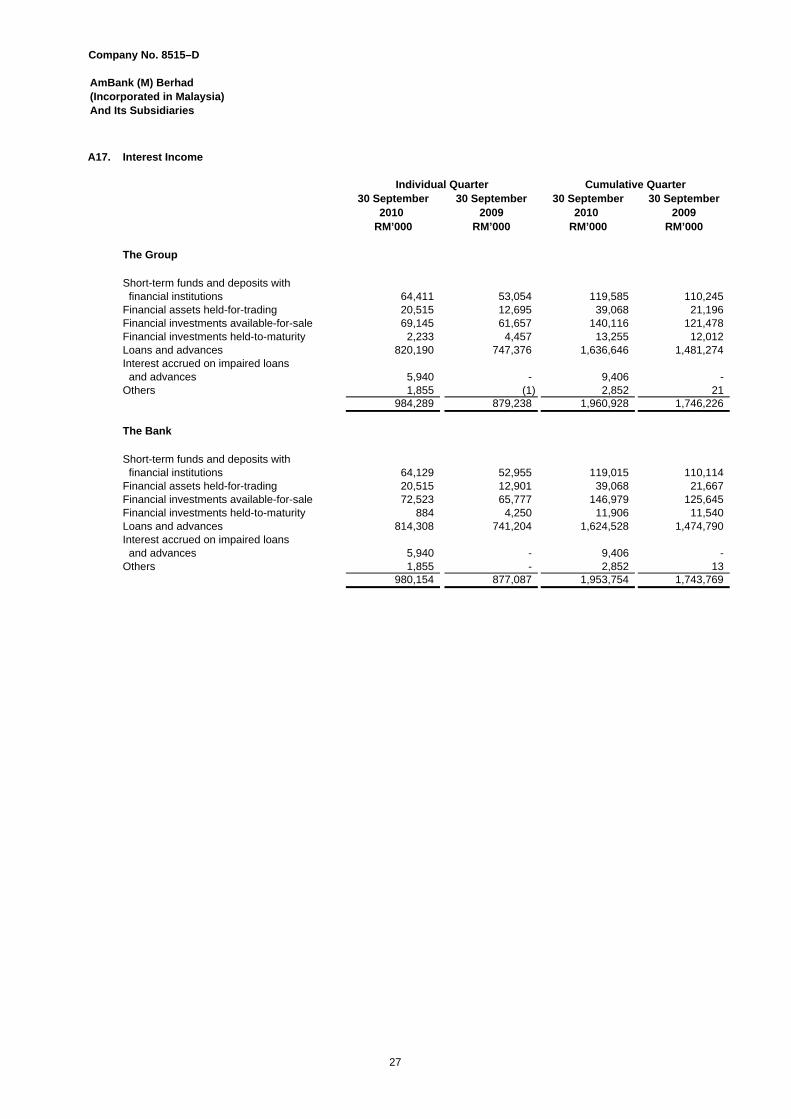
A17. Interest Income
30 September 30 September 30 September 30 September2010 2009 2010 2009
RM’000 RM’000 RM’000 RM’000
The Group
Short-term funds and deposits with financial institutions 64,411 53,054 119,585 110,245Financial assets held-for-trading 20,515 12,695 39,068 21,196Financial investments available-for-sale 69,145 61,657 140,116 121,478Financial investments held-to-maturity 2,233 4,457 13,255 12,012Loans and advances 820,190 747,376 1,636,646 1,481,274Interest accrued on impaired loans and advances 5,940 - 9,406 - Others 1,855 (1) 2,852 21
984,289 879,238 1,960,928 1,746,226
The Bank
Short-term funds and deposits with financial institutions 64,129 52,955 119,015 110,114 Financial assets held-for-trading 20,515 12,901 39,068 21,667 Financial investments available-for-sale 72,523 65,777 146,979 125,645 Financial investments held-to-maturity 884 4,250 11,906 11,540 Loans and advances 814,308 741,204 1,624,528 1,474,790 Interest accrued on impaired loans and advances 5,940 - 9,406 - Others 1,855 - 2,852 13
980,154 877,087 1,953,754 1,743,769
Individual Quarter Cumulative Quarter
27
Company No. 8515–D
AmBank (M) Berhad (Incorporated in Malaysia) And Its Subsidiaries
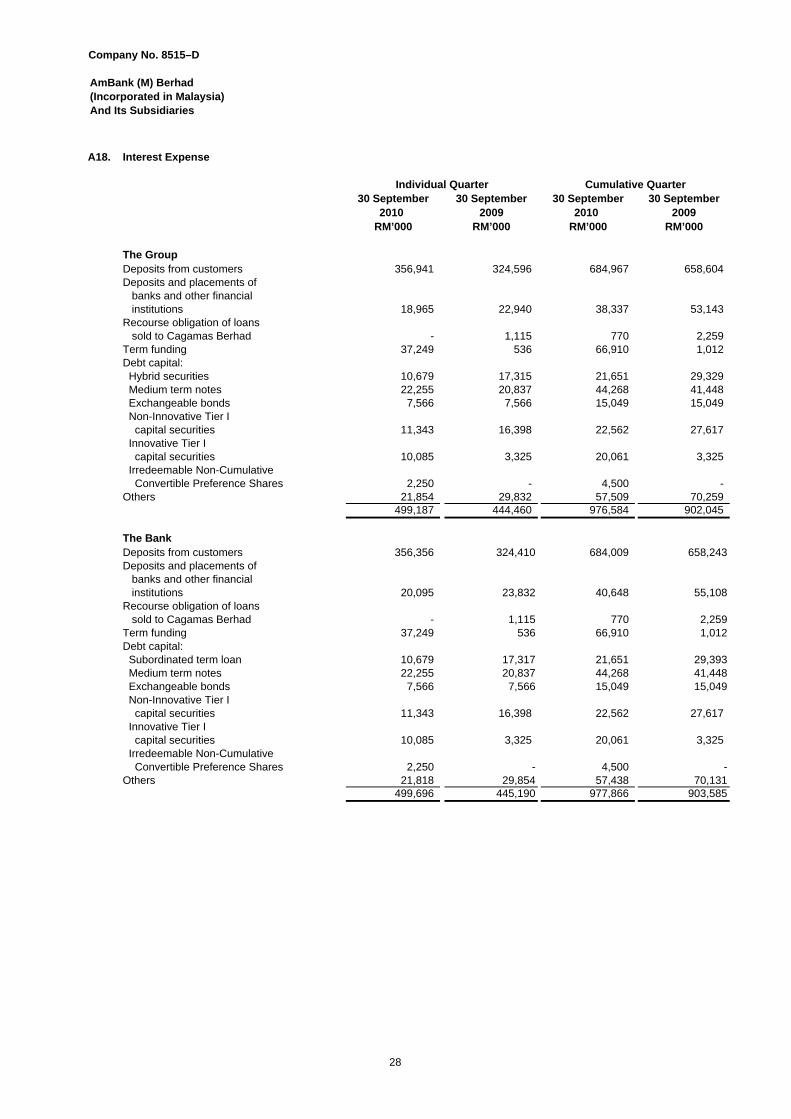
A18. Interest Expense
30 September 30 September 30 September 30 September2010 2009 2010 2009
RM’000 RM’000 RM’000 RM’000
The GroupDeposits from customers 356,941 324,596 684,967 658,604 Deposits and placements of banks and other financial institutions 18,965 22,940 38,337 53,143 Recourse obligation of loans sold to Cagamas Berhad - 1,115 770 2,259 Term funding 37,249 536 66,910 1,012 Debt capital: Hybrid securities 10,679 17,315 21,651 29,329 Medium term notes 22,255 20,837 44,268 41,448 Exchangeable bonds 7,566 7,566 15,049 15,049 Non-Innovative Tier I capital securities 11,343 16,398 22,562 27,617 Innovative Tier I capital securities 10,085 3,325 20,061 3,325 Irredeemable Non-Cumulative Convertible Preference Shares 2,250 - 4,500 - Others 21,854 29,832 57,509 70,259
499,187 444,460 976,584 902,045
The BankDeposits from customers 356,356 324,410 684,009 658,243Deposits and placements of banks and other financial institutions 20,095 23,832 40,648 55,108Recourse obligation of loans sold to Cagamas Berhad - 1,115 770 2,259Term funding 37,249 536 66,910 1,012Debt capital: Subordinated term loan 10,679 17,317 21,651 29,393 Medium term notes 22,255 20,837 44,268 41,448 Exchangeable bonds 7,566 7,566 15,049 15,049 Non-Innovative Tier I capital securities 11,343 16,398 22,562 27,617 Innovative Tier I capital securities 10,085 3,325 20,061 3,325 Irredeemable Non-Cumulative Convertible Preference Shares 2,250 - 4,500 - Others 21,818 29,854 57,438 70,131
499,696 445,190 977,866 903,585
Individual Quarter Cumulative Quarter
28
Company No. 8515–D
AmBank (M) Berhad (Incorporated in Malaysia) And Its Subsidiaries
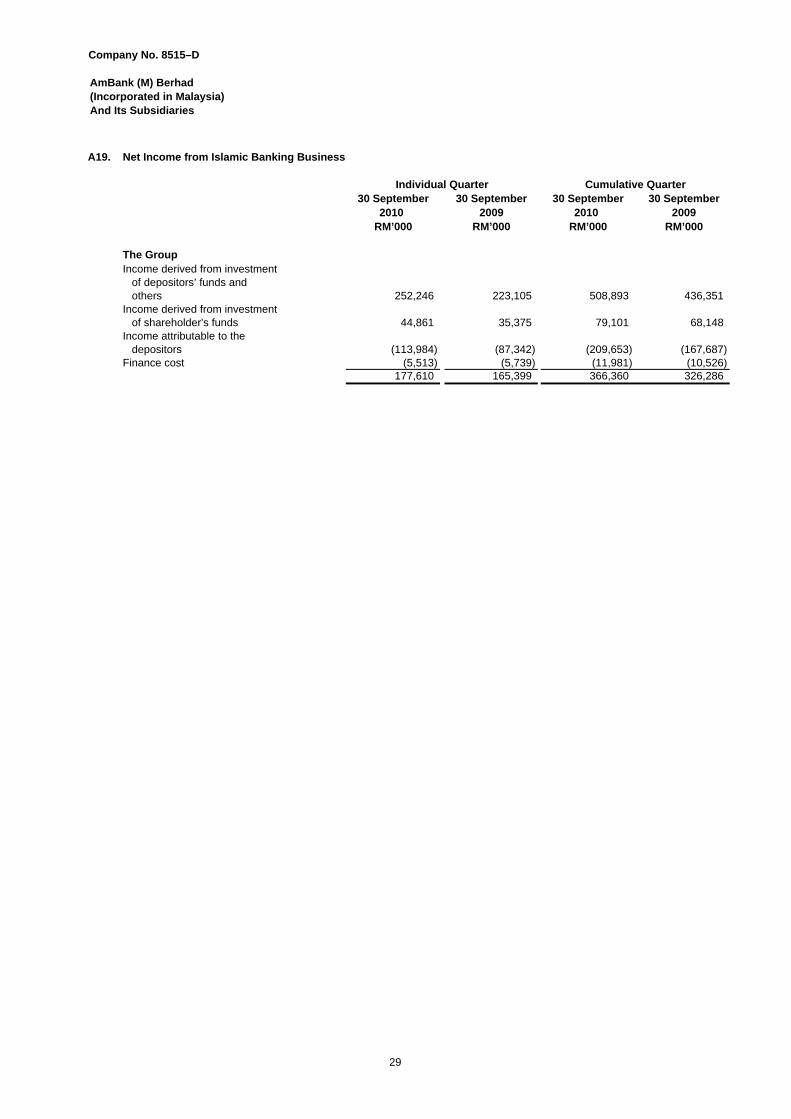
A19. Net Income from Islamic Banking Business
30 September 30 September 30 September 30 September2010 2009 2010 2009
RM’000 RM’000 RM’000 RM’000
The GroupIncome derived from investment of depositors’ funds and others 252,246 223,105 508,893 436,351 Income derived from investment of shareholder's funds 44,861 35,375 79,101 68,148 Income attributable to the depositors (113,984) (87,342) (209,653) (167,687) Finance cost (5,513) (5,739) (11,981) (10,526)
177,610 165,399 366,360 326,286
Individual Quarter Cumulative Quarter
29
Company No. 8515–D
AmBank (M) Berhad (Incorporated in Malaysia) And Its Subsidiaries
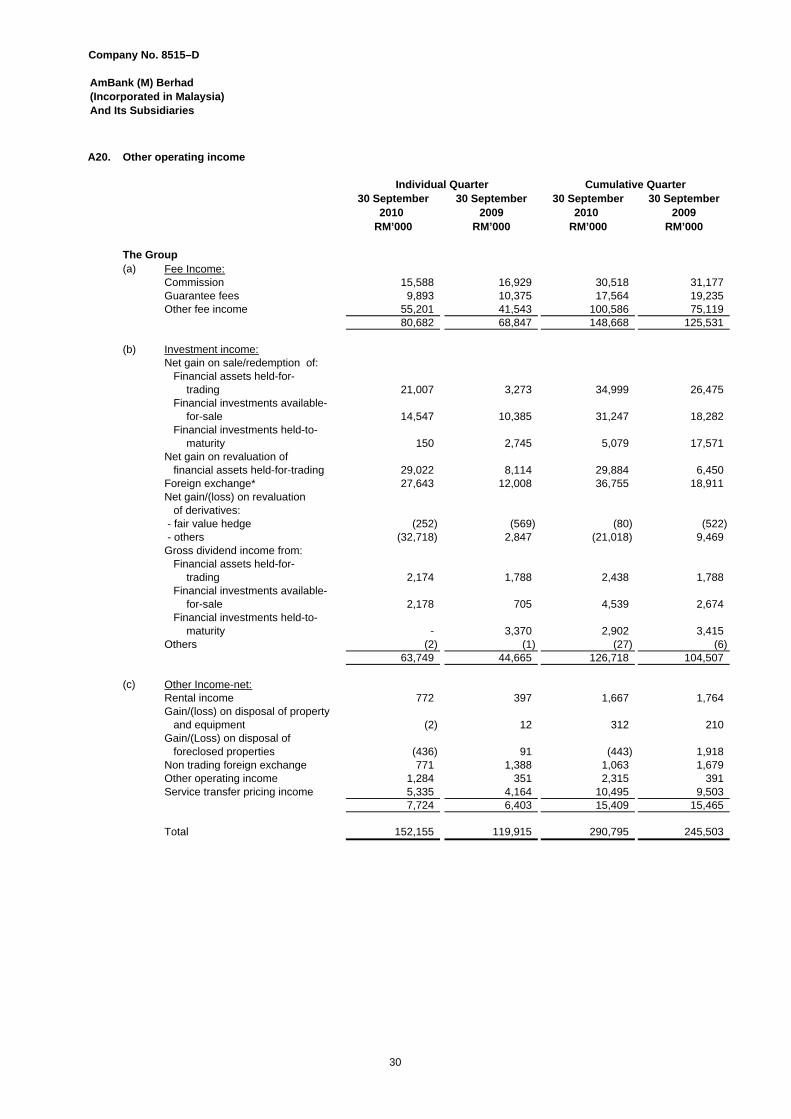
A20. Other operating income
30 September 30 September 30 September 30 September2010 2009 2010 2009
RM’000 RM’000 RM’000 RM’000
The Group(a) Fee Income:
Commission 15,588 16,929 30,518 31,177 Guarantee fees 9,893 10,375 17,564 19,235 Other fee income 55,201 41,543 100,586 75,119
80,682 68,847 148,668 125,531
(b) Investment income:Net gain on sale/redemption of: Financial assets held-for-
trading 21,007 3,273 34,999 26,475 Financial investments available-
for-sale 14,547 10,385 31,247 18,282 Financial investments held-to-
maturity 150 2,745 5,079 17,571 Net gain on revaluation of financial assets held-for-trading 29,022 8,114 29,884 6,450 Foreign exchange* 27,643 12,008 36,755 18,911 Net gain/(loss) on revaluation of derivatives: - fair value hedge (252) (569) (80) (522) - others (32,718) 2,847 (21,018) 9,469 Gross dividend income from: Financial assets held-for-
trading 2,174 1,788 2,438 1,788 Financial investments available-
for-sale 2,178 705 4,539 2,674 Financial investments held-to-
maturity - 3,370 2,902 3,415 Others (2) (1) (27) (6)
63,749 44,665 126,718 104,507
(c) Other Income-net:Rental income 772 397 1,667 1,764 Gain/(loss) on disposal of property and equipment (2) 12 312 210 Gain/(Loss) on disposal of foreclosed properties (436) 91 (443) 1,918 Non trading foreign exchange 771 1,388 1,063 1,679 Other operating income 1,284 351 2,315 391 Service transfer pricing income 5,335 4,164 10,495 9,503
7,724 6,403 15,409 15,465
Total 152,155 119,915 290,795 245,503
Cumulative QuarterIndividual Quarter
30
Company No. 8515–D
AmBank (M) Berhad (Incorporated in Malaysia) And Its Subsidiaries
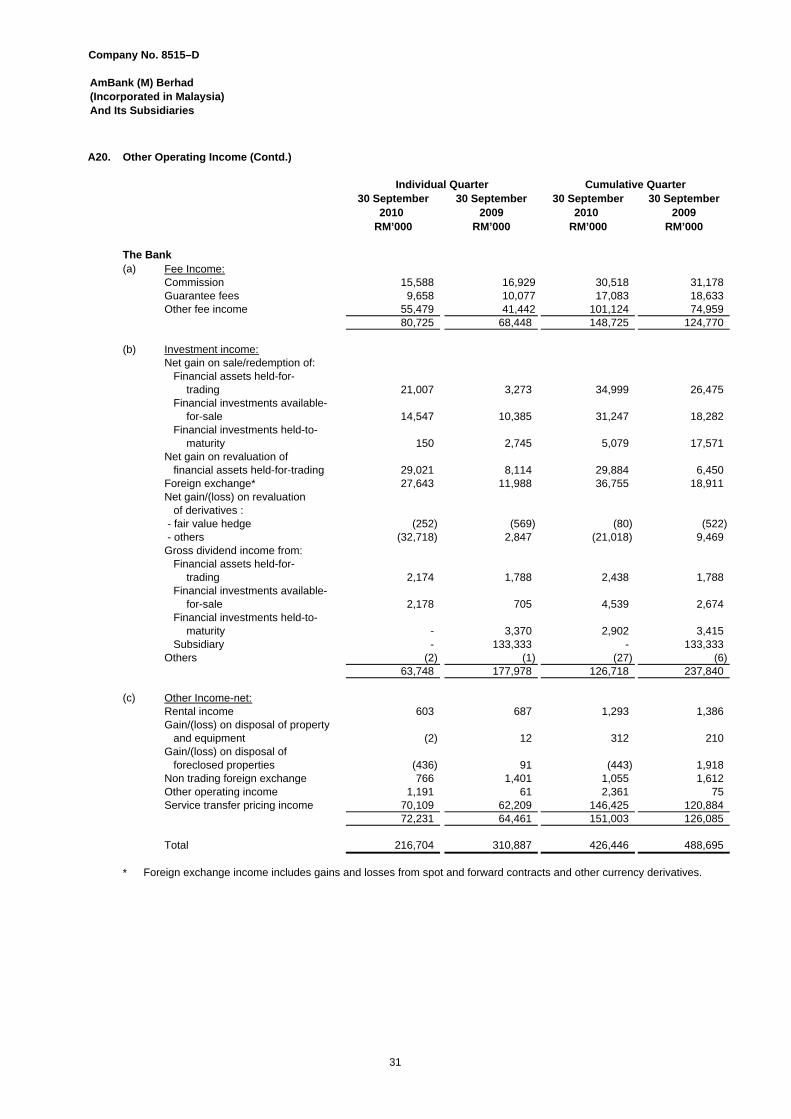
A20. Other Operating Income (Contd.)
30 September 30 September 30 September 30 September2010 2009 2010 2009
RM’000 RM’000 RM’000 RM’000
The Bank(a) Fee Income:
Commission 15,588 16,929 30,518 31,178 Guarantee fees 9,658 10,077 17,083 18,633 Other fee income 55,479 41,442 101,124 74,959
80,725 68,448 148,725 124,770
(b) Investment income:Net gain on sale/redemption of: Financial assets held-for-
trading 21,007 3,273 34,999 26,475 Financial investments available-
for-sale 14,547 10,385 31,247 18,282 Financial investments held-to-
maturity 150 2,745 5,079 17,571 Net gain on revaluation of financial assets held-for-trading 29,021 8,114 29,884 6,450 Foreign exchange* 27,643 11,988 36,755 18,911 Net gain/(loss) on revaluation of derivatives : - fair value hedge (252) (569) (80) (522) - others (32,718) 2,847 (21,018) 9,469 Gross dividend income from: Financial assets held-for-
trading 2,174 1,788 2,438 1,788 Financial investments available-
for-sale 2,178 705 4,539 2,674 Financial investments held-to-
maturity - 3,370 2,902 3,415 Subsidiary - 133,333 - 133,333 Others (2) (1) (27) (6)
63,748 177,978 126,718 237,840
(c) Other Income-net:Rental income 603 687 1,293 1,386 Gain/(loss) on disposal of property and equipment (2) 12 312 210 Gain/(loss) on disposal of foreclosed properties (436) 91 (443) 1,918 Non trading foreign exchange 766 1,401 1,055 1,612 Other operating income 1,191 61 2,361 75 Service transfer pricing income 70,109 62,209 146,425 120,884
72,231 64,461 151,003 126,085
Total 216,704 310,887 426,446 488,695
*
Individual Quarter Cumulative Quarter
Foreign exchange income includes gains and losses from spot and forward contracts and other currency derivatives.
31
Company No. 8515–D
AmBank (M) Berhad (Incorporated in Malaysia) And Its Subsidiaries
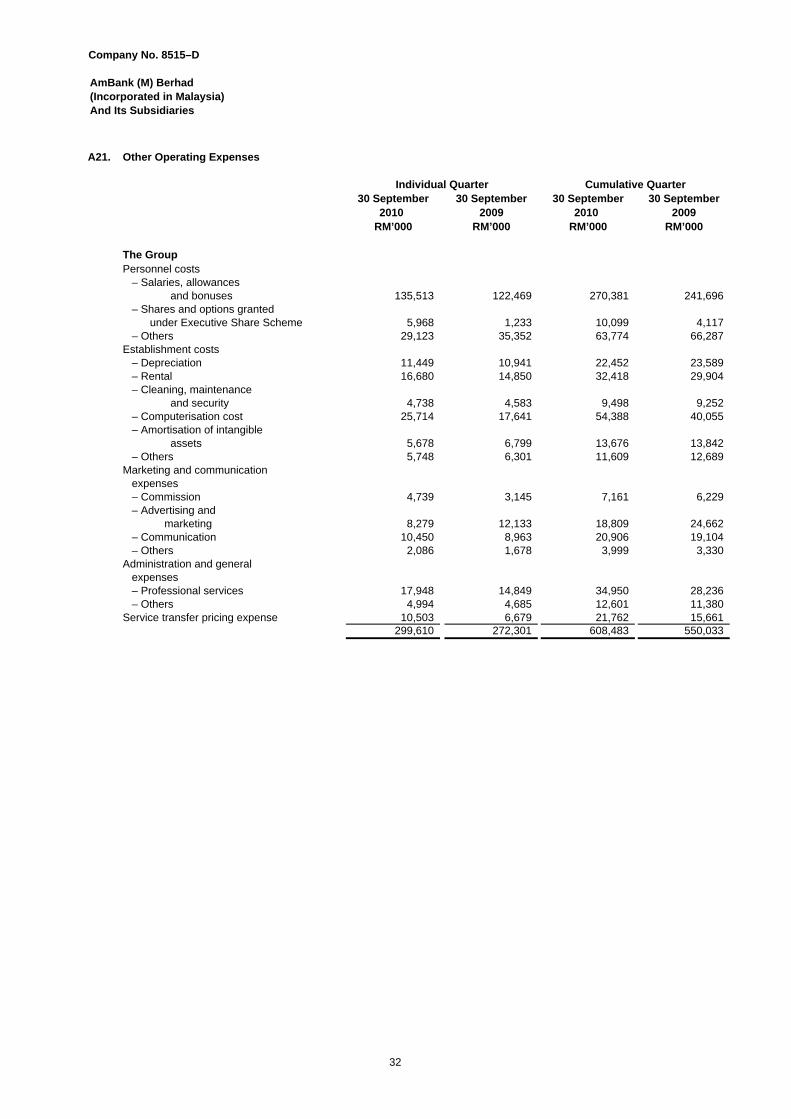
A21. Other Operating Expenses
30 September 30 September 30 September 30 September2010 2009 2010 2009
RM’000 RM’000 RM’000 RM’000
The GroupPersonnel costs – Salaries, allowances
and bonuses 135,513 122,469 270,381 241,696 – Shares and options granted under Executive Share Scheme 5,968 1,233 10,099 4,117 – Others 29,123 35,352 63,774 66,287 Establishment costs – Depreciation 11,449 10,941 22,452 23,589 – Rental 16,680 14,850 32,418 29,904 – Cleaning, maintenance
and security 4,738 4,583 9,498 9,252 – Computerisation cost 25,714 17,641 54,388 40,055 – Amortisation of intangible
assets 5,678 6,799 13,676 13,842 – Others 5,748 6,301 11,609 12,689 Marketing and communication expenses – Commission 4,739 3,145 7,161 6,229 – Advertising and
marketing 8,279 12,133 18,809 24,662 – Communication 10,450 8,963 20,906 19,104 – Others 2,086 1,678 3,999 3,330 Administration and general expenses – Professional services 17,948 14,849 34,950 28,236 – Others 4,994 4,685 12,601 11,380 Service transfer pricing expense 10,503 6,679 21,762 15,661
299,610 272,301 608,483 550,033
Cumulative QuarterIndividual Quarter
32
Company No. 8515–D
AmBank (M) Berhad (Incorporated in Malaysia) And Its Subsidiaries
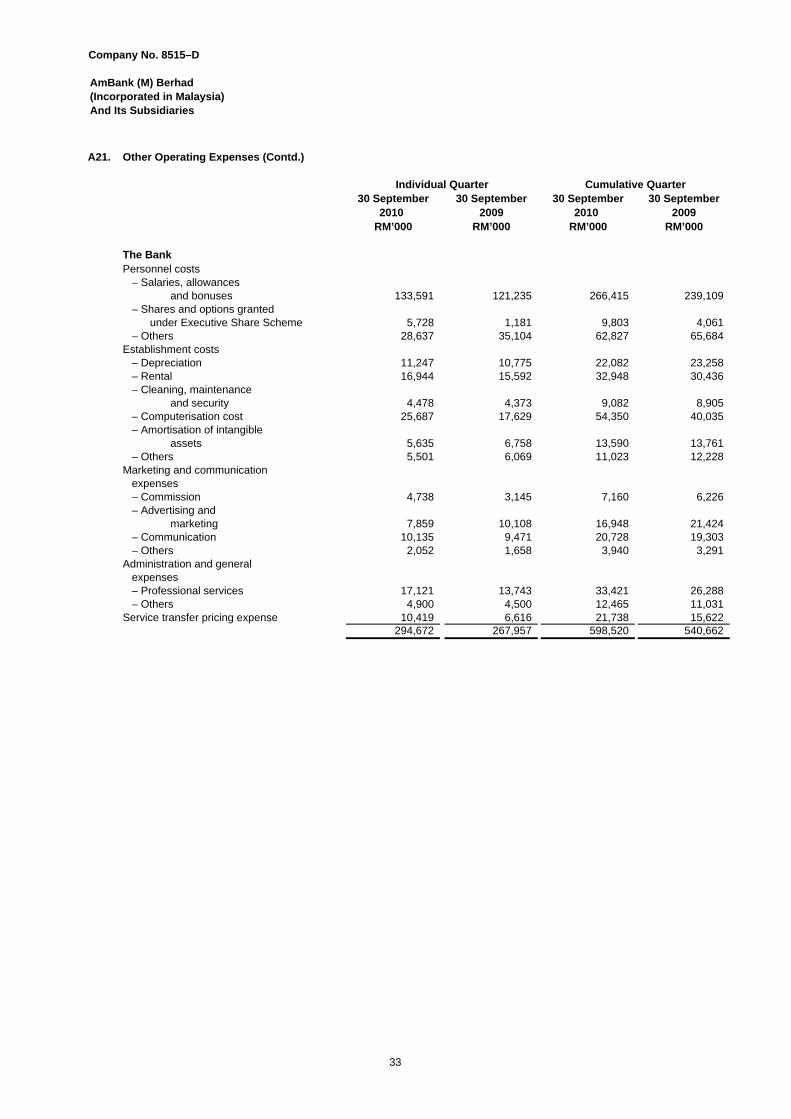
A21. Other Operating Expenses (Contd.)
30 September 30 September 30 September 30 September2010 2009 2010 2009
RM’000 RM’000 RM’000 RM’000
The Bank Personnel costs – Salaries, allowances
and bonuses 133,591 121,235 266,415 239,109 – Shares and options granted under Executive Share Scheme 5,728 1,181 9,803 4,061 – Others 28,637 35,104 62,827 65,684 Establishment costs – Depreciation 11,247 10,775 22,082 23,258 – Rental 16,944 15,592 32,948 30,436 – Cleaning, maintenance
and security 4,478 4,373 9,082 8,905 – Computerisation cost 25,687 17,629 54,350 40,035 – Amortisation of intangible
assets 5,635 6,758 13,590 13,761 – Others 5,501 6,069 11,023 12,228 Marketing and communication expenses – Commission 4,738 3,145 7,160 6,226 – Advertising and
marketing 7,859 10,108 16,948 21,424 – Communication 10,135 9,471 20,728 19,303 – Others 2,052 1,658 3,940 3,291 Administration and general expenses – Professional services 17,121 13,743 33,421 26,288 – Others 4,900 4,500 12,465 11,031 Service transfer pricing expense 10,419 6,616 21,738 15,622
294,672 267,957 598,520 540,662
Cumulative QuarterIndividual Quarter
33
Company No. 8515–D
AmBank (M) Berhad (Incorporated in Malaysia) And Its Subsidiaries
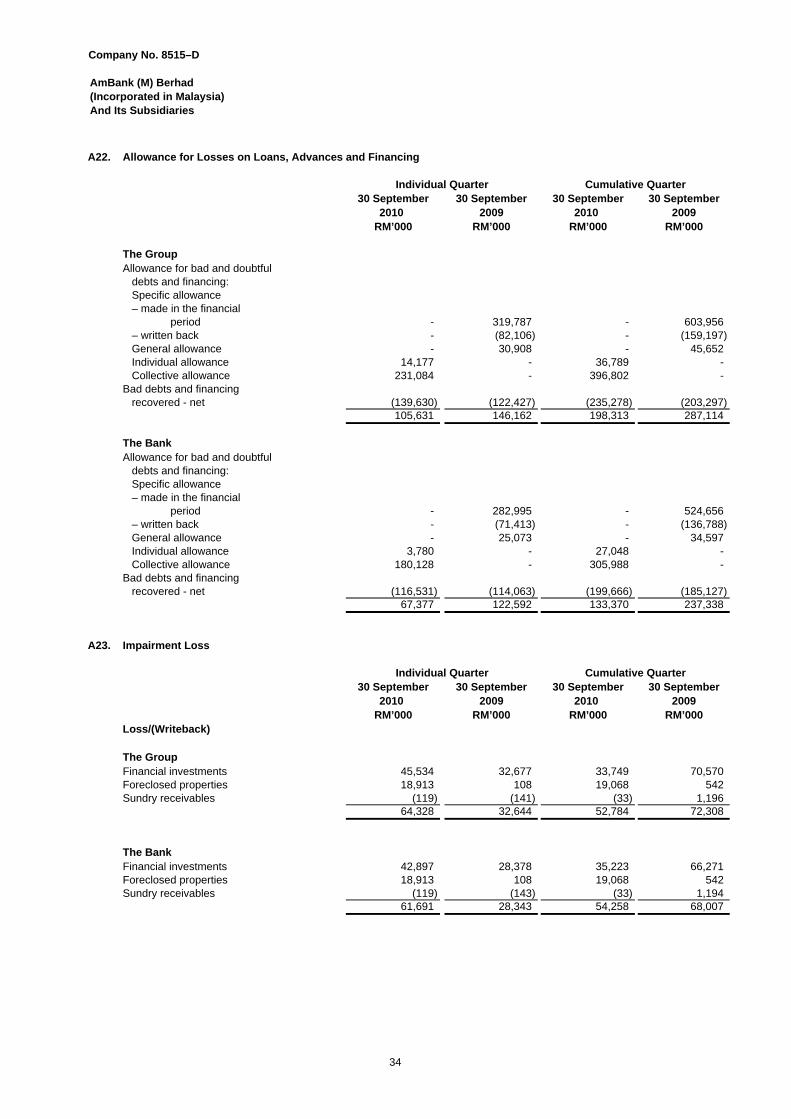
A22. Allowance for Losses on Loans, Advances and Financing
30 September 30 September 30 September 30 September2010 2009 2010 2009
RM’000 RM’000 RM’000 RM’000
The GroupAllowance for bad and doubtful debts and financing: Specific allowance – made in the financial
period - 319,787 - 603,956 – written back - (82,106) - (159,197) General allowance - 30,908 - 45,652 Individual allowance 14,177 - 36,789 - Collective allowance 231,084 - 396,802 - Bad debts and financing recovered - net (139,630) (122,427) (235,278) (203,297)
105,631 146,162 198,313 287,114
The BankAllowance for bad and doubtful debts and financing: Specific allowance – made in the financial
period - 282,995 - 524,656 – written back - (71,413) - (136,788) General allowance - 25,073 - 34,597 Individual allowance 3,780 - 27,048 - Collective allowance 180,128 - 305,988 - Bad debts and financing recovered - net (116,531) (114,063) (199,666) (185,127)
67,377 122,592 133,370 237,338
A23. Impairment Loss
30 September 30 September 30 September 30 September2010 2009 2010 2009
RM’000 RM’000 RM’000 RM’000Loss/(Writeback)
The GroupFinancial investments 45,534 32,677 33,749 70,570 Foreclosed properties 18,913 108 19,068 542 Sundry receivables (119) (141) (33) 1,196
64,328 32,644 52,784 72,308
The BankFinancial investments 42,897 28,378 35,223 66,271 Foreclosed properties 18,913 108 19,068 542 Sundry receivables (119) (143) (33) 1,194
61,691 28,343 54,258 68,007
Individual Quarter Cumulative Quarter
Individual Quarter Cumulative Quarter
34
Company No. 8515–D
AmBank (M) Berhad (Incorporated in Malaysia) And Its Subsidiaries
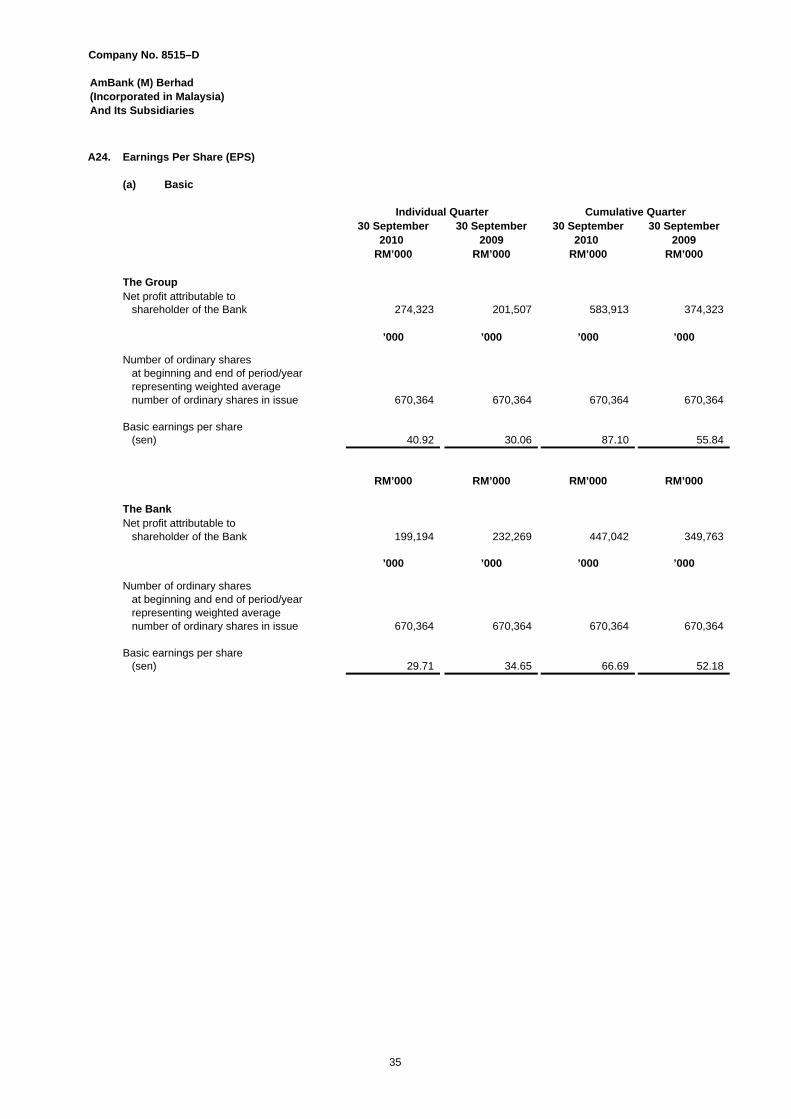
A24. Earnings Per Share (EPS)
(a) Basic
30 September 30 September 30 September 30 September2010 2009 2010 2009
RM’000 RM’000 RM’000 RM’000
The GroupNet profit attributable to shareholder of the Bank 274,323 201,507 583,913 374,323
’000 ’000 ’000 ’000
Number of ordinary shares at beginning and end of period/year representing weighted average number of ordinary shares in issue 670,364 670,364 670,364 670,364
Basic earnings per share (sen) 40.92 30.06 87.10 55.84
RM’000 RM’000 RM’000 RM’000
The BankNet profit attributable to shareholder of the Bank 199,194 232,269 447,042 349,763
’000 ’000 ’000 ’000
Number of ordinary shares at beginning and end of period/year representing weighted average number of ordinary shares in issue 670,364 670,364 670,364 670,364
Basic earnings per share (sen) 29.71 34.65 66.69 52.18
Individual Quarter Cumulative Quarter
35
Company No. 8515–D
AmBank (M) Berhad (Incorporated in Malaysia) And Its Subsidiaries
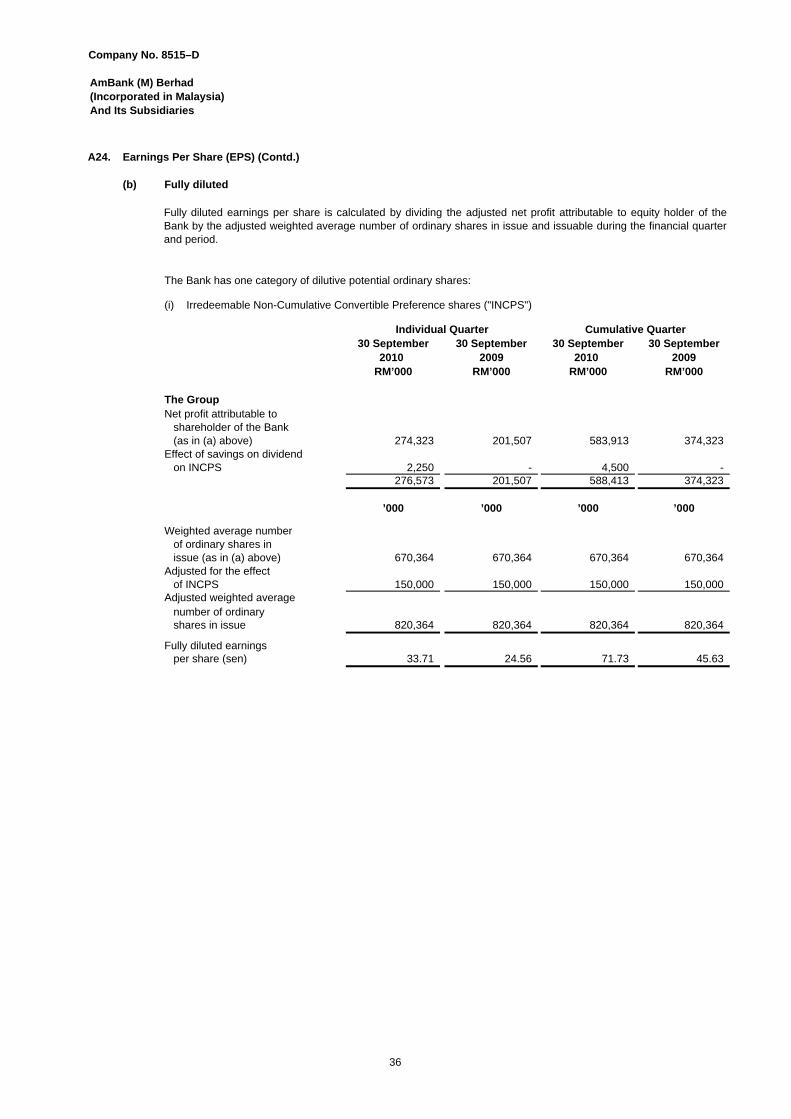
A24. Earnings Per Share (EPS) (Contd.)
(b) Fully diluted
The Bank has one category of dilutive potential ordinary shares:
(i) Irredeemable Non-Cumulative Convertible Preference shares ("INCPS")
30 September 30 September 30 September 30 September2010 2009 2010 2009
RM’000 RM’000 RM’000 RM’000
The GroupNet profit attributable to shareholder of the Bank (as in (a) above) 274,323 201,507 583,913 374,323 Effect of savings on dividend on INCPS 2,250 - 4,500 -
276,573 201,507 588,413 374,323
’000 ’000 ’000 ’000
Weighted average number of ordinary shares in issue (as in (a) above) 670,364 670,364 670,364 670,364 Adjusted for the effect of INCPS 150,000 150,000 150,000 150,000 Adjusted weighted average number of ordinary shares in issue 820,364 820,364 820,364 820,364
Fully diluted earnings per share (sen) 33.71 24.56 71.73 45.63
Individual Quarter Cumulative Quarter
Fully diluted earnings per share is calculated by dividing the adjusted net profit attributable to equity holder of theBank by the adjusted weighted average number of ordinary shares in issue and issuable during the financial quarterand period.
36
Company No. 8515–D
AmBank (M) Berhad (Incorporated in Malaysia) And Its Subsidiaries
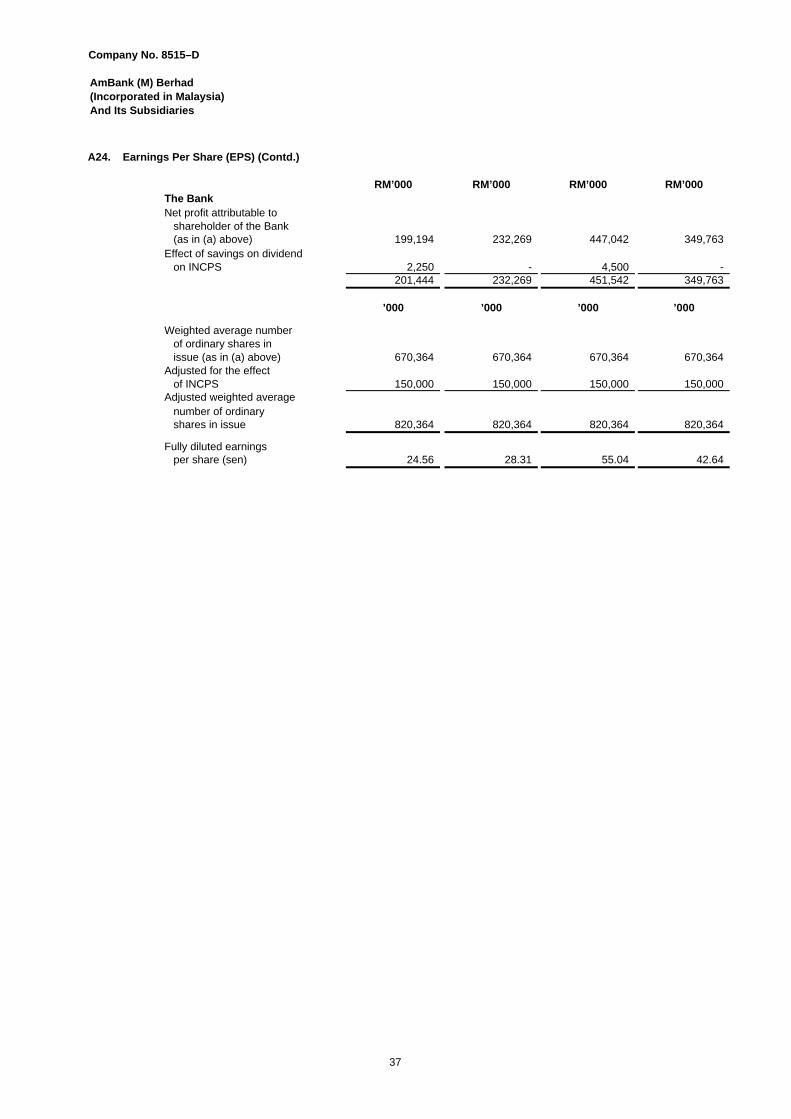
A24. Earnings Per Share (EPS) (Contd.)
RM’000 RM’000 RM’000 RM’000The BankNet profit attributable to shareholder of the Bank (as in (a) above) 199,194 232,269 447,042 349,763 Effect of savings on dividend on INCPS 2,250 - 4,500 -
201,444 232,269 451,542 349,763
’000 ’000 ’000 ’000
Weighted average number of ordinary shares in issue (as in (a) above) 670,364 670,364 670,364 670,364 Adjusted for the effect of INCPS 150,000 150,000 150,000 150,000 Adjusted weighted average number of ordinary shares in issue 820,364 820,364 820,364 820,364
Fully diluted earnings per share (sen) 24.56 28.31 55.04 42.64
37
Company No. 8515–D
AmBank (M) Berhad (Incorporated in Malaysia) And Its Subsidiaries
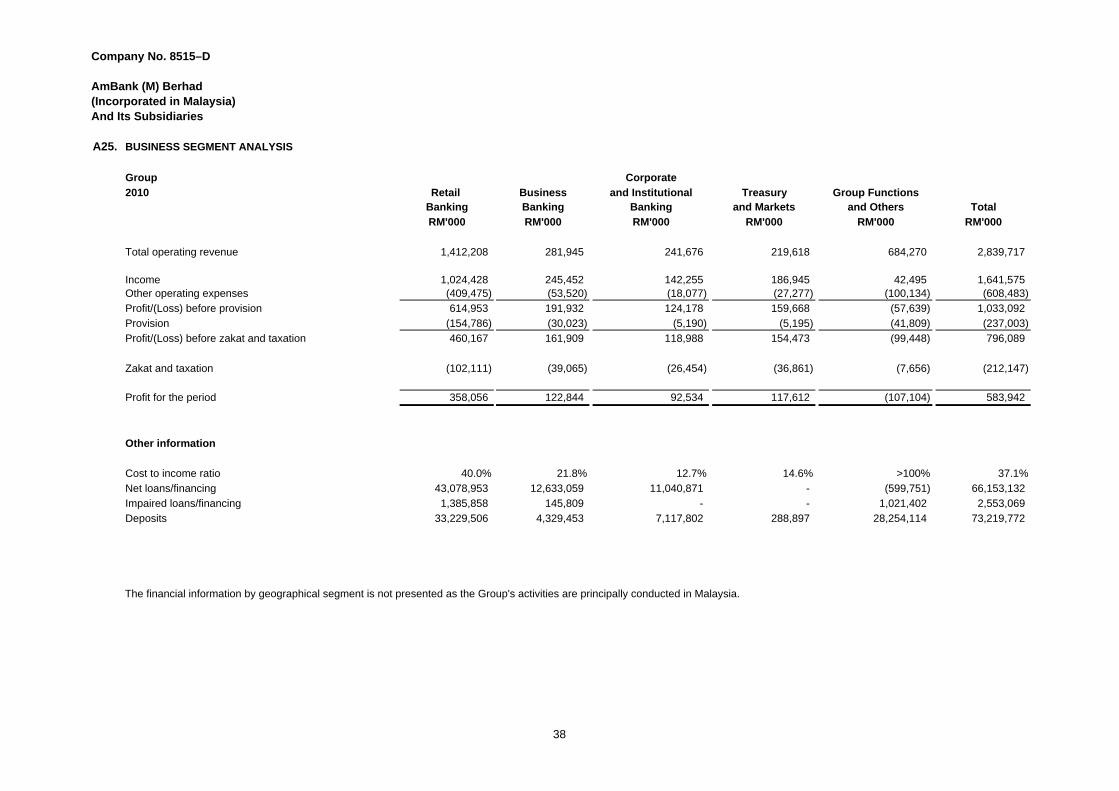
A25. BUSINESS SEGMENT ANALYSIS
Group Corporate
2010 Retail Business and Institutional Treasury Group FunctionsBanking Banking Banking and Markets and Others Total
RM'000 RM'000 RM'000 RM'000 RM'000 RM'000
Total operating revenue 1,412,208 281,945 241,676 219,618 684,270 2,839,717
Income 1,024,428 245,452 142,255 186,945 42,495 1,641,575Other operating expenses (409,475) (53,520) (18,077) (27,277) (100,134) (608,483)
Profit/(Loss) before provision 614,953 191,932 124,178 159,668 (57,639) 1,033,092
Provision (154,786) (30,023) (5,190) (5,195) (41,809) (237,003)
Profit/(Loss) before zakat and taxation 460,167 161,909 118,988 154,473 (99,448) 796,089
Zakat and taxation (102,111) (39,065) (26,454) (36,861) (7,656) (212,147)
Profit for the period 358,056 122,844 92,534 117,612 (107,104) 583,942
Other information
Cost to income ratio 40.0% 21.8% 12.7% 14.6% >100% 37.1%
Net loans/financing 43,078,953 12,633,059 11,040,871 - (599,751) 66,153,132
Impaired loans/financing 1,385,858 145,809 - - 1,021,402 2,553,069
Deposits 33,229,506 4,329,453 7,117,802 288,897 28,254,114 73,219,772
The financial information by geographical segment is not presented as the Group's activities are principally conducted in Malaysia.
38
Company No. 8515–D
AmBank (M) Berhad (Incorporated in Malaysia) And Its Subsidiaries
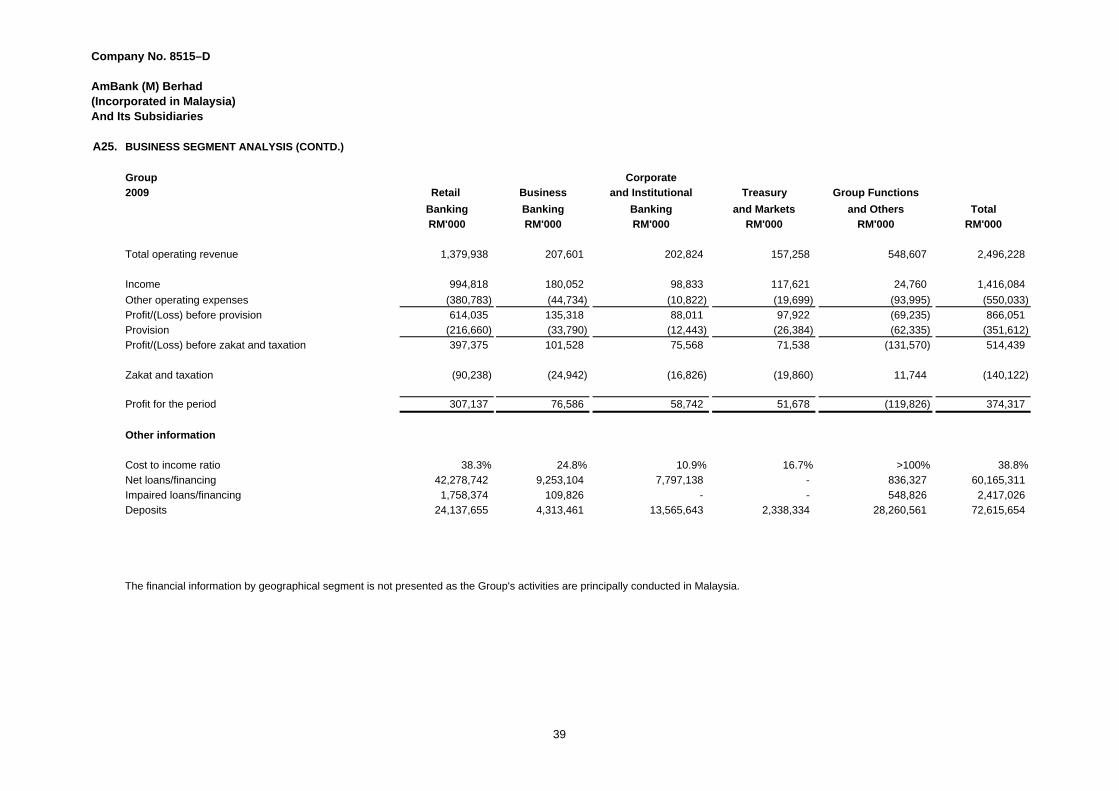
A25. BUSINESS SEGMENT ANALYSIS (CONTD.)
Group Corporate
2009 Retail Business and Institutional Treasury Group Functions
Banking Banking Banking and Markets and Others Total
RM'000 RM'000 RM'000 RM'000 RM'000 RM'000
Total operating revenue 1,379,938 207,601 202,824 157,258 548,607 2,496,228
Income 994,818 180,052 98,833 117,621 24,760 1,416,084
Other operating expenses (380,783) (44,734) (10,822) (19,699) (93,995) (550,033)
Profit/(Loss) before provision 614,035 135,318 88,011 97,922 (69,235) 866,051
Provision (216,660) (33,790) (12,443) (26,384) (62,335) (351,612)
Profit/(Loss) before zakat and taxation 397,375 101,528 75,568 71,538 (131,570) 514,439
Zakat and taxation (90,238) (24,942) (16,826) (19,860) 11,744 (140,122)
Profit for the period 307,137 76,586 58,742 51,678 (119,826) 374,317
Other information
Cost to income ratio 38.3% 24.8% 10.9% 16.7% >100% 38.8%
Net loans/financing 42,278,742 9,253,104 7,797,138 - 836,327 60,165,311
Impaired loans/financing 1,758,374 109,826 - - 548,826 2,417,026
Deposits 24,137,655 4,313,461 13,565,643 2,338,334 28,260,561 72,615,654
The financial information by geographical segment is not presented as the Group's activities are principally conducted in Malaysia.
39
Company No. 8515–D
AmBank (M) Berhad (Incorporated in Malaysia) And Its Subsidiaries
A26. Performance Review for the period ended 30 September 2010
A27. Prospects for 31 March 2011
A28. Valuation of Property and Equipment
A29. Events Subsequent to Balance Sheet Date
A30. Changes in the composition of the Group
The Group registered a profit before zakat and taxation (“pre-tax profit”) of RM796.1 milllion representing a 54.7% increasecompared to the pre-tax profit for the corresponding period last year.
The impressive improved earnings was due to increase in interest income, other operating income, significant reduction inloans impairment allowances and impairment losses. Net income from Islamic banking business increased by RM40.1 milliondriven by strong growth in financing.
The increase was offset by higher operating expenses attrbutable to higher personnel costs and computerisation costs.
In the opinion of the Directors, the results of operations of the Group and the Bank for the financial quarter and period havenot been substantially affected by any item, transaction or event of a material and unusual nature.
The Group’s and the Bank’s property and equipment are stated at cost or valuation less accumulated depreciation andaccumulated impairment losses.
There has not arisen in the interval between the end of the financial period and the date of this report any items, transactionor event of a material and unusual nature likely, in the opinion of the directors, to affect substantially the results of theoperations of the Group for the current period.
There were no significant changes in the composition of the Group for the financial quarter and period ended 30 September2010.
Recent positive indicators around the region point to greater optimism and an emerging recovery on the economic front, butpotential volatility continues to linger. The 10th Malaysia Plan (2011 – 2015) recently announced by the government shouldprovide opportunity for accelerating domestic economic growth. For 2010, current consensus view projects a GDP expansionof circa +8.0%. The Group will keep abreast with the progress of economic developments and continue to position itsbusiness for economic recovery domestically and regionally via leveraging on its strategic partner in banking, Australia andNew Zealand Banking Group (“ANZ”).
The Malaysian banking operating environment is likely to benefit from the economic recovery, with higher lending growth andincrease capital market activity. However, Malaysian banks are expected to face greater competitive pressures as thefinancial sector progressively liberalises and with new entrants to the industry.
The Group remains focused on executing to its Medium Term Aspirations (“MTA”) to position itself as Malaysia’s PreferredBanking Group with International Connectivity. The Group’s strategic aspirations centre on developing a well diversifiedbusiness portfolio to deliver sustainable growth via its universal banking group platform and best-in-class key enablers,implementing customer centric business models and expanding regional connectivity in collaboration with ANZ. The Groupwill continue to accelerate growth in non-interest income and low-cost deposits, maintain high vigilance on asset quality, riskdisciplines and cost management, as well as explore potential tactical in-fill acquisitions.
40
Company No. 8515–D
AmBank (M) Berhad (Incorporated in Malaysia) And Its Subsidiaries
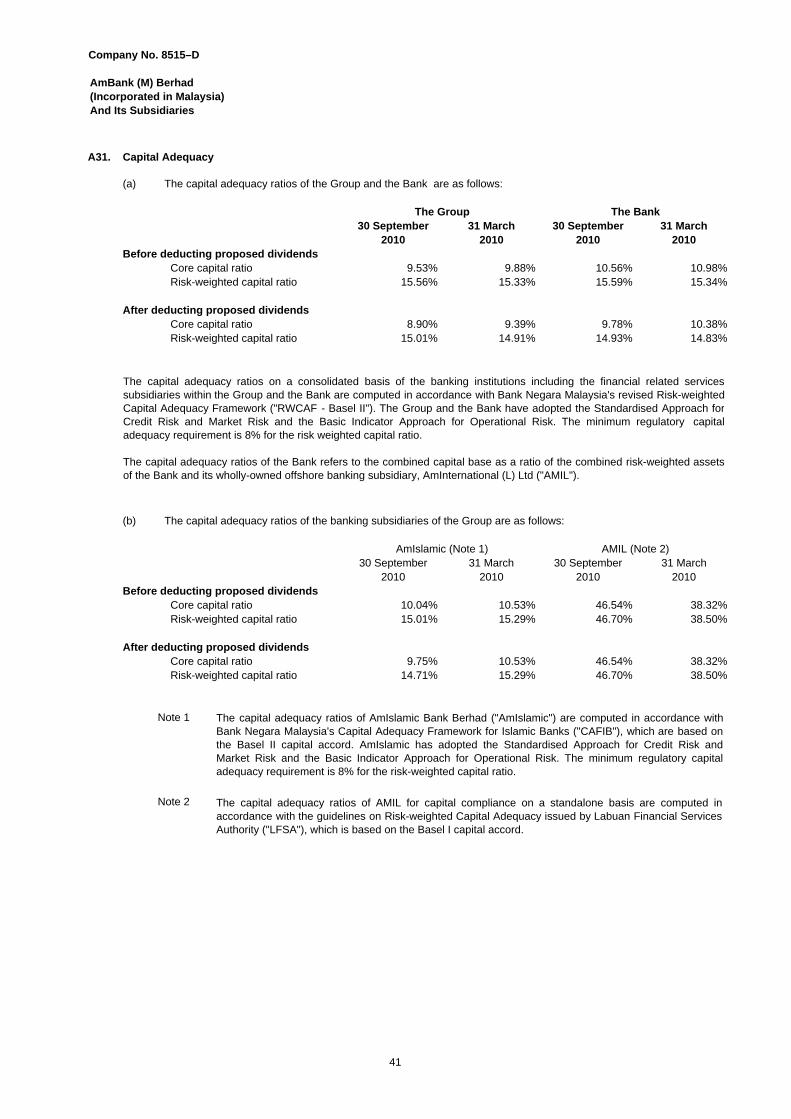
A31. Capital Adequacy
(a) The capital adequacy ratios of the Group and the Bank are as follows:
30 September 31 March 30 September 31 March2010 2010 2010 2010
Before deducting proposed dividends Core capital ratio 9.53% 9.88% 10.56% 10.98% Risk-weighted capital ratio 15.56% 15.33% 15.59% 15.34%
After deducting proposed dividends Core capital ratio 8.90% 9.39% 9.78% 10.38% Risk-weighted capital ratio 15.01% 14.91% 14.93% 14.83%
(b) The capital adequacy ratios of the banking subsidiaries of the Group are as follows:
30 September 31 March 30 September 31 March2010 2010 2010 2010
Before deducting proposed dividends Core capital ratio 10.04% 10.53% 46.54% 38.32% Risk-weighted capital ratio 15.01% 15.29% 46.70% 38.50%
After deducting proposed dividends Core capital ratio 9.75% 10.53% 46.54% 38.32% Risk-weighted capital ratio 14.71% 15.29% 46.70% 38.50%
Note 1
Note 2
The Group The Bank
AmIslamic (Note 1) AMIL (Note 2)
The capital adequacy ratios on a consolidated basis of the banking institutions including the financial related servicessubsidiaries within the Group and the Bank are computed in accordance with Bank Negara Malaysia's revised Risk-weightedCapital Adequacy Framework ("RWCAF - Basel II"). The Group and the Bank have adopted the Standardised Approach forCredit Risk and Market Risk and the Basic Indicator Approach for Operational Risk. The minimum regulatory capitaladequacy requirement is 8% for the risk weighted capital ratio.
The capital adequacy ratios of the Bank refers to the combined capital base as a ratio of the combined risk-weighted assetsof the Bank and its wholly-owned offshore banking subsidiary, AmInternational (L) Ltd ("AMIL").
The capital adequacy ratios of AmIslamic Bank Berhad ("AmIslamic") are computed in accordance withBank Negara Malaysia's Capital Adequacy Framework for Islamic Banks ("CAFIB"), which are based onthe Basel II capital accord. AmIslamic has adopted the Standardised Approach for Credit Risk andMarket Risk and the Basic Indicator Approach for Operational Risk. The minimum regulatory capitaladequacy requirement is 8% for the risk-weighted capital ratio.
The capital adequacy ratios of AMIL for capital compliance on a standalone basis are computed inaccordance with the guidelines on Risk-weighted Capital Adequacy issued by Labuan Financial ServicesAuthority ("LFSA"), which is based on the Basel I capital accord.
41
Company No. 8515–D
AmBank (M) Berhad (Incorporated in Malaysia) And Its Subsidiaries
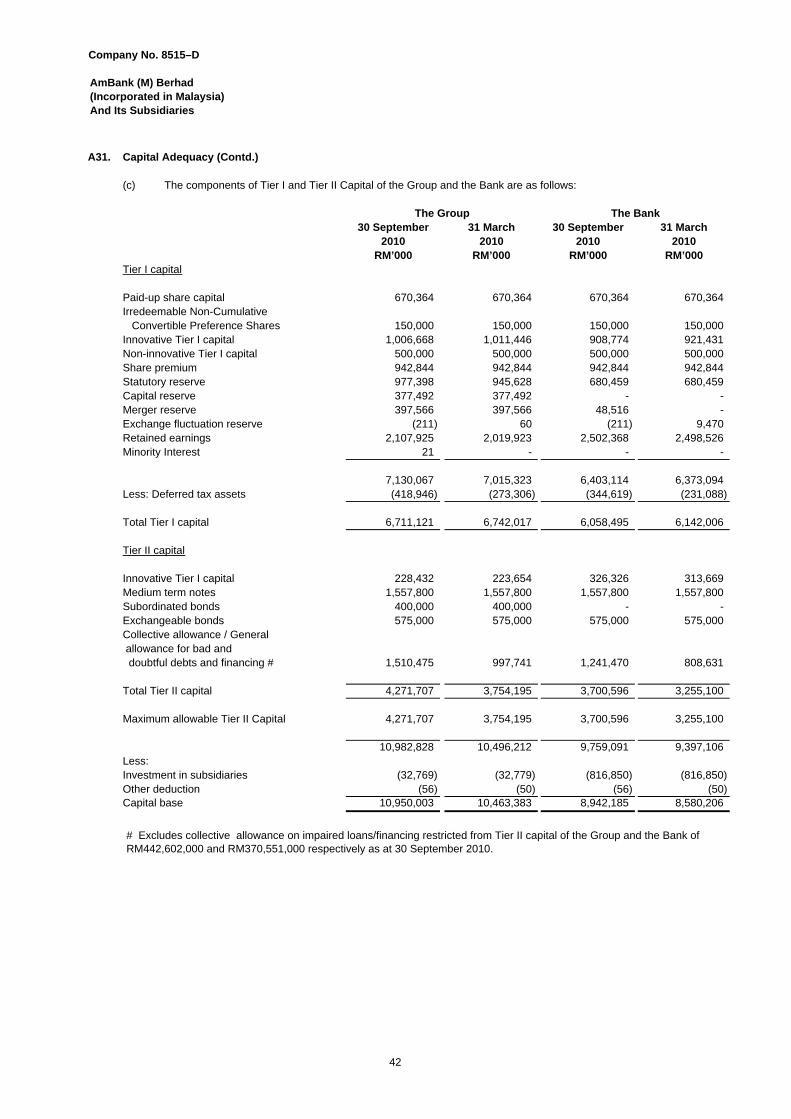
A31. Capital Adequacy (Contd.)
(c) The components of Tier I and Tier II Capital of the Group and the Bank are as follows:
30 September 31 March 30 September 31 March2010 2010 2010 2010
RM’000 RM’000 RM’000 RM’000Tier I capital
Paid-up share capital 670,364 670,364 670,364 670,364 Irredeemable Non-Cumulative Convertible Preference Shares 150,000 150,000 150,000 150,000 Innovative Tier I capital 1,006,668 1,011,446 908,774 921,431 Non-innovative Tier I capital 500,000 500,000 500,000 500,000 Share premium 942,844 942,844 942,844 942,844 Statutory reserve 977,398 945,628 680,459 680,459 Capital reserve 377,492 377,492 - - Merger reserve 397,566 397,566 48,516 - Exchange fluctuation reserve (211) 60 (211) 9,470 Retained earnings 2,107,925 2,019,923 2,502,368 2,498,526 Minority Interest 21 - - -
7,130,067 7,015,323 6,403,114 6,373,094 Less: Deferred tax assets (418,946) (273,306) (344,619) (231,088)
Total Tier I capital 6,711,121 6,742,017 6,058,495 6,142,006
Tier II capital
Innovative Tier I capital 228,432 223,654 326,326 313,669 Medium term notes 1,557,800 1,557,800 1,557,800 1,557,800 Subordinated bonds 400,000 400,000 - - Exchangeable bonds 575,000 575,000 575,000 575,000 Collective allowance / General allowance for bad and doubtful debts and financing # 1,510,475 997,741 1,241,470 808,631
Total Tier II capital 4,271,707 3,754,195 3,700,596 3,255,100
Maximum allowable Tier II Capital 4,271,707 3,754,195 3,700,596 3,255,100
10,982,828 10,496,212 9,759,091 9,397,106 Less:Investment in subsidiaries (32,769) (32,779) (816,850) (816,850) Other deduction (56) (50) (56) (50) Capital base 10,950,003 10,463,383 8,942,185 8,580,206
The Group The Bank
# Excludes collective allowance on impaired loans/financing restricted from Tier II capital of the Group and the Bank of RM442,602,000 and RM370,551,000 respectively as at 30 September 2010.
42
Company No. 8515–D
AmBank (M) Berhad (Incorporated in Malaysia) And Its Subsidiaries
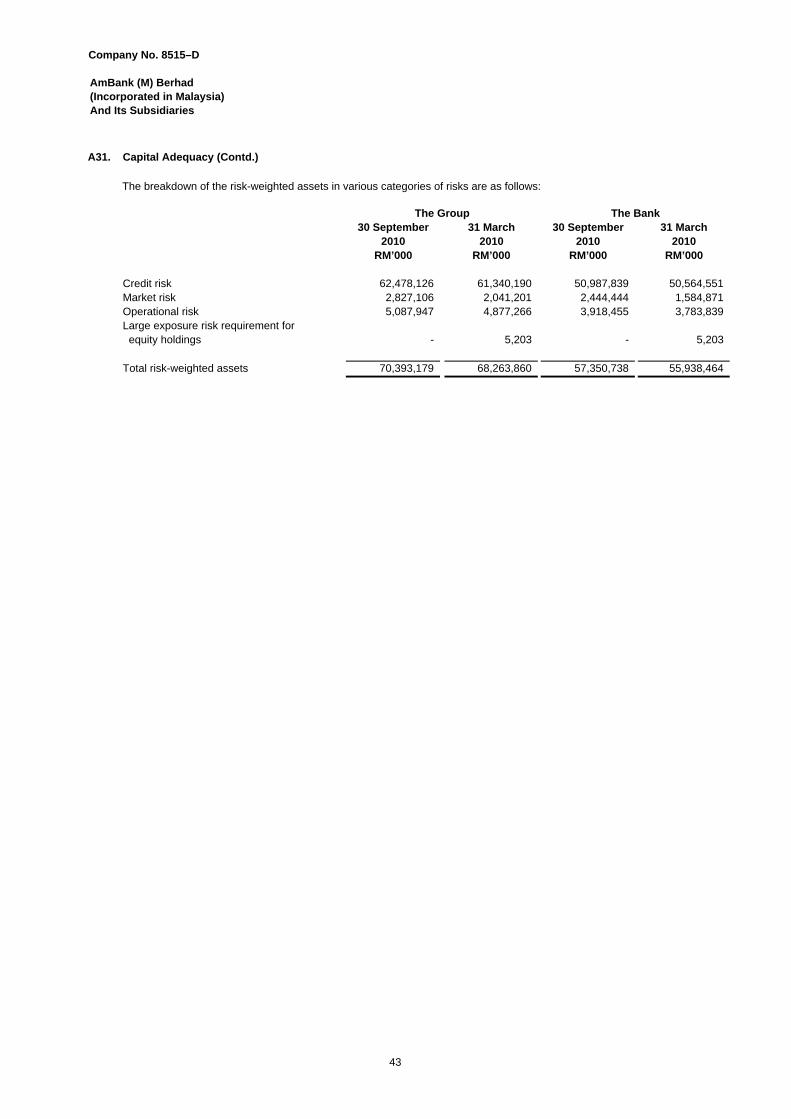
A31. Capital Adequacy (Contd.)
30 September 31 March 30 September 31 March2010 2010 2010 2010
RM’000 RM’000 RM’000 RM’000
Credit risk 62,478,126 61,340,190 50,987,839 50,564,551 Market risk 2,827,106 2,041,201 2,444,444 1,584,871 Operational risk 5,087,947 4,877,266 3,918,455 3,783,839 Large exposure risk requirement for equity holdings - 5,203 - 5,203
Total risk-weighted assets 70,393,179 68,263,860 57,350,738 55,938,464
The Group The Bank
The breakdown of the risk-weighted assets in various categories of risks are as follows:
43
Company No. 8515–D AmBank (M) Berhad(Incorporated in Malaysia)And Its Subsidiaries
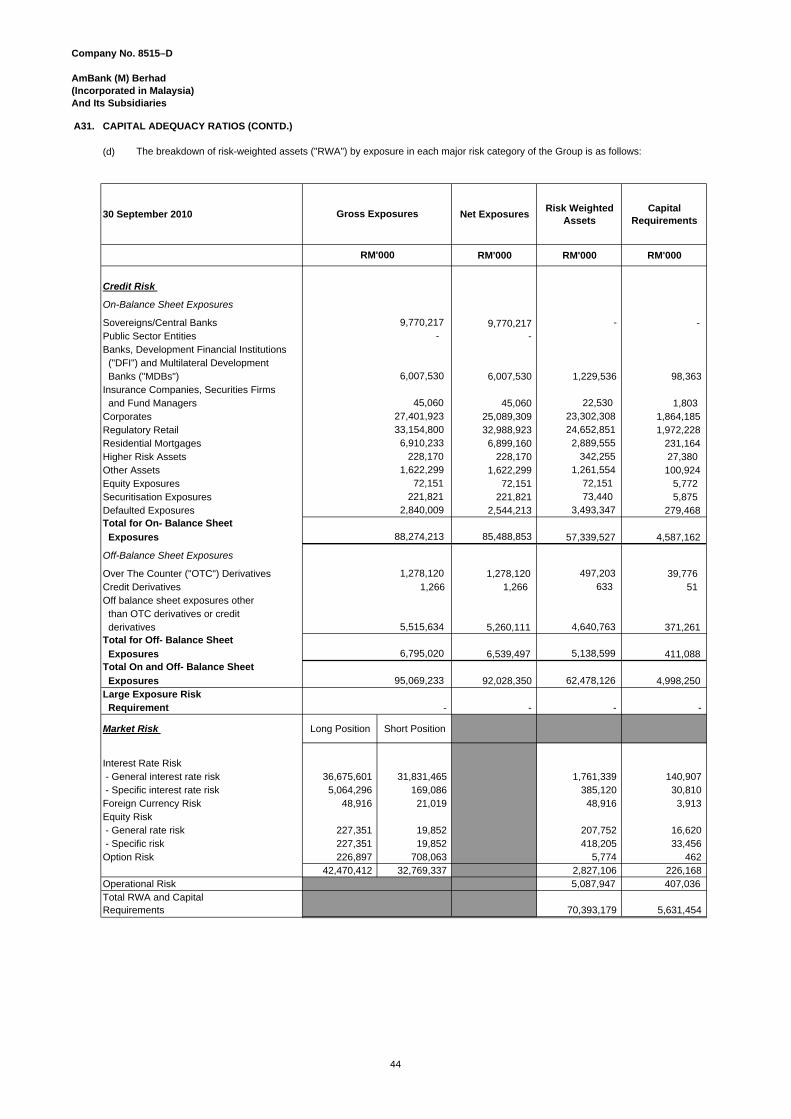
A31. CAPITAL ADEQUACY RATIOS (CONTD.)
(d)
30 September 2010 Net Exposures Risk Weighted
AssetsCapital
Requirements
RM'000 RM'000 RM'000
Credit Risk
On-Balance Sheet Exposures
Sovereigns/Central Banks 9,770,217 - Public Sector Entities - Banks, Development Financial Institutions ("DFI") and Multilateral Development Banks ("MDBs") 6,007,530 98,363 Insurance Companies, Securities Firms and Fund Managers 45,060 1,803 Corporates 25,089,309 1,864,185 Regulatory Retail 32,988,923 1,972,228 Residential Mortgages 6,899,160 231,164 Higher Risk Assets 228,170 27,380 Other Assets 1,622,299 100,924 Equity Exposures 72,151 5,772 Securitisation Exposures 221,821 5,875 Defaulted Exposures 2,544,213 279,468 Total for On- Balance Sheet
Exposures 85,488,853 57,339,527 4,587,162
Off-Balance Sheet Exposures
Over The Counter ("OTC") Derivatives 1,278,120 39,776 Credit Derivatives 1,266 1,266 51 Off balance sheet exposures other than OTC derivatives or credit derivatives 5,260,111 371,261 Total for Off- Balance Sheet
Exposures 6,539,497 411,088 Total On and Off- Balance Sheet
Exposures 92,028,350 4,998,250 Large Exposure Risk Requirement - - -
Market Risk Long Position Short Position
Interest Rate Risk - General interest rate risk 36,675,601 31,831,465 1,761,339 140,907 - Specific interest rate risk 5,064,296 169,086 385,120 30,810 Foreign Currency Risk 48,916 21,019 48,916 3,913 Equity Risk - General rate risk 227,351 19,852 207,752 16,620 - Specific risk 227,351 19,852 418,205 33,456 Option Risk 226,897 708,063 5,774 462
42,470,412 32,769,337 2,827,106 226,168 Operational Risk 5,087,947 407,036 Total RWA and Capital Requirements 70,393,179 5,631,454
6,795,020 5,138,599
-
95,069,233 62,478,126
3,493,347
88,274,213
633 1,278,120 497,203
5,515,634 4,640,763
2,840,009
342,255 1,622,299 1,261,554 72,151 72,151 221,821 73,440
1,229,536
45,060 22,530
6,007,530
27,401,923 23,302,308 33,154,800 24,652,851 6,910,233 2,889,555 228,170
- -
9,770,217
Gross Exposures
RM'000
The breakdown of risk-weighted assets ("RWA") by exposure in each major risk category of the Group is as follows:
44
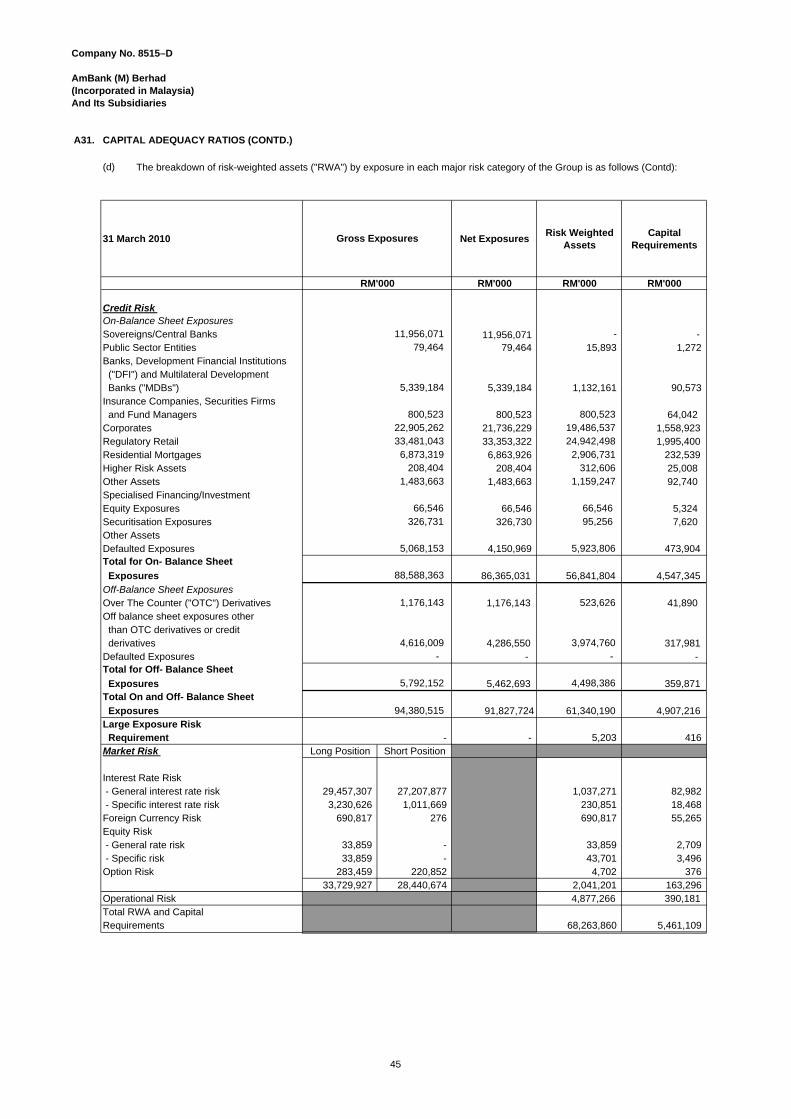
Company No. 8515–D AmBank (M) Berhad(Incorporated in Malaysia)And Its Subsidiaries
A31. CAPITAL ADEQUACY RATIOS (CONTD.)
(d)
31 March 2010 Net Exposures Risk Weighted
AssetsCapital
Requirements
RM'000 RM'000 RM'000
Credit Risk On-Balance Sheet Exposures Sovereigns/Central Banks 11,956,071 - Public Sector Entities 79,464 1,272 Banks, Development Financial Institutions ("DFI") and Multilateral Development Banks ("MDBs") 5,339,184 90,573 Insurance Companies, Securities Firms and Fund Managers 800,523 64,042 Corporates 21,736,229 1,558,923 Regulatory Retail 33,353,322 1,995,400 Residential Mortgages 6,863,926 232,539 Higher Risk Assets 208,404 25,008 Other Assets 1,483,663 92,740 Specialised Financing/Investment Equity Exposures 66,546 5,324 Securitisation Exposures 326,730 7,620 Other Assets Defaulted Exposures 4,150,969 473,904 Total for On- Balance Sheet
Exposures 86,365,031 56,841,804 4,547,345 Off-Balance Sheet ExposuresOver The Counter ("OTC") Derivatives 1,176,143 41,890 Off balance sheet exposures other than OTC derivatives or credit derivatives 4,286,550 317,981 Defaulted Exposures - - Total for Off- Balance Sheet
Exposures 5,462,693 359,871 Total On and Off- Balance Sheet
Exposures 91,827,724 61,340,190 4,907,216 Large Exposure Risk Requirement - 5,203 416 Market Risk Long Position Short Position
Interest Rate Risk - General interest rate risk 29,457,307 27,207,877 1,037,271 82,982 - Specific interest rate risk 3,230,626 1,011,669 230,851 18,468 Foreign Currency Risk 690,817 276 690,817 55,265 Equity Risk - General rate risk 33,859 - 33,859 2,709 - Specific risk 33,859 - 43,701 3,496 Option Risk 283,459 220,852 4,702 376
33,729,927 28,440,674 2,041,201 163,296 Operational Risk 4,877,266 390,181 Total RWA and Capital Requirements 68,263,860 5,461,109
11,956,071 79,464
Gross Exposures
RM'000
5,792,152
33,481,043
4,498,386
88,588,363
1,176,143 523,626
800,523
- 4,616,009
800,523
-
94,380,515
3,974,760 -
- 15,893
5,068,153 5,923,806
66,546 66,546 326,731 95,256
6,873,319 2,906,731 208,404 312,606 1,483,663 1,159,247
24,942,498
5,339,184 1,132,161
22,905,262 19,486,537
The breakdown of risk-weighted assets ("RWA") by exposure in each major risk category of the Group is as follows (Contd):
45
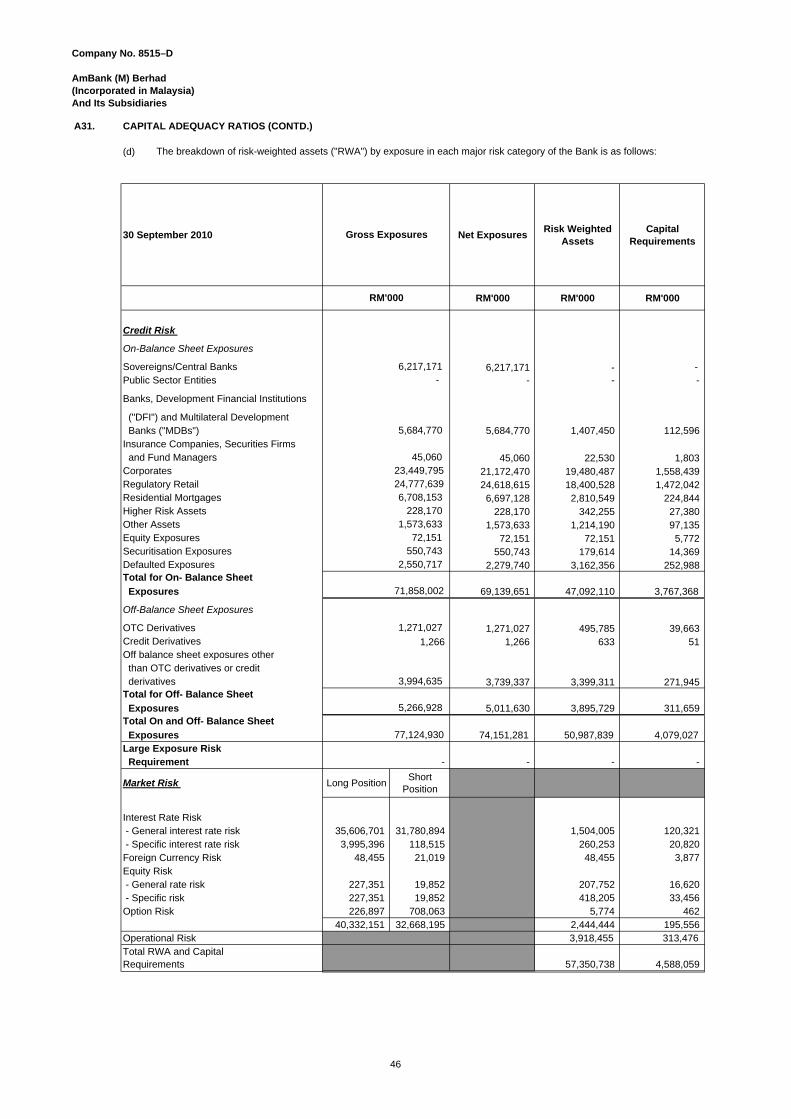
Company No. 8515–D AmBank (M) Berhad(Incorporated in Malaysia)And Its Subsidiaries
A31. CAPITAL ADEQUACY RATIOS (CONTD.)
(d)
30 September 2010 Net Exposures Risk Weighted
AssetsCapital
Requirements
RM'000 RM'000 RM'000
Credit Risk
On-Balance Sheet Exposures
Sovereigns/Central Banks 6,217,171 - Public Sector Entities - -
Banks, Development Financial Institutions
("DFI") and Multilateral Development Banks ("MDBs") 5,684,770 1,407,450 112,596 Insurance Companies, Securities Firms and Fund Managers 45,060 22,530 1,803 Corporates 21,172,470 19,480,487 1,558,439 Regulatory Retail 24,618,615 18,400,528 1,472,042 Residential Mortgages 6,697,128 2,810,549 224,844 Higher Risk Assets 228,170 342,255 27,380 Other Assets 1,573,633 1,214,190 97,135 Equity Exposures 72,151 72,151 5,772 Securitisation Exposures 550,743 179,614 14,369 Defaulted Exposures 2,279,740 3,162,356 252,988 Total for On- Balance Sheet
Exposures 69,139,651 47,092,110 3,767,368
Off-Balance Sheet Exposures
OTC Derivatives 1,271,027 495,785 39,663 Credit Derivatives 1,266 1,266 633 51 Off balance sheet exposures other than OTC derivatives or credit derivatives 3,739,337 3,399,311 271,945 Total for Off- Balance Sheet
Exposures 5,011,630 3,895,729 311,659 Total On and Off- Balance Sheet
Exposures 74,151,281 50,987,839 4,079,027 Large Exposure Risk Requirement - - -
Market Risk Long PositionShort
Position
Interest Rate Risk - General interest rate risk 35,606,701 31,780,894 1,504,005 120,321 - Specific interest rate risk 3,995,396 118,515 260,253 20,820 Foreign Currency Risk 48,455 21,019 48,455 3,877 Equity Risk - General rate risk 227,351 19,852 207,752 16,620 - Specific risk 227,351 19,852 418,205 33,456 Option Risk 226,897 708,063 5,774 462
40,332,151 32,668,195 2,444,444 195,556 Operational Risk 3,918,455 313,476 Total RWA and Capital Requirements 57,350,738 4,588,059
-
5,266,928
77,124,930
3,994,635
1,271,027
71,858,002
2,550,717
1,573,633 72,151 550,743
228,170
5,684,770
45,060 23,449,795 24,777,639 6,708,153
- -
Gross Exposures
RM'000
6,217,171 -
The breakdown of risk-weighted assets ("RWA") by exposure in each major risk category of the Bank is as follows:
46
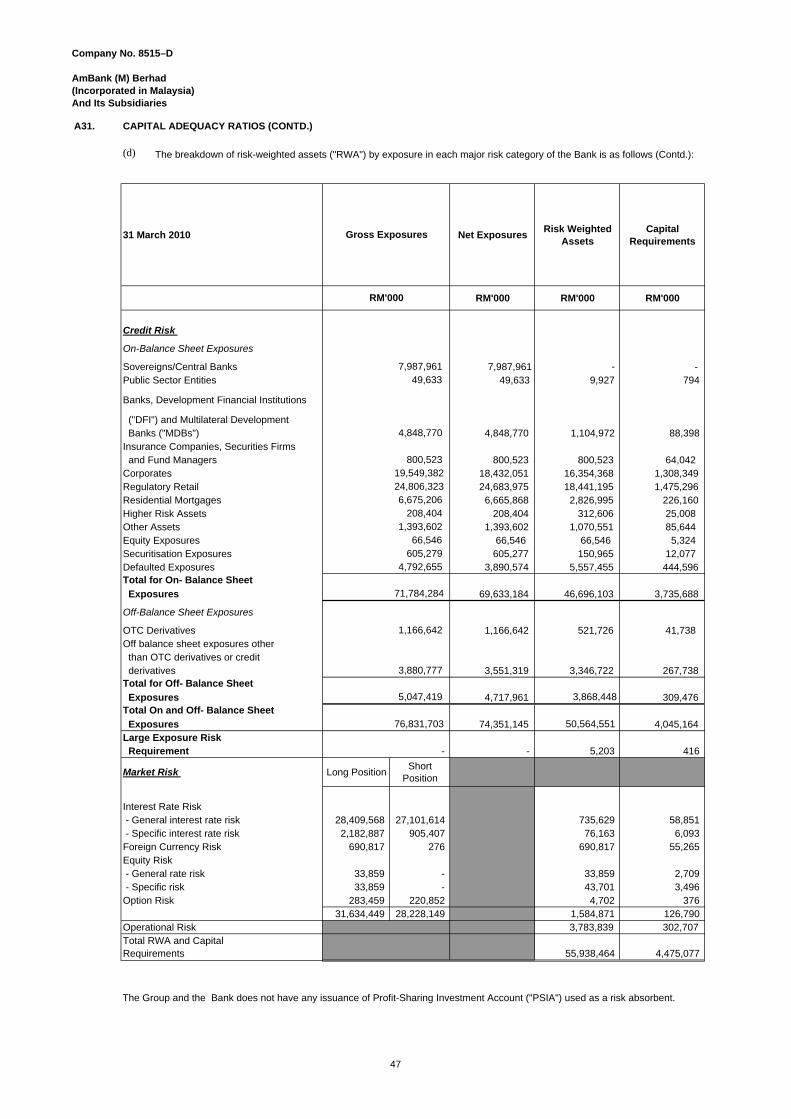
Company No. 8515–D AmBank (M) Berhad(Incorporated in Malaysia)And Its Subsidiaries
A31. CAPITAL ADEQUACY RATIOS (CONTD.)
(d)
31 March 2010 Net Exposures Risk Weighted
AssetsCapital
Requirements
RM'000 RM'000 RM'000
Credit Risk
On-Balance Sheet Exposures
Sovereigns/Central Banks 7,987,961 - Public Sector Entities 49,633 794
Banks, Development Financial Institutions
("DFI") and Multilateral Development Banks ("MDBs") 4,848,770 1,104,972 88,398 Insurance Companies, Securities Firms and Fund Managers 800,523 800,523 64,042 Corporates 18,432,051 16,354,368 1,308,349 Regulatory Retail 24,683,975 18,441,195 1,475,296 Residential Mortgages 6,665,868 2,826,995 226,160 Higher Risk Assets 208,404 312,606 25,008 Other Assets 1,393,602 1,070,551 85,644 Equity Exposures 66,546 66,546 5,324 Securitisation Exposures 605,277 150,965 12,077 Defaulted Exposures 3,890,574 5,557,455 444,596 Total for On- Balance Sheet
Exposures 69,633,184 46,696,103 3,735,688
Off-Balance Sheet Exposures
OTC Derivatives 1,166,642 521,726 41,738 Off balance sheet exposures other than OTC derivatives or credit derivatives 3,551,319 3,346,722 267,738 Total for Off- Balance Sheet
Exposures 4,717,961 309,476 Total On and Off- Balance Sheet
Exposures 74,351,145 4,045,164 Large Exposure Risk Requirement - 5,203 416
Market Risk Long PositionShort
Position
Interest Rate Risk - General interest rate risk 28,409,568 27,101,614 735,629 58,851 - Specific interest rate risk 2,182,887 905,407 76,163 6,093 Foreign Currency Risk 690,817 276 690,817 55,265 Equity Risk - General rate risk 33,859 - 33,859 2,709 - Specific risk 33,859 - 43,701 3,496 Option Risk 283,459 220,852 4,702 376
31,634,449 28,228,149 1,584,871 126,790 Operational Risk 3,783,839 302,707 Total RWA and Capital Requirements 55,938,464 4,475,077
49,633 9,927
Gross Exposures
-
4,848,770
7,987,961
-
76,831,703 50,564,551
5,047,419 3,868,448
3,880,777
208,404
4,792,655
1,393,602 66,546 605,279
71,784,284
1,166,642
RM'000
6,675,206
800,523 19,549,382 24,806,323
The Group and the Bank does not have any issuance of Profit-Sharing Investment Account ("PSIA") used as a risk absorbent.
The breakdown of risk-weighted assets ("RWA") by exposure in each major risk category of the Bank is as follows (Contd.):
47
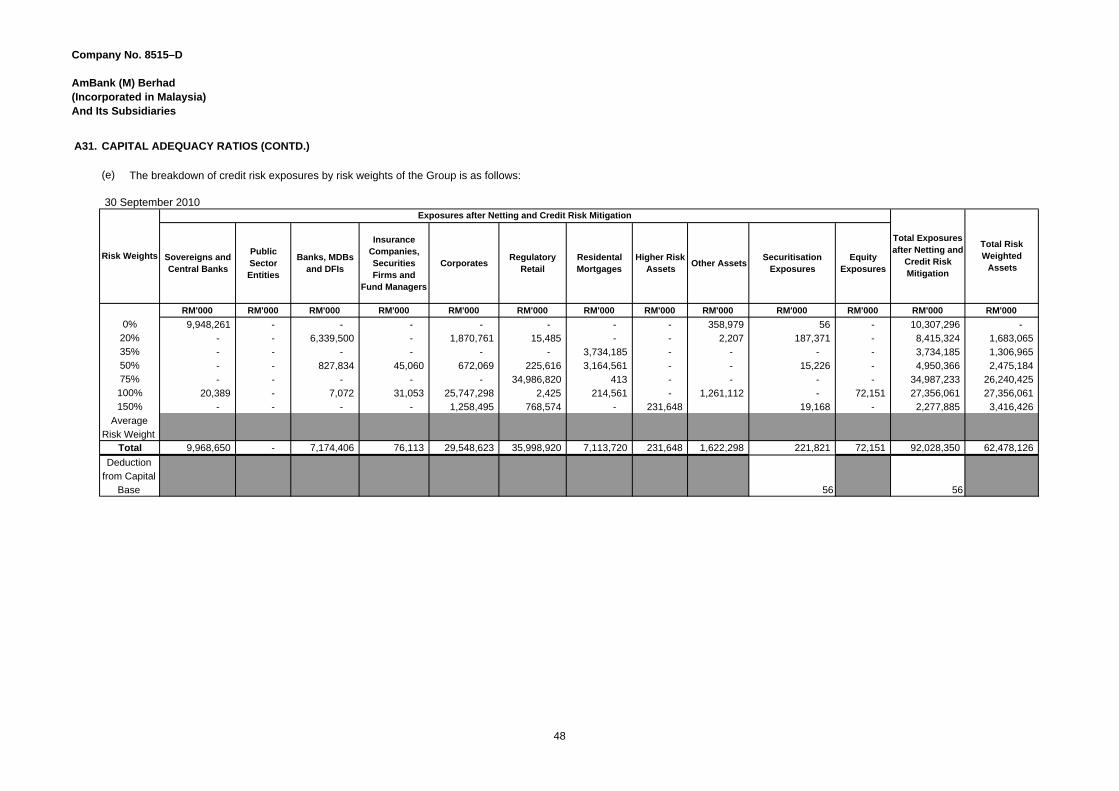
Company No. 8515–D AmBank (M) Berhad(Incorporated in Malaysia)And Its Subsidiaries
A31. CAPITAL ADEQUACY RATIOS (CONTD.)
(e)
30 September 2010
Sovereigns and Central Banks
Public Sector Entities
Banks, MDBs and DFIs
Insurance Companies, Securities Firms and
Fund Managers
CorporatesRegulatory
Retail Residental Mortgages
Higher Risk Assets
Other Assets Securitisation
Exposures Equity
Exposures
RM'000 RM'000 RM'000 RM'000 RM'000 RM'000 RM'000 RM'000 RM'000 RM'000 RM'000 RM'000 RM'000
0% 9,948,261 - - - - - - - 358,979 56 - 10,307,296 - 20% - - 6,339,500 - 1,870,761 15,485 - - 2,207 187,371 - 8,415,324 1,683,065 35% - - - - - - 3,734,185 - - - - 3,734,185 1,306,965 50% - - 827,834 45,060 672,069 225,616 3,164,561 - - 15,226 - 4,950,366 2,475,184 75% - - - - - 34,986,820 413 - - - - 34,987,233 26,240,425 100% 20,389 - 7,072 31,053 25,747,298 2,425 214,561 - 1,261,112 - 72,151 27,356,061 27,356,061 150% - - - - 1,258,495 768,574 - 231,648 19,168 - 2,277,885 3,416,426
Average Risk Weight
Total 9,968,650 - 7,174,406 76,113 29,548,623 35,998,920 7,113,720 231,648 1,622,298 221,821 72,151 92,028,350 62,478,126
Deduction from Capital
Base 56 56
Risk Weights
Exposures after Netting and Credit Risk Mitigation
Total Exposures after Netting and
Credit Risk Mitigation
Total Risk Weighted
Assets
The breakdown of credit risk exposures by risk weights of the Group is as follows:
48
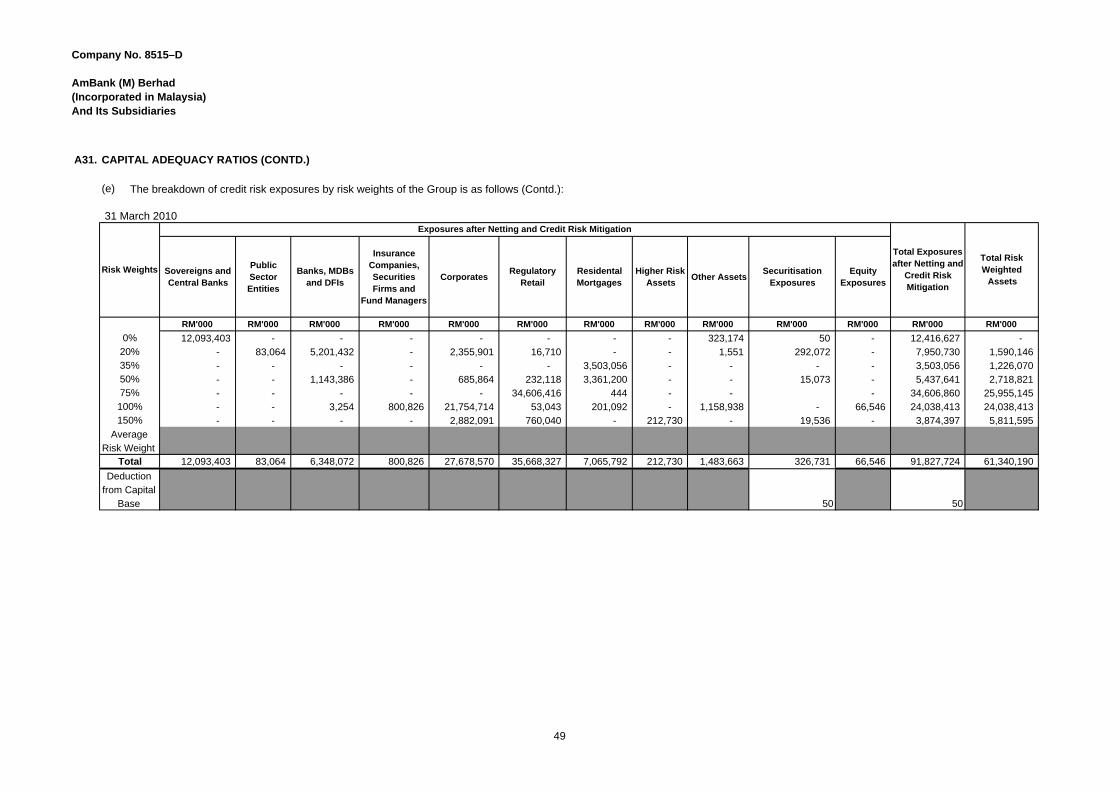
Company No. 8515–D AmBank (M) Berhad(Incorporated in Malaysia)And Its Subsidiaries
A31. CAPITAL ADEQUACY RATIOS (CONTD.)
(e)
31 March 2010
Sovereigns and Central Banks
Public Sector Entities
Banks, MDBs and DFIs
Insurance Companies, Securities Firms and
Fund Managers
CorporatesRegulatory
Retail Residental Mortgages
Higher Risk Assets
Other Assets Securitisation
Exposures Equity
Exposures
RM'000 RM'000 RM'000 RM'000 RM'000 RM'000 RM'000 RM'000 RM'000 RM'000 RM'000 RM'000 RM'000
0% 12,093,403 - - - - - - - 323,174 50 - 12,416,627 - 20% - 83,064 5,201,432 - 2,355,901 16,710 - - 1,551 292,072 - 7,950,730 1,590,146 35% - - - - - - 3,503,056 - - - - 3,503,056 1,226,070 50% - - 1,143,386 - 685,864 232,118 3,361,200 - - 15,073 - 5,437,641 2,718,821 75% - - - - - 34,606,416 444 - - - 34,606,860 25,955,145 100% - - 3,254 800,826 21,754,714 53,043 201,092 - 1,158,938 - 66,546 24,038,413 24,038,413 150% - - - - 2,882,091 760,040 - 212,730 - 19,536 - 3,874,397 5,811,595
Average Risk Weight
Total 12,093,403 83,064 6,348,072 800,826 27,678,570 35,668,327 7,065,792 212,730 1,483,663 326,731 66,546 91,827,724 61,340,190
Deduction from Capital
Base 50 50
Risk Weights
Exposures after Netting and Credit Risk Mitigation
Total Exposures after Netting and
Credit Risk Mitigation
Total Risk Weighted
Assets
The breakdown of credit risk exposures by risk weights of the Group is as follows (Contd.):
49

Company No. 8515–D AmBank (M) Berhad(Incorporated in Malaysia)And Its Subsidiaries
A31. CAPITAL ADEQUACY RATIOS (CONTD.)
(e)
30 September 2010
Sovereigns and Central Banks
Public Sector Entities
Banks, MDBs and DFIs
Insurance Companies, Securities Firms and
Fund Managers
CorporatesRegulatory
Retail Residental Mortgages
Higher Risk Assets
Other Assets Securitisation
Exposures Equity
Exposures
RM'000 RM'000 RM'000 RM'000 RM'000 RM'000 RM'000 RM'000 RM'000 RM'000 RM'000 RM'000 RM'000
0% 6,395,214 - - - - - - 355,492 56 - 6,750,762 - 20% 5,201,428 1,708,024 15,485 4,938 442,856 - 7,372,731 1,474,546 35% - - - - 3,587,459 - - - - 3,587,459 1,255,610 50% 1,636,953 45,060 659,955 225,616 3,109,255 - - 15,226 - 5,692,065 2,846,033 75% - - - 25,441,960 413 - - 82,810 - 25,525,183 19,143,887 100% 20,389 7,072 31,053 21,582,649 2,425 203,978 - 1,213,202 - 72,151 23,132,919 23,132,919 150% - - 1,143,241 697,687 - 230,066 - 19,168 2,090,162 3,134,844
Average Risk Weight
Total 6,415,603 - 6,845,453 76,113 25,093,869 26,383,173 6,901,105 230,066 1,573,632 560,116 72,151 74,151,281 50,987,839
Deduction from Capital
Base 56 56
Risk Weights
Exposures after Netting and Credit Risk Mitigation
Total Exposures after Netting and
Credit Risk Mitigation
Total Risk Weighted
Assets
The breakdown of credit risk exposures by risk weights of the Bank is as follows:
50

Company No. 8515–D AmBank (M) Berhad(Incorporated in Malaysia)And Its Subsidiaries
A31. CAPITAL ADEQUACY RATIOS (CONTD.)
(e)
31 March 2010
Sovereigns and Central Banks
Public Sector Entities
Banks, MDBs and DFIs
Insurance Companies, Securities Firms and
Fund Managers
CorporatesRegulatory
Retail Residental Mortgages
Higher Risk Assets
Other Assets Securitisation
Exposures Equity
Exposures
RM'000 RM'000 RM'000 RM'000 RM'000 RM'000 RM'000 RM'000 RM'000 RM'000 RM'000 RM'000 RM'000
0% 8,125,293 - - - - - - - 319,626 50 - 8,444,969 - 20% - 53,233 4,465,205 - 2,146,764 16,710 - - 4,281 570,619 - 7,256,812 1,451,363 35% - - - - - - 3,374,434 - - - - 3,374,434 1,181,052 50% - - 1,379,100 - 641,614 221,310 3,291,743 - - 15,073 - 5,548,840 2,774,420 75% - - - - 63,091 25,501,399 444 - - 1,427 - 25,566,361 19,174,771 100% - - 3,254 800,523 18,345,473 40,177 187,629 - 1,069,695 - 66,546 20,513,297 20,513,297 150% - - - - 2,744,670 672,406 - 209,820 - 19,536 - 3,646,432 5,469,648
Average Risk Weight
Total 8,125,293 53,233 5,847,559 800,523 23,941,612 26,452,002 6,854,250 209,820 1,393,602 606,705 66,546 74,351,145 50,564,551
Deduction from Capital
Base 50 50
Risk Weights
Exposures after Netting and Credit Risk Mitigation
Total Exposures after Netting and
Credit Risk Mitigation
Total Risk Weighted
Assets
The breakdown of credit risk exposures by risk weights of the Bank is as follows (contd.):
51
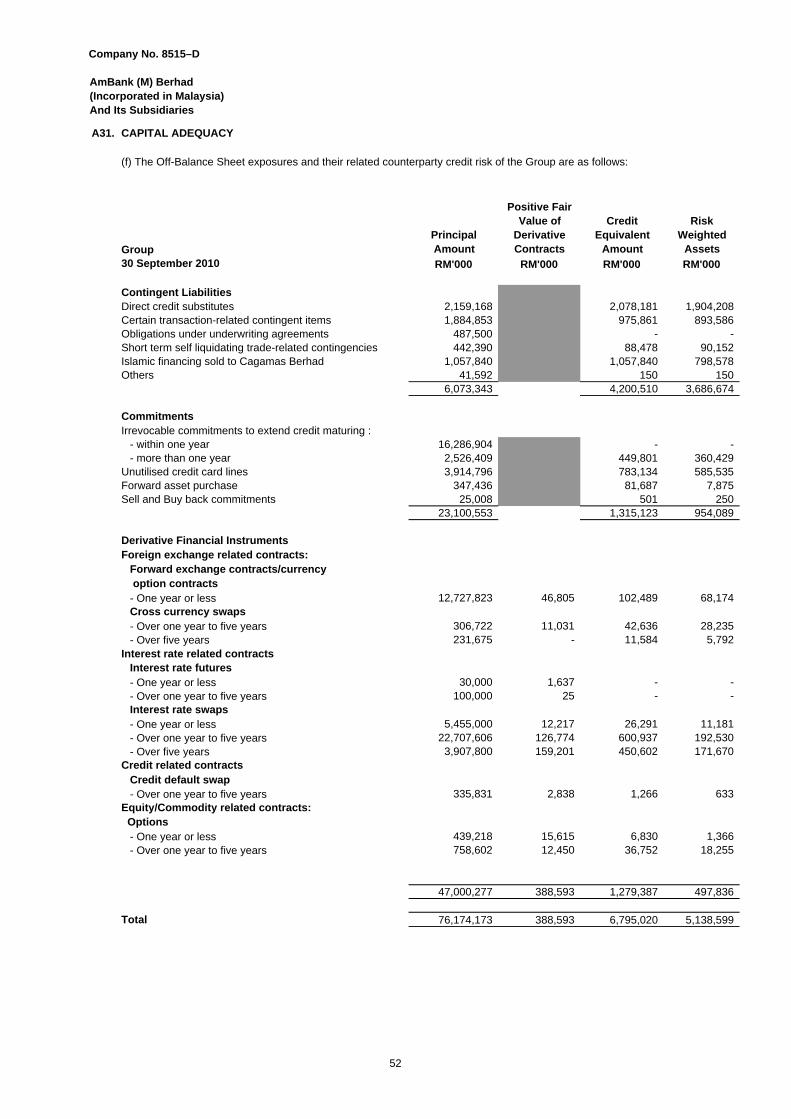
Company No. 8515–D
AmBank (M) Berhad (Incorporated in Malaysia) And Its Subsidiaries
A31. CAPITAL ADEQUACY
(f) The Off-Balance Sheet exposures and their related counterparty credit risk of the Group are as follows:
GroupPrincipal Amount
Positive Fair Value of
Derivative Contracts
Credit Equivalent
Amount
Risk Weighted
Assets 30 September 2010 RM'000 RM'000 RM'000 RM'000
Contingent LiabilitiesDirect credit substitutes 2,159,168 2,078,181 1,904,208Certain transaction-related contingent items 1,884,853 975,861 893,586Obligations under underwriting agreements 487,500 - - Short term self liquidating trade-related contingencies 442,390 88,478 90,152Islamic financing sold to Cagamas Berhad 1,057,840 1,057,840 798,578Others 41,592 150 150
6,073,343 4,200,510 3,686,674
CommitmentsIrrevocable commitments to extend credit maturing :
- within one year 16,286,904 - - - more than one year 2,526,409 449,801 360,429
Unutilised credit card lines 3,914,796 783,134 585,535Forward asset purchase 347,436 81,687 7,875Sell and Buy back commitments 25,008 501 250
23,100,553 1,315,123 954,089
Derivative Financial InstrumentsForeign exchange related contracts:
Forward exchange contracts/currency option contracts- One year or less 12,727,823 46,805 102,489 68,174Cross currency swaps- Over one year to five years 306,722 11,031 42,636 28,235- Over five years 231,675 - 11,584 5,792
Interest rate related contracts Interest rate futures- One year or less 30,000 1,637 - - - Over one year to five years 100,000 25 - - Interest rate swaps- One year or less 5,455,000 12,217 26,291 11,181 - Over one year to five years 22,707,606 126,774 600,937 192,530- Over five years 3,907,800 159,201 450,602 171,670
Credit related contractsCredit default swap- Over one year to five years 335,831 2,838 1,266 633
Equity/Commodity related contracts: Options
- One year or less 439,218 15,615 6,830 1,366 - Over one year to five years 758,602 12,450 36,752 18,255
47,000,277 388,593 1,279,387 497,836
Total 76,174,173 388,593 6,795,020 5,138,599
52
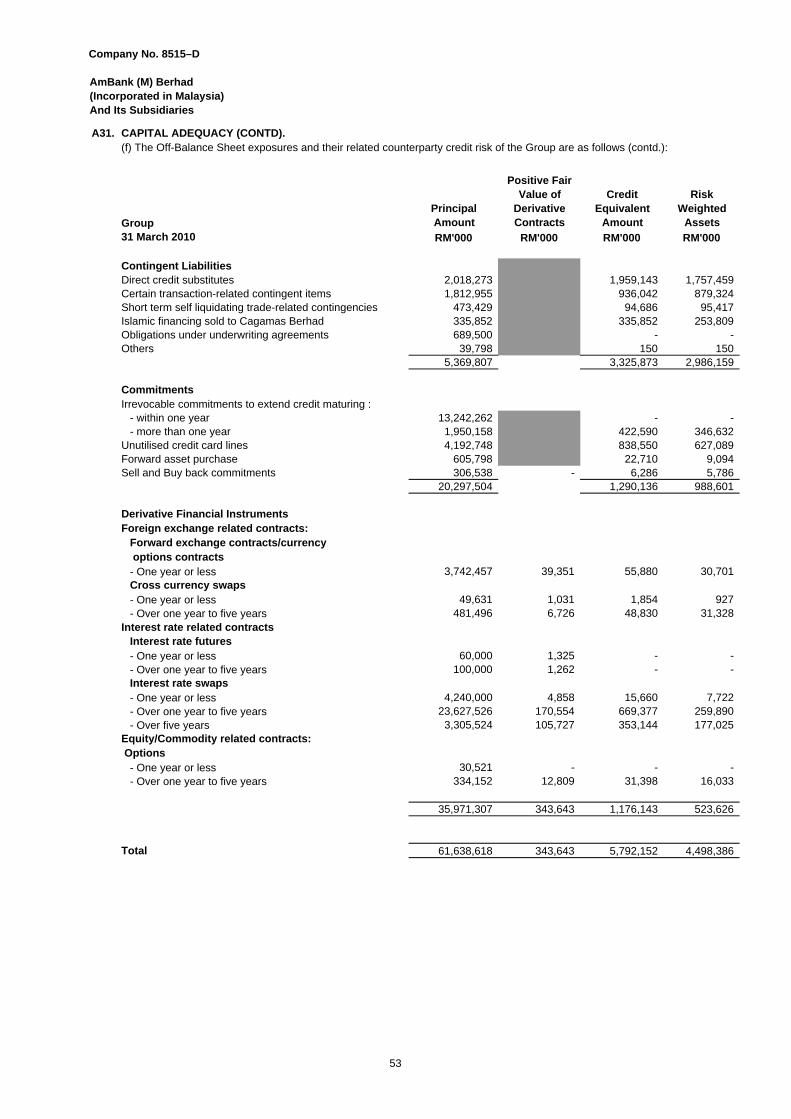
Company No. 8515–D
AmBank (M) Berhad (Incorporated in Malaysia) And Its Subsidiaries
A31. CAPITAL ADEQUACY (CONTD).(f) The Off-Balance Sheet exposures and their related counterparty credit risk of the Group are as follows (contd.):
GroupPrincipal Amount
Positive Fair Value of
Derivative Contracts
Credit Equivalent
Amount
Risk Weighted
Assets 31 March 2010 RM'000 RM'000 RM'000 RM'000
Contingent LiabilitiesDirect credit substitutes 2,018,273 1,959,143 1,757,459Certain transaction-related contingent items 1,812,955 936,042 879,324Short term self liquidating trade-related contingencies 473,429 94,686 95,417Islamic financing sold to Cagamas Berhad 335,852 335,852 253,809Obligations under underwriting agreements 689,500 - - Others 39,798 150 150
5,369,807 3,325,873 2,986,159
CommitmentsIrrevocable commitments to extend credit maturing :
- within one year 13,242,262 - - - more than one year 1,950,158 422,590 346,632
Unutilised credit card lines 4,192,748 838,550 627,089Forward asset purchase 605,798 22,710 9,094Sell and Buy back commitments 306,538 - 6,286 5,786
20,297,504 1,290,136 988,601
Derivative Financial InstrumentsForeign exchange related contracts:
Forward exchange contracts/currency options contracts- One year or less 3,742,457 39,351 55,880 30,701Cross currency swaps- One year or less 49,631 1,031 1,854 927- Over one year to five years 481,496 6,726 48,830 31,328
Interest rate related contracts Interest rate futures- One year or less 60,000 1,325 - - - Over one year to five years 100,000 1,262 - - Interest rate swaps- One year or less 4,240,000 4,858 15,660 7,722- Over one year to five years 23,627,526 170,554 669,377 259,890- Over five years 3,305,524 105,727 353,144 177,025
Equity/Commodity related contracts: Options
- One year or less 30,521 - - - - Over one year to five years 334,152 12,809 31,398 16,033
35,971,307 343,643 1,176,143 523,626
Total 61,638,618 343,643 5,792,152 4,498,386
53
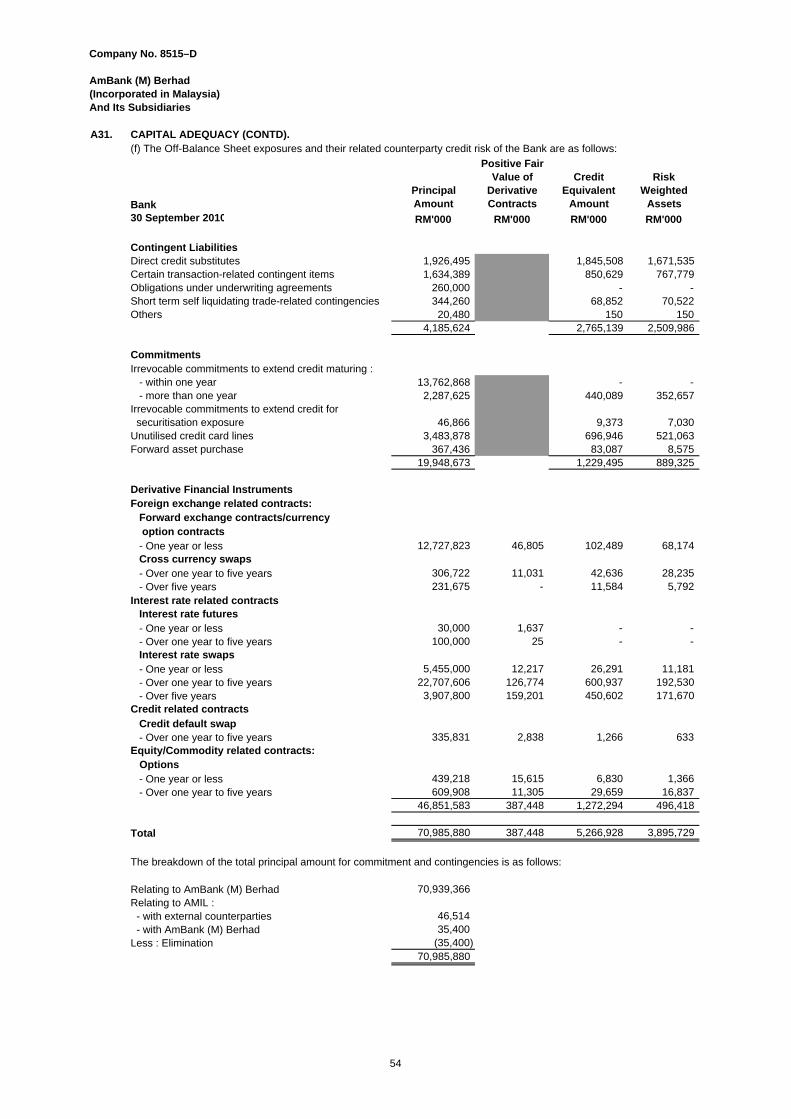
Company No. 8515–D
AmBank (M) Berhad (Incorporated in Malaysia) And Its Subsidiaries
A31. CAPITAL ADEQUACY (CONTD).(f) The Off-Balance Sheet exposures and their related counterparty credit risk of the Bank are as follows:
BankPrincipal Amount
Positive Fair Value of
Derivative Contracts
Credit Equivalent
Amount
Risk Weighted
Assets 30 September 2010 RM'000 RM'000 RM'000 RM'000
Contingent LiabilitiesDirect credit substitutes 1,926,495 1,845,508 1,671,535Certain transaction-related contingent items 1,634,389 850,629 767,779Obligations under underwriting agreements 260,000 - - Short term self liquidating trade-related contingencies 344,260 68,852 70,522Others 20,480 150 150
4,185,624 2,765,139 2,509,986
CommitmentsIrrevocable commitments to extend credit maturing :
- within one year 13,762,868 - - - more than one year 2,287,625 440,089 352,657
Irrevocable commitments to extend credit for securitisation exposure 46,866 9,373 7,030 Unutilised credit card lines 3,483,878 696,946 521,063Forward asset purchase 367,436 83,087 8,575
19,948,673 1,229,495 889,325
Derivative Financial InstrumentsForeign exchange related contracts:
Forward exchange contracts/currency option contracts- One year or less 12,727,823 46,805 102,489 68,174Cross currency swaps- Over one year to five years 306,722 11,031 42,636 28,235 - Over five years 231,675 - 11,584 5,792
Interest rate related contracts Interest rate futures- One year or less 30,000 1,637 - - - Over one year to five years 100,000 25 - - Interest rate swaps- One year or less 5,455,000 12,217 26,291 11,181- Over one year to five years 22,707,606 126,774 600,937 192,530- Over five years 3,907,800 159,201 450,602 171,670
Credit related contractsCredit default swap- Over one year to five years 335,831 2,838 1,266 633
Equity/Commodity related contracts: Options
- One year or less 439,218 15,615 6,830 1,366 - Over one year to five years 609,908 11,305 29,659 16,837
46,851,583 387,448 1,272,294 496,418
Total 70,985,880 387,448 5,266,928 3,895,729
The breakdown of the total principal amount for commitment and contingencies is as follows:
Relating to AmBank (M) Berhad 70,939,366Relating to AMIL : - with external counterparties 46,514 - with AmBank (M) Berhad 35,400Less : Elimination (35,400)
70,985,880
54
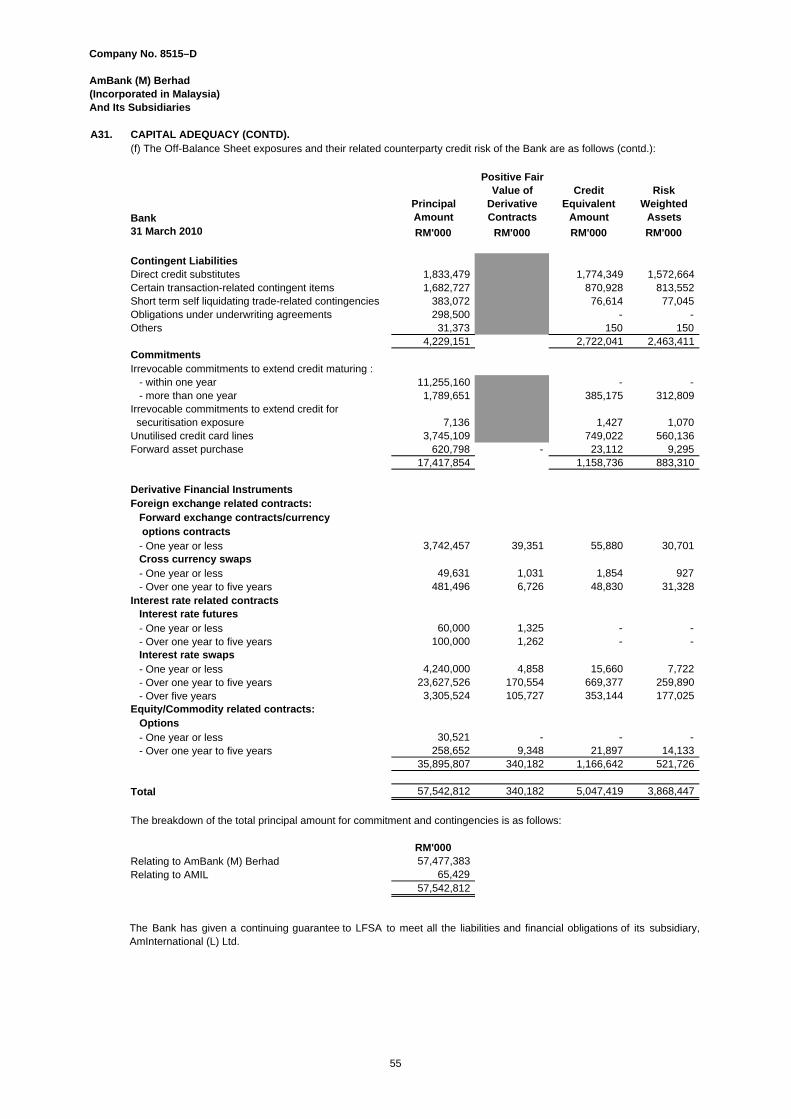
Company No. 8515–D
AmBank (M) Berhad (Incorporated in Malaysia) And Its Subsidiaries
A31. CAPITAL ADEQUACY (CONTD).(f) The Off-Balance Sheet exposures and their related counterparty credit risk of the Bank are as follows (contd.):
BankPrincipal Amount
Positive Fair Value of
Derivative Contracts
Credit Equivalent
Amount
Risk Weighted
Assets 31 March 2010 RM'000 RM'000 RM'000 RM'000
Contingent LiabilitiesDirect credit substitutes 1,833,479 1,774,349 1,572,664Certain transaction-related contingent items 1,682,727 870,928 813,552Short term self liquidating trade-related contingencies 383,072 76,614 77,045Obligations under underwriting agreements 298,500 - - Others 31,373 150 150
4,229,151 2,722,041 2,463,411 CommitmentsIrrevocable commitments to extend credit maturing :
- within one year 11,255,160 - - - more than one year 1,789,651 385,175 312,809
Irrevocable commitments to extend credit for securitisation exposure 7,136 1,427 1,070Unutilised credit card lines 3,745,109 749,022 560,136Forward asset purchase 620,798 - 23,112 9,295
17,417,854 1,158,736 883,310
Derivative Financial InstrumentsForeign exchange related contracts:
Forward exchange contracts/currency options contracts- One year or less 3,742,457 39,351 55,880 30,701Cross currency swaps- One year or less 49,631 1,031 1,854 927- Over one year to five years 481,496 6,726 48,830 31,328
Interest rate related contracts Interest rate futures- One year or less 60,000 1,325 - - - Over one year to five years 100,000 1,262 - - Interest rate swaps- One year or less 4,240,000 4,858 15,660 7,722- Over one year to five years 23,627,526 170,554 669,377 259,890- Over five years 3,305,524 105,727 353,144 177,025
Equity/Commodity related contracts: Options
- One year or less 30,521 - - - - Over one year to five years 258,652 9,348 21,897 14,133
35,895,807 340,182 1,166,642 521,726
Total 57,542,812 340,182 5,047,419 3,868,447
The breakdown of the total principal amount for commitment and contingencies is as follows:
RM'000Relating to AmBank (M) Berhad 57,477,383Relating to AMIL 65,429
57,542,812
The Bank has given a continuing guarantee to LFSA to meet all the liabilities and financial obligations of its subsidiary,AmInternational (L) Ltd.
55
Company No. 8515–D
AmBank (M) Berhad (Incorporated in Malaysia) And Its Subsidiaries
A32. Risk Management Policy on Financial Derivatives
Purpose of engaging in financial derivatives
Financial derivative instruments are contracts whose value is derived from one or more underlying financial instruments orindices. They include swaps, forward rate agreements, futures, options and combinations of these instruments. Derivativesare contracts that transfer risks, mainly market risks. Financial derivative is one of the financial instruments engaged by theGroup both for client solutions generating revenue for future as well as to manage the Group’s own market risk exposure.The Group’s involvement in financial derivatives is currently focused on interest rate, equity and foreign exchange ratederivatives.
The principal foreign exchange rate contracts used are forward foreign exchange contracts, cross currency swaps and foreignexchange options. Forward foreign exchange contracts are agreements to buy or sell a specified quantity of foreign currencyon a specified future date at an agreed rate. A cross currency swap generally involves the exchange, or notional exchange, ofequivalent amounts of two currencies and a commitment to exchange interest periodically until the principal amounts are re-exchanged on a future date. A foreign exchange option is a financial derivative that provides the buyer of the option with theright, but not obligation, to buy/sell a specified amount of one currency for another currency at a nominated strike rate duringa certain period of time or on a specific date.
An Interest Rate Option (“IRO”) is a financial derivative that provides the buyer of the option with the right, but not obligation,to buy/sell a specified underlying interest rate related asset, for example the KLIBOR index at a nominated strike rate during acertain period of time or on a specific date. Basic IRO includes interest rate cap and interest rate floor.
The principal interest rate contracts used are interest rate futures, interest rate swaps and forward rate agreements. Forwardrate agreements are contracts for the payment of the difference between a specified interest rate and a reference rate on anotional deposit at a future settlement date. There is no exchange of principal. An interest rate futures is an exchange tradedcontract whose value is based on the difference between a specific interest rate and a reference rate on a notional deposit orfixed income security at a future settlement date. Interest rate swap transactions generally involve the exchange of fixed andfloating interest payment obligations without the exchange of the underlying principal amounts.
The principal equity contracts used are equity option and equity futures. An equity option is a financial derivative thatrepresents a contract sold by one party (option writer) to another party (option holder). The contract offers the buyer the right,but not the obligation, to buy (call) or sell (put) an equity at an agreed-upon price (the strike price) during a certain period oftime or on a specific date (exercise date). An equity futures contract is an exchange traded contract to buy specific quantitiesof an equity at a specified price with delivery set at a specified time in the future.
The Group maintains trading positions in these instruments and engages in transactions with customers to satisfy their needsin managing their respective interest rate, equity and foreign exchange rate exposures. Derivative transactions generateincome for the Group from the buy-sell spreads. The Group also takes conservative exposures, within acceptable limits, tocarry an inventory of these instruments in order to provide market liquidity and to earn potential gains on fluctuations in thevalue of these instruments.
As part of the asset and liability exposure management, the Group uses derivatives to manage the Group's market riskexposure. As the value of these financial derivatives are principally driven by interest rate and foreign exchange rate factors,the Group uses them to reduce the overall interest rate and foreign exchange rate exposures of the Group. These areperformed by entering into an exposure in derivatives that produces opposite value movements vis-à-vis exposuresgenerated by other non-derivative activities of the Group. The Group manages these risks on a portfolio basis. Hence,exposures on derivatives are aggregated or netted against similar exposures arising from other financial instrumentsengaged by the Group.
Risk associated with financial derivatives
As derivatives are contracts that transfer risks, they expose the holder to the same type of market and credit risk as otherfinancial instruments, and the Group manages these risks in a consistent manner under the overall risk managementframework.
56
Company No. 8515–D
AmBank (M) Berhad (Incorporated in Malaysia) And Its Subsidiaries
A32. Risk Management Policy on Financial Derivatives (Contd.)
-
-
Market risk of derivatives used for trading purposes
Market risk arising from the above interest rate-related, foreign exchange-related and equity-related derivative contractsmeasures the potential losses to the value of these contracts due to changes in market rates/prices. Exposure to market riskmay be reduced through offsetting on and off-balance sheet positions.
The contractual amounts of these contracts provide only a measure of involvement in these types of transactions and do notrepresent the amounts subject to market risk. Value at risk method is used to measure the market risk from these contracts.Value at risk, is a statistical measure that estimates the potential changes in portfolio value that may occur, brought about bydaily changes in market rates over a specified holding period at a specific confidence level under normal market condition.
General disclosure for derivatives and counterparty credit risk
Market related credit risk is present in market instruments (derivatives and forward contracts), and comprises counterpartyrisk (default at the end of contract) and pre-settlement risk (default at any time during the life of contract). Market relatedcredit risk requires a different method in calculating the pre-settlement risk because actual and potential market movementsimpact the Group's exposure. The markets covered by this treatment for transactions entered by the Group include interestrates, foreign exchange, credit default swaps and equities.
For counterparty credit risk, the general approach is to calculate the exposure as the sum of the mark-to-market value of theexposure, plus the sum of the notional principal multiplied by the potential credit risk exposure (PCRE) factor for theexposure.
Exposure to the counterparty risk is governed by setting a credit limit to manage such exposure. This limit is governed underthe Group Risk Appetite Framework approved by the Board.
Other than credit limit setting, the Group’s primary tool to mitigate counterparty credit risk by having collateral arrangementwith the counterparty. Standard market documentation governs the amount of collateral required and the re-marginingfrequency between counterparties. Some of the standard market documentation has link between the amount of collateralrequired and external ratings, as well as minimum transfer amounts. This means that if the Group’s or a counterparty’sexternal rating was downgraded, the Group or the counterparty would likely be required to place additional collateral. Theamount required to be placed would depend on the underlying instruments and the state of the markets, therefore, would bedifferent at each re-margining interval.
Liquidity risk of derivatives
Two types of liquidity risk are associated with derivatives - market liquidity risk and funding risk.
Market liquidity risk arises when a position cannot be sold or closed out quickly or risk be eliminated by entering into anoffsetting position. In general, an over-the-counter ("OTC") market tends to offer less liquidity than an exchange market dueto the customized nature of some OTC contracts. OTC contracts include foreign exchange contracts, cross currency swaps,interest rate swaps and forex options while interest rate futures, equity futures and equity options are examples of exchangetraded derivatives. The liquidity risk of a position can be estimated by the notional amount of contracts held and the marketvalue of the contract position. Both the OTC and exchange markets have liquid and illiquid contracts.
Funding risk is the risk of derivative activities placing an adverse funding and cash flow pressure on the Group, arising fromthe need to post collateral (for example, a margin call due to mark-to-market valuations) to compensate for an existing out ofthe money position (Note: If collateral isn’t posted, the counterparty can close out their position and claim such mark-to-market loss from the Group. This would also result in the Group no longer being hedged).
The mark-to-market is essentially the current replacement cost of the contract, and can be positive or negative.Where it is positive, ("in the money") the Group has credit exposure against the counterparty; if it is negative ("out ofthe money"), the value used in calculation is zero.
The PCRE factors recognize that prices change over the remaining period to maturity, and that risk increases withtime. The PCRE factors are mandated for regulatory capital purposes.
57
Company No. 8515–D
AmBank (M) Berhad (Incorporated in Malaysia) And Its Subsidiaries
A32. Risk Management Policy on Financial Derivatives (Contd.)
(i) Fair value hedge
(ii) Cash flow hedge
(iii) Net investment hedge
Fair value hedges are hedges against exposure to changes in the fair value of a recognised asset or liability or anunrecognised firm commitment that is attributable to a particular risk and could affect profit or loss. For qualifying fairvalue hedges, the changes in fair value of the hedging instrument and the hedged item relating to the hedged riskare recognised in the income statement. In the event the hedge no longer meets the criteria for hedge accounting,the adjustment to the carrying amount of the hedged item is amortised to the income statement over the expectedlife of the hedged item.
Cash flow hedges are hedges of the exposure to variability in future cash flows that is attributable to a particular riskassociated with a recognised asset or liability or a highly probable forecast transaction and could affect profit or loss.For qualifying cash flow hedges, the effective portion of the change in fair value of the hedging instrument is taken toequity as a cash flow hedge reserve. The gain or loss relating to the ineffective portion is recognised immediately inthe income statement. Amounts accumulated in equity are released to the income statement in the periods when thehedged forecast transactions affect the income statement. If the hedged forecast transactions result in therecognition of a non-financial asset or a non-financial liability, the gain and loss previously deferred in equity istransferred from equity and included in the initial measurement of the cost of the asset or liability.
Derivative Financial Instruments and Hedge Accounting
Derivative financial instruments are recognised at fair value upon inception in the statement of financial position, and aresubsequently remeasured at fair value. Fair values of exchange-traded derivatives are obtained from quoted market prices.Fair values of over-the-counter derivatives are obtained using valuation techniques, including the discounted cash flowsmethod and option pricing models. Financial derivatives are classified as assets when their fair values are positive and asliabilities when their fair values are negative.
The Group enters into derivative transactions for trading and for hedging purposes. For derivatives held-for-trading, fair valuechanges are recognised in the income statement. For derivative transactions that meet the specific criteria for hedgeaccounting, the Group applies either fair value, cash flow or net investment hedge accounting.
At the time a financial instrument is designated as a hedge, the Group formally documents the relationship between thehedging instrument and the hedged item, including the nature of the risk to be hedged, the risk management objective andstrategy for undertaking the hedge and the method used to assess hedge effectiveness. Hedges are expected to be highlyeffective and are assessed on an ongoing basis to ensure that they remain highly effective throughout the hedge period. Foractual effectiveness to be achieved, the changes in fair value or cash flows of the hedging instrument and the hedged itemmust offset each other in the range of 80% to 125%.
The Group discontinues hedge accounting if the hedging instrument expires, is sold, terminated or exercised or if the hedgeno longer meets the criteria for hedge accounting or is revoked.
Liquidity risk of derivatives (Contd.)
Generally, the Group measures and monitors funding risk through the cash flow gap analysis according to specified timeinterval. The Group’s access to deposits and funding markets is dependent on its credit rating. A downgrading in the creditrating could adversely affect its access to liquidity, as well as the competitive position, and could increase the cost of funding.
The primary objective of funding risk management is to ensure the availability of sufficient funds at a reasonable cost tohonour all financial commitments as they fall due under normal market condition and on contingency basis.
Net investment hedges are hedges against the exposure to exchange rate fluctuations on the net assets of itsforeign operations. The hedge is accounted for similarly to cash flow hedges. Gains or losses on the hedginginstrument relating to the effective portion of the hedge are taken directly to the foreign currency translation reservewhile those relating to the ineffective portion of the hedge are recognised in the income statement. On disposal ofthe foreign operation, the cumulative gains or losses recognised in equity will be transferred to the income statement.
58
Company No. 8515–D
AmBank (M) Berhad (Incorporated in Malaysia) And Its Subsidiaries
A33.
30 September 31 March 30 September 31 March2010 2010 2010 2010
770,807 799,398 1,074,492 1,118,456
1.02 1.11 1.77 1.91
0.22 0.02 0.16 0.01
A34. Change in accounting policies and Comparatives
(i) FRS 101, Presentation of Financial Statements
(ii) FRS 7, Financial Instruments: Disclosures
(iii) Reclassification of comparatives:
(a) FRS 117 Leases
(b) IC Interpretation 13, Customer Loyalty Programmes
(c)
The Group The Bank
CREDIT EXPOSURES ARISING FROM CREDIT TRANSACTIONS WITH CONNECTED PARTIES
The adoption of FRS 117 during the financial period had resulted in the reclassification of leasehold land which arein substance finance leases to Property and equipment.
The adoption of FRS 7 during the financial period results in more extensive disclosures of financial instruments in the annualfinancial statements. The standard also requires disclosure of the statement of financial position, income statement andstatement of comprehensive income to be made by categories of financial assets and liabilities, which has minimal impact onthe comparative disclosures of the Group, as the current presentation is already made by categories of financial assets andliabilities.
The adoption of IC 13 had resulted in the set-off of customer loyalty programme expenses with fee income insteadof interest income as previously presented.
During the first quarter of the current financial year, the Group changed the presentation of Net Income from IslamicBanking Business. Previously, amount relating to transfer from/(to) profit equalisation reserve was included as partof Net Income from Islamic Banking Business. In line with the Ultimate holding company's presentation, the aboveitem has been separately disclosed in the Consolidated Income Statement.
Following the adoption of FRS 101 (revised), all non-owner changes in equity which were previously presented in thestatement of changes in equity are now included in the statement of comprehensive income as other comprehensiveincome. Consequently, components of comprehensive income are no longer presented in the statement of changes inequity.
Outstanding credit exposures with connected parties (RM'000)
Percentage of outstanding credit exposures to connected parties as proportion of total credit exposures (%)
Percentage of outstanding credit exposures with connected parties which is non-performing or in default (%)
The credit exposures above are derived based on Bank Negara Malaysia’s revised Guidelines on Credit Transactions andExposures with Connected Parties, which are effective on 1 January 2008.
59
Company No. 8515–D
AmBank (M) Berhad (Incorporated in Malaysia) And Its Subsidiaries
A34. Change in accounting policies and Comparatives (contd.)
(iii) Reclassification of comparatives (Contd.):
As previously Reclassification As restatedreported
RM'000 RM'000 RM'000
The GroupStatement of Financial position as at 31 March 2010
Prepaid land lease payments 3,815 (3,815) - Property and equipment 183,923 3,815 187,738
Consolidated Income Statement for the period ended 30 September 2009
Interest income 1,743,168 3,058 1,746,226Net income from Islamic Banking business 326,233 53 326,286 Other operating income 248,561 (3,058) 245,503Transfer from/(to) profit equalisation reserve - (53) (53)
The Bank
Prepaid land lease payments 2,781 (2,781) - Property and equipment 159,683 2,781 162,464
Income Statement for the period ended 30 September 2009Interest income 1,740,711 3,058 1,743,769 Other operating income 491,753 (3,058) 488,695
(iv) Restatement of opening reserves:
The Group
Effect on opening Retained Earnings 2,057,820 (171,258) 1,886,562 Effect on Other Reserves 55,363 (45,703) 9,660
The Bank
Effect on opening Retained Earnings 2,425,419 (129,354) 2,296,065 Effect on Other Reserves 53,454 (40,258) 13,196
The adoption of FRS 139 had resulted in restatement of reserves as follows:
Statement of Financial position as at 31 March 2010
The following comparative figures which have been restated arising from the above are as follows:
60


