

AN ENTREPRENEURIAL ANALYSIS OF THE SPECIALTY FOOD MARKET: STARTING YOUR OWN CUSTOM BAKE SHOP
Sylina Phelan
A Thesis Submitted to the University of North Carolina Wilmington in Partial Fulfillment
of the Requirements for the Degree of Master of Business Administration
Cameron School of Business
University of North Carolina Wilmington
2011
Approved by
Advisory Committee
Rebecca Porterfield W. Andrew Clark
L. Vince Howe Chair
Accepted by
Dean, Graduate School

ii
TABLE OF CONTENTS
ABSTRACT .............................................................................................................................................................. iv
ACKNOWLEDGMENTS ........................................................................................................................................ v
DEDICATION .......................................................................................................................................................... vi
LIST OF TABLES................................................................................................................................................... vii
LIST OF CHARTS ................................................................................................................................................ viii
LITERATURE REVIEW ........................................................................................................................................ 1
Entrepreneurship .................................................................................................................................................. 1
Definition of Entrepreneurship .......................................................................................... 1
Success Factors of Entrepreneurs...................................................................................... 3
Success Factors of Female Entrepreneurs ...................................................................... 5
The Entrepreneurial Baked Goods Industry ......................................................................................... 7
Custom Baked Goods .............................................................................................................. 7
The Future of the Baked Goods Industry ........................................................................ 9
FEASIBILITY ANALYSIS ....................................................................................................................................13
Introduction ........................................................................................................................................................... 13
Management Vision .............................................................................................................. 13
Opportunity Rationale ......................................................................................................... 14
Company Description .......................................................................................................... 15
Product Description ............................................................................................................. 15
Industry .................................................................................................................................................................... 17
Context for the Industry ..................................................................................................... 17
Open to New Entrants ......................................................................................................... 19
Innovation ................................................................................................................................ 19
Market Size .............................................................................................................................. 20
Loyalty ....................................................................................................................................... 20
Customer ................................................................................................................................................................. 21
Target Customer Profile ..................................................................................................... 21

iii
Demographic Analysis of the Target Market .............................................................. 23
Psychographic Analysis of the Target Market ............................................................ 24
Access to the Customer ....................................................................................................... 24
Competition ........................................................................................................................................................... 26
Strengths ................................................................................................................................... 27
Weaknesses ............................................................................................................................. 28
Key Success Factors .......................................................................................................................................... 30
Strategies ................................................................................................................................................................. 31
Marketing Strategy ............................................................................................................... 31
Sales Strategy .......................................................................................................................... 33
Pricing Strategy ...................................................................................................................... 33
Operations Plan ................................................................................................................................................... 34
Production Cycle .................................................................................................................... 34
Operations Strategy .............................................................................................................. 36
Development Plan .............................................................................................................................................. 36
Financials ................................................................................................................................................................ 38
Workforce ............................................................................................................................................................... 40
Employee Roles ...................................................................................................................... 40
External members ................................................................................................................. 42
Compensation and Ownership ......................................................................................... 42
REFERENCES ........................................................................................................................................................44
APPENDIX ..............................................................................................................................................................47
Appendix A: Target Market .......................................................................................................................... 47
Appendix B: Competition ............................................................................................................................... 49
Appendix C: Time Schedule .......................................................................................................................... 50
Appendix D: Financials .................................................................................................................................... 53
Appendix E: Product Samples ..................................................................................................................... 63
iv
ABSTRACT
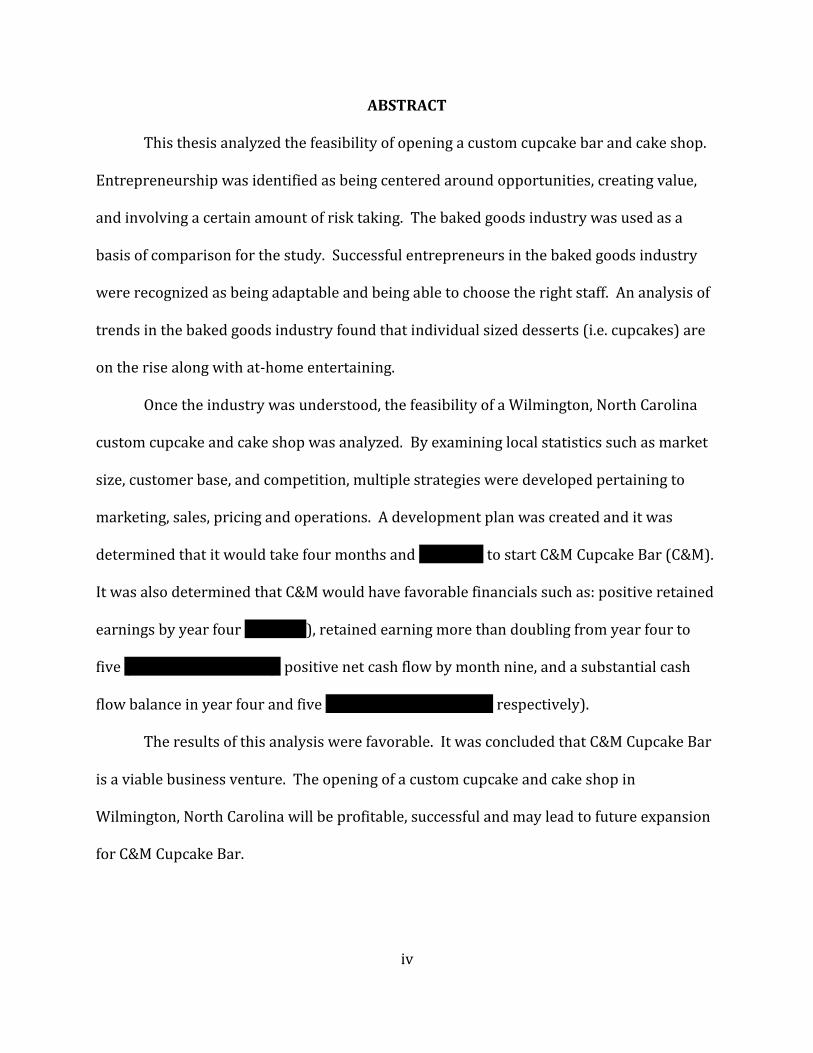
This thesis analyzed the feasibility of opening a custom cupcake bar and cake shop.
Entrepreneurship was identified as being centered around opportunities, creating value,
and involving a certain amount of risk taking. The baked goods industry was used as a
basis of comparison for the study. Successful entrepreneurs in the baked goods industry
were recognized as being adaptable and being able to choose the right staff. An analysis of
trends in the baked goods industry found that individual sized desserts (i.e. cupcakes) are
on the rise along with at-home entertaining.
Once the industry was understood, the feasibility of a Wilmington, North Carolina
custom cupcake and cake shop was analyzed. By examining local statistics such as market
size, customer base, and competition, multiple strategies were developed pertaining to
marketing, sales, pricing and operations. A development plan was created and it was
determined that it would take four months and $108,757 to start C&M Cupcake Bar (C&M).
It was also determined that C&M would have favorable financials such as: positive retained
earnings by year four ($61,742), retained earning more than doubling from year four to
five ($64,742 to $185,449), positive net cash flow by month nine, and a substantial cash
flow balance in year four and five ($196,135 and $339,154 respectively).
The results of this analysis were favorable. It was concluded that C&M Cupcake Bar
is a viable business venture. The opening of a custom cupcake and cake shop in
Wilmington, North Carolina will be profitable, successful and may lead to future expansion
for C&M Cupcake Bar.
v
ACKNOWLEDGMENTS
I would like to thank everybody who provided support and guidance throughout the
process of writing this thesis. Thank you to my professors and readers, Dr. Porterfield and
Dr. Clark for their patience, guidance and dedication. Thank you to Angela Dunkhorst for
consistently providing exceptional and friendly assistance during this process. Also, thank
you to my family and friends for their continued support and encouragement. To my
parents and grandparents, I thank you for your continued patience and for always being
there to push me. To Jimmy, I sincerely appreciate your tolerance, understanding, and
help in realizing my dreams. I could not have completed this without any of the
aforementioned people and for that I am extremely grateful.

vi
DEDICATION
This thesis is dedicated to my mother, my rock, “Cath”. There is no doubt in my
mind that without her continued love and support I would not be who or where I am today.
vii
LIST OF TABLES
Table Page
1. Selected definitions of entrepreneurship ...................................................................................... 1
2. Factors that contribute to the success of women business owners ..................................... 6
3. Industry structure of the coffee and snack shop industry ....................................................... 18
4. Key external drivers of the coffee and snack shop industry ................................................... 18
5. Food budget spent on dining out according to household income ...................................... 21
6. Food budget spent on dining out according to age ..................................................................... 22
7. Abridged work breakdown structure .............................................................................................. 37
8. Profit margins............................................................................................................................................ 39
9. High level income statement ............................................................................................................... 40
10. High level cash flow statement ........................................................................................................... 40
11. Proposed core staff members, qualifications, and responsibilities ...................................... 41
12. Shared responsibilities of owners ..................................................................................................... 41
13. External members, functions, and qualifications ........................................................................ 42

viii
LIST OF CHARTS
Chart Page
1. Seasonality of cake sales ....................................................................................................................... 10
2. Product and service segmentations of the coffee and snack shop industry ..................... 17
3. Competition and direct substitute categories and businesses in the Wilmington market .................................................................................................................... 27

LITERATURE REVIEW
Entrepreneurship
Definition of Entrepreneurship
“Throughout the theoretical history of entrepreneurship, scholars from multiple
disciplines in the social sciences have grappled with a diverse set of interpretations and
definitions to conceptualize this abstract idea” (Burnett, 2000). In the book Strategic
Entrepreneurship: Creating a New Mindset (2002), the authors offer a summary of the main
definitions from the most significant authors of entrepreneurship through the years. Table
1 summarizes these definitions.
Table 1: Selected Definitions of Entrepreneurship
Author Definition
Schumpeter
(1934)
Entrepreneurship is seen as new combinations including the doing of
new things or the doing of things that are already being done in a new
way. New combinations include (1) introduction of new good, (2) new
method of production, (3) opening of a new market, (4) new source of
supply, (5) new organizations.
Kirzner
(1973)
Entrepreneurship is the ability to perceive new opportunities. This
recognition and seizing of the opportunity will tend to “correct” the
market and bring it back to equilibrium.
Drucker
(1985)
Entrepreneurship is the act of innovation that involves endowing
existing resources with new wealth capacity.
Stevenson,
Roberts &
Grousbeck
(1985)
Entrepreneurship is the pursuit of an opportunity without concern for
current resources or capabilities.
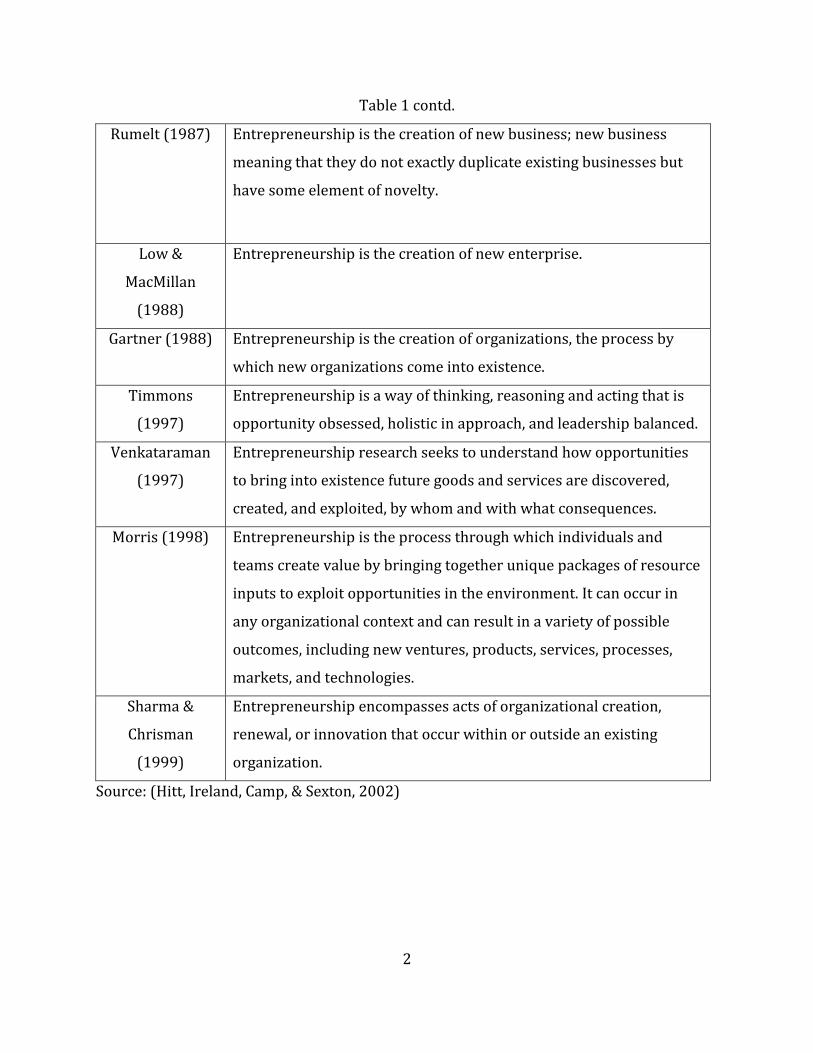
2
Table 1 contd.
Rumelt (1987) Entrepreneurship is the creation of new business; new business
meaning that they do not exactly duplicate existing businesses but
have some element of novelty.
Low &
MacMillan
(1988)
Entrepreneurship is the creation of new enterprise.
Gartner (1988) Entrepreneurship is the creation of organizations, the process by
which new organizations come into existence.
Timmons
(1997)
Entrepreneurship is a way of thinking, reasoning and acting that is
opportunity obsessed, holistic in approach, and leadership balanced.
Venkataraman
(1997)
Entrepreneurship research seeks to understand how opportunities
to bring into existence future goods and services are discovered,
created, and exploited, by whom and with what consequences.
Morris (1998) Entrepreneurship is the process through which individuals and
teams create value by bringing together unique packages of resource
inputs to exploit opportunities in the environment. It can occur in
any organizational context and can result in a variety of possible
outcomes, including new ventures, products, services, processes,
markets, and technologies.
Sharma &
Chrisman
(1999)
Entrepreneurship encompasses acts of organizational creation,
renewal, or innovation that occur within or outside an existing
organization.
Source: (Hitt, Ireland, Camp, & Sexton, 2002)

3
While the definitions of entrepreneurship vary, most share a few common threads.
These characteristics include the following:
1. Entrepreneurship is centered around opportunities; the realization of them, and the
capitalization on them.
2. Entrepreneurship does not always involve large scale innovation; it is more a matter
of creating value in some way, whether that is inventing a whole new product or
simply bringing an existing product to an underserved market.
3. Entrepreneurship involves a certain amount of risk taking; the very meaning of an
opportunity is a chance, which implies there is possibility for failure.
Success Factors of Entrepreneurs
“As we all know by now, there is no “secret sauce”. But there are a number of
“recipes for success” with specific ingredients that if applied, may smooth the path
upward.” (Blendstrup, 2007). Some factors for success have been identified by Susan
Wilson Solovic in her book 10 Common Mistakes Start-Up Businesses Make (2004). The ten
factors are:
Having a strong support system. Taking on a new venture is a highly time
consuming task, which requires support and understanding from those closest to
the entrepreneur.
Understand the market and industry. An entrepreneur must do his/her homework
ahead of time to fully be prepared for a new venture.
Accurately estimate costs. Being underfinanced can set a business up for failure
from the very beginning.

4
Make accurate projections of sales. Typically sales take twice as long as
entrepreneurs estimate which can lead to various problems including, but not
limited to, requiring additional financing.
Always focus on financials. An entrepreneur should know not only his/her product
or service well but also needs to understand why and how his/her business is failing
or succeeding.
Hire the right people. A small company cannot afford to make staffing mistakes
because of the extremely important role these people play in building a business.
Seek the truth, not confirmation. Entrepreneurs should encourage feedback that
points out any weaknesses in order to be aware and fix them.
Avoid unnecessary partners. It is imperative for an entrepreneur to protect
themselves when entering a business partnership. A signed partnership agreement
can act as a prenuptial agreement in the event of failure of the business.
Always have a solid business plan. A business plan provided an entrepreneur with a
clear direction, focus, and steps to reach desired goals.
(Solovic, 2004)
In a business report on what it takes to be a successful entrepreneur, Stuart Crainer
interviewed ten successful, diverse, real-life entrepreneurs on their experiences and what
they think it takes to be entrepreneurially successful. The majority of these interviews
resulted in the following list:
A good, complementary team
Flexibility and adaptability
Perseverance

5
A balance of optimism and realism
Confidence
Desire
Good communication
(Crainer, 2011)
While the above lists from real-life entrepreneurs focus on personal traits, others hold the
view that success is less personal and more skill oriented. “Brush and Hisrich point out
that previous experience, financial skills, idea generation and market opportunity
motivation are key factors toward business success” (Lee, Stearns, Osteryoung, &
Stephenson, 2009). This view places higher value on what an entrepreneur did before the
entrepreneurial venture and their skill set rather than personal qualities such as
confidence and perseverance.
Success Factors of Female Entrepreneurs
Recent attention has been focused on the role of female entrepreneurs. Females are
becoming prominent fixtures in the entrepreneurial field and many scholars even consider
it a revolution. As of 2011, it is estimated that there are over 8.1 million women-owned
businesses in the United States, generating nearly $1.3 trillion in revenues and employing
nearly 7.7 million people. Between 1997 and 2011, when the number of businesses in the
United States increased by 34%, the number of women-owned firms increased by 50% - a
rate 1½ times the national average” (American Express OPEN, 2011).
In addition to the success factors of all entrepreneurs, many argue that female
entrepreneurs require additional aspects in order to succeed. Researchers Richard Cuba,
David DeCenzo and Andrea Anish (1983) found that successful female entrepreneurs were
those who were willing and able to delegate everyday business activities to subordinates.

6
On the other hand, researchers Gundry and Welsch published that “high growth-oriented
female entrepreneurs perceive the key strategic success factors to be the reputation of
their business, a strong focus on the quality of the product or service, available cash to
grow the business, and effective leadership” (Lee, Stearns, Osteryoung, & Stephenson,
2009). Lee et al. (2009) found in a study that the success of female entrepreneurs is based
on the competitiveness of the type of business and the female business owner’s managerial
ability rather than communication ability, family support and the succession of the
business.” Lastly, as summarized by Mayasmi and Goby (1999), others had different views
which are illustrated in the following table.
Table 2: Factors that contribute to the success of women business owners
Factors Hisrich and O’Brien (1981)
Bachemin (1989)
Woodward (1988)
Kotter (1982)
Family Support * Communication Skills * * Personal Qualities * Presence of Opportunities
*
Desire to Succeed * * Source: (Mayasmi & Goby, 1999) The personal qualities Hisrich and O’Brien (1981) refer to are self-discipline, perseverance,
and an intense desire to succeed, much of which are factors of success of any entrepreneur.
Hisrich and O’Brien (1981) also cite family support as an important success factor.
Bachemin (1989) concurs with the view that desire to succeed is a factor but also notes the
ability to identify and seize opportunities as important and a relentless drive to make ideas
work. Lastly, Woodward (1988) and Kotter (1982) both share the view that
communication skills are the major success factor for female entrepreneurs.

7
It is clear that there is not one secret ingredient to success for entrepreneurs and/or
female entrepreneurs. However, the research and multiple qualities identified over the
years are important to note in order for entrepreneurs to increase their chances for
success.
The Entrepreneurial Baked Goods Industry
Custom Baked Goods
Home bakers and small scale bakeries have existed for many years, however the
emergence of elaborate cakes and gourmet flavors has taken this industry, and in turn the
entrepreneurs in it, to a different level. Based on a review of successful start-up
entrepreneur profiles and research articles of successful business owners in this field, it
can be concluded that in order to stay successful, the business owner must possess a few
special characteristics.
First, the entrepreneur must be adaptable. According to one article, “the secret to
success is to keep ideas fresh” (Wotherspoon, 2003). Cakes alone have evolved over
centuries, so in order to keep up with demand, a business owner must change with the
times and trends. For example, the wedding cake originated when the Romans used to
break barley or wheat over a bride’s or couple’s head and sprinkle them with the crumbs.
In medieval times they evolved this into breaking biscuits. A few centuries later it
progressed into stacking these biscuits and the belief was that if a bride could stretch over
the pile and kiss her groom, then they would be blessed with good fortune. Then, in the
1600s sugar was beginning to become more available, however it was still costly. This
meant that the more refined the sugar, the whiter it was, and in turn the more it cost. This
is perhaps the first time that wedding cakes took on the form of a status symbol. The result
8
of this was the whiter the wedding cake, the more affluent the family. At the same time,
people were also trying to make the most of what little sugar they did have. This led to less
wealthy people decorating their cakes with paste made from almonds and sugar which was
the beginning form of what we now know as fondant. “Fondant” was also a useful tool
before refrigeration. If a fruit cake was covered with fondant it could be consumed up to
six months after creation because the fondant essentially protected the insides of the cake.
In the Victorian era in Europe cakes began to get more and more elaborate and resemble
what we know as cakes today. More recently in the southern United States, the groom’s
cake was born and has become a part of tradition for many. These groom’s cakes have
grown more and more elaborate as well. The cakes seen today have evolved into a
showpiece that not only acts as a beautiful centerpiece but tells the guests something about
the bride and groom’s lives (How Did We Become To Celebrate Weddings With Cake? A
Brief History of Wedding Cake, 2011). This brief history of the wedding cake attests to the
ever present need for bakers to adapt to the trends over time.
On the other hand, a good product is only one part of the mix for baking industry
entrepreneurs to succeed. Instead, it is believed that one’s staff is the critical success factor
(Bakeries Work To Make Profits Rise, 2003). This view focuses on the quality and amount
of staff needed to sell the product effectively and also present the right image to customers.
Meg Major, Editor-in-chief of Progressive Grocer, a leading publication in the food retail
industry for 88 years, agrees with this and states that “there is no substitute for having a
staff member to answer customers’ questions and to provide an individual and unique
service.” She also connects this back to the need for a bakery entrepreneur to be adaptable
in saying that “by having exceptional customer service contact with customers, bakeries
9
are able to participate in a two way dialogue with customers.” This allows bakery owners
to hear firsthand what the customers want and to be prepared to fill that demand (Major,
2006).
In any industry it is important to possess certain qualities in order to succeed as an
entrepreneur. Entrepreneurs in the custom baked goods industry however, also need to
have the additional traits of adaptability and being able to choose the right staff. In such an
evolving and trend oriented industry, these special traits all relate to being able to keep up
with new trends at all times.
The Future of the Baked Goods Industry
Research indicates that the baked goods industry is ever changing. According to
Warren Payne, “growth in the retail segment of the bakery products market is driven
primarily by new product introductions and extensions of existing product lines” (Payne,
2003). For this reason, when venturing into this market it is important to have an
understanding of where the industry is going, in addition to a sound business plan. Three
highly regarded publications in the retail baking and food service industry were examined
in order to identify the future of the baked goods industry: Modern Baking, Progressive
Grocer, and InStore Buyer. These publications all aim to provide insight to the top
managers, executives and entrepreneurs in the food service industry.
In a report from January 2010, Modern Baking concluded that at home entertaining
is surging, which in turn will benefit cake sales (In-Store Sales Tracker: Cake Sales Remain
Strong, 2010). It also gives a summary of the seasonality of the cake industry which can be
seen in the following chart.

10
Chart 1: Seasonality of cake sales
Source: (In-Store Sales Tracker: Cake Sales Remain Strong, 2010)
This seasonality of sales is relevant for any entrepreneur to know and understand when
entering this industry. This will help the business owner better predict sales and in turn
better manage his/her finances. As seen in the figure above, nationally, sales have the
biggest increase (35% increase) during May and this is due to Mother’s Day and the
graduation season. Another peak month is April (21% increase) because of Easter. The
last peak month is June (14% increase) and this is due to Father’s Day and the continuance
of graduation season. The weakest month for cake sales is December (25% decrease)
because it follows Thanksgiving which is traditionally a pie holiday, which is why
November also has a decrease in sales (3% decrease). Lastly, January boosts poor sales as
well (19% decrease) because of holiday leftovers and many peoples’ New Years dietary
resolutions being strong.
Modern Baking also reports some strong numbers for the individual dessert
category which it categorizes as an “interesting and growing subcategory” (In-Store Sales
Tracker: Cake Sales Remain Strong, 2010). Research shows that individual desserts sales
-30
-20
-10
0
10
20
30
40
Jan Feb Mar Apr May Jun Jul Aug Sep Oct Nov Dec
Pe
rce
nt
Average
Percent Change

11
increased by 9.6% from 2009 to 2010 in the grocery store segment in every region. The
theory behind this can be explained by the excerpt below.
“As the general population moves away from strict diets and towards indulging with
moderation, smaller or individually sized dessert items are growing in popularity.
Cupcakes fit the same trend, with average dollar sales registering double-digit sales
growth nationally and regionally.” (In-Store Sales Tracker: Cake Sales Remain
Strong, 2010)
Progressive Grocer finds the same promising trends in the bakery segment. It
reports that even though consumers are saying they want more healthy options, baked
goods have never been hotter (Major, 2006). This counterintuitive statement is justified by
high quality. “As long as quality stays high, so will consumers’ cravings for indulgent baked
goods. If people are going to indulge, they want the best” (Major, 2006). Progressive
Grocer also finds evidence concurrent with Modern Baking’s report in that smaller sized
desserts are gaining popularity; the biggest trend being cupcakes and cupcake cakes.
InStore Buyer also found that society’s “tendency towards indulgence proved
stronger than ever in 2009” (Balzer, 2010). In 2009, decorated cakes, dessert cakes, and
cupcakes boasted the largest percent of sales for bakeries. Lastly, InStore Buyer reported
that people are purchasing more baked goods because they are cooking and eating at home
more and are looking to replicate restaurant experiences at home, including the dessert.
These consumers are:
“Likely accustomed to high-quality or gourmet meal accompaniments typically
found when dining out…and recognize that these items can be time consuming and
complicated to replicate in a home kitchen. However, providing a restaurant-quality
meal experience to their families may fulfill an emotional need, and these
consumers may be more apt to splurge on bakery items they perceive to be unique
and high-quality.” (Padera, 2009)

12
The current trends in the baked goods industry are promising for sales and offer
vast opportunities for entrepreneurs to increase sales growth. An entrepreneur should not
only be aware of these trends before starting a new venture, but also be vigilant in
following changing trends.

13
FEASIBILITY ANALYSIS
Introduction
Management Vision
The idea of opening a cupcake bar and custom cake shop came from a passion for
baking. Based on owner passion and a recognized market opportunity in Wilmington,
North Carolina a business feasibility study was logical. A concept for a business named
C&M Cupcake Bar was developed. The concept behind C&M Cupcake Bar is a cupcake bar
that sells gourmet and customizable cupcakes on a daily basis and also creates cakes on a
custom order basis. The location will act as a storefront for the sale of the cupcakes as well
as a working kitchen. C&M Cupcake Bar’s philosophy is to create a high quality and unique
product for the consumer to enjoy while also creating a unique experience. The cupcakes
and cakes sold at C&M will be sold at a premium price due to the high quality standards of
raw ingredients as well as human talent.
C&M Cupcake Bar will be located in the central area of Wilmington, North Carolina
in the Mayfaire Town Center shopping center in part because of its close proximity to
luxury neighborhoods. This location is also important because the Mayfaire shopping
center is the largest outdoor shopping center in Wilmington and “hundreds of thousands of
people visit every year” (Mayfaire, LLC, 2011). While tourists are a large part of the
customer base, the primary consumer market will be upper class females from age 35 to
65.
All baking, creating, and selling will be done in the bakery. Cupcakes will be sold to
go or to eat in the bakery. Custom cake orders can be picked up in store, but larger cakes
14
will be delivered. Customers can also have C&M provide a custom cupcake bar for any
special event.
Opportunity Rationale
The cupcake and cake industry has gained broad recognition through the t-v media.
“Andra Millage, owner of Let Them Eat Cake, said cable-television shows about cake-
making definitely have influenced the industry” (Dills, 2011). From cake and cupcake
competitions to shows about life in a bakery, this trend is visible. These t-v shows have
inspired many at-home bakers and cake hobbyists across the country. Wilmington, North
Carolina is no exception to this trend. While regular bakeries have been in Wilmington for
many years, bakeries specializing in custom cakes and gourmet cupcakes have just recently
started appearing.
Since a few custom bake shops have already been established in the Wilmington
area, one of C&M Cupcake Bar’s competitive advantages is location. The custom bake shops
that have opened in Wilmington have either been in the Downtown area or located at one
of the areas’ beaches. C&M Cupcake Bar will be located in the Mayfaire Shopping Center of
Wilmington which is centrally located (Appendix A: Target Market, Figure 1.2). This allows
for exposure to many luxury neighborhoods as well as tourists, especially during the
summer months. Mayfaire is Wilmington’s largest outdoor shopping center which allows
for maximum walk-by customers.
C&M Cupcake Bar will also be the first cupcake bar not only in Wilmington but in all
of New Hanover County. While the competition is offering pre-made cupcake
combinations, C&M allows the customer to create their very own gourmet cupcake. The
customer will have the opportunity to choose a cupcake flavor, filling flavor, icing flavor,

15
and any additional toppings they may desire. This, in addition to a prime location, is what
makes C&M Cupcake Bar a potentially highly profitable business opportunity.
Company Description
C&M Cupcake Bar is currently in the idea stage. To date C&M Cupcake Bar has come
up with the basic business concept and model. A location has been identified but funding
will need to be secured before negotiating a rental agreement. Preliminary searches for
equipment and supplies have been conducted to get an idea of start up and operation costs.
The target market has also been identified. C&M will be organized as a Limited Liability
Company (LLC). LLC’s have become a popular option for small business owners because
they are easy to set-up and protect the owners and their assets. Although paying taxes for
an LLC is easier than that of a corporation, it can also be at a higher rate since the owner’s
personal tax rate is applied. However, if an LLC needs to maintain high retained earnings
for at least five years, it can opt to be taxed at the corporate tax rate which is most often
lower than the personal tax rate. This is something C&M will consider since high retained
earnings will be desired for at least the first five years in order to secure and grow the
business. Once the Wilmington, North Carolina location becomes successful and profitable,
C&M will explore expansion, franchising and other revenue generating opportunities.
Product Description
C&M Cupcake Bar will offer three basic products:
Cupcakes from the cupcake bar. Customers can purchase cupcakes on a daily basis
from the bakery. Customers can customize the cupcake flavor, icing flavor, filling
flavor, and toppings. C&M will pick a certain number of flavors on a daily basis to

16
ensure a unique selection. For customers who are in a rush or can’t make up their
mind, C&M will have pre-assembled cupcakes available.
Customers can also order a custom cake. This can be for any occasion, including but
not limited to, weddings, birthdays, anniversaries, and holidays. The minimum cake
order C&M will accept is $75. This is equivalent to a two tier, six inch round cake
that serves approximately 12 people.
Customers also have the option to have C&M bring the cupcake bar to them. A
customer can choose their own flavors and colors of cupcakes and toppings to
match an occasion or party theme. C&M will deliver the cupcakes and set up the
cupcake bar. Customers will also have a C&M Cupcake Bar employee stay at the
event and assemble the cupcakes for them and their guests. This is a service that is
truly unique to C&M Cupcake Bar and will surely add a special touch to any event.
Highlights – Introduction
Unique cupcake bar concept
Gain significant market share with high quality and specialized location
Cupcakes sold daily, cakes ordered in advance, and cupcake bar catering
are main revenue generating functions

17
Industry
Context for the Industry
C&M Cupcake Bar will be competing in the coffee and snack shop industry. According
to IBISWorld, a leading market research organization, “this industry is comprised of
establishments that prepare or serve specialty snacks and nonalcoholic beverages,
including ice cream, frozen yogurt, cookies, donuts, bagels, coffee, juices, smoothies, or
sodas. Purchases may be consumed on-site, taken out or delivered” (Samadi, 2011).
According to the industry report, the industry is broken down into seven segments. The
chart below lists these segments as well as the percentage of industry revenue they account
for. This analysis will focus on the segments that produce sweet products and not those
specializing in coffee, juices, smoothies, sodas or bagels. More specifically, C&M Cupcake
Bar and its direct competition will be considered part of the “other snack shops” segment.
Chart 2: Product and service segmentation of the coffee and snack shop industry
Source: (Samadi, 2011)
Coffee Shops 25%
Donut Shops 18%
Other snack shops 18%
Ice cream shops 16%
Bagel shops 15%
Frozen yogurt shops
6%
Cookie shops 2%

18
This industry, as a whole, has annual revenue of $26.5 billion, annual profits of $1.6
billion, an annual growth rate of 2.0% from 2006 to 2011 and a projected annual growth
rate of 4.1% for 2011 to 2016. North Carolina currently accounts for 3.2% of the industry
revenue or $848 million, which means the “other snack shops” segment in North Carolina
has annual revenue of $152.64 million (Samadi, 2011). The tables below illustrate the
industry structure and key external drivers as identified by the industry report.
Table 3: Industry structure of the coffee and snack shop industry
Source: (Samadi, 2011)
Table 4: Key external drivers of the
coffee and snack shop industry
Source: (Samadi, 2011)
Industry Structure
Life Cycle Stage Mature
Revenue Volatility Medium
Capital Intensity Medium
Industry Assistance None
Concentration Level Medium
Regulation Level Medium
Technology Change Medium
Barriers to Entry Low
Industry globalization Low
Competition Level High
Key External Drivers
Consumer spending
Health consciousness
Competition from full service restaurants
Per capita coffee consumption
Per capita disposable income
Consumer sentiment index

19
Open to New Entrants
This industry as a whole has low barriers to entry partly because there are
limited major players. Most bakeries and custom bake shops are small operations with
single locations. Nima Samadi (2011) notes that the nature of the industry is fragmented
and small business oriented. Also, because there is not a cupcake bar in the Wilmington,
North Carolina area, the local industry is open to new entrants. Other barriers to entry
such as capital intensity and regulation and policy are moderate to low which also allows
the industry to be open to new entrants.
Innovation
The snack shop segment of the coffee and snack shop industry is very accepting of
innovation and creativity, especially when speaking about the baked goods segment. For
example, recently there has been a demand for custom cakes made to look like real life
objects, intricate sculpted cakes, gourmet cupcake flavors, and birthday cakes as elaborate
as wedding cakes, all of which were unheard of 10 to 15 years ago. Due to this continually
changing landscape of the industry, the industry is open to the frequent establishment of
new businesses. Because this is an industry based on changing trends, innovation is
important to remain profitable. If a company fails to do this, it allows other companies to
take away market share. This also leaves room for newer and better establishments to
come in and push the non innovative companies out. C&M Cupcake Bar will pride itself on
being adaptable and providing its customers with the latest in culinary creations. C&M will
take a proactive approach to this by budgeting in travel expenses in order to attend trade
shows. This way, C&M will be able to bring the culinary trends to Wilmington, and be a

20
market leader. This also allows C&M to capitalize on early adapter benefits rather than be
left behind.
Market Size
In 2008, the gross sales for food in New Hanover County were $28,550,915 and
taxable sales totaled $643,920,767 (Wilmington Industrial Development , 2008). As of
1999, 39.3% of Wilmington households had an income of $50,000 or higher (US Bureau of
the Census, 2000). The median family income in 2009 was $67,620 which is 29.8% higher
than in 2000. The median disposable income in 2009 was $41,306.
According to the 2010 census, Wilmington is the eighth largest city in North
Carolina. This is up from ninth place with a 40.4% population increase from 2000 to 2010.
All of these statistics support reasoning to start a business in North Carolina, especially a
specialty food shop.
Loyalty
One of C&M Cupcake Bar’s goals is to have customers for life. Part of the business
model is providing excellent customer service combined with a superior product in order
to gain customer loyalty. Cakes can be a very personal thing, especially for special
occasions, so when C&M supplies a sweet creation for a client it becomes part of a memory.
Highlights - Industry
Will be competing in the coffee & snack shop industry, in the “other snack
shops” segment
Creative segment of the industry
Industry as a whole is open to new entrants, and especially the
Wilmington segment
21
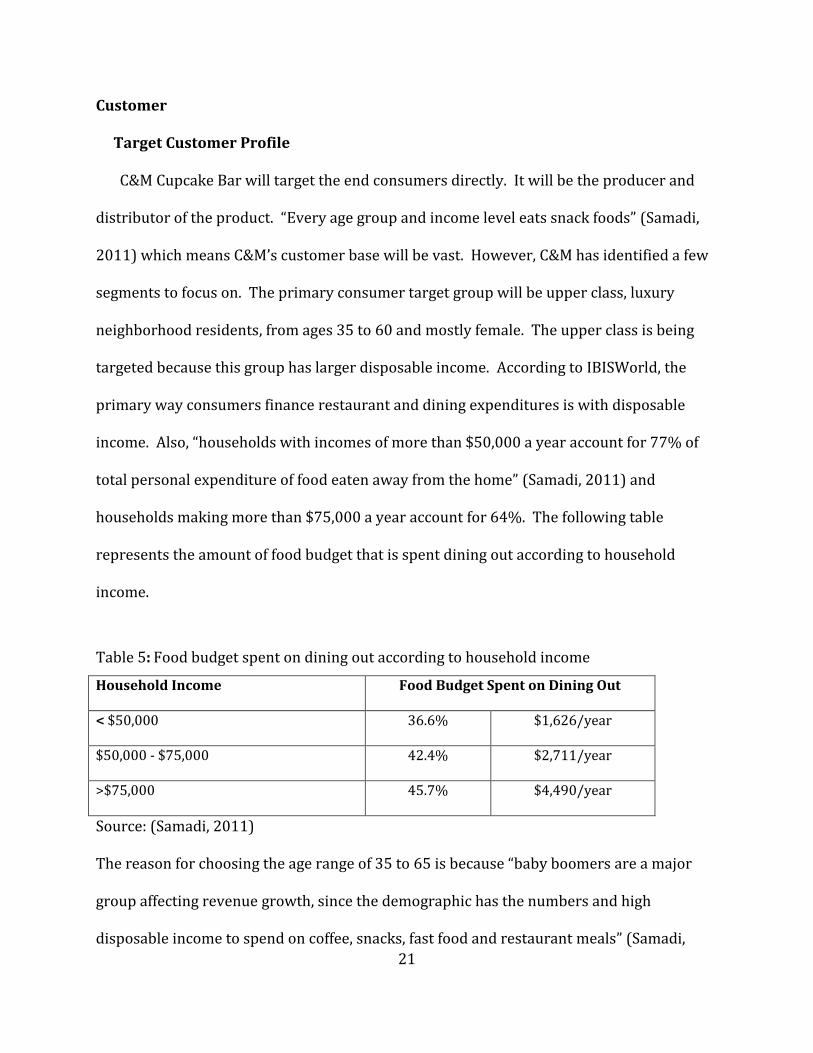
Customer
Target Customer Profile
C&M Cupcake Bar will target the end consumers directly. It will be the producer and
distributor of the product. “Every age group and income level eats snack foods” (Samadi,
2011) which means C&M’s customer base will be vast. However, C&M has identified a few
segments to focus on. The primary consumer target group will be upper class, luxury
neighborhood residents, from ages 35 to 60 and mostly female. The upper class is being
targeted because this group has larger disposable income. According to IBISWorld, the
primary way consumers finance restaurant and dining expenditures is with disposable
income. Also, “households with incomes of more than $50,000 a year account for 77% of
total personal expenditure of food eaten away from the home” (Samadi, 2011) and
households making more than $75,000 a year account for 64%. The following table
represents the amount of food budget that is spent dining out according to household
income.
Table 5: Food budget spent on dining out according to household income
Household Income Food Budget Spent on Dining Out
< $50,000 36.6% $1,626/year
$50,000 - $75,000 42.4% $2,711/year
>$75,000 45.7% $4,490/year
Source: (Samadi, 2011) The reason for choosing the age range of 35 to 65 is because “baby boomers are a major
group affecting revenue growth, since the demographic has the numbers and high
disposable income to spend on coffee, snacks, fast food and restaurant meals” (Samadi,

22
2011). Also, people in this age group are likely to have children and in turn buy numerous
birthday cakes. The following table illustrates the amount of food budget spent on dining
out according to age group.
Table 6: Food budget spent on dining out according to age
Age Food Budget Spent on Dining Out
18 – 25 46.4% $2,351/year
25 – 30 44.8% $2,668/year
35 – 50 42.3% $3,165/year
50 – 65 42.8% $2,991
65 + 37% $1,926
Source: (Samadi, 2011)
A secondary consumer market will be tourists. Wilmington, North Carolina is well
known for being a tourist town. North Carolina as a whole is the 6th most visited state in
the US. In 2010 North Carolina visitors spent $17 billion while visiting (Mackey, 2011).
According to Wilmington Insider Info, “2007 tourism sales tax collection indicated strong
growth in the tourism sector for the area” (Weigand, Bridges, Pierre, Walsh, Wilson, &
Gorman-Fancy, 2011). Wilmington is no longer just a summer tourism destination; rather
there is a growing trend towards year round tourism. With Wilmington’s moderate year
round temperatures, multiple beaches, plentiful cultural events, and abundant historical
sites; tourists are drawn to the area. Since the tourism industry is one of the most
important industries in southeastern North Carolina, it makes sense for C&M Cupcake Bar
to capitalize on this. According to Visit NC, in 2008, 17.1% of Wilmington visitors engaged
23
in shopping while in the area. Not only is the Mayfaire shopping center the premiere
shopping destination in Wilmington, it is also surrounded by numerous hotels and is only
1.5 miles from the beach which makes it a major draw for many tourists. C&M will develop
several marketing strategies in order to benefit from the foot traffic generated by tourists
and locals alike.
Demographic Analysis of the Target Market
According to The U.S. Census Bureau, the population of New Hanover County was
202,667 as of 2010 (U.S. Census Bureau, 2011). From 2000 to 2010 New Hanover County
has grown at a rate of 26.41%. This is more than double the ten year growth rate of the
United States and approximately 50% higher than the growth rate of North Carolina. More
specifically, Wilmington grew more than the United States by more than 400%.
Wilmington’s growth rate for the decade is also more than double that of North Carolina
and more than 50% higher than New Hanover County. The population growth of the
United States, North Carolina, New Hanover County, and Wilmington over the past ten
years is illustrated in Table 1.3 in Appendix A: Target Market. These figures demonstrate
the extreme growth Wilmington and New Hanover County have experienced over the past
ten years and show no signs of slowing down. The total population of New Hanover County
as of 2009 is 196,667 and is expected to climb to 217,451 by 2014 (North Carolina's
Southeast, 2010). This growth is extremely positive for C&M Cupcake Bar because it
directly relates to an increase in customer base. Also, as Wilmington continues to grow,
space decreases which pushes people out into other areas of New Hanover County. This is
a positive indication for future growth of C&M with opportunities for expansion to multiple
locations.
24
Other figures that are worth noting are gender breakdown, age distribution and
household income. As of 2009, New Hanover County was made up of 51.7% female and
48.3% male. Also in 2009 there were 116,466 people between the ages of 18 and 65. This
equates to 59.7% of the county population (U.S. Census Bureau, 2011). According to the
2000 Census, 19.6% of the households in New Hanover County had a household income
between $50,000 and $74,999. Households having income of more than $75,000 totaled
19.7%.
Psychographic Analysis of the Target Market
C&M Cupcake Bar’s products have a high emotional value like that of a luxury or
status product. These products often become a part of a special event or occasion for the
customer. This is what makes it a personal and emotional purchase and increases the
importance of perfection. Supplying a superior and exceptional product for a special
occasion delights a customer and can create a customer for life. Also, an elaborate cake can
be a status symbol for many. Customers may order a large and elaborate cake in order to
display their wealth. Within certain communities, these elaborate cakes may even become
bragging rights between friends.
Access to the Customer
Both the primary and secondary consumer target groups can access C&M Cupcake
Bar through the storefront. While C&M will have a website, customers will not be able to
purchase items online, at least in the beginning stages. Customers can create and purchase
cupcakes on a daily basis by coming into the bakery. C&M will have a small number of
tables and chairs in the store for customers who would like to enjoy their cupcake right
away. Cupcakes will also be available to go. When getting cupcakes to go, customers’

25
purchases will be protected in a cupcake box with inserts. These inserts allow the
cupcakes to be cradled to ensure no sliding or toppling and that the cupcakes arrive at their
destination intact. C&M Cupcake Bar believes it is important to continue to provide the
customer with an exceptional experience all the way up to and even after consumption; this
is why having high quality packaging is so important.
Custom cake orders will be taken in the bakery and some will be coupled with a
consultation. A cake tasting will be provided free of charge for all wedding cake orders and
for a $15 fee for all other cake orders. Smaller custom cakes can be picked up in the store
and larger cakes will be delivered. In addition to providing cakes for events, C&M also
offers a custom cupcake bar catering option. Customers will be able to pick an assortment
of cupcake flavors, icing, fillings, and toppings which can all be color coordinated to match
the theme of their event. C&M Cupcake Bar will deliver and set up the cupcake bar at the
customer’s chosen venue. The customer will have a C&M Cupcake Bar employee remain at
the event to assemble and serve the cupcakes to guests.
Mayfaire Town Center has general hours of Monday thru Saturday 10:00 am to 9:00
pm and Sunday’s noon to 6:00 pm. The restaurant hours vary. C&M Cupcake Bar’s hours
will fit within the Mayfaire hours since foot traffic is so important. C&M’s normal hours of
operation will be Monday thru Saturday 10:00 am to 6:00 pm and Sunday’s noon to 6:00
pm. From early May to late July Mayfaire shopping center hosts an outdoor concert every
Friday from 6:00 pm to 9:00 pm which draws a large crowd from the community. C&M will
consider extending its hours on Friday’s during these months in order to capitalize on this
event. This is something that will be evaluated at a later date. C&M Cupcake Bar’s general

26
hours will also be evaluated after start-up to ensure efficiency. Special events and delivery
times will vary according to the customers’ needs.
In terms of physical positioning of the product, C&M Cupcake Bar will utilize bakery
display cases. The daily cupcakes will be stocked in these cases so customers can
individually select their cupcake. Toppings will also be visible to the customer to aid in
selection.
Competition
C&M Cupcake Bar considers itself to have three direct competitor categories and
four substitute categories that could pose potential threats. Analysis reveals, however, the
strengths and the weaknesses of these businesses so C&M can strategically combat
competition. The analysis also examines price comparisons of the market, values brought
to the market by the business, and the threat level. The following chart identifies the
competition and substitutes and displays examples of each.
Highlights – Customer
Upper class, female, baby boomers and tourists are the target markets
Customers can access the product through the store front
Large custom cakes and cupcake bars will be delivered to the customers’ event

27
Chart 3: Competition and direct substitute categories and businesses in the Wilmington market
Strengths
Some of the major strengths of the competition and how C&M Cupcake Bar plans to
compete are:
Reputation – The main strength of the competitors at this time is their established
reputation. The existing businesses have already had a chance to make a name for
themselves. However, C&M Cupcake Bar plans to create a positive reputation from
the moment it opens by offering a creative product and exceptional service.
Variety – Many of the competitors identified offer a larger variety other than just
cakes and cupcakes. For example, the grocery stores offer a variety of pastries, tarts,
and pies in addition to cakes and cupcakes. One bakery in Wilmington offers
traditional Italian pastries and desserts. While variety may be a strength to some
businesses, C&M’s success is based on being specialized. C&M focuses on cupcakes
and cakes because that is what it does well.
Direct Competitors
Custom Bake Shops
Hot Pink Cake Stand
Other Cupcake
Shops
Coastal Cupcakes
Traditional Bakeries
Apple Annie's,
La Gemma
Substitutes
Grocery Stores
Harris Teeter, Food Lion, Wal-Mart,
Costco, Lowe's, Sam's
Club
Do-It-Yourself
Cake mixes,
ready-to-bake
cookies
Ice Cream & Frozen
Yogurt Shops
Fuzzy Peach,
Kilwin's
Donut Shops
Dunkin Donuts

28
Low cost – Some of the competition can offer their products at a low cost for a
variety of reasons. For example, a customer will pay much less for a cake at a
grocery store than a specialty bake shop. This may draw some consumers to these
businesses. However, quality is often sacrificed for price. C&M Cupcake Bar is
marketed in the luxury section of baked goods market which means that its
customers are less price sensitive. C&M’s customers are being targeted because
they value quality and are in turn, willing to pay a higher price.
Access to the customer – The last identified strength of the competition is access to
the customer. Since some of the competitors have been established longer, they
have been able to open more than one location. This allows for more visibility to the
customers. For example, there are numerous grocery stores in town that all have a
bakery department so ordering and picking a cake up from one of these
establishments is easy for the customer. Also, a few local start-ups have already
established multiple locations throughout town. C&M’s chosen location is highly
specialized and centralized which will make up for lack of multiple locations in the
beginning. As C&M grows however, additional locations will be evaluated.
Weaknesses
Some of the major weaknesses of the competition that C&M Cupcake Bar plans to
address are:
Quality – Some of the competition offer low quality products. For example, when
ordering from a grocery store, options are often limited to only sheet cakes. In
addition, the person decorating the cakes is not always highly trained. C&M

29
Cupcake Bar will produce only the highest quality of products. Cakes and cupcakes
will be baked and decorated by highly trained and qualified employees. In addition,
both of C&M’s owners will have attended The Wilton School of Decorating and
Confectionery in Chicago prior to the time of opening. This also separates C&M from
the competition because the majority of small bakery owners in the area started
because baking was a hobby, but they had, and still have no formal training.
Variety – Some of C&M’s competition only specialize in cupcakes which limits the
number and variety of customers. By only offering cupcakes, people wanting cakes
for special events are driven elsewhere. C&M Cupcake Bar will be able to offer
customers a variety of catering options in order to broaden the customer base.
Also, since cakes will always be in demand for events, this is a long term investment
of time and effort in C&M’s future.
Customer service – Many competitors lack a high level of customer service. For
example, when ordering baked goods from a grocery store or larger bakery a
customer may have to deal with numerous employees for just one order. A
customer may order their cake from one employee, have a different person decorate
it, pay another, and have their cake delivered by yet another employee. Since C&M
Cupcake Bar will be a small business there is more quality control over customer
service. A customer ordering a custom cake from C&M will always attend a
consultation with the person responsible for creating their cake. This ensures that
what the customer orders is what the customer is made and delivered. This
attention to exceptional customer service allows C&M to provide its customers with
an experience rather than just a transaction.

30
Lack of dine-in option – Most of C&M’s competition does not offer a dine-in option.
This means that customers are forced to purchase their baked goods and leave the
establishment. By providing customers with a place to sit and enjoy their sweets,
C&M will once again enhance the overall experience of the customer. This will also
allow the customer to linger and potentially purchase additional products to take
home. In addition, it will promote a personal relationship with customers and will
increase their probability of returning.
Highlights – Competition
Competitor’s major strengths include existing reputation, variety, and low
cost
Competitor’s major weaknesses include low quality, poor customer
service, and lack of a dine-in option
C&M will capitalize on weakness and combat strengths of competition
Key Success Factors
The key success factors that must be accounted for regarding C&M Cupcake Bar are
to provide high quality products and service, build a positive reputation, and secure quality
workers, all while maintaining adequate profit margins. Since part of the business model
depends on recurring customers, it is imperative to provide a superior product and to
exceed customers’ expectations. To guarantee this happens, it is vital to hire well qualified
employees, provide excellent training, and to manage effectively. To help maintain
adequate profit margins it will be very important to preserve good relations with the
31
providers of raw materials. Currently, the cost of raw materials is on the rise in part
because of the increasing cost of transportation. Since C&M Cupcake Bar cannot control
the market price of raw goods, having a good relationship with the suppliers will help get
the best deal possible despite a poor economy.
Highlights – Key Success Factors
Ensure quality while maintaining an adequate profit margin
Capitalize on recurring customers
Maintain good relations with raw material providers
Strategies
Marketing Strategy
The marketing strategy involves C&M Cupcake Bar advertising and promoting
directly to the consumers. C&M will employ marketing methods such as traditional
advertisements, use of social media, participation in trade shows, and of course word of
mouth. The following are initial marketing concepts that will be evaluated before
implementation under the advisement of C&M’s external marketing advisor. C&M’s
external marketing advisor will use his/her expertise to determine which marketing
strategies will be the most effective for C&M.
Advertisements will be an integral part of making the community aware of C&M
Cupcake Bar. Traditional avenues will be used such as newspaper, television, and
radio. Also, a vehicle wrap will help advertise business while just driving around
the area. $3,000 has been budgeted for the vehicle wrap. $5,000 has been allotted
for pre-opening advertising (month one through four). Another $5,000 has been

32
reserved for the month of opening (month five). After this initial investment, the
advertising budget will decrease to the following:
o $2,000 per month for month six and seven
o $1,500 per month for month eight through ten
o $1,000 per month for month 11 and 12 and for the rest of years three
through five
The use of social media has become an important part of many start-ups’ as well as
established companies’ marketing tactics. C&M will capitalize on this trend to
create a buzz about the business. One idea that some bakeries have already
adopted is to list the cupcake flavors offered on a particular day on Facebook® or
Twitter®. Since notifications “pop-up” on these websites, it reminds customers of
C&M and can be a powerful way to create business. This is a free source of
advertising that cannot be ignored.
C&M will participate in any and all appropriate trade-shows in the area. For
example, Wilmington hosts a “Sweet Taste of Wilmington” dessert event every year,
in May, which allows community members to sample treats offered by local dessert
establishments and vote on who they liked best. This is a good way to get C&M’s
name out there and gain a wider customer base. $300 has been allotted per local
trade show. In year one there is one trade show in May. In years three thru five
there is a trade show in February as well as May.
As with any start-up, word of mouth is also an integral part of marketing. C&M
wants to provide quality products and experiences that customers will tell their
friends and family about. This is essentially a free form of advertising that should
never be overlooked.

33
Sales Strategy
In order to purchase one of C&M Cupcake Bar’s products, a customer must go to the
bakery. C&M will employ a few strategies to convince a customer to make a purchase.
Provide a “portfolio” in the bakery. This allows customers to see pictures of cakes
previously made and parties previously catered by C&M. Customers can then see
for themselves the quality offered by C&M and subsequently allow them to order
with confidence.
C&M will depend partly on the aroma of baking cupcakes. This will draw people in
that are walking by. While many bakeries complete all their baking in the morning,
C&M will continue to bake throughout the day to produce the alluring cupcake
scent.
C&M will also look to event planning professionals for recommendations to their
clients. This includes event planners and banquet facilities. C&M will work to
establish a positive relationship with these key “sales representatives” in order to
create custom order cake and catering business.
Pricing Strategy
C&M Cupcake Bar’s products will be sold at a premium. Customers who wish to
purchase cupcakes in the store can either buy a pre-assembled cupcake or create their
own. The price of a pre-made cupcake is $2.75. The cupcake bar pricing is as follows:
$2.00 per cupcake base
$0.50 per frosting flavor
$0.25 per filling
$0.50 per topping (serving size approximately 1 tablespoon)
34
C&M will not take a cake order less than $75. A $75 cake is a two tier, six inch round
cake that serves approximately 12 people. It is estimated that C&M will fulfill orders
regularly that range from $75 to $1,000.
Similar to cake orders, C&M will not accept a cupcake bar catering order for less
than $75. At this price, a customer will have a cupcake bar for 12 set up at their desired
location and have a C&M employee assemble cupcakes for their guests for one hour.
Highlights – Strategies
Will employ many marketing strategies with guidance from marketing expert
Will develop relationships with event planning professionals to gain referrals
Products will be priced at a premium
Operations Plan
Production Cycle
C&M will separate its activities (cupcakes, custom cakes, and cupcake bar catering)
in order to determine appropriate production cycles.
Daily cupcakes are based on batches of 24 cupcakes. C&M expects to sell 15-20
dozen cupcakes a day (18 dozen is used to determine financial projections) or
approximately 216 cupcakes. Each batch of 24 requires approximately 10 minutes
to prepare the batter and 20 minutes to bake. This equals nine hours of cupcake
production a day. Actual production time however will be lower since multiple
batches can be made and baked simultaneously. Custom cupcakes will be
assembled in front of the customer as they choose what they’d like in and on their

35
cupcake. Payment is collected immediately which means there is virtually no
collection buffer. Essentially the total cupcake production cycle is one day.
The production cycle of custom cakes will be longer than the cupcakes. Customers
will order a custom cake no later than two weeks in advance for regular cakes, and
one month for wedding cakes (this may change as business and orders grow). The
customer will pay a non-refundable deposit of 50% of the total cake cost at the time
of ordering. This will allow for any specialty decorations or ingredients to be
ordered and paid for according to each order. This also means it will not be
necessary to have capital to offset raw material costs until full payment is made.
The other 50% of the total price will be due no later than five business days prior to
the event. In terms of actual man hours, it takes approximately six hours (baking
and decorating time) to produce cake that fulfills C&M’s minimum order
requirement. Overall, the total production cycle for a custom cake is a minimum of
two weeks, and one month for wedding cakes.
Custom cupcake bars for parties will follow the same lines as custom cakes.
Customers will have to place their order two weeks in advance and provide a 50%
deposit. The other 50% will be due five business days before the event. The
production time of cupcakes and their components will vary depending on the size
of the event. On average, it will take eight hours to prepare the cupcakes and
components for an event that meets the minimum order requirements. Cupcake
bar’s production cycle is also approximately two weeks.

36
Operations Strategy
All production and packaging will be done in the bakery. This will allow for greater
control over the product and service. Also, by producing all of C&M’s products in one place,
it alleviates having to have a separate kitchen for each product segment. This also allows
employees to work on multiple projects at once to increase efficiency. Lastly, C&M’s
location is beneficial for delivery since it is centrally located.
Highlights – Operation
Batches of 24 cupcakes have a production cycle of approximately one day
Custom cakes and custom cupcake bars have a minimum production cycle
of two weeks
All production will be done in-house
Development Plan
The full list of start-up activities can be seen in the Gannt Chart presented in the
appendix (Appendix C: Time Schedules, Fig. 3.1). The key activities stated are:
1. Setting up the company
2. Securing funding
3. R&D and professional training
4. Finding a location and build up
5. Securing raw materials
6. Marketing
7. Staffing
The total duration for the startup of the business is 125 working days and will cost
$108,757. One of the first steps is to formally set up the company. An attorney will be
hired during this time for support in this process. R&D can be done before or after
becoming a company since the cost will most likely be out-of-pocket and can be done in a

37
home kitchen. Professional training has also been included in the pre-venture expenses in
order for the two owners to attend culinary classes in Chicago at the Wilton School of
Decorating and Confectionery. Securing funding is also a critical part of the start-up
process. Once funding has been secured, a location can be contracted, build up can be
initiated, and a delivery vehicle can be acquired. Securing raw materials is also an
important function for C&M Cupcake Bar which is why a week has been allotted for
researching suppliers in order to find the best prices. It is important that marketing begin
before opening in order to make the community aware of the new location and to make the
opening a success. Marketing will continue after start-up is complete. Staffing and training
are the last processes before the soft opening in order to avoid extra costs incurred by
hiring staff too early. In addition to the two owners, two part-time assistants will be hired.
The last activity before being ready to open for business is a test run/soft-opening. This
will allow C&M to open for friends and family and work out any operational problems
before the grand opening. The following table lists these key activities as well as the length
of time it will take to complete (in days), the total slack time and free slack time of each
activity and the estimated cost for each activity.
Table 7: Abridged work breakdown structure
WBS Task Name Duration Total Slack Free Slack Budgeted Cost
1 C&M Cupcake Bar 125d 0d 0d $108,757
1.1 R&D 63d 7d 7d $500
1.2 Raw Materials 7d 5d 113d $0
1.3 Funding 47d 0d 0d $0

38
Table 7 cont.
1.4 Professional Culinary Training 14d 0d 0d $9,032
1.5 Setting Up Company 2d 5d 0d $860
1.6 Storefront 64d 0d 0d $53,885
1.7 Supplies 17d 58d 58d $5,000
1.8 Secure Vehicle 13d 64d 64d $28,000
1.9 Marketing 28d 24d 24d $10,580
1.10 Staffing 32d 43d 43d $500
1.11 Training 2d 0d 0d $100
1.12 Closure 0d 125d 125d $0
1.13 Test Run/Soft Opening 1d 0d 0d $300
1.14 Ready for Business 0d 125d 125d $0
Highlights – Development
125 working days to complete start-up
Start-up activities will cost $108,757
Soft opening/test run will be last step before grand opening
Financials
By looking at C&M Cupcake Bar’s financial statements, it is clear that it is a
financially viable opportunity. The cost of goods for all of C&M’s products is very low
which allows for favorable profit margins (80% gross profit margin for all products
combined). The combination of low ingredient and packaging costs and premium prices
leads to gross profit margins of 89% on cupcakes, 92% on cakes and 67% on cupcake bar
catering. Other profit margins are illustrated in the table below.

39
Table 8: Profit margins
Year 4 Year 5
Operating Profit Margin 39% 44%
Net Profit Margin 37% 41%
The high operating margin shows that management has a good control over costs. Having a
high net profit margin allows C&M to have a significant amount of money to act as a
“cushion” to protect the business.
C&M estimates it will need a total of $230,000 of startup capital in order to start the
business. A loan in the amount of $210,000 will be required since C&M plans to raise
$20,000 from the owners, family, and friends. Of the total $230,000, $108,757 will be used
to start the company, $100,727 will be used for six months of working capital, and the
remaining $20,000 is a 10% buffer for both activities. The loan amount will be paid off at
the end of the third year and money raised from the owners, family and friends will be
repaid in year four, with interest to be determined by the owners and investors, since that
marks the break-even point. This offers more flexible repayment terms and lower interest
rates.
Some of the key financial statistics that attest to the success of C&M include:
Positive retained earnings of $61,742 by year four
Retained earnings more than double ($61,742 to $185,449) from year four
to five
Experience a positive monthly net cash flow by month nine
Significant cash flow balance in year four and five of ($196,135 and
$339,154 respectively)

40
The following tables offer a high level look at the income statements and cash flow
statements for years one through five.
Table 9: High level income statement
Year 1 Year 2 Year 3 Year 4 Year 5
Sales $172,288 $259,853 $298,832 $343,657 $395,205
Cost of Goods Sold $34,007 $51,291 $58,984 $67,832 $78,007
General Expenses $237,402 $240,369 $240,521 $174,620 $184,323
Earnings Before Income Taxes ($99,121) ($31,806) ($674) $101,204 $132,876
Net Income ($99,121) ($31,806) ($674) $94,221 $123,707
Table 10: High level cash flow statement
Year 1 Year 2 Year 3 Year 4 Year 5
Cash In $402,288 $259, 854 $298,832 $343,657 $395,205
Cash Out $318,708 $268,115 $289,362 $232,309 $252,186
Net Cash Flow $83,580 ($8,262) $9,469 $111,347 $143,019
Cash Balance (Opening) $0 $83,580 $75,318 $84,787 $196,135
Cash Balance (Closing) $83,580 $75,318 $84,787 $196,135 $339,154
Highlights – Financials
Positive retained earnings more than double in year four
Relatively low startup capital required
Extremely profitable profit margins
Workforce
Employee Roles
There will be two principal members who will combine their knowledge and
experience in order to achieve successful profits. These two members will also be the two

41
owners. In a labor and time intensive business such as a bakery, an assistant is absolutely
essential. To keep benefits and tax costs low, two part time assistants will be hired. These
roles will be filled prior to opening. The team roles are as follows:
Table 11: Proposed core staff members, qualifications, and responsibilities
Role Proposed
Person
Responsibilities Qualifications
Head
Decorator/Office
Manager/Part
Owner
Sylina
Phelan
Decorating Designing Day-to-day
operations and management
At time of opening, will have completed formal training at The Wilton School of Decorating & Confectionery Art
Strong art background International MBA with
specialization in Entrepreneurship
Head
Baker/Purchasing
Manager/ Part
Owner
Catherine
Murphy
Baking cakes and cupcakes
Ordering ingredients
Scheduling
At time of opening, will have completed formal training at The Wilton School of Decorating & Confectionery Art
18 years purchasing experience Completed all Wilton Method
Classes 18 years scheduling experience
Assistant To be
determined
Selling Customer
Service Cleaning Work register Help maintain
website
Good customer service Computer skills Can multi-task
Table 12: Shared responsibilities of owners Shared Responsibilities of the Head Baker and Head Decorator (Owners)
Marketing Delivery Management Duties Meet with clients for custom orders Bookkeeping

42
External members
External members have already been identified and will be consulted as needed.
These external members have a wealth of knowledge and experience that can be highly
beneficial to C&M Cupcake Bar. The following table depicts the known external members.
Table 13: External members, functions, and qualifications
Compensation and Ownership
In order to attract and retain quality employees, C&M will offer its’ full time
employees a variety of benefits such as medical and dental insurance plans, and paid
vacation and sick time. Medical benefits will be offered after three months of employment
and paid vacation will be offered one year after employment.
External Members
Role Functions Qualifications
Accounting/Bookkeeping Assist in accounting,
preparing taxes, and
bookkeeping (especially
during first few months)
Previously a controller for the largest
international pulp and paper company
and small business owner.
Experienced Baker Help during start up phase to
offer advice and guidance
Current head baker and bakery
manager at Costco Warehouse and
attended Institute of Culinary
Education in New York.
Marketing Provide guidance and advice
for developing marketing
strategy and marketing
materials
Currently a director of business
development.

43
For the first five years C&M’s owners will work for a small salary ($16,000 each in
year one, $22,419 each in year two, $24,000 each in year three, $30,000 each in year four,
and $35,000 each in year five). As business grows and monthly cash flow becomes more
predictable, the owners’ salaries will be increased. C&M’s owners will not receive any
compensation in the startup phase; their salaries and benefits will begin when C&M is open
for business.
For the first few years it will benefit C&M to hire two part time assistants rather
than one full time. This will allow C&M to save money on benefits as well as salaries. As
business grows, C&M will analyze the possibility of hiring additional part time and/or full
time employees. The part time employees will be paid $8.00 per hour. According to the
U.S. Department of Labor, minimum wage in North Carolina is $7.25 (US Department of
Labor, 2011). C&M will offer more than the minimum wage because it would like to attract
exceptional employees. At this pay rate a part time employee who works 20 hours a week
will make $7,680 per year and two part time employees will cost $15,260 in salary. At this
rate, it is feasible for C&M to hire three part time employees if needed for $23,040 which is
still cheaper than one full time employee.
In addition to all hired and external members, family members of C&M’s owners are
encouraged and expected to offer assistance. Any and all help will be compensated with
leftover cupcakes.
Highlights – Workforce
External members have already agreed to offer their assistance
Owners will work for low salary to start
Two part time employees will be hired instead of one full time employee

44
REFERENCES
American Express OPEN. (2011). The American Express OPEN State of Women-Owned
Business Report: A Summary of Important Trends, 1997-2011.
Bakeries Work To Make Profits Rise. (2003, 4 15). The (Sydney) Daily Telegraph .
Balzer, C. (2010, March). Convenience Drives Cake Sales. InStore Baker , 5 (2), pp. 18-20.
Blendstrup, A. (2007). They Made It!: How Chinese, French, German, Indian, Iranian,
Israeli and other foreign born entrepreneurs contributed to the high tech innovation in
the Silicon Valley, the US and Overseas. Silicon Valley, California, U.S.: Happy About.
Burnett, D. (2000, September). Hunting for Heffalumps. Retrieved August 10, 2011, from
Tecnnopreneurial.com: http://www.technopreneurial.com/articles/history.asp
Crainer, S. (2011). What It Takes; The Elements of Entrepreneurship. Business Strategy
Review.
Dills, I. (2011, January 10). Bellingham Bakers Keep Up With the Trends at Bridal Expo.
The Bellingham Herald .
ePodunk. (2007). Wilmington Community Profile. Retrieved January 3, 2011, from
ePodunk: http://www.epodunk.com/cgi-bin/genInfo.php?locIndex=19765#local-
map
Hitt, M. A., Ireland, R. D., Camp, S. M., & Sexton, D. L. (2002). Strategic Entrepreneurship:
Creating a New Mindset. Malden, MA, USA: Blackwell Publishers Ltd.
How Did We Become To Celebrate Weddings With Cake? A Brief History of Wedding Cake.
(2011, January 13). Retrieved January 20, 2011, from Team Wedding: Home of the
Top Wedding Sites: http://www.topweddingsites.com/wedding-blog/wedding-
cakes/how-did-we-come-to-celebrate-weddings-with-cake-a-brief-history-of-
wedding-cake
In-Store Sales Tracker: Cake Sales Remain Strong. (2010, January 1). Retrieved January 1,
2011, from Modern Baking: http://www.modern-
baking.com/supermarket_baking/cake-sales-remain-strong-0110/index.html

45
Lee, S. S., Stearns, T. M., Osteryoung, J. S., & Stephenson, H. B. (2009). A comparison of
the critical success factors in women-owned business between the United-States
and Korea. International Entrepreneurship and Management Journal , 5 (3), 259-270.
Mackey, C. (2011, 3 2011). Press Release: North Carolina Visitor Spending Rises 9% for
2010. Retrieved January 3, 2011, from State of North Carolina Office of Governor Bev
Purdue:
http://www.governor.nc.gov/NewsItems/PressReleaseDetail.aspx?newsItemid=17
47
Major, M. (2006, 9 1). Sweet Relief. Progressive Grocer , 85 (12), pp. 84-88.
Mayasmi, R., & Goby, V. (1999). Female Business Owners in Singapore and Elsewhere: A
Review of Studies. Journal of Small Business Management , 37 (2), 96-105.
Mayfaire, LLC. (2011). Home: Mayfaire Town Center. Retrieved August 10, 2011, from
Mayfaire Town Center: http://www.mayfairetown.com/index/c/index/
North Carolina's Southeast. (2010, December). New Hanover County County Profile.
Retrieved January 1, 2011, from North Carolina's Southeast:
http://ncse.org/profiles/newhanover_37129.pdf
Padera, B. (2009, December). Opportunities For Branding. InStore Buyer , pp. 58-61.
Payne, W. (2003). Industry & Trade Summary: Bakery Products. Washington: United
States International Trade Commission.
Samadi, N. (2011). IBISWorld Industry Report 72221b: Coffee & Snack Shops in the US.
IBISWorld.
Solovic, S. W. (2004, May/June). Ten Common Mistakes Start-Up Businesses Make.
Women In Business , 56 (3), pp. 26-27.
Trulia, Inc. (2011). Wilmington Heat Map. Retrieved January 3, 2011, from Trulia:
http://www.trulia.com/home_prices/North_Carolina/Wilmington-heat_map/
U.S. Census Bureau. (2011, June 3). Quickfacts: New Hanover County, NC. Retrieved June
46
10, 2011, from U.S. Census Bureau:
http://quickfacts.census.gov/qfd/states/37/37129.html
US Bureau of the Census. (2000). Census 2000. Washington: US Bureau of the Census.
US Department of Labor. (2011, January 1). Wage and Hour Division. Retrieved January
3, 2011, from United States Department of Labor:
http://www.dol.gov/whd/minwage/america.htm#NorthCarolina
Weigand, J., Bridges, N. D., Pierre, R., Walsh, K., Wilson, H. D., & Gorman-Fancy, E. (2011).
Area Overview: Wilmington Economic Profile. Retrieved January 3, 2011, from
Wilmington InsiderInfo: http://wilmington.insiderinfo.us/area-
overview/economic-
\profile
Wilmington Industrial Development . (2008). WID Demographics and Economy.
Retrieved January 3, 2011, from Wilmington Industrial Development:
http://www.wilmingtonindustry.com/demographics_economy.asp
Wotherspoon, S. (2003, 8 13). Bakeries With an Appetite for Success. The (Melbourne)
Weekly Times .

47
APPENDIX
Appendix A: Target Market
Figure 1.1: Location of Wilmington, North Carolina
Source: (ePodunk, 2007)
Figure 1.2: Map of Wilmington, North Carolina with zip code boundaries and average home
listing prices
Source: (Trulia, Inc., 2011)

48
Table 1.3: Population statistics
Source: (US Bureau of the Census, 2000)
Place Year Population* Annual
Growth
10 Year
Growth Rate
United States
2010 308,745,538 0.57% 9.71%
2009 307,006,550 0.93%
2008 304,177,401 0.86%
2007 301,579,895 1.05%
2006 298,431,771 6.04%
2000 281,421,906
North Carolina
2010 9,458,888 0.8% 17.51%
2009 9,380,884 1.6%
2008 9,230,086 2.0%
2007 9,047,856 2.2%
2006 8,853,849 10.0%
2000 8,049,313
New Hanover County
2010 202,667 3.89% 26.41%
2009 195,085 1.32%
2008 192,538 1.09%
2007 190,471 3.45%
2006 184,116 14.84%
2000 160,330
Wilmington
2010 106,476 5.69% 40.40%
2009 100,746 3.44%
2008 97,392 18.19%
2007 82,400 3.49%
2006 79,622 4.99%
2000 75,838

49
Appendix B: Competition
Table 2.1: Competitive profile matrix
Legend
Nu
mb
er o
f St
ore
s in
To
wn
Qu
alit
y/L
uxu
ry
Est
abli
shed
Din
e-In
Op
tio
n
Lo
cati
on
Var
iety
Ave
rage
Pri
ce Best of Class
Near Best of Class
Average
Below Average
Worst in class
Competitive Offerings
Hot Pink Cake Stand 1 Moderate Moderate Yes Downtown
Cakes and
Cupcakes $3
Coastal Cupcakes 2 Low Moderate No Downtown
Cupcakes
only $2.50
Grocery Store Bakeries Many Low >5 years No Multiple
Cakes and
Cupcakes $1.99
C&M Cupcake Bar 1 High < 2 years Yes Midtown
Cakes and
Cupcakes $3.04

50
Appendix C: Time Schedule
Table 3.1: Development timeline from Microsoft Project & work breakdown structure activities
Ref
# WBS Task Name Duration Predecessors
Total
Slack
Free
Slack
Budgeted
Cost
1 1 C&M Cupcake Bar 125d 0d 0d $108,757.00
2 1.1 R&D 63d 7d 7d $500.00
3 1.1.1 Flavor Testing 7d 7d 7d $500.00
4 1.1.2 Menu Creation 2d 3,12 59d 59d $0.00
5 1.2 Raw Materials 7d 5d 113d $0.00
6 1.2.1 Research Suppliers/ Negotiate Terms
7d 13 5d 5d $0.00
7 1.3 Funding 47d 0d 0d $0.00
8 1.3.1 Identify Funding Options 14d 0d 0d $0.00
9 1.3.2 Request Funding 5d 3,6,8 0d 0d $0.00
10 1.3.3 Secure Funding 14d 9 0d 0d $0.00
11 1.3.4 Funding Received 14d 10 0d 0d $0.00
12 1.4 Professional Culinary
Training
14d 7,13 0d 0d $9,032.00
13 1.5 Setting Up Company 2d 5d 0d $860.00
14 1.5.1 Articles of Organization 2d 5d 0d $625.00
15 1.5.2 File Assumed Name 2d 5d 0d $5.00
16 1.5.3 Business License 2d 5d 0d $30.00
17 1.5.4 Employer ID Number 2d 5d 0d $0.00
18 1.5.5 Bank Account 2d 5d 5d $200.00
19 1.5.6 Officially a Company 0d 14,15,16,17 5d 5d $0.00
20 1.6 Storefront 64d 12 0d 0d $53,885.00
21 1.6.1 Locate 7d 0d 0d $0.00
22 1.6.2 Negotiations 4d 21,10 0d 0d $0.00
23 1.6.3 Signing 1d 22,13,11 0d 0d $12,440.00

51
Table 3.1 cont.
24 1.6.4 New Location is
Contracted
0d 23 0d 0d $0.00
25 1.6.5 Build Up 49d 7,13,24 0d 0d $41,355.00
26 1.6.5.1 Design 15d 0d 0d $300.00
27 1.6.5.2 Permits 5d 26 9d 0d $175.00
28 1.6.5.3 Execute 34d 0d 0d $40,880.00
29 1.6.5.3.1 Cosmetic 20d 26 0d 0d $7,000.00
30 1.6.5.3.2 Functional 20d 26,27 9d 9d $30,000.00
31 1.6.5.3.3 IT 14d 29 0d 0d $3,880.00
32 1.6.6 Inspection 3d 28 0d 0d $90.00
33 1.6.7 Facility Ready 0d 32 0d 0d $0.00
34 1.7 Supplies 17d 7 58d 58d $5,000.00
35 1.7.1 Order Baking Tools 3d 58d 0d $3,000.00
36 1.7.2 Order Office Supplies 3d 58d 0d $2,000.00
37 1.7.3 All Supplies Delivered 14d 35,36 58d 58d $0.00
38 1.8 Secure Vehicle 13d 7 64d 64d $28,000.00
39 1.8.1 Research/Locate Vehicle 5d 64d 0d $0.00
40 1.8.2 Purchase Vehicle 1d 39 64d 0d $25,000.00
41 1.8.3 Vehicle Customization 7d 40 64d 64d $3,000.00
42 1.9 Marketing 28d 7,24 24d 24d $10,580.00
43 1.9.1 Design 7d 24d 0d $1,380.00
44 1.9.2 Print 7d 43 24d 0d $4,200.00
45 1.9.3 Advertising 14d 44 24d 24d $5,000.00
46 1.10 Staffing 32d 7 43d 43d $500.00
47 1.10.1 Legal Requirements 3d 72d 72d $0.00
48 1.10.2 Advertise Position 14d 43d 0d $500.00
49 1.10.3 Interview/Selection 4d 48 43d 0d $0.00
50 1.10.4 Staff Hired 14d 49 43d 43d $0.00

52
Table 3.1 cont.
51 1.11 Training 2d 46,25,34,5,2,12 0d 0d $100.00
52 1.12 Closure 0d 125d 125d $0.00
53 1.13 Test Run/Soft Opening 1d 7,2,13,5,12,25,34
,38,46,51
0d 0d $300.00
54 1.14 Ready for Business 0d 125d 125d $0.00

53
Appendix D: Financials
Table 4.1: Income Statement Year 1 C&M Cupcake Bar
PROJECTED STATEMENTS OF INCOME AND RETAINED EARNINGS
(UNAUDITED)
FIRST YEAR OF OPERATIONS
Month 1 Month 2 Month 3 Month 4 Month 5 Month 6 Month 7 Month 8 Month 9 Month 10 Month 11 Month 12 Total YR1
$ $ $ $ $ $ $ $ $ $ $ $ $
REVENUE
Revenue from Cupcakes 0 0 0 0 23048.06 19462.81 17072.64 17072.64 17072.64 17072.64 16560.46 12804.48 140166.37
Revenue from Cakes 0 0 0 0 2176.88 1838.25 1612.50 1612.50 1612.50 1612.50 1564.13 1209.38 13238.63
Revenue from Cupcake Bar Catering 0 0 0 0 3105.00 2622.00 2300.00 2300.00 2300.00 2300.00 2231.00 1725.00 18883.00
Total Revenue 0 0 0 0 28329.94 23923.06 20985.14 20985.14 20985.14 20985.14 20355.59 15738.86 172288.00
COGS
COGS Cupcakes 0 0 0 0 4534 3829 3358 3358 3358 3358 3258 2519 27572
COGS Cakes 0 0 0 0 159 135 118 118 118 118 114 89 969
COGS Cupcake Bar Catering 0 0 0 0 899 759 666 666 666 666 646 499 5466
Total COGS 0 0 0 0 5592 4722 4142 4142 4142 4142 4018 3107 34007
GROSS PROFIT 0 0 0 0 22738 19201 16843 16843 16843 16843 16338 12632 138281
GENERAL EXPENSES
Misc. Start-Up Expenses 660 0 0 300 0 0 0 0 0 0 0 0 960
Research and Development 0 500 0 0 0 0 0 0 0 0 0 0 500
Marketing & Promotion 0 0 0 10580 6440 2645 2300 2070 1725 2070 1150 1495 30475
Accounting and legal 500 0 500 0 0 0 0 0 0 0 0 0 1000
Bank charges 50 50 50 50 50 50 50 50 50 50 50 50 600
Insurance 0 0 280 280 280 280 280 280 280 280 280 280 2800
Occupancy, administration 0 0 7985 3960 4460 4460 4460 4460 4460 4460 4460 4460 47625
Office supplies 0 0 0 2000 0 0 0 0 0 0 1000 0 3000
Salary, administrative 0 0 500 0 6510 6510 6510 6510 6510 6510 6510 6510 52579
Training, staff 9032 0 0 100 0 0 0 0 0 0 0 0 9132
Telecommunications 340 140 140 235 235 235 235 235 235 235 235 235 2735
Capital Depreciation 0 0 845 845 845 845 845 845 845 845 845 845 8452
LTD Payment 6542 6542 6542 6542 6542 6542 6542 6542 6542 6542 6542 6542 78503
Total General Expenses 16464 7232 16842 24592 25362 21567 21222 20992 20647 20992 21072 20417 237402
NET INCOME (LOSS) BEFORE INCOME TAXES (16464) (7232) (16842) (24592) (2624) (2366) (4379) (4149) (3804) (4149) (4734) (7785) (99121)
PROVISION FOR INCOME TAXES 0 0 0 0 0 0 0 0 0 0 0 0 0
NET INCOME (LOSS) (16464) (7232) (16842) (24592) (2624) (2366) (4379) (4149) (3804) (4149) (4734) (7785) (99121)
RETAINED EARNINGS ( DEFICIT), OPENING 0 (16464) (23696) (40538) (65130) (67754) (70120) (74499) (78649) (82453) (86602) (91336) 0
RETAINED EARNINGS(DEFICIT), ENDING (16464) (23696) (40538) (65130) (67754) (70120) (74499) (78649) (82453) (86602) (91336) (99121) (99121)
SCHEDULES Jan Feb Mar Apr May Jun Jul Aug Sep Oct Nov Dec
19% Dec. 21% Inc. 35% Inc. 14% Inc. 3% Dec. 25% Dec.
Number of Cupcakes Sold 0 0 0 0 7582 6402 5616 5616 5616 5616 5448 4212 46107
Number of Cakes Sold 0 0 0 0 4 3 3 3 3 3 3 2 25
Number of Cupcake Bar Catering Sold 0 0 0 0 5 5 4 4 4 4 4 3 33
Total C&M Sales 0 0 0 0 7591 6410 5623 5623 5623 5623 5454 4217 46165
Retail Sales
Average Cupcake Price 3.04$
Average Cake Price 537.50$
Average Cupcake Bar Catering Price 575$
Cost of Good Sold Cupcake Cake
Ingredients 0.34$ 3.94$ 6.63$
Packaging 0.18$ 0.83$ 2.25$
Travel 0 0 16.66$
Labor 0 0 16.00$
Contingency (15%) 0.08$ 0.72$ 1.33$
COGS 0.60$ 5.49$ 42.87$ 9.02€
AVERAGE COGS 39.34$ 166.43$
Cupcake Bar Catering

54
Misc. Start-Up Expenses
Company Set Up 660 0 0 0 0 0 0 0 0 0 0 0 660
Test Run/Soft Opening 0 0 0 300 0 0 0 0 0 0 0 0 300
Sub-Total 660 0 0 300 0 0 0 0 0 0 0 0 960
Marketing & Promotion
Tradeshows 0 0 0 0 300 0 0 0 0 0 0 0 300
Advertising & media 0 0 0 5000 5000 2000 2000 1500 1500 1500 1000 1000 20500
Promotional Materials 0 0 0 4000 300 300 0 300 0 300 0 300 5500
Business cards 0 0 0 200 0 0 0 0 0 0 0 0 200
Misc. (15%) 0 0 0 1380 840 345 300 270 225 270 150 195 3975
Sub-Total 0 0 0 10580 6440 2645 2300 2070 1725 2070 1150 1495 30475
Salaries, administrative
Staffing 0 0 500 0 0 0 0 0 0 0 0 0 500
Owner 1 0 0 0 0 2000 2000 2000 2000 2000 2000 2000 2000 16000
Owner 2 0 0 0 0 2000 2000 2000 2000 2000 2000 2000 2000 16000
Part Time Assistant (2) 0 0 0 0 1280 1280 1280 1280 1280 1280 1280 1280 10240
Benefits and FICA 0 0 0 0 1230 1230 1230 1230 1230 1230 1230 1230 9839
Sub-Total 0 0 500 0 6510 6510 6510 6510 6510 6510 6510 6510 52579
Accounting and legal
Legal 500 0 500 0 0 0 0 0 0 0 0 0 1000
Sub-Total 500 0 500 0 0 0 0 0 0 0 0 0 1000
Occupancy, administration
Rent 0 0 6920 3460 3460 3460 3460 3460 3460 3460 3460 3460 38060
Utilities 0 0 500 500 1000 1000 1000 1000 1000 1000 1000 1000 9000
Build Up 0 0 565 0 0 0 0 0 0 0 0 0 565
Sub-Total 0 0 7985 3960 4460 4460 4460 4460 4460 4460 4460 4460 47625
Telecommunications
Telephone 0 0 0 30 30 30 30 30 30 30 30 30 270
Internet 0 0 0 65 65 65 65 65 65 65 65 65 585
Cell Phone 340 140 140 140 140 140 140 140 140 140 140 140 1740
Sub-Total 340 140 140 235 235 235 235 235 235 235 235 235 2595
Capital asset purchases
IT 0 0 3000 0 0 0 0 0 0 0 0 0 3000
Kitchen Equipment 0 30000 0 0 0 0 0 0 0 0 0 0 30000
Car 0 0 28000 0 0 0 0 0 0 0 0 0 28000
Furnishings 0 0 7000 0 0 0 0 0 0 0 0 0 7000
Other Equipment 0 0 3000 0 0 0 0 0 0 0 0 0 3000
Sub-Total 0 30000 41000 0 0 0 0 0 0 0 0 0 71000
Sale of Capital Stock
Capital raised 20000 0 0 0 0 0 0 0 0 0 0 0 20000
Sub-Total 20000 0 0 0 0 0 0 0 0 0 0 0 20000
Loan payments, LTD
LTD (@ $210000) 6542 6542 6542 6542 6542 6542 6542 6542 6542 6542 6542 6542 78503
Sub-Total 6542 6542 6542 6542 6542 6542 6542 6542 6542 6542 6542 6542 78503
**Assumptions:
1) The owners' salaries are not included in labor; they are included under administrative costs because they will be paid a flat salary and any extra labor will be considered sweat equity
2) There are no leasehold improvements therefore everything from build up can be depreciated
3) The number of cupcakes and cakes sold are based on a similar business in Wilmington, North Carolina during their first year of business
4) All capital depreciation is based on a 7 year lifespan
5) Cake sales price is based on an average of $75 minimum cake price and $1000 higher end but realistic price
6) Cupcake bar catering sales price is based on an average of $150 minimum order price and $1000 higher end but realistic price
7) Labor included in the cupcake bar catering costs is for one assistant to assemble cupcakes for the client for a minimum of 2 hours
8) Misc. company set-up costs include fees for filing articles of organization, an assumed name, and a business license
9) Part time employees do not receive benefits
10) Part time employees (2) are paid $8.00/hour and work approximately 20 hours a week
11) Build up costs include permits, inspection, and design
12) Long term debt (loan amount) = (total start up cost) + (6 months working capital) + (10% buffer) - (money raised from family, friends, and fools)
13) The owners will take advantage of any opportunities offered to women and minorities, therefore the long term debt amount is the worst case scenarios based on a standard loan
14) Seasonality will affect business from day one
15) Seasonality projections are based on industry standards
16) No money is budgeted for accounting because of the assistance of the external member who is also related to the owners
17) Federal Insurance Contributions Act Tax (FICA) is paid in the amount of: 15.8% of owners salaries and 7.65% of part time employees wages
APPENDIX E: FINANCIALS
Table 4.1: Cash Flow Statement Year 1
Table 4.1 (continued)

55
C&M Cupcake BarPROJECTED STATEMENTS OF INCOME AND RETAINED EARNINGS
(UNAUDITED)
SECOND YEAR OF OPERATIONS
Month 1 Month 2 Month 3 Month 4 Month 5 Month 6 Month 7 Month 8 Month 9 Month 10 Month 11 Month 12 Total YR1
$ $ $ $ $ $ $ $ $ $ $ $ $
REVENUE
Revenue from Cupcakes 14,001.21$ 17,285.44$ 17,285.44$ 20,915.20$ 23,336.16$ 19,706.09$ 17,286.05$ 17,286.05$ 17,286.05$ 17,286.05$ 16,767.47$ 12,964.54$ 211,405.74$
Revenue from Cakes 1,322.45$ 1,975.51$ 1,632.66$ 1,632.66$ 2,204$ 1,861$ 1,633$ 1,633$ 1,633$ 1,633$ 1,584$ 1,224$ 19,967.39$
Revenue from Cupcake Bar Catering 1,886.29$ 2,817.79$ 2,328.75$ 2,328.75$ 3,144$ 2,655$ 2,329$ 2,329$ 2,329$ 2,329$ 2,259$ 1,747$ 28,480.61$
Total Revenue 17210 22079 21247 24877 28684 24,222.10$ 21,247.45$ 21,247.45$ 21,247.45$ 21,247.45$ 20,610.03$ 15,935.59$ 259,853.74$
COGS
COGS Cupcakes 2754 3400 3400 4114 4590 3876 3400 3400 3400 3400 3298 2550 41586
COGS Cakes 97 145 119 119 161 136 119 119 119 119 116 90 1461
COGS Cupcake Bar Catering 546 816 674 674 910 768 674 674 674 674 654 506 8244
Total COGS 3397 4360 4194 4908 5662 4781 4194 4194 4194 4194 4068 3145 51291
GROSS PROFIT 13813 17718 17053 19969 23022 19441 17054 17054 17054 17054 16542 12790 208563
GENERAL EXPENSES
Research and Development 0 0 0 0 0 0 0 0 0 0 0 0 0
Marketing & Promotion 1380 1840 1150 1150 1840 1150 1150 1380 1150 1495 1150 1150 15985
Accounting and legal 0 0 0 0 0 0 0 0 0 0 0 0 0
Bank charges 50 50 50 50 50 50 50 50 50 50 50 50 600
Insurance 180 180 180 180 180 180 180 180 180 180 180 180 2160
Occupancy, administration 4475 4475 4475 4475 4475 4475 4475 4475 4475 4475 4475 4475 53700
Office supplies 0 0 0 1000 0 0 0 0 0 0 1000 0 2000
Salary, administrative 6205 6205 6205 6205 6205 6205 6205 6205 6205 6205 6205 6205 74457
Training, staff 0 0 0 0 0 0 0 0 0 0 0 0 0
Telecommunications 235 235 235 235 235 235 235 235 235 235 235 235 2820
Capital Depreciation 845 845 845 845 845 845 845 845 845 845 845 845 10143
LTD payment 6542 6542 6542 6542 6542 6542 6542 6542 6542 6542 6542 6542 78503
Total General Expenses 19912 20372 19682 20682 20372 19682 19682 19912 19682 20027 20682 19682 240369
NET INCOME (LOSS) BEFORE INCOME TAXES (6099) (2654) (2629) (713) 2650 (241) (2628) (2858) (2628) (2973) (4140) (6892) (31806)
PROVISION FOR INCOME TAXES 0 0 0 0 0 0 0 0 0 0 0 0 0
NET INCOME (LOSS) (6099) (2654) (2629) (713) 2650 (241) (2628) (2858) (2628) (2973) (4140) (6892) (31806)
RETAINED EARNINGS ( DEFICIT), OPENING 0 (6099) (8753) (11382) (12095) (9444) (9685) (12314) (15172) (17800) (20774) (24914) 0
RETAINED EARNINGS(DEFICIT), ENDING (6099) (8753) (11382) (12095) (9444) (9685) (12314) (15172) (17800) (20774) (24914) (31806) (31806)
SCHEDULES Jan Feb Mar Apr May Jun Jul Aug Sep Oct Nov Dec
19% Dec. 21% Inc. 35% Inc. 14% Inc. 3% Dec. 25% Dec.
Number of Cupcakes Sold 4606 5686 5686 6880 7676 6482 5686 5686 5686 5686 5516 4265 69541
Number of Cakes Sold 2 4 3 3 4 3 3 3 3 3 3 2 37
Number of Cupcake Bar Catering Sold 3 5 4 4 5 5 4 4 4 4 4 3 50
Total C&M Sales 4611 5695 5693 6887 7686 6490 5693 5693 5693 5693 5522 4270 69628
Retail Sales
Average Cupcake Price 3.04$
Minimum Cake Price 537.50$
Minimum Cupcake Bar Catering Price 575$
Cost of Good Sold Cupcake Cake
Ingredients 0.34$ 3.94$ 6.63$
Packaging 0.18$ 0.83$ 2.25$
Tooling
Travel 16.66$
Labor 16.00$
Contingency (15%) 0.08$ 0.72$ 1.33$
COGS 0.60$ 5.49$ 42.87$
AVERAGE COGS 39.34$ 166.43$
Cupcake Bar Catering
Table 4.2: Income Statement Year 2

56
Marketing & Promotion
Tradeshows 0 300 0 0 300 0 0 0 0 0 0 0 600
Advertising & media 1000 1000 1000 1000 1000 1000 1000 1000 1000 1000 1000 1000 12000
Promotional Materials 0 300 0 0 300 0 0 0 0 300 0 0 900
Business cards 200 0 0 0 0 0 0 200 0 0 0 0 400
Misc. (15%) 180 240 150 150 240 150 150 180 150 195 150 150 2085
Sub-Total 1380 1840 1150 1150 1840 1150 1150 1380 1150 1495 1150 1150 15985
Salaries, administrative
Owner 1 1868 1868 1868 1868 1868 1868 1868 1868 1868 1868 1868 1868 22419
Owner 2 1868 1868 1868 1868 1868 1868 1868 1868 1868 1868 1868 1868 22419
Part Time Assistant (2) 1280 1280 1280 1280 1280 1280 1280 1280 1280 1280 1280 1280 15360
Benefits and FICA 1188 1188 1188 1188 1188 1188 1188 1188 1188 1188 1188 1188 14259
Sub-Total 6205 6205 6205 6205 6205 6205 6205 6205 6205 6205 6205 6205 74457
Accounting and legal
Legal 0 0 0 0 0 0 0 0 0 0 0 0 0
Sub-Total 0 0 0 0 0 0 0 0 0 0 0 0 0
Occupancy, administration
Rent 3460 3460 3460 3460 3460 3460 3460 3460 3460 3460 3460 3460 41520
Utilities 1015 1015 1015 1015 1015 1015 1015 1015 1015 1015 1015 1015 12180
Sub-Total 4475 4475 4475 4475 4475 4475 4475 4475 4475 4475 4475 4475 53700
Telecommunications
Telephone 30 30 30 30 30 30 30 30 30 30 30 30 360
Internet 65 65 65 65 65 65 65 65 65 65 65 65 780
Cell Phone 140 140 140 140 140 140 140 140 140 140 140 140 1540
Sub-Total 235 235 235 235 235 235 235 235 235 235 235 235 2680
Capital asset purchases
IT 0 0 0 0 0 0 0 0 0 0 0 0 0
Kitchen Equipment 0 0 0 0 0 0 0 0 0 0 0 0 0
Car 0 0 0 0 0 0 0 0 0 0 0 0 0
Furnishings 0 0 0 0 0 0 0 0 0 0 0 0 0
Other Equipment 0 0 0 0 0 0 0 0 0 0 0 0 0
Sub-Total 0 0 0 0 0 0 0 0 0 0 0 0 0
Sale of Capital Stock
Money Raised 0 0 0 0 0 0 0 0 0 0 0 0 0
Sub-Total 0 0 0 0 0 0 0 0 0 0 0 0 0
Loan payments, LTD
LTD (@ $210000) 6542 6542 6542 6542 6542 6542 6542 6542 6542 6542 6542 6542 78503
Sub-Total 6542 6542 6542 6542 6542 6542 6542 6542 6542 6542 6542 6542 78503
**Assumptions:
1) Owner salaries decrease to $22,419 each in year 2
2) Number of products sold increases at 15% annually (1.25% a month)
Table 4.2 (continued)

57
Total Year 3 Total Year 4 Total Year 5
$ $ $
REVENUE
Total Revenue 298832 343657 395205
COGS 58984 67832 78007
Gross Profit 239848 275825 317198
GENERAL EXPENSES
Total General Expenses 240521 174620 184323
NET INCOME (LOSS) BEFORE INCOME TAXES (674) 101204 132876
PROVISION FOR INCOME TAXES 0 6983 9168
NET INCOME (LOSS) (674) 94221 123707
RETAINED EARNINGS ( DEFICIT), OPENING (31806) (32479) 61742
RETAINED EARNINGS(DEFICIT), ENDING (32479) 61742 185449
C&M Cupcake Bar
YEAR 3-5 OF OPERATIONS
(UNAUDITED)
PROJECTED STATEMENTS OF INCOME AND RETAINED EARNINGS
Table 4.3: Income Statement Years 3 – 5

58
C&M Cupcake BarPROJECTED STATEMENTS OF CASH FLOW
(UNAUDITED)
FIRST YEAR OF OPERATIONS
Month 1 Month 2 Month 3 Month 4 Month 5 Month 6 Month 7 Month 8 Month 9 Month 10 Month 11 Month 12 Total
$ $ $ $ $ $ $ $ $ $ $ $ $
CASH IN
Revenue from Cupcakes 0 0 0 0 23048 19463 17073 17073 17073 17073 16560 12804 140166
Revenue from Cakes 0 0 0 0 2177 1838 1613 1613 1613 1613 1564 1209 13239
Revenue from Cupcake Bar Catering 0 0 0 0 3105 2622 2300 2300 2300 2300 2231 1725 18883
Total Revenue 0 0 0 0 28330 23923 20985 20985 20985 20985 20356 15739 172288
Long Term Debt 210000 0 0 0 0 0 0 0 0 0 0 0 210000
Sale of Capital Stock 20000 0 0 0 0 0 0 0 0 0 0 0 20000
Total Cash In 230000 28330 23923 20985 20985 20985 20985 20356 15739 402288
CASH OUT
Cost of Goods 0 0 0 0 5592 4722 4142 4142 4142 4142 4018 3107 34007
Misc. Start-Up Expenses 660 0 0 300 0 0 0 0 0 0 0 0 960
Marketing and promotion 0 0 0 10580 6440 2645 2300 2070 1725 2070 1150 1495 30475
Accounting and legal 500 0 500 0 0 0 0 0 0 0 0 1000
Bank charges 50 50 50 50 50 50 50 50 50 50 50 50 600
Insurance 0 0 280 280 280 280 280 280 280 180 180 180 2500
Occupancy, administration 0 0 7985 3960 4460 4460 4460 4460 4460 4460 4460 4460 47625
Office supplies 0 0 0 2000 0 0 0 0 0 0 1000 0 3000
Salaries, administrative 0 0 500 0 6510 6510 6510 6510 6510 6510 6510 6510 52579
Training, staff 9032 0 0 100 0 0 0 0 0 0 0 0 9132
Telecommunications 340 140 140 235 235 235 235 235 235 235 235 235 2735
Loan payments + interest, LTD 6542 6542 6542 6542 6542 6542 6542 6542 6542 6542 6542 6542 78503
Operating loan repayment 0 0 0 0 0 0 0 0 0 0 0 0 0
Capital asset purchases per schedule 0 30000 41000 0 0 0 0 0 0 0 0 0 71000
TOTAL CASH OUT 17124 36732 56997 24047 30109 25444 24519 24289 19802 20047 20127 19472 318708
NET CASH FLOW (DEFICIT) 212876 (36732) (56997) (24047) (1779) (1521) (3534) (3304) 1183 938 229 (3733) 83580
CASH BALANCE(OVERDRAFT), OPENING 0 212876 176144 119147 95100 93321 91801 88267 84963 86146 87084 87313 0
CASH BALANCE(OVERDRAFT), CLOSING 212876 176144 119147 95100 93321 91801 88267 84963 86146 87084 87313 83580 83580
Table 4.4: Cash Flow Statement Year 1

59
C&M Cupcake Bar
PROJECTED STATEMENTS OF CASH FLOW
(UNAUDITED)
SECOND YEAR OF OPERATIONS
Month 1 Month 2 Month 3 Month 4 Month 5 Month 6 Month 7 Month 8 Month 9 Month 10 Month 11 Month 12 Total
$ $ $ $ $ $ $ $ $ $ $ $ $
CASH IN
Revenue from Cupcakes 14001 17285 17285 20915 23336 19706 17286 17286 17286 17286 16767 12965 211406
Revenue from Cakes 1322 1976 1633 1633 2204 1861 1633 1633 1633 1633 1584 1224 19967
Revenue from Cupcake Bar Catering 1886 2818 2329 2329 3144 2655 2329 2329 2329 2329 2259 1747 28481
Total Revenue 17210 22079 21247 24877 28684 24222 21247 21247 21247 21247 20610 15936 259854
Long Term Debt 0 0 0 0 0 0 0 0 0 0 0 0 0
Sale of Capital Stock 0 0 0 0 0 0 0 0 0 0 0 0 0
Total Cash In 17210 22079 21247 24877 28684 24222 21247 21247 21247 21247 20610 15936 259854
CASH OUT
Cost of Goods 3397 4360 4194 4908 5662 4781 4194 4194 4194 4194 4068 3145 51291
Marketing and promotion 1380 1840 1150 1150 1840 1150 1150 1380 1150 1495 1150 1150 15985
Accounting and legal 0 0 0 0 0 0 0 0 0 0 0 0 0
Bank charges 50 50 50 50 50 50 50 50 50 50 50 50 600
Insurance 280 280 280 280 280 280 280 280 280 280 280 280 3360
Occupancy, administration 4475 4475 4475 4475 4475 4475 4475 4475 4475 4475 4475 4475 53700
Office supplies 0 0 0 2000 0 0 0 0 0 0 1000 0 3000
Salaries, administrative 6205 6205 6205 6205 6205 6205 6205 6205 6205 6205 6205 6205 74457
Training, staff 0 0 0 0 0 0 0 0 0 0 0 0 0
Telecommunications 235 235 235 235 235 235 235 235 235 235 235 235 2820
Loan payments + interest, LTD 6542 6542 6542 6542 6542 6542 6542 6542 6542 6542 6542 6542 78503
Operating loan repayment 0 0 0 0 0 0 0 0 0 0 0 0 0
Capital asset purchases per schedule 0 0 0 0 0 0 0 0 0 0 0 0 0
TOTAL CASH OUT 22564 23987 23131 25845 25288 23718 23131 23361 18937 19282 19937 18937 268115
NET CASH FLOW (DEFICIT) (5354) (1908) (1884) (968) 3396 504 (1883) (2113) 2311 1966 673 (3001) (8262)
CASH BALANCE(OVERDRAFT), OPENING 83580 78226 76318 74434 73466 76862 77366 75483 73370 75681 77646 78320 83580
CASH BALANCE(OVERDRAFT), CLOSING 78226 76318 74434 73466 76862 77366 75483 73370 75681 77646 78320 75318 75318
Table 4.5: Cash Flow Statement Year 2

60
Total Year 3 Total Year 4 Total Year 5
$ $ $
CASH IN
Total Revenue 298832 343657 395205
Long Term Debt 0 0 0
Sale of Capital Stock 0 0 0
Total Cash In 298832 343657 395205
CASH OUT
Cost of Goods 58984 67832 78007
General Expenses 151875 164477 174180
Loan Payments + Interest, LTD 78503 0 0
Operating Loan Repayment 0 0 0
Capital Asset Purchase per schedule 0 0 0
TOTAL CASH OUT 289362 232309 252186
NET CASH FLOW (DEFICIT) 9469 111347 143019
CASH BALANCE (OVERDRAFT), OPENING 75318 84787 196135
CASH BALANCE (OVERDRAFT), CLOSING 84787 196135 339154
C&M Cupcake BarPROJECTED STATEMENTS OF CASH FLOW
(UNAUDITED)
YEAR 3-5 OF OPERATIONS
Table 4.6: Cash Flow Statement Years 3 – 5

61
Table 4.7: Pricing and profit margins of cakes and cupcake bar catering
Average Per Cake
Sales Price
Cost
Gross Profit
Gross Profit Margin
Ingredient Cost
Average Per Cupcake Bar Catering
Sales Price
Cost
Gross Profit
Gross Profit Margin
Ingredient Cost
**Assumptions:
1) Cost of cakes include ingredients and packaging (cake board, dowels, and box)
2) Cost of cupcake bar catering includes ingredients, packaging (liners), and staff assembly
$537.50
67.02%
7.32%
32.98%
$39.35
$498.16
92.68%
$575.00
$189.65
$385.35

62
Table 4.8: Cupcake bar pricing and profit margins
Component Prices:
Sales
Price Cost
Gross
Profit
Gross
Profit
Margin
Base $2.00 $0.11 $1.89 95%
Frosting $0.50 $0.06 $0.44 87%
Filling $0.25 $0.10 $0.15 60%
Toppings $0.50 $0.13 $0.37 74%
Basic Combination
Options + Prices:
Base +
Frosting
Base +
Frosting
+ Filling
Base +
Frosting
+ 1
Topping
Base +
Frosting
+ Filling +
1
Topping
Base +
Frosting +
Filling + 2
toppings
Standard Filling 1 Topping Deluxe Decadence
Base $2.00 $2.00 $2.00 $2.00 $2.00
Frosting $0.50 $0.50 $0.50 $0.50 $0.50
Filling X $0.50 X $0.25 $0.25
Toppings X X $0.50 $0.50 $1.00
Total Sales Price $2.50 $3.00 $3.00 $3.25 $3.75
Cost $0.17 $0.27 $0.30 $0.40 $0.53
Gross Profit $2.33 $2.73 $2.70 $2.85 $3.22
Gross Profit Margin 93% 91% 90% 88% 86%
Pre-Made Cupcakes
Sales Price $2.75
Average Cost $0.33 (Average of Filling,1 Topping, & Deluxe Combination Options)
Gross Profit $2.42
Gross Profit Margin 88%
Average Per Cupcake
(Custom & Pre-Made
Cupcakes)
Sales Price
Cost
Gross Profit
Gross Profit Margin
Ingredient Cost
**Assumptions:
1) Cost of cupcakes include ingredients and packaging (cupcake liners and box)
$3.10
$0.34
$2.76
89%
Average From Cupcake
Bar
$3.04
$0.34
$2.70
89%
11%

63
Appendix E: Product Samples
Figure 5.1: Pictures of previous work done by the potential future owners of C&M Cupcake Bar


