

An Experimental Investigation of the Effects of Retargeted
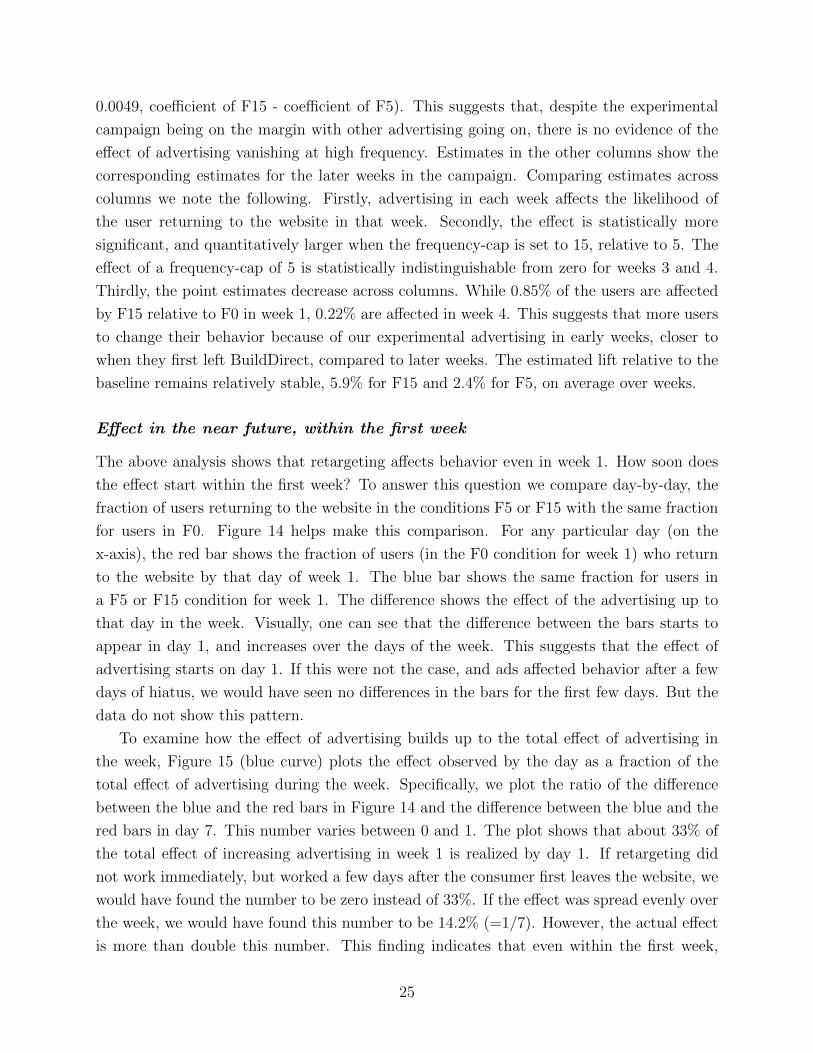
Advertising – the Role of Frequency and Timing
Navdeep S. Sahni
Stanford University
Sridhar Narayanan
Stanford University
Kirthi Kalyanam∗
Santa Clara University
First draft: Septembet 2016; this draft June 2017
Abstract
In collaboration with an online seller of home-improvement products, we conduct a
large-scale randomized field experiment to study the effects of retargeted advertising –
a form of internet advertising in which banner ads are displayed to users after their visit
to the advertiser’s web site. We find that retargeting increases consumer engagement
with the website. Turning the advertising on causes 14.6% more users to return to
the website in four weeks. We find that the effectiveness of advertising decreases as
the time since the consumer first visits the website increases. 33% of the effect of first
week’s advertising occurs on the very first day. Further, we also find clear evidence of
the existence of complementarities in advertising over time – the effect of advertising
in week 2 (the second week after the campaign started) is higher when the user was
allocated to non-zero level of advertising in week 1. Taken together, our findings stand
at odds with the view that retargeted ads inform or remind consumers of the advertised
product. They are consistent with an “attention hoarding” or a “competition-blocking”
role of advertising.
∗In reverse-alphabetical order of the authors’ last names. Web appendix to the pa-per can be found at https://people.stanford.edu/nsahni1/research. The authors can bereached at [email protected] (Navdeep), [email protected] (Sridhar) [email protected] (Kirthi) respectively. They would like to thank BuildDirect.com, its CEO Jeff Booth,its Senior Marketing Manager Tyler Vautier and others at the firm for their help in setting up the experimentand making this project possible. The authors would also like to thank Sinan Aral, Avi Goldfarb, GarrettJohnson, Harikesh Nair, Aniko Oery, Stephan Seiler, Catherine Tucker, participants at the 2016 UT-DallasFORMS conference, MIT Sloan marketing seminar, 2016 Greater China Conference on Mobile Big DataMarketing and the McGill University Marketing Seminar for their comments. Sridhar would like to thankthe Philip F. Maritz Faculty Scholarship for support. Navdeep would like to thank the Lacob Family FacultyScholarship.
1
1 Introduction
This paper studies a prominent form of online advertising, referred to as remarketing or
behavioral retargeting or simply retargeting, that allows advertisers to target consumers
based on their past behavior on the advertiser’s website. For instance, advertising might
be targeted at consumers who arrive at the advertiser’s website, search for a product, but
leave without making a purchase. Despite being a relatively new technology, spending on
retargeting has reached significant levels with a large majority of advertisers engaging in it
(IndustryReport (2014); AdRoll (2014)).
Several features of retargeting are noteworthy. Firstly, retargeting campaigns specifi-
cally aim to serve ads to individuals who have been to the advertiser’s website and have
browsed product pages that typically contain abundant information in the form of prices,
technical specifications, product reviews, pictures etc. Therefore, by construction, retarget-
ing campaigns target individuals who are likely to be aware and informed of the product the
advertiser aims to sell. Secondly, many retargeting campaigns display ad banners that pro-
vide little new information – featuring the name of the retailer, the category, or the specific
products browsed by the target consumer (Helft and Vega (2010)).1 Thirdly, a prominent
feature of retargeting is that it is typically activated as soon as a consumer leaves the adver-
tiser’s website. Indeed, the platforms enabling retargeting have developed technology that
reduces the time lag between the consumers leaving the website and the beginning of the
campaign to almost zero .2
These features make retargeting unique and theoretically interesting because it is hard
to explain why retargeting might influence consumer behavior using the standard paradigm
of informative advertising, in which advertising informs or reminds consumers about the
existence or attributes of the advertised product. Retargeted ads are displayed to individuals
who are likely to be aware of the information in the ad. Therefore, it is possible that
retargeted ads are ineffective, or are effective only after time passes and consumers forget,
if we were to take the standard informative view. On the other hand, retargeting could
affect consumer-behavior through alternative mechanisms. For example, it is possible that
retargeting plays a signaling role (Nelson, 1974) – consumers infer spending on retargeting as
a signal of high quality. Another possible mechanism is that retargeting reduces the likelihood
of consumers viewing other ads that may distract the consumer, and lead them to consider
competitors. Knowing which mechanism drives the effects is important to understand the
function of retargeting. It is also important because different mechanisms may have different
1In practice, such ads rarely provide any additional incentives such as price discounts to the consumer,relative to what is available on the website.
2The following is one of the many discussions available on the basics of retargeting http://blog.hubspot.
com/marketing/retargeting-campaigns-beginner-guide.
2
implications for advertising strategy. For example, if retergeted ads work by serving as
reminders, it might be wasteful to show them immediately after the consumer leaves the
website. It may also be less efficient to show ads to individuals who are more advanced in
their purchase process (e.g., have created a shopping cart) because these individuals may
be more aware of the advertised product and its attributes. However, this might not be the
case if retargeting works by displacing other ads.
Motivated by the above reasons, we focus on the following research questions. First, do
retargeted ads affect consumer behavior? Second, if they do affect consumer behavior, then
what is the mechanism driving their effect? Are the estimates and data patterns consistent
with an informative role of advertising? Consequently, should the ads be shown immediately
after the consumer leaves the website? Do ads affect users who have already created shop-
ping carts, and are presumably more informed and farther along in their purchase process?
Finally, what are the implications of the mechanism for advertisers who have limited levers
to control their campaigns? Is there an optimal temporal distribution of advertising?
We study these questions empirically. A challenge in estimating the effects of retargeting
is that consumers who get exposed to retargeting ads are a set of people who self-select
themselves into the campaign by exploring the advertiser’s website. Therefore, an empir-
ical study that compares their behavior with the behavior of consumers who did not get
exposed to retargeting ads will be problematic because these groups of individuals are likely
to have different preferences and choices even in the absence of ads. We overcome this
measurement challenge by designing a large-scale randomized experiment in collaboration
with an advertiser that engages in extensive retargeting. Specifically, we collaborate with
BuildDirect.com, which is a Canada-based retailer of home improvement products (such as
flooring and building materials), with customers primarily in the United States. It is one
of the largest spenders on online advertising in Canada. Our experiment spans across mul-
tiple product categories and across approximately half the states in the United States. It
involves retargeting campaigns run on the Google Doubleclick platform, with advertising
being shown to customers browsing on any of the websites that are part of this platform’s
advertising network.3
To address our research questions, our experiment randomly varies several aspects of
the advertising campaign. Any individual who becomes eligible for retargeting (when he
or she leaves the website) gets allocated to a random schedule of advertising-levels in each
of the subsequent four weeks. The level of advertising in each week is manipulated by
setting frequency caps for the number of ads shown to a given consumer. The frequency
cap specifies the maximum number of ads that a consumer sees in a day and is randomly
3An advertising network connects advertisers to the websites that have advertising inventory (referred toas publishers in the industry), and serves as an efficient alternative to the complexities of individual contractsbetween the large number of advertisers and publishers.
3
chosen for each of the four weeks from a set of three frequency-cap levels – zero, low and
high. Therefore, our design creates a large number of experimental conditions with varying
patterns of advertising in the four weeks of the experimental campaign. Because of the
experiment, some individuals get a frequency-cap level of zero throughout four weeks, others
get a consistently high level of advertising throughout the four weeks, while some others
receive increasing, decreasing or pulsing pattern of exposure over time from our experimental
campaign. We chose this experimental design for the following reasons. First, in addition
to estimating the causal effects of retargeting, it creates variation that allows us to examine
evidence on whether retargeted ads spread awareness or serve as reminders. For example,
if retargeting were primarily playing a reminder role, advertising early on (just after the
user leaves the advertiser’s website) would have lower effects than advertising at later points
in time, holding everything else constant. Our experiment provides comparison groups to
conduct this test, and other tests predicted by the informative theory, detailed later. Second,
it allows us to explore implications of other possible mechanisms as well, by generating a
variety of temporal patterns of advertising intensity . Third, an important decision variable
for advertisers in this context is precisely the sequence of frequency caps for the length of
the retargeting campaign. By implementing numerous possible combinations, our design is
able to directly evaluate the different advertiser policies in terms of the schedule of frequency
caps over the course of retargeting campaigns.
We implement the above design for two separate sets of users. The first set consists
of users who exited the website after viewing a product, but without creating a virtual
shopping-cart or making a purchase. For this set we have 81 (= freq cap levelsweeks = 34)
experimental conditions, providing us rich variation to examine the effects of retargeting, its
temporal patterns, and the mechanisms by which retargeting works. The second set consists
of users who added a product to a virtual shopping-cart but exited the website without
making a purchase. Since the number of people creating shopping carts at the website is
much smaller than the number of people visiting product pages, we implement a simpler
design with four conditions (2 frequency cap levels × 2 time periods of two weeks each) for
this part of the experiment. The inclusion of different types of users allows us to study the
effects of retargeting for consumers at early and later stages in their decision-making, since
the creation of a shopping cart happens on average much later in the decision making process
than visiting a product page.
This experimental design is appealing due to its conceptual simplicity. However, execut-
ing it in practice and gathering data for analysis requires overcoming several implementation
difficulties. These difficulties are general, and faced by any online advertiser who wants to
conduct individual-level experimentation. In general, the entire advertising campaign is
hosted by the advertising platform, which collects and shares with the advertiser behavioral
4

tracking data about users who saw at least one ad sponsored by the advertiser. Conse-
quently, the advertiser cannot track individuals who do not see any ads. Therefore, even if
an advertiser is able to randomize users into groups of those who are eligible to see the ads
(treatment group) and those who are not (control group), she will not be able to compare
their outcomes to estimate the causal effect of the experimental ad campaign because the
outcomes for the control group will be unknown due to lack of tracking data. The outcomes
for individuals in the treatment group who did not see any ads will also be unobserved.4
We propose and demonstrate a solution that overcomes the above implementation issues,
at very low cost. For each experimental condition, in addition to the retargeting campaign
with the randomized frequency-cap schedule, we launch a separate campaign that shows a
single banner advertisement with a public service announcement (PSA) that is unrelated to
the advertiser’s product. The purpose of this additional single-ad campaign is to “tag” all
individuals in the experiment so we can identify which user is allocated to which condition,
and (b) observe behavioral data for all users and not just those who get exposed to a
retargeted ad. Each of the experimental condition has it’s own “tag-campaign”, and these
campaigns are identical across conditions. Since there is a single banner-ad per consumer,
the cost of this approach is small, relative to an alternative that replaces all instances of a
campaign ad with a PSA ad - a commonly utilized approach in the industry of conducting
A/B tests for advertising effectiveness.5 More details on the tag campaign are discussed later
in the paper. 6
Using this approach we are able to compare outcomes for users across our experimental
conditions. We find that retargeting ads increase engagement with the website. 14.6% more
users in the product-viewers campaign (those who exited the website after viewing a product
page) return to the website because of the experimental ads. In addition to this increase at
the extensive margin, retargeting also shifts the distribution of the number of visits (or the
number of occasions the user loaded a page from the website), causing a consistent increase in
visits to the website across the four weeks of the campaigns. We similarly find a statistically
significant but quantitatively smaller increase for cart-creators’ campaign as well (those who
exited the website after creating a cart). 5.43% more users visit the website in the four
4An alternative approach for an advertiser could be to conduct an experiment by randomizing the websitecookies. This is feasible because the advertiser can track cookie-level behavior on his/her portal. However,this is problematic because (a) cookies get deleted periodically causing the same person to get into multipleconditions, and (b) a large majority of consumers use multiple devices for their online activity making it hardto record their data. By contrast, the tracking by the advertising platform, in our case Google, mitigatesthese issues by stitching the identities of individuals across devices and over time through the informationabout logins of these consumers on Google services such as Gmail, Google Maps etc.
5See for instance https://www.thinkwithgoogle.com/research-studies/dfa-experiments.html, last accessedon September 26 2016.
6Johnson, Lewis, and Nubbemeyer (2015) also discusses this issue and proposes an alternative solutionthat can be implemented by advertising platforms.
5

subsequent weeks because of the experimental campaign. Therefore, we conclude that in
our setting retargeting does affect consumer behavior by increasing the likelihood of a user
returning to the website, and this effect exists across the two stages of the purchase process
we considered. Beyond engagement, our experiment is lower powered to detect effects on
bottom-line outcomes, given the complexity of the experimental design, and despite a large
sample size. Consequently, we do not detect any effect on such outcomes.
Next, we explore the impact of variation in temporal allocation of advertising. We find
that effect of advertising is larger when it is displayed closer to when the person exited the
advertiser’s website. In other words, advertising draws more users back to the website in the
initial weeks of the campaign. Consistent with this finding, advertising in the first week is the
most effective in increasing the user’s engagement in terms of visits to the website. Examining
the extreme, we find the effect of advertising exists even in the initial days of the campaign.
We do not find evidence for the marginal effect of advertising decreasing with increasing
frequency-caps, even though our estimates are effects of advertising on the margin, as users
see ads from many other non-experimental campaigns being run by BuildDirect during the
experimental time period.
Further, we also find clear evidence of complementarities in advertising over time.7 We
find that the effect of advertising in week 2 (the second week since the user entered the
experimental campaign) is higher when the user was allocated to non-zero frequency-cap
in week 1. Additionally, the effect of advertising in week 2 has a detectable impact only
if advertising in week 1 was turned on. Further inspection shows that the complementary
effect is driven by users who did not visit the advertiser’s website during week 1, even though
they were being advertised to in week 1. This finding of complementary effects is especially
telling because it is not predicted by the canonical mechanism of ads serving as reminders.
By that mechanism, advertising early-on makes future advertising less effective, which is
the opposite of our finding.8 From the advertiser’s perspective, this finding highlights the
importance of the temporal dimension in advertising strategy; not advertising early-on can
make later advertising effort ineffective. Overall, keeping advertising “on” at the highest
level has the highest impact on the likelihood of the individual coming back to the website.
Examining heterogeneity in our estimated effects, we find that the experimental advertising
is effective even among individuals who see high intensity of advertising from BuildDirect’s
non experimental campaigns.
Taken together, our findings provide significant insights about the mechanism through
7Consistent with the research on advertising-response curves (Villas-Boas (1993); Vakratsas, Feinberg,Bass, and Kalyanaram (2004); Sahni (2016)), we expected the complementarity to exist at early stages ofthe campaign.
8Standard memory-based models predicts the opposite of our finding. As memory from a past ad exposuredecays the reminder effect of an ad increases; the effect of an ad exposure is lowest when it occurs just afterthe previous one. For more discussion, see Sahni (2015), Janiszewski, Noel, and Sawyer (2003).
6
which the ad effects operate. First, we find that ads can drive consumers back to the
advertiser’s website even when the banners contain no new information. This finding suggests
that advertising does not necessarily need to contain new information, to be effective in
increasing website engagement. Second, an alternative mechanism is that even though ads
do not provide any new information, they serve as reminders to consumers who may have
forgotten about the products. Since consumers are more likely to forget the advertiser’s
products later in the campaign than early on, this mechanism would predict that the ads
have a higher effect later in the campaign. However, our data suggest the opposite. Ads
drive more people to the website when displayed earlier in the campaign. We find such effects
even in the initial days of the campaign. Importantly, we find evidence of complementarities,
which are not justified by the reminder mechanism. Lastly, we consider an alternative
mechanism which suggests that retargeted ads can displace other ads that compete for the
targeted individual’s attention, and can distract her by showing competing products in the
retargeter’s category, or products in other categories that she might get interested in. This
mechanism is analogous to the “poaching” mechanism considered by Sayedi, Jerath, and
Srinivasan (2014) and Desai, Shin, and Staelin (2014) in the context of sponsored search
advertising. The mechanism is well-suited to the competitive nature of our empirical setting,
and is consistent with our findings, including the dynamic effects we document.
Besides enhancing our understanding of how retargeting advertising works, and the un-
derlying mechanisms, our results have significance for advertisers who are interested in know-
ing whether such advertising works in the first place, given the selected nature of consumers
exposed to them. We provide a framework for experimentation to answer this question.
Specifically, we propose a low-cost solution to the problem of tracking activity for a control
group of users who see no advertising, without relying on collaboration with the advertising
platform to run the experiment. Our approach to looking at the question of the temporal
pattern of advertising that works best for advertisers is also of value to them. Specifically
for BuildDirect, the findings that retargeting advertising has a causal effect on visits, and
that high advertising early on complements later advertising, are interesting and useful in
optimizing their advertising strategy.
Our paper relates to a growing empirical literature studying online advertising. A number
of past studies have used detailed data on exposures and consumer actions to model the effect
of online advertising on consumer behavior ((Manchanda, Dube, Goh, and Chintagunta,
2006; Rutz and Bucklin, 2011; Jeziorski and Moorthy, 2014) are a few examples). Due to the
endogeneity and selection concerns inherent in such an approach, a relatively recent literature
has focused on obtaining causal estimates of the effects of online advertising using field
experiments (Sahni, 2015; Blake, Nosko, and Tadelis, 2014; Lewis and Reiley, 2014; Goldfarb
and Tucker, 2011b; Hoban and Bucklin, 2014; Kalyanam, McAteer, Marek, Hodges, and Lin,
7
2015) and quasi-experimental approaches (Narayanan and Kalyanam, 2015; Goldfarb and
Tucker, 2011a).
A few studies within this literature have investigated issues related to retargeting. Focus-
ing on the content of retargeted ad-banners, Lambrecht and Tucker (2013) find that a generic
banner works better than banners showing the specific product browsed by the individuals.
This effect reverses for individuals who are advanced in their product search. Along a similar
line of inquiry, Bleier and Eisenbeiss (2015) study the role of personalization of ad banners,
and find that banners more aligned with the products browsed by the user get clicked on
more often. This difference reduces as the time between the user’s last visit and the ad im-
pression increases. Compared to these studies about the content of retargeted banners, our
paper investigates different research questions of whether retargeted ads work (relative to
not advertising). In this respect, our paper relates more to Johnson, Lewis, and Nubbemeyer
(2015) who demonstrate an approach that tackles issues in measurement of advertising ef-
fects, and apply it to the context of retargeted advertising. They find significant positive
effects of retargeted ads on sales. However, they do not study the effects of frequency and
temporal variation, which is the focus of our study. In a recent study, Moriguchi, Xiong, and
Luo (2016) study the effects of retargeting at different stages of the purchase process of the
consumer, something that we also study.
Our paper also speaks to the frameworks used by practitioners in planning advertising
campaigns. Advertising plays a role in advancing the consumer along various stages of the
decision-making progress (Lavidge and Steiner (1961); Barry (1987); Vakratsas and Ambler
(1999) review work in this area). Tellis (2003) provides a comprehensive discussion of insights
from this literature. Within these frameworks, retargeting may be seen as advancing the
user from “awareness” to “interest” stage. Our paper contributes to this view by empirically
showing that retargeting does keep the user engaged with the advertiser, and providing an
explanation for why it might do so and how its efficacy can be improved.
An important aspect of our paper is that we study causal effects by explicitly creating
experimental variation in the frequency and timing of when ads are shown to the users,
similar in nature to Sahni (2015). A substantive difference between that paper and ours is
the different contexts of the two studies. While we focus on the effect of retargeted ads on
individuals who are aware of the advertiser and have visited its website, Sahni (2015) studies
a more standard setting in which users may not be aware of the advertiser and may not have
had any recent visits or other interactions on the advertiser’s website. Consequently, while
awareness and memory-related mechanisms may be operational in that setting, they may
not play a central role in our setting of retargeting. Therefore, our paper contributes to the
literature by showing the importance of advertising scheduling over time in a complementary
setting.
8
In the remainder of this paper, we first provide some background to retargeting in general,
and specifically to the context of our experiment in Section 2. Then in Section 3 we explain
the experimental design, focusing not just on the randomization strategy, but also on how
this was achieved practically in the context of highly automated advertising platforms. Next,
in Section 4 we report a series of randomization and manipulation checks that we ran to check
our implementation of the experiment. We describe the results of our experiment in Section
5 and discuss the implications of the findings in Section 6 , and conclude in Section 7.
2 Background
2.1 Retargeting
Retargeting refers to advertising targeted to customers based on their past actions at the
advertiser’s website. An example of a retargeting campaign is in Figure 1. In the top left
panel of the figure, a consumer visits the product page for a specific product at a retailer’s
website, and views related information, such as the product price, reviews etc. Then the
consumer navigates away from this page, and decides to visit a news webpage on the internet.
This action of visiting the product page and navigating away without making a purchase
triggers a retargeting campaign paid for by the retailer. Subsequently, if the consumer
browses a webpage that is a part of the the retargeting platform’s network, he/she might
see a retargeted ad showing the product she saw on the retailer’s website.9
A number of platforms that enable retargeting have emerged over the last few years. They
range from those run by large internet media firms such as Google, Facebook and Twitter,
to specialist companies such as Criteo. Google’s Doubleclick platform, which is used by
the retailer that we partner with for our experiment, tracks users through a combination
of cookies and Google user ids. A retargeting campaign on this platform is triggered by
a small piece of code that gets executed when the individual visits the retailer’s webpage.
This signals to Doubleclick that the consumer is to be included in the retargeting campaign,
and also provides the parameters for the campaign. The parameters include the duration of
the campaign, and the ceiling on the number of advertising impressions that the consumer
can see during any particular day. This latter parameter, the “frequency cap”, is the main
variable we vary in our experiment.
Estimates on the size of the retargeting industry vary due to the fact that many players
are either startups that do not report revenues, or large multi-product advertising firms
9This form of retargeting is also referred to as “site retargeting” (IndustryReport (2014)). Other less-common forms of retargeting have recently emerged. For example, “search retargeting” and “email retarget-ing” involve showing ads to individuals who searched for a specific product, or engaged with the advertiser’semail marketing campaign respectively.
9
such as Google, that do not report numbers separately by product. Nevertheless, it is well
accepted that the industry has grown over the last few years at a very rapid rate. For
instance, a recent industry study (AdRoll, 2014) finds that 71% of respondents in a 2014
survey of 1000 marketers in the US reported spending 10-50% of their advertising budget
on retargeting. This number was a significant increase from the 53% reported in 2013. The
proportion of marketers reporting spending over 50% on retargeting went up from 7% to
14%. One of the few firms in the industry that reported its results and derives most of its
revenues from retargeting is Criteo. The firm reported a 70% increase in its earnings in the
first quarter of 2015, with annual revenues in the year expected to cross $1 billion. With
Criteo being only one of several players in this market, including several large firms, the
retargeting market is expected to be several times this size.
Yet, there is a gap in our understanding of whether retargeting influences consumer
behavior, and if so, the mechanisms by which it works. Since retargeting shows advertising
to consumers who have already visited the website of the advertiser, there are concerns about
selection. For instance, it could be argued that consumers who have visited the website have
shown an interest in the website. Thus, some proportion of these consumers might return
to the advertiser’s website even in the absence of the retargeting campaign, and take further
action, including purchasing the product. On the other hand, it could also be argued that
some consumers who have visited and have left the advertiser’s website have shown their
disinterest in the advertiser’s product by their action of leaving it without creating a cart
or purchasing. In either instance, there is selection in the consumers who are part of the
retargeting campaign, and there could be spurious correlations between the serving of the
retargeting campaign and subsequent consumer actions such as purchase. It is typically hard
to think of exogenous instruments to allow for econometric correction of such selection. An
experiment is therefore the ideal way to recover causal estimates of the effects of retargeting.
2.2 Experimental Context
In this section we describe the BuildDirect.com website, and describe the observed activity
of its users. First, we give a brief description of the firm.10 Founded in 1999, BuildDirect is
an online marketplace for buying heavyweight home improvement products. The company
provides homeowners a wide choice of products in multiple categories such as wood flooring,
tile flooring, decking, outdoor living, building materials, landscaping, kitchen and bath and
vinyl flooring. Since the home-improvement category involves large purchases (average order
on the website is $1800) shopping cycles can be long. The company allows buyers to obtain
samples before making a purchase, so they can touch and feel products for color, texture
10Some of the material in this section is based on http://techcrunch.com/2016/02/10/builddirect-wants-to-become-the-amazon-of-the-home-improvement-industry-launches-marketplace/
10
and quality. The firm delivers these products directly to the consumer’s doorstep. Relative
to other online retailing platforms, BuildDirect is highly rated on websites providing seller
reviews.11
The BuildDirect.com website allows users to search for and buy products across multiple
home-improvement categories. Figure 2 shows the homepage of the website. It allows the
user to specify a product category for search, or search using text queries. On searching,
the consumer arrives at a search-results page, which looks like the example in Figure 3. A
user may browse various product options satisfying her search criteria. Users might face
significant uncertainty in purchasing the product online. Therefore, the website allows users
to order samples before making actual purchases. Figures 4 and 5 show examples of a
product-page and a checkout page respectively.
Advertising It is important to note that BuildDirect engages in marketing via several
channels, including email, search advertising and display advertising. It is a major ad-
vertiser in its category, with significant online advertising spends in the year 2014. Of this,
approximately $4 million were spent on retargeting, which it conducts on multiple platforms,
including DoubleClick, Criteo and Chango. Overall, BuildDirect’s advertising through var-
ious online channels is delivered with a high intensity – in our data on average 37% of the
impressions delivered occurred within a minute of another BuildDirect impression preceding
it, and 9% of the delivered ad impressions had at least one other BuildDirect banner on the
same webpage. Our experiment varies the DoubleClick campaign only. A user’s participation
in the rest of the campaigns is invariant across our experimental conditions.
Description of user behavior on BuildDirect.com
We describe the activity of 234,712 users observed in our data, identified by DoubleClick ids,
who had some interaction recorded in our data.12 Table 1 provides descriptive statistics of
users on the website. On average, a user interacts with the website for more than two days,
but there is large heterogeneity; many users interact with the website more often. These
interactions are spread over a large time interval. On average, the time interval between
the first and the last interaction is about 16 days. Among individuals that arrived on more
than one occasion, this number goes up to 35 days. During this time, users on average
browse about 25 product pages and 19 search pages. Since home improvement products are
expensive, complicated and not frequently purchased, these searches are likely to correspond
11For example, on resellerratings.com BuildDirect is rated 8.8, whereas HomeDepot is 1.0; Lowes’ 1.0;Amazon 4.2. On trustpilot.com BuildDirect is rated 6.3; HomeDepot is 2.6; Lowes’ is 5.1; Amazon is 7.7.We thank an anonymous reviewer for pointing us to this information.
12The Doubleclick id is a user-level identified provided by Google. It is a cookie-based id, but is muchmore persistent than a typical cookie because it is a network-wide cookie, as opposed to a website’s cookie.
11

to a single purchase occasion. Therefore, these statistics suggest that consumers in our
setting spend significant time deliberating on purchase and obtaining information from the
website.
Conversion from search to next steps in the purchase process is rare. About 13.5% of
individuals who search on the website eventually “create a cart”, which signifies their further
interest in the product. About 4% of users order a sample, and 0.4% order a product.13 Note
that the probability of creating a cart for users who clicked on a retargeted ad is significantly
higher than average by 50%; 20% of this selected set create a cart. These statistics indicate
a very significant and large correlation between clicks on retargeted ads and cart-creation
(p-val< 0.01). The rest of the statistics show that there is significant time-lag between the
users’ first interaction with the website and their conversion activity.
Competition in this category
BuildDirect faces considerable competition. The data we obtained through the DoubleClick
platform records activity on BuildDirect.com only. Therefore, to assess competition, we
bring to bear data from comScore MediaMetrix, that inform us about consumer activity
across competing retailers in the category. Table 2 shows that in the comScore sample, a
significant proportion of individuals who visited BuildDirect.com also visited a competitor’s
website during the month. If an individual visited BuildDirect.com, the chance of her visiting
HomeDepot.com is 50.5%, which is significantly higher than 13.6%, which is the probability of
an average person visiting that website. In this sense, competition from LumberLiquidators
is even higher. Moreover, spending on marketing and advertising including retargeting is
prevalent among the players in this category. In our investigation, all five of the competitors
we considered engaged in retargeting.
3 Experimental Design
In this section, we describe the randomized field experiment we conducted in partnership
with BuildDirect using the Google Doubleclick platform. 14
13These account for sales made through the online channel, which is significant for the website. Theremay be more sales occurring through offline channels, which we do not observe.
14Cookies are files stored by the website on the user’s computer and is often used to customize the user’sweb experience. Sign-in based authentication is a way of tracking consumers based on their login/usernameon a web site.
12
3.1 Experimental campaigns to randomize advertising levels
The retargeting platform allows the advertiser to set various parameters. One parameter is
the duration of the campaign. The campaigns in our experiment run for a total of 4 weeks,
unless terminated by a pre-defined action. In the case of a “product-viewers” campaign,
originally triggered by a product page view, a subsequent purchase or addition of the product
to a shopping cart on the website ends the campaign. A campaign triggered by the user
adding a product to the shopping-cart and leaving, which we refer to as “cart-creators”
campaign, runs similarly for 4 weeks unless terminated by the purchase of the product.
Within these four weeks, the platform allows the advertiser to set limits on the number
of ad impressions that are delivered to the consumer per day. This limit, referred to as
the frequency cap, remains fixed in our experiment for a period of a week, but can vary
experimentally across weeks. The actual volume of ads served to a consumer can, and is
likely to be less than this upper limit, based on the volume of browsing behavior of the
consumer on websites where the campaign is run and the degree of competitive advertising
activity.
Product-viewers campaign. The product-viewer campaign has three possible frequency
caps for a given consumer for a given week in the campaign. We term these levels as F0, F5
and F15. The condition F0 refers to a frequency cap of zero, i.e. the intent of serving no
impressions to the consumer from the campaign. The condition F5 has a frequency cap of
5 impressions per day, i.e. the intent of serving no greater than 5 impressions per day. The
condition F15 has a frequency cap of 15 impressions per day. The frequency cap can be one
of these three levels for each of the 4 weeks of the campaign. Thus, there are potentially
34 = 81 permutations of frequency caps over the 4 weeks of the campaign. Consumers are
randomly assigned to one of these 81 conditions at the time they trigger the campaign based
on a product page view. We chose to experiment with frequency-cap levels of 0, 5 and 15
because BuildDirect wanted to learn about the effects in this range.
Cart-creators campaign. We expected a smaller sample of individuals who enter this
campaign. Therefore, we implement fewer experimental conditions for the cart-creators
campaign. Specifically, this campaign has two possible levels of frequency-caps, F0 and F15.
The frequency caps can be one of these two levels across two time periods of two weeks each.
Therefore, we have four conditions in total (2 frequency caps × 2 time periods).
The entire sequence of frequency caps, and thus, the pattern of advertising over time is
assigned to the consumer randomly at the very first time the consumer enters the experimen-
tal campaign. This experimental design allows us to investigate the effects of retargeting, its
temporal patterns, across two different stages of the consumer’s purchase process - product
13
page view and cart creation. .
3.2 PSA “tag campaigns” to track users
The above described experimental campaigns alone would not provide us the data necessary
to conduct the analysis. This limitation arises because of the way advertising platforms
report data to the advertisers. For any individual user (tracked by the platform’s id, in our
case, DoubleClick id), the platform reports to the advertiser, the ads seen by the user, the
campaign to which the ad belongs, and the user’s activity including page visits and orders
made at the advertiser’s web site, after the first time the user is exposed to an ad. The
data include any user who saw at least one ad by the advertiser. Therefore, by design,
the platform does not report activity of individuals who did not see any ad. Hence, the
advertiser cannot compare the behavior of individuals in the treatment group with those of
the control group because the latter is not observed (the control group does not see any ad,
and is therefore, not tracked in the data).15
To overcome this issue, we designed a set of parallel campaigns, which we refer to as
“tag-campaigns”. The purpose of a tag-campaign is to record ids, and actions taken on
the advertiser’s website for all users (not just those who see at least one ad). The tag-
campaigns are implemented as follows. At the time the consumer triggers an experimental
retargeting campaign in any one of the experimental conditions, the consumer also triggers
a simultaneous and separate tag-campaign, that shows a single public service announcement
(PSA) ad banner, unrelated to the advertiser.16 We set the duration of this campaign to
be one day, and a frequency cap of 1 ad impression with a very high bid to ensure a high
probability that the ad is shown. All users who get tagged (i.e., get exposed to our PSA)
by the tag-campaign are a part of our experiment. Because they all saw an ad sponsored by
the advertiser (a PSA), their activity is tracked in the data.
A unique tag-campaign is set up corresponding to each of the experimental conditions
in our experiment. Therefore, we have 85 tag-campaigns in addition to the 85 experimental
15Consider the following example for clarity. Suppose an advertiser wants to learn the effect of advertisingon bringing people back to her website, and implements a simple experiment with two conditions – (a) atreatment condition that is included in an ad campaign, i.e., a bid is placed to show ads to users in thiscondition, and (b) a control condition that is excluded from the campaign, i.e., no bid is placed to show themads. Then, to evaluate the effects of advertising, she would need to compare the average probability of a userrevisiting the website in the treatment condition with the corresponding average in the control condition.Both these numbers are difficult to estimate given the data. For the control condition, this average is notestimable because the count of individuals who returned would not be known, because their actions are notreported. For the treatment condition, one can count the number of users returning. But one cannot countthe number of users who were allocated to this condition, because the count of users who did not get exposedto any ads is unknown (there are always such individuals in both conditions).
16The content of the ad-banner in the tag-campaign does not matter, as long as it is unrelated to theadvertiser’s category, and is the same across all experimental conditions.
14
retargeting campaigns (=81 product-viewers campaigns + 4 cart-creators campaigns). In
addition to making the post-experimental analysis feasible, as explained above, the tag-
campaign also provides a time stamp of when the consumer enters the experiment, which
can allow the advertiser to do a cohort-based analysis.
In our implementation, five of the 81 product-viewer retargeting campaigns suffered from
manual errors, likely due to the complexity of the design.17 Therefore, we omit these five
experimental conditions from our analysis. Hence, for our analysis we have 76 experimental
conditions, representing a variety of temporal patterns in the product-viewers campaigns,
and 4 experimental conditions in the cart-creators campaign.
For clarity, Figure 6 graphically shows an example sequence of events that take place
when a user enters our experiment. The top panel shows an example in which a user
exits the website after viewing a product page. The user gets randomly allocated to an
experimental retargeting campaign and a tag-campaign. The frequency-cap schedule the user
gets allocated to is F5, F0, F15, F0. Therefore, on the first day, she sees the PSA ad from
the tag campaign. Additionally, she gets exposed to the retargeted ad for BuildDirect.com.
The experimental retargeting campaign continues for four weeks, while the PSA campaign
ends in one day. The lower panel shows a different example. This user gets allocated to F0
in week 1. Therefore, the first day, she just sees a PSA ad (the same banner as the one seen
by the first consumer), but doesn’t see the experimental banner for BuildDirect during the
first week.
3.3 Implications of our experiment design
We assign individuals to different advertising policies, as opposed to varying ad impressions
directly. In this section we discuss this feature of our experiment design and its implications
for our analysis and inferences we can make from data.
3.3.1 Intent-to-treat: Varying Frequency-caps
Our experiment randomizes individuals into conditions with different schedules of frequency-
caps across weeks, thus it randomizes the intent to serve different schedules of ad impressions
instead of randomizing the actual schedule of impressions across individuals. For example,
by allocating individuals to a condition with a daily frequency-cap of zero in week 1 and
15 in week 2, we intend to increase advertising impressions in week 2 to up to 15 per day.
However, the actual ad impressions increase in week 2 might vary across individuals. In an
extreme case, a person who does not browse the internet in week 2 will see no increase in ad
17For example, the frequency caps were wrongly coded, or the id was wrongly typed. The specific conditionsommitted are (F0,F5,F0,F15); (F5,F0,F15,F0); (F5,F15,F0,F0); (F15,F5,F5,F5); (F5,F15,F15,F5).
15
impressions in that week, irrespective of experimental condition.
An experiment varying frequency-caps manipulates a lever that is directly under the
control of the advertiser. Therefore, such a design is well suited to evaluate advertising
policies. It provides a clear comparison of strategies an advertiser could follow by a simple
comparison of mean outcome metrics across experimental conditions, without making any
modeling assumptions. Importantly, our design is easy to implement for advertisers. Most
advertising platforms permit advertisers to set frequency caps for their campaigns.
Ideally, a researcher would want to study the effect of various schedules of ad impres-
sions by assigning different schedules of actual ad impressions, and not frequency-caps to
consumers and tracking their behavior. However, accomplishing this is difficult in general.
Indeed, the schedule of actual impressions delivered depends on the individuals’ own media
usage behavior, and therefore, is likely to be out of control of any researcher. In collabora-
tion with the ad-platform, one could take an alternative approach to design the experiment
– any time an individual arrives on the platform, whether the experimental ad is displayed is
determined randomly (e.g., the experimental design in Sahni (2015)). Consequently, the re-
searcher observes variation in the frequency and timing of ad impressions among individuals
who arrive on the platform a specific number of times. An advantage of this design is that
the researcher sees richer variation in frequency and spacing between actual impressions at
granular levels (across days and even minutes). In contrast, our design switches advertising
on and off across weeks only. However, since this alternative design spreads the sample
across numerous possible patterns, the number of individuals seeing any specific pattern
implementable by the advertiser may be small, leading to low power for statistical inference.
Further, given the typical level of control the advertiser has on retargeting platforms, im-
plementing a design that does random assignment every time a consumer is eligible to be
served an ad is not feasible.
Overall, our design enables a direct comparison of important advertising policies and
makes clear recommendations without having to make assumptions. Since the actual number
of impressions and their timing is not completely controled, one needs to conduct manipula-
tion checks to examine how the variation in frequency-caps actually varies impressions, and
then accordingly make inferences about the effects of advertising.
3.3.2 Learning about the underlying mechanism
In addition to the question of when retargeting works, we seek to learn about the deeper
mechanism that may be driving the effects. The main challenge in doing so is that we
observe only revealed behavior and not what users remember and non-behavioral reactions
to ads, as lab studies do. Therefore, we rely on comparing the observed advertising response
to the predictions made by different mechanisms driving advertising effects. In doing so,
16
several considerations arise because of the features of the experimental campaign, and the
fact that it is implemented on an external platform. For example, it is possible that the
experimental campaign competes with BuildDirect’s non-experimental campaign, leading to
displacement of impressions received from non-experimental campaigns. Additionally, the
advertising platform may systematically learn about consumer’s preferences and later week
impressions may be directed to ad-responsive individuals. Such possibilities could affect
how our experimental assignment affects the outcomes. Therefore, we consider them while
making inferences about mechanisms from the data analysis in section 6.1.
4 Data
Our experiment was launched in November 2014 with new consumers continuously entering
the experiment through their actions of browsing product pages in the relevant categories and
adding items to the shopping-carts and leaving the website. The advertising we experimented
with is generic in nature, showing a banner with the brand name of the advertiser displayed
prominently, and possibly one of the categories that triggered the campaign. Targeted
recommendations were not part of the experimental advertising campaign. An example
of the experimental ad banner is shown in Figure 7.
We have access to two sets of data for each consumer. The first set tracks the ad im-
pressions that the consumer receives from any of BuildDirect’s online advertising campaigns,
including our experimental retargeting campaign and non-experimental campaigns.18 It also
indicates the experimental condition the ads correspond to, along with timestamps of when
the ads were shown for our experimental retargeting conditions, and the PSA ads for the
tag-campaigns. The second set of data tracks the activity of the consumer on the advertiser’s
websites. Activities include page views on BuildDirect, creation of shopping carts, ordering
of products and free product-samples. The two sets of files are linked together through a
unique consumer id. Thus, we are able to track both, the advertising impressions served
to each consumer in the experiment over a period of time, and also their activities at the
advertiser’s website. The activities are tracked during the campaign period of 4 weeks, and
also after the campaign ends.
4.1 Randomization checks
The experimental design randomly assigns users to a treatment condition at the point of entry
into the experiment, i.e. when the user triggers a campaign. In this section, we conduct a
18Access to non-experimental campaign impressions is a unique aspect of our data and allows us to examinehow the experimental effects vary with non-experimental impressions.
17
series of randomization checks to verify that the users allocated to various conditions are
similar in terms of measures of user activity on the website for a period before the experiment
was run. Specifically, we were able to obtain activity information for the period between
April 2014 and July 2014.19 The checks test whether the mean consumer activity measures
for the pre-experiment period differed across the various experimental groups. Column (1) in
Table 3 reports the p-values from these tests for the product-viewers experimental conditions.
The combined bonferroni-adjusted p-value is 0.54, indicating the conditions are similar across
these dimensions including the number of visits to the website in the pre-experimental period,
the number of carts created, the number of orders placed, the number of free samples ordered,
and the number of days a user was active. Looking at individual p-values, we note that for
one measure – the number of samples ordered – the p-value is lower. This is possible by
chance, while testing multiple hypotheses. In our case it is likely to be driven by outlying
observations in one experimental condition. We test for this in two subsequent checks. First,
we consider the incidence (instead of the number of occurrences) of free samples ordered in
the pre-experimental period, and find that the difference turns out to be insignificant. In
a second check, we drop one condition which has outliers, and find that we cannot reject
the hypothesis that the conditions have equal mean values. Overall, these randomization
checks show that consumers in the different conditions are not systematically different in
terms of their baseline behaviors. We repeat these tests for the cart-creators retargeting
campaigns. Column (2) of Table 3 reports the corresponding p-values and shows that there
is no indication of significant difference between the various experimental conditions in the
means of the pre-experiment behaviors of consumers. In addition to using data from before
we started the experiment, we conducted similar tests on user behavior before he/she enters
the experiment (gets a PSA impression from the tag-campaign). These tests also show a
balance of individuals across experimental advertising levels. Details on these tests can be
seen in the accompanying web appendix.
Additionally, we use data on ad impressions received by the users during the pre-experimental
time to check whether the number of ads seen in the past is same across conditions. Among
the users in the product-viewers campaign, the average impressions prior to the experiment
is 6.06. The average does not vary significantly across conditions (p = 0.26). The cor-
responding average is 2.38 among users in the cart-creators campaign, and does not vary
significantly across conditions (p = 0.87). Figure 8 shows the distribution of the number of
impressions received by users in the product-viewer campaign during the pre-experimental
time period. For ease of presentation, the chart shows data on users who received at least
19Note that the experiment itself was run starting in November 2014, and between August 2014 and thestart of the experiment, some pilot experiments were conducted to test the implementation feasibility. Thus,this period between April 2014 and July 2014 allows us to conduct randomization checks without any riskof contamination due to the experiment itself, or the pilot experiments.
18
one impression. It shows the distribution separately across groups of users allocated to F0,
F5 or F15 in week 1. A visual inspection suggests that the distributions are similar. An
F-test indicates that the averages across the three groups are statistically indistinguishable
(p=0.56).
4.2 Manipulation checks
In this section, we analyze the data to examine how the intended variation in advertising
frequency translates into actual difference in advertising frequency and its temporal patterns.
We first check how the distribution of the number of impressions across individuals changes
with frequency caps. Figure 9 shows the empirical cumulative distribution function of the
number of impressions individuals assigned to different frequency-caps in week 1 receive
during that week. The shift in the distributions is evident. The curve corresponding to users
with F0 shows that a large majority of them saw no experimental ads, but there is a tail
in the distribution that sees positive number of impressions during the week.20, 21 However,
the curves corresponding to F5 anf F15 show that the probability of a user seeing no ads
is halved by the increase in frequency-caps. The distribution of ad impressions is highly
skewed – 25% of users of who are allocated to F15 get 76% of impressions, they see 1.13
million impressions with an average of 55 impressions per user in that week. Top 10% of
the users see an average of 77.7 impressions; some see more than 100 impressions. When the
frequency-cap is limited to 5, the right tail of the distribution gets shifted significantly. We
rarely observe a user in F5 seeing more than 40 impressions in the week.22
To illustrate how the temporal patterns in frequency caps get translated to the tempo-
ral variation in ad impressions, we pick specific experimental conditions and compare the
20The fact that users in F0 get a positive number of impressions can be caused by the various sources ofnoise. For example, it is possible that the PSA in the tag-campaign is delivered after a delay, causing ourestimated start of the campaign to differ from when the ad platform actually started it. It is also possiblethat the user revisited BuildDirect using a different device, causing BuildDirect to reassign him/her to adifferent condition (so the same DoubleClick id gets allocated to a different condition later). However, suchsources of noise in the data should not systematically differ across experimental conditions. Blake, Nosko,and Tadelis (2014) also see such discrepancy in actual versus intended impressions delivered in the contextof search advertising; positive ad-clicks occur even when ad-spend if intended to stop, ad-clicks graduallyincrease over days after advertising is intended to start.
21Reassignment to a different experimental condition occurred for 1.22% of users in our data. We includesuch users in our data to avoid biased estimates. The rationale is as follows. If ads make people come backto BuildDirect.com through a different device, then ad-responsive users in high-ad conditions are more likelyto revisit through a different device. If we drop these users from the analysis then we would be selectivelydropping ad-responsive users from high-ad conditions. Therefore, we kept such users and assign them tothe first condition they were allotted, which was random. This avoids any systematic selection, but mightintroduce noise and attenuate our estimated results.
22This unequal distribution of impressions is a general phenomenon, and not specific to our setting. Forexample, only 63% of users in Lewis and Reiley (2014) saw any impression over their campaign’s two weeks.In their campaign average daily impressions delivered are 1.78.
19
intended frequency-caps across weeks and the average of actual number of ad exposure re-
ceived by users in that condition. Figure 10 shows two such examples. The left panel shows
the condition with frequency-cap schedule of F0, F15, F15, F0. Consistent with this con-
figuration, average impressions seen by users in this condition increases after the first week,
and the impressions decrease significantly again in the fourth week, as expected because of
the experimental setting. The panel on the right in Figure 10 shows a different condition,
that sets the schedule of frequency-cap to F0, F5, F0, F5. As expected, the average of the
number of actual impressions alternates over weeks.
Next, Figure 11 illustrates the margin on which our experimental manipulation takes
place. Recall that BuildDirect engaged in other non-experimental advertising as well, during
the time of our experiment. The x-axis of the figure refers to the days since the user entered
the experiment (was tagged by the tag-campaign). The bars show the average number of
impressions per day for individuals in the control condition, that is, a frequency-cap of zero
throughout four weeks. Therefore, this tells us the number of impressions users received from
the campaigns outside of our experiment. Note that the size of the bars reduces over time,
indicating that the average number of impressions from the non-experimental ads decreases
rapidly over time. The green curve shows the average number of impressions per day received
by individuals who were allocated to the experimental condition of a frequency cap of five
throughout the four weeks. It shows that these individuals receive about one impression
more per day, relative to the individuals in the control condition. The red curve shows the
average number of impressions per day received by individuals who were allocated to the
experimental condition of a frequency cap of fifteen throughout the four weeks. It shows that
these individuals receive about two impressions more per day, relative to the individuals in
the control condition.
We examine whether there is significant interference between the experimental retarget-
ing campaign and other campaigns conducted by BuildDirect during our experimental time
period. This check is useful because it is possible that the individuals allocated to lower
frequency-cap in our experiment receive more impressions from the non-experimental cam-
paigns. In this situation we are likely to under-estimate the effect of increasing frequency-caps
– an advertiser with no other non-experimental advertising might see higher effects than what
we estimate. Therefore, we checked in the data for whether treatment and control groups get
different impressions from BuildDirect’s largest non-experimental campaign on Criteo. We
regressed total Criteo impressions delivered across four weeks on indicators of frequency caps
in different weeks. Table 4 shows the results. Overall, this regression is statistically insignifi-
cant (F-test, p=0.79), suggesting a limited interference between campaigns, if any. Users on
average receive 41 impressions from the non-experimental campaign, and this average does
not vary systematically across the experimentally allotted frequency-caps.
20
5 Empirical findings and implications
In this section, we describe the results of our analysis of the experimental data.
Dependent measures. Note that our experiment design bears several experimental con-
ditions. This feature is vital for our research objective of understanding the implications of
temporal patterns of advertising. Consequently, however, we have few individuals per exper-
imental condition. Specifically, we have 3092 users per condition, on average. Therefore, our
experiment has statistical power to find effects on visits, but not downstream variables such
as purchase. Therefore, in our analysis, we focus on visits and revisits to BuildDirect.com,
which relate to customer engagement with the website. This measure is considered important
by BuildDirect because it gives them another chance to sell to the user, and allows them to
display their own ads on BuildDirect.com. The measure is also significant to the advertising
industry in general (referred to as “view-through” in the industry). Other measures such
as creating carts and making purchases are rare occurrences in our data, and are harder to
study statistically given the sample sizes per condition achieved.23
5.1 Effect of retargeting ads
Before examining the effects of frequency and timing of ad exposures, we first investigate
whether the experimental retargeting campaign affects consumer behavior. We separately
analyze both the product-viewers and cart-creators campaigns.
5.1.1 Product viewers
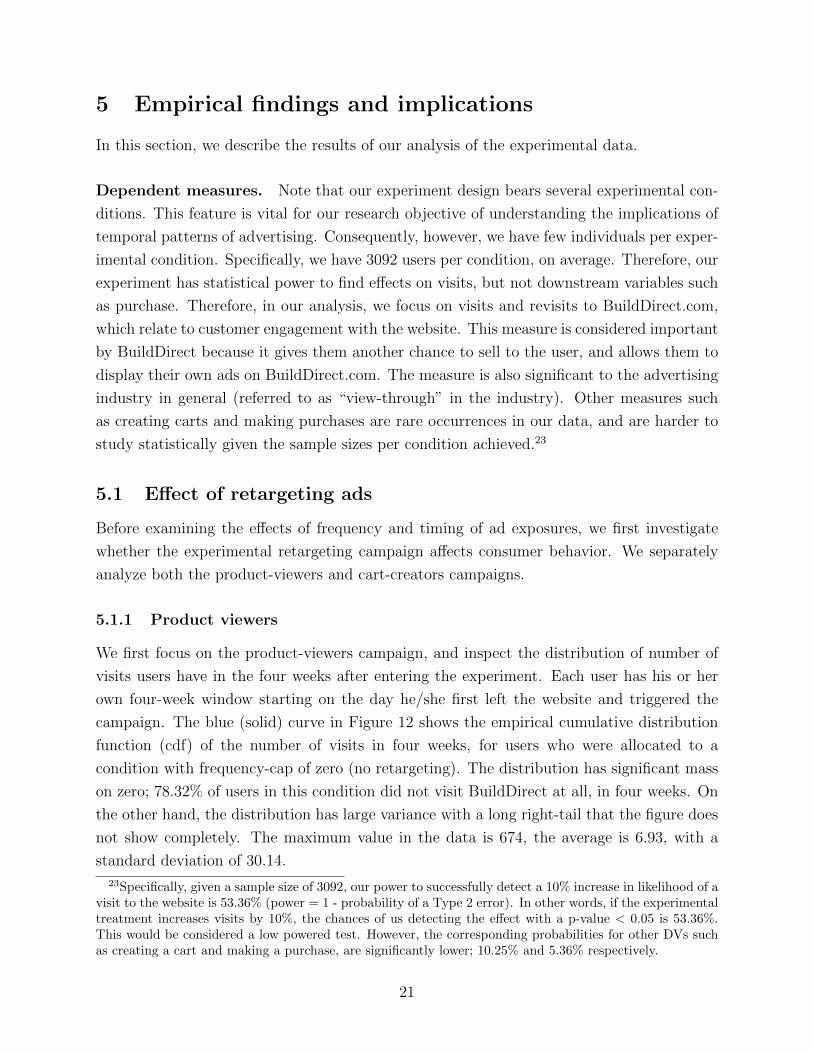
We first focus on the product-viewers campaign, and inspect the distribution of number of
visits users have in the four weeks after entering the experiment. Each user has his or her
own four-week window starting on the day he/she first left the website and triggered the
campaign. The blue (solid) curve in Figure 12 shows the empirical cumulative distribution
function (cdf) of the number of visits in four weeks, for users who were allocated to a
condition with frequency-cap of zero (no retargeting). The distribution has significant mass
on zero; 78.32% of users in this condition did not visit BuildDirect at all, in four weeks. On
the other hand, the distribution has large variance with a long right-tail that the figure does
not show completely. The maximum value in the data is 674, the average is 6.93, with a
standard deviation of 30.14.
23Specifically, given a sample size of 3092, our power to successfully detect a 10% increase in likelihood of avisit to the website is 53.36% (power = 1 - probability of a Type 2 error). In other words, if the experimentaltreatment increases visits by 10%, the chances of us detecting the effect with a p-value < 0.05 is 53.36%.This would be considered a low powered test. However, the corresponding probabilities for other DVs suchas creating a cart and making a purchase, are significantly lower; 10.25% and 5.36% respectively.
21
The red (dashed) curve in Figure 12 shows the empirical cumulative distribution function
(cdf) of the number of visits in four weeks, for users who were allocated to a condition with
frequency-cap of five or fifteen (retargeting switched on). The difference between the two
distributions is visible. In the condition with retargeting turned on, the curve is shifted
downward for lower values of the number of visits (and is visible up to 20). This shows that
the proportion of users who visit fewer times is lower in the condition with retargeting. This
indicates that retargeting causes users to visit the website more frequently. A Kolmogorov-
Smirnov test rejects the equality of distributions at 90% confidence level (p = 0.059).
Next, we examine the statistical and quantitative significance of the shift in the distribu-
tions. For this analysis we use OLS regressions, with robust standard errors, pooling data
from three conditions in which advertising frequency-cap remained constant, specifically, F0
throughout, or F5 throughout or F15 throughout. We first examine the effect on the exten-
sive margin, and check whether retargeting is able to get users who would have not visited
the website at all to visit. For this purpose, we regress an indicator of whether the user vis-
ited the website in the four weeks after entering the experiment, on an indicator of whether
the user is in a condition with experimental retargeting switched on. Column (1) of Table 5
shows results from this regression. The intercept indicates that 20.23% of users who exited
the website after viewing a product visited BuildDirect in the following four weeks when
experimental is switched off (frequency-cap is set to 0 for four weeks). The coefficient corre-
sponding to the indicator of advertising switched-on is positive and statistically significant,
indicating that 23.19% of users return to the website when the experimental advertising is
switched on. Quantitatively, it implies that 14.6% more users visit the website when ad-
vertising is turned on relative to when it is turned off. It is possible that users who come
back to the website because of retargeting are disinterested, and leave immediately without
engaging with it. To examine this behavior, column (2) of Table 5 changes the dependent
measure to an indicator of more than one visit. It shows that the probability of a user visiting
more than once also increases significantly. Columns (3) and (4) go beyond this level and
show that retargeting affects behavior beyond just bringing back users to the website with
sustained incremental increases across engagement levels. This analysis provides support to
the inferences we draw from visual inspection of the cdfs in Figure 12.
Effects beyond four weeks It is possible that retargeting leads to temporal substitu-
tion – users who visited within four weeks would have visited later, even in the absence
of advertising. To check for this phenomenon, we extend the time period covered by our
dependent measure from four weeks to eight weeks, and repeat the same analysis as above.
Table 6 shows the results from this analysis. The coefficient corresponding to the indicator
of advertising turned on is positive and significant in each of the four columns. The relative
22
percentage increases over the baseline condition are in the double digits and these increases
are sustained across all four columns indicating that magnitude of the retargeting impact
is consistent for deeper levels of engagement. The estimates do not change significantly,
compared to the corresponding column in Table 5. Therefore, we do not see evidence of re-
targeting merely shifting users engagement to the earlier time period. Our findings suggest
that retargeting drives 12.5% more users back to the website within two months.
5.1.2 Cart creators
We now focus on the users who entered our experimental cart-creators campaign after they
exited the website, abandoning a shopping cart without making a purchase. Compared to
the product-viewers campaign, these users are likely to be at a more advanced stage in
their decision-making process, and more likely to have chosen their retailer for purchase.
Therefore, whether retargeting still affects this group’s behavior is an empirical question.
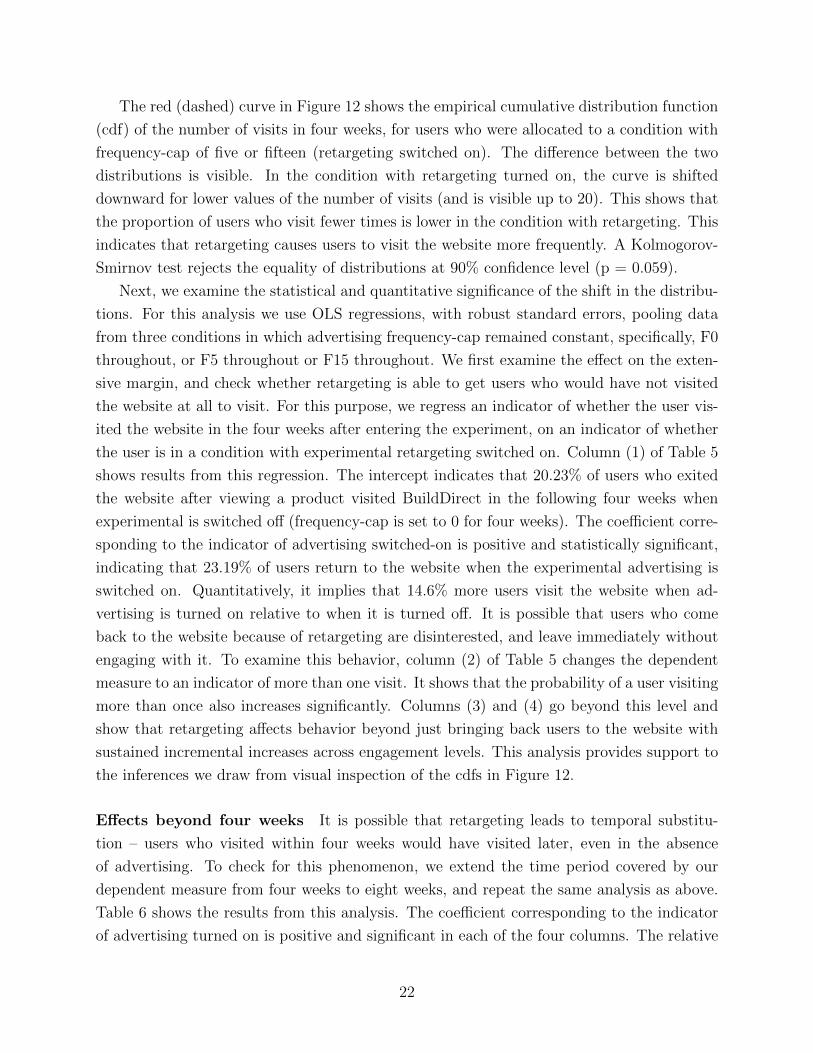
We repeat the sequence of analysis conducted earlier for product-viewers. First, we
visually inspect the cumulative distribution of the number of visits. The blue (solid) curve
in Figure 13 shows the empirical cdf for the number of visits by users who entered our
experiment but are allocated to a condition with a constant frequency-cap of zero over the
course of the campaign. As seen in the case of product-viewers, the distribution has a large
variance with a long right-tail. The red (dashed) curve shows the cdf for users who were
subjected to a constant frequency-cap of 15. As seen in the case of product-viewers, the cdf
corresponding to the users who are subjected to retargeting is shifted downwards. This shows
that the proportion of users who visit fewer times is lower in the condition with retargeting.
A Kolmogorov-Smirnov test of the equality of distributions rejects the hypothesis that the
distribution of number of visits remains unchanged because of advertising at 90% confidence
level (p = 0.096) .
Next we investigate the quantitative and statistical significance of the shift in distribu-
tions using OLS regressions.24 We regress an indicator of whether the user visits the website
in the four weeks after entering the experiment, on an indicator of whether the user got
allocated to an experimental condition with frequency-cap of 15 throughout the four weeks.
Column (1) of Table 7 shows the results of this regression. It shows that retargeting increases
the probability of a user, who exits after creating a cart, returning to the website within four
weeks from 37.51% to 39.55%, which is a 5.43% increase. This increase is statistically signif-
icant. The rest of the columns of the table show that the increase goes beyond just one visit
and the effect size does not appreciably diminish across the intensive margin. Therefore,
even for cart-creators, retargeting increases users’ engagement significantly. Table 8 repeats
24We estimate OLS with robust standard errors, pooling data from two conditions in which advertisingfrequency-cap remained constant, specifically, F0 throughout, or F15 throughout.
23
the analysis for visits in eight weeks instead of four, and finds similar positive and significant
effects. Hence we do not find evidence of retargeting merely shifting users engagement to
the earlier time period.
These findings show that our retargeting ads do affect consumer behavior. Significant
proportion of users, at both early and relatively advanced stages of purchase process, change
their behavior because of the ads. This is consequential for BuildDirect because a returning
consumer gives the marketplace another chance to sell its products, and also gain revenues
by showing relevant ads on it’s own website. These findings also raise questions about the
mechanism driving the effects, which we discuss in Section 6. In the remaining part of this
section, we leverage our experiment design to further describe when and how retargeting is
more effective.
5.2 Effects of timing and frequency of ads
In this section we examine the effects of frequency and timing of retargeting, leveraging
the variation our experiment creates along these two dimensions. Since our product-viewers
experiment is richer with scores of experimental conditions, we start by focusing on this
campaign.
5.2.1 Product viewers campaign
Week-by-week effect of advertising
We first understand how the effect of experimental advertising varies across the four weeks,
with the first week starting the day after the user enters the experiment. We conduct
this analysis by running four regressions one corresponding to each week. In each of the
regressions, the dependent measure is an indicator of whether the user visited the website
during that week. The explanatory variables are two indicator-variables – (1) whether the
user was allocated to F5 during that week, and (2) whether the user was allocated to F15
during that week. The condition in which the user is allocated to F0 serves as the baseline
(intercept). Therefore, the coefficients corresponding to the explanatory variables represent
the relative change in the probability of visiting the website in the week, relative to the F0
condition.
Table 9 shows the results from this analysis. Column (1) shows that setting the frequency-
cap of 5 or 15 both increase the likelihood of the user visiting the website in the first
week of the campaign relative to a frequency-cap of zero. The coefficient corresponding to
F15 is larger than the coefficient corresponding to F5 (p< 0.01), suggesting that increasing
advertising beyond F5 has an effect. Further, the change from F0 to F5 (= 0.0036, coefficient
of F5) is smaller but statistically indistinguishable from the change from F5 to F15 (=
24
0.0049, coefficient of F15 - coefficient of F5). This suggests that, despite the experimental
campaign being on the margin with other advertising going on, there is no evidence of the
effect of advertising vanishing at high frequency. Estimates in the other columns show the
corresponding estimates for the later weeks in the campaign. Comparing estimates across
columns we note the following. Firstly, advertising in each week affects the likelihood of
the user returning to the website in that week. Secondly, the effect is statistically more
significant, and quantitatively larger when the frequency-cap is set to 15, relative to 5. The
effect of a frequency-cap of 5 is statistically indistinguishable from zero for weeks 3 and 4.
Thirdly, the point estimates decrease across columns. While 0.85% of the users are affected
by F15 relative to F0 in week 1, 0.22% are affected in week 4. This suggests that more users
to change their behavior because of our experimental advertising in early weeks, closer to
when they first left BuildDirect, compared to later weeks. The estimated lift relative to the
baseline remains relatively stable, 5.9% for F15 and 2.4% for F5, on average over weeks.
Effect in the near future, within the first week
The above analysis shows that retargeting affects behavior even in week 1. How soon does
the effect start within the first week? To answer this question we compare day-by-day, the
fraction of users returning to the website in the conditions F5 or F15 with the same fraction
for users in F0. Figure 14 helps make this comparison. For any particular day (on the
x-axis), the red bar shows the fraction of users (in the F0 condition for week 1) who return
to the website by that day of week 1. The blue bar shows the same fraction for users in
a F5 or F15 condition for week 1. The difference shows the effect of the advertising up to
that day in the week. Visually, one can see that the difference between the bars starts to
appear in day 1, and increases over the days of the week. This suggests that the effect of
advertising starts on day 1. If this were not the case, and ads affected behavior after a few
days of hiatus, we would have seen no differences in the bars for the first few days. But the
data do not show this pattern.
To examine how the effect of advertising builds up to the total effect of advertising in
the week, Figure 15 (blue curve) plots the effect observed by the day as a fraction of the
total effect of advertising during the week. Specifically, we plot the ratio of the difference
between the blue and the red bars in Figure 14 and the difference between the blue and the
red bars in day 7. This number varies between 0 and 1. The plot shows that about 33% of
the total effect of increasing advertising in week 1 is realized by day 1. If retargeting did
not work immediately, but worked a few days after the consumer first leaves the website, we
would have found the number to be zero instead of 33%. If the effect was spread evenly over
the week, we would have found this number to be 14.2% (=1/7). However, the actual effect
is more than double this number. This finding indicates that even within the first week,
25
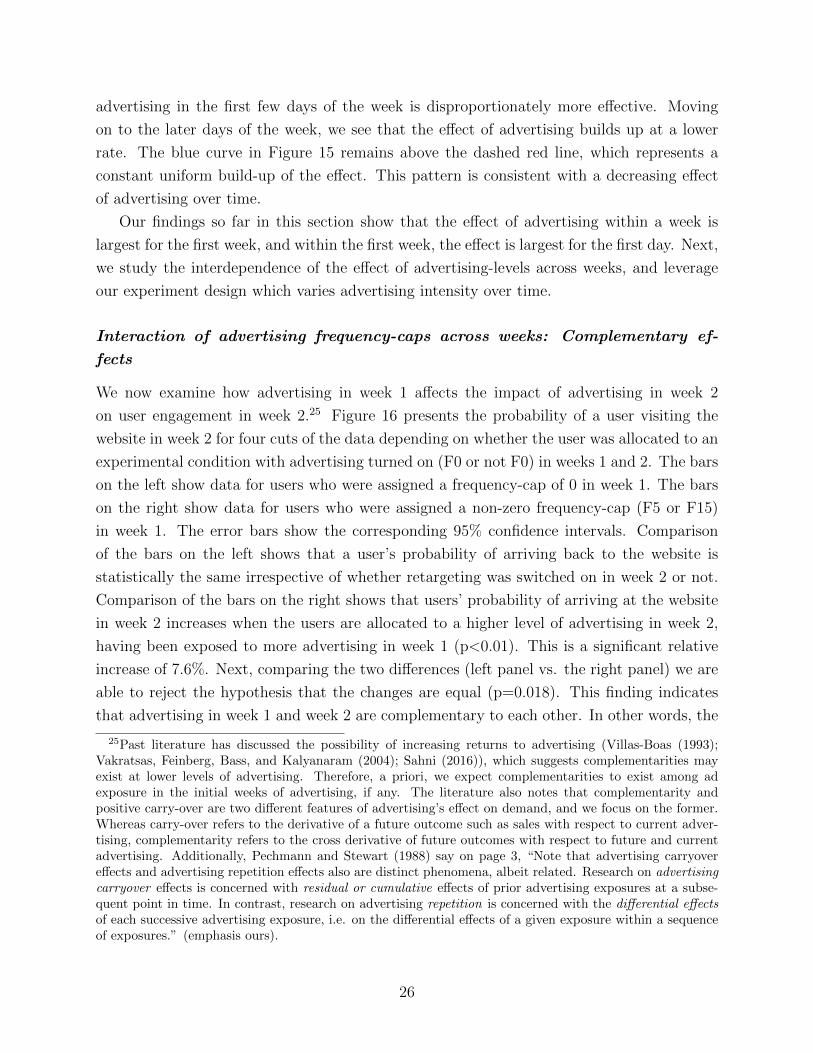
advertising in the first few days of the week is disproportionately more effective. Moving
on to the later days of the week, we see that the effect of advertising builds up at a lower
rate. The blue curve in Figure 15 remains above the dashed red line, which represents a
constant uniform build-up of the effect. This pattern is consistent with a decreasing effect
of advertising over time.
Our findings so far in this section show that the effect of advertising within a week is
largest for the first week, and within the first week, the effect is largest for the first day. Next,
we study the interdependence of the effect of advertising-levels across weeks, and leverage
our experiment design which varies advertising intensity over time.
Interaction of advertising frequency-caps across weeks: Complementary ef-
fects
We now examine how advertising in week 1 affects the impact of advertising in week 2
on user engagement in week 2.25 Figure 16 presents the probability of a user visiting the
website in week 2 for four cuts of the data depending on whether the user was allocated to an
experimental condition with advertising turned on (F0 or not F0) in weeks 1 and 2. The bars
on the left show data for users who were assigned a frequency-cap of 0 in week 1. The bars
on the right show data for users who were assigned a non-zero frequency-cap (F5 or F15)
in week 1. The error bars show the corresponding 95% confidence intervals. Comparison
of the bars on the left shows that a user’s probability of arriving back to the website is
statistically the same irrespective of whether retargeting was switched on in week 2 or not.
Comparison of the bars on the right shows that users’ probability of arriving at the website
in week 2 increases when the users are allocated to a higher level of advertising in week 2,
having been exposed to more advertising in week 1 (p<0.01). This is a significant relative
increase of 7.6%. Next, comparing the two differences (left panel vs. the right panel) we are
able to reject the hypothesis that the changes are equal (p=0.018). This finding indicates
that advertising in week 1 and week 2 are complementary to each other. In other words, the
25Past literature has discussed the possibility of increasing returns to advertising (Villas-Boas (1993);Vakratsas, Feinberg, Bass, and Kalyanaram (2004); Sahni (2016)), which suggests complementarities mayexist at lower levels of advertising. Therefore, a priori, we expect complementarities to exist among adexposure in the initial weeks of advertising, if any. The literature also notes that complementarity andpositive carry-over are two different features of advertising’s effect on demand, and we focus on the former.Whereas carry-over refers to the derivative of a future outcome such as sales with respect to current adver-tising, complementarity refers to the cross derivative of future outcomes with respect to future and currentadvertising. Additionally, Pechmann and Stewart (1988) say on page 3, “Note that advertising carryovereffects and advertising repetition effects also are distinct phenomena, albeit related. Research on advertisingcarryover effects is concerned with residual or cumulative effects of prior advertising exposures at a subse-quent point in time. In contrast, research on advertising repetition is concerned with the differential effectsof each successive advertising exposure, i.e. on the differential effects of a given exposure within a sequenceof exposures.” (emphasis ours).
26
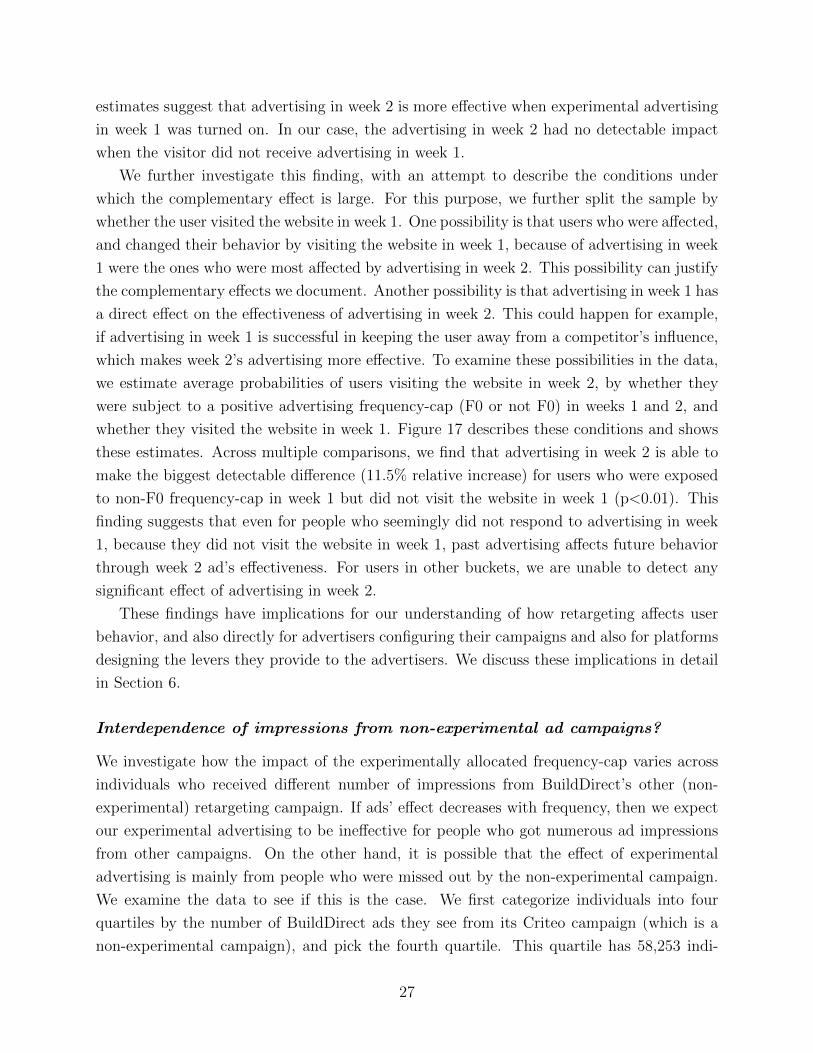
estimates suggest that advertising in week 2 is more effective when experimental advertising
in week 1 was turned on. In our case, the advertising in week 2 had no detectable impact
when the visitor did not receive advertising in week 1.
We further investigate this finding, with an attempt to describe the conditions under
which the complementary effect is large. For this purpose, we further split the sample by
whether the user visited the website in week 1. One possibility is that users who were affected,
and changed their behavior by visiting the website in week 1, because of advertising in week
1 were the ones who were most affected by advertising in week 2. This possibility can justify
the complementary effects we document. Another possibility is that advertising in week 1 has
a direct effect on the effectiveness of advertising in week 2. This could happen for example,
if advertising in week 1 is successful in keeping the user away from a competitor’s influence,
which makes week 2’s advertising more effective. To examine these possibilities in the data,
we estimate average probabilities of users visiting the website in week 2, by whether they
were subject to a positive advertising frequency-cap (F0 or not F0) in weeks 1 and 2, and
whether they visited the website in week 1. Figure 17 describes these conditions and shows
these estimates. Across multiple comparisons, we find that advertising in week 2 is able to
make the biggest detectable difference (11.5% relative increase) for users who were exposed
to non-F0 frequency-cap in week 1 but did not visit the website in week 1 (p<0.01). This
finding suggests that even for people who seemingly did not respond to advertising in week
1, because they did not visit the website in week 1, past advertising affects future behavior
through week 2 ad’s effectiveness. For users in other buckets, we are unable to detect any
significant effect of advertising in week 2.
These findings have implications for our understanding of how retargeting affects user
behavior, and also directly for advertisers configuring their campaigns and also for platforms
designing the levers they provide to the advertisers. We discuss these implications in detail
in Section 6.
Interdependence of impressions from non-experimental ad campaigns?
We investigate how the impact of the experimentally allocated frequency-cap varies across
individuals who received different number of impressions from BuildDirect’s other (non-
experimental) retargeting campaign. If ads’ effect decreases with frequency, then we expect
our experimental advertising to be ineffective for people who got numerous ad impressions
from other campaigns. On the other hand, it is possible that the effect of experimental
advertising is mainly from people who were missed out by the non-experimental campaign.
We examine the data to see if this is the case. We first categorize individuals into four
quartiles by the number of BuildDirect ads they see from its Criteo campaign (which is a
non-experimental campaign), and pick the fourth quartile. This quartile has 58,253 indi-
27
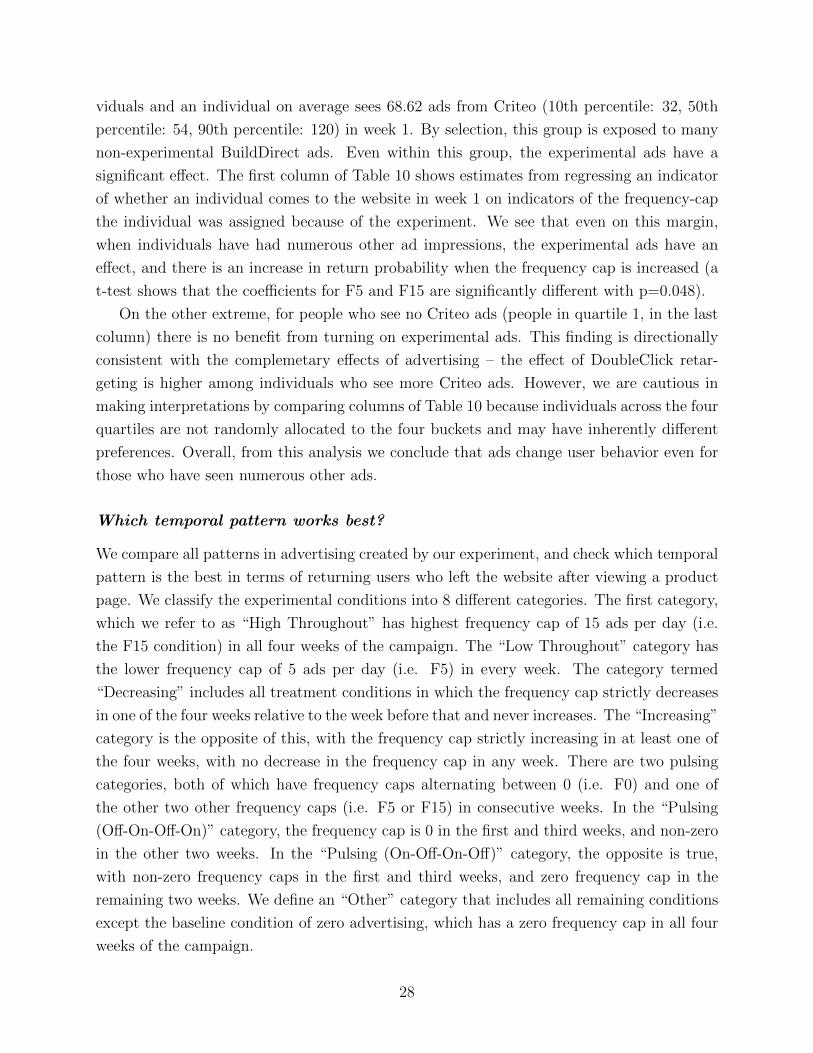
viduals and an individual on average sees 68.62 ads from Criteo (10th percentile: 32, 50th
percentile: 54, 90th percentile: 120) in week 1. By selection, this group is exposed to many
non-experimental BuildDirect ads. Even within this group, the experimental ads have a
significant effect. The first column of Table 10 shows estimates from regressing an indicator
of whether an individual comes to the website in week 1 on indicators of the frequency-cap
the individual was assigned because of the experiment. We see that even on this margin,
when individuals have had numerous other ad impressions, the experimental ads have an
effect, and there is an increase in return probability when the frequency cap is increased (a
t-test shows that the coefficients for F5 and F15 are significantly different with p=0.048).
On the other extreme, for people who see no Criteo ads (people in quartile 1, in the last
column) there is no benefit from turning on experimental ads. This finding is directionally
consistent with the complemetary effects of advertising – the effect of DoubleClick retar-
geting is higher among individuals who see more Criteo ads. However, we are cautious in
making interpretations by comparing columns of Table 10 because individuals across the four
quartiles are not randomly allocated to the four buckets and may have inherently different
preferences. Overall, from this analysis we conclude that ads change user behavior even for
those who have seen numerous other ads.
Which temporal pattern works best?
We compare all patterns in advertising created by our experiment, and check which temporal
pattern is the best in terms of returning users who left the website after viewing a product
page. We classify the experimental conditions into 8 different categories. The first category,
which we refer to as “High Throughout” has highest frequency cap of 15 ads per day (i.e.
the F15 condition) in all four weeks of the campaign. The “Low Throughout” category has
the lower frequency cap of 5 ads per day (i.e. F5) in every week. The category termed
“Decreasing” includes all treatment conditions in which the frequency cap strictly decreases
in one of the four weeks relative to the week before that and never increases. The “Increasing”
category is the opposite of this, with the frequency cap strictly increasing in at least one of
the four weeks, with no decrease in the frequency cap in any week. There are two pulsing
categories, both of which have frequency caps alternating between 0 (i.e. F0) and one of
the other two other frequency caps (i.e. F5 or F15) in consecutive weeks. In the “Pulsing
(Off-On-Off-On)” category, the frequency cap is 0 in the first and third weeks, and non-zero
in the other two weeks. In the “Pulsing (On-Off-On-Off)” category, the opposite is true,
with non-zero frequency caps in the first and third weeks, and zero frequency cap in the
remaining two weeks. We define an “Other” category that includes all remaining conditions
except the baseline condition of zero advertising, which has a zero frequency cap in all four
weeks of the campaign.
28
For this analysis we regress a 0/1 indicator of whether the user visited the website in the
four weeks (i.e., visited at least once in four weeks after leaving in the website once, which
triggered the retargeting campaign) on an indicator of the category in which the experimental
advertising pattern falls. Table 11 shows the estimated coefficients from this analysis. The
intercept represents the baseline condition in which the frequency-cap remained 0 throughout
the four weeks. The other coefficients show the change in the probability of a user visiting
relative to the baseline condition. The estimates show that the condition with constant high-
level (F15) of advertising has the highest effect. Next best, in terms of the point estimates,
is constant low level (F5) of advertising. Decreasing advertising levels over time also has
a detectable positive effect relative to constant frequency-cap of 0. Pulsing strategies –
alternating advertising between on and off – do not show a detectable effect. These patterns
are consistent with our previous findings. Advertising in the initial time period is important
in affecting consumer behavior.
5.2.2 Cart-creators campaign
Recall that in the case of the cart-creators campaign, we have only four treatment conditions
with two potential frequency caps in each week, a zero frequency F0 level, and a 15 ads per
day F15 level. To analyze the impact of these conditions, we regress an indicator of whether
a user returns to the website in the four weeks after first leaving having created a shopping
cart on indicators of the experimental condition the user was allocated to. Table 12 shows
the results of this regression. It shows that the condition in which advertising is turned on
throughout four weeks is the one that is statistically different from the one with all F0s. The
remaining two conditions, in which advertising is either in the first two weeks or last two
weeks, are not statistically distinguishable from the baseline.
The point estimates show that the condition with advertising on throughout is greater
than the sum of the other two coefficients. This is consistent with our earlier findings –
keeping advertising turned on throughout the four weeks has a higher effect than turning it
on in the first two weeks only plus turning it on in the second two weeks only. However,
these coefficients are too imprecisely estimated for the difference to be statistically significant
(p=0.54). Therefore, even though the observed pattern is not as strong for cart-creators as
it was for product-viewers, we infer that our findings from the cart-creator campaign is
consistent with the view that retargeting affects consumer behavior when it is turned on
throughout.
29
6 Mechanism Causing the Effects
6.1 Inference about the Mechanisms
Our empirical findings are inconsistent with the standard view about advertising, that it
functions by providing information to consumers or serves as a reminder. (1) The campaign is
targeted to consumers who have already been to BuildDirect’s website, and our experimental
ad banner, which is quite generic, is not likely to provide the consumers with any new
information unknown to them at the time of the exposure. (2) Retargeting has the highest
effect in the very beginning of the campaign, when the consumer is less likely to have forgotten
about the advertiser. (3) Increasing the daily frequency-cap beyond 5, which increases the
frequency of impressions to individuals (not the incidence of the first impression), has an
effect on consumer behavior. (4) There is evidence for positive complementarity between
advertising at different points of time, and the effects being significant for individuals who
saw scores of impressions from other campaigns is contrary to the prediction for informative
or reminder effects. This finding goes against an informative or a reminder mechanism most
conspicuously. After seeing BuildDirect’s ads the number of people needing a reminder only
decreases, reducing the potential impact of the subsequent ad impressions, which is contrary
to what we find. We discuss several alternative mechanisms below.
Users forgetting within a day Given the amount of information and the clutter involved
in online shopping, it is possible that consumers who are aware of the advertiser at one point
forget within a day and need to be reminded of the option. This possibility can lead to
advertising being an effective reminder even a day after the experiment starts. However, this
possibility does not explain findings (3) and (4) listed above. It is unlikely that more than
5 impressions per day are needed to remind people of BuildDirect. However, our finding (3)
shows that increasing impressions above 5 impressions does have an effect. Further, if people
forget and get reminded of BuildDirect by advertising in week 1, the impact of advertising in
week 2 would only decrease because of advertising in week 1. Finding (4) shows the opposite.
Users exiting the market Another possibility is that some consumers lose interest in the
advertiser over time, due to exogenous reasons, and ads serve as reminders to the rest. For
example, it is possible that a segment of the market choose the website from which they plan
to buy in week 1. This segment then does not respond to advertising in week 2 because their
decision of who to buy from is already made. The remaining population responds to ads
because the ads remind them of BuildDirect. Clearly, this phenomenon can cause advertising
effects to decrease over time even when the underlying mechanism is based on informative
or reminder effects. However, such a phenomenon cannot explain findings (3) and (4) above.
30

If the reduced advertising effect over time were a result of people losing interest over time,
we would expect the higher frequency of advertising, which presumably takes more time
than lower frequency, to have a lower effect. We find the opposite in finding (3). Second,
this phenomenon cannot explain the complementarity of advertising in weeks 1 and 2, that
we document in finding (4) above. Additionally, we do not expect this phenomenon to be
significant because average search spell is long (more than a month) in this context.
Ad-responsive individuals exiting over time Another possibility is that individuals
more sensitive to ads respond to advertising in the initial days and exit the campaign after
creating a cart. This could reduce the effect of advertising as time passes. However, we do
not find any significant effect of advertising in week 1 on the likelihood of creating a cart,
which is consistent with our expectation that individuals affected by advertising may not
buy immediately. Further, even if this possibility occurs, it would predict the opposite of our
finding (4). If advertising in week 1 makes ad-responsive individuals create a cart and select
out of receiving future ad impressions, then week 1 advertising should reduce the efficacy
of advertising in week 2, which is the opposite of our finding of complementarity between
advertising in weeks 1 and 2.
Implications of advertising campaign execution Can the optimizing actions of the
advertising platform create the observed data patterns even when ads have no effect or have
a solely informative effect? This is unlikely. Advertising platforms are known to optimize by
being able to predict consumers’ responsiveness to advertising. It is possible that over time,
this predictive ability improves and the platforms concentrate impressions on individuals
who are more likely to respond to ads. However, this would predict the effect of advertising
to increase over time, which is contrary to what we observe. Another related possibility is
that the platform learns about the campaign in an initial period (say, a week) and improves
its effectiveness. This possibility predicts that the effectiveness of a campaign increases
over time. However, we find that the effects of advertising are very stable across different
time periods of the campaign. For example, if we divide the sample into four equal parts
depending on the date when the user entered the experiment, we find that the effect of
switching-on advertising on the user returning to the website across the four subsamples is
very similar (cannot reject the hypothesis that the estimates are equal, for product-viewers
p=0.59).
One may also be concerned about the experimental campaign displacing impressions
BuildDirect delivers through other campaigns that are not a part of our experiment. Any
systematic pattern in this displacement (e.g., it occurs more in some weeks and less in
others) should be taken into account in inferring the mechanism. However, this phenomenon
31
is unlikely to be make a difference in our case because such displacement is insignificant, as
discussed in section 4.2.
6.2 Suggested mechanism
Our findings are consistent with an “attention hoarding” or a “competition-blocking” role of
advertising. The following example illustrates how this mechanism can operate. A consumer
browses hardwood flooring products on BuildDirect.com and exits. Then she visits a website
that discusses tips on installing hardwood floors.26 Since browsers of this website are likely
to be interested in hardwood flooring products, BuildDirect’s competitors in the category
are likely to show display ads on this website. When the individual is not retargeted by
BuildDirect’s campaign, she becomes aware (or gets reminded) of a competitor on seeing
its display ad on the discussion website. When BuildDirect retargets her, the retargeting
platform follows her to the discussion website and displaces the competitor’s ad. In such
situations retargeted ads may benefit BuildDirect even when the consumer remembers it and
is well aware of it. Even if the ad does not provide the consumer with any new information,
or remind her of information she may have forgotten, displaying it increases the chances of
the consumer coming back to BuildDirect. Section C of the accompanying web appendix
shows that this mechanism is plausible using screenshots of actual searches. Note that the
existence of this mechanism does not rely on the advertiser being strategic in blocking other
ads. Rather, this mechanism can result from the fact that individuals might visit websites
on which competitors advertise and retargeting campaigns driven by machine algorithms are
aggressive in following individuals to such websites.
In addition to displacing directly competing ads, as in the above example, retargeting
may also work by displacing ads that compete with the retargeter for consumer’s attention,
more generally. For example, a consumer may see Lowe’s ad for power-tools after exiting
BuildDirect.com if she is not retargeted. Such an ad can (1) distract her away from buying
hardwood flooring and toward other products she might need; (2) remind her of Lowe’s and
lead to her searching for hardwood floors on Lowe’s or other retailers.
Our findings are consistent with these mechanisms. If consumers are more likely to be
exposed to competitor’s ads in the initial weeks, possibly because consumers are more likely
to engage in related search initially, then there would be more opportunities to displace
competing ads initially. Therefore, this mechanism is consistent with advertising in initial
weeks having a higher effect. Since increasing the frequency of advertising also increases the
opportunity to displace competitors, this mechanism explains the positive effect of frequency
of advertising. This mechanism can also explain the complementarity of the advertising
26Examining the comScore mediametrix data we find that 16% of the individuals who visit builddirect.comalso visit diynetwork.com – a popular website on do-it-yourself projects – during the same month.
32

across weeks 1 and 2. Advertising in week 1 successfully blocks some consumers from seeing
the competitor’s ads, which makes it likely that they respond to BuildDirect’s ads in the
second week. The latter could be caused by several reasons. For example, it is possible that
blocking competitor’s ads in week 1 makes it more likely that the consumer did not explore
the competitor’s product and is still considering BuildDirect in week 2. If a consumer does
not visit a competitor’s website, she is also unlikely to get enrolled into the competitor’s
retargeting campaign, creating less competition for advertising in week 2.27 In other words
advertising, by blocking competitors makes the consumer still accessible to BuildDirect.
Note that the competition-blocking mechanism also justifies the observed advertising
behavior whereby the advertiser displays the same banner at multiple spots on the same
page, as shown in figure 18. By this mechanism, the advertiser has the incentive to occupy
any advertising slot on which a competitor may potentially advertise and steal a customer.
Optimal response to the informative mechanism would be to spread the impressions across
pages rather than within the same page because the second impression is more likely to have
an incremental affect at a different point in time.
Note that while our evidence is indicative of an attention hoarding or a competition
blocking mechanism, we cannot conclusively test for it. A conclusive test for a blocking
mechanism would require a more complex experiment than ours. To test this mechanism we
would have to show that effective ads of a competitor are being blocked by the focal firm’s
ads. So it will have to be designed with collaboration of two competitors or the advertising
platform, which is beyond the scope of our paper.
One concern about aggressive advertising tools such as retargeting is that the high fre-
quency of advertising can annoy consumers, consequently, having a significant negative im-
pact on the consumer’s affinity toward the advertiser. We do not find evidence for this phe-
nomenon. First, we find significant positive effects of our experimental advertising, which
occurs in addition to numerous other ads seen by the users. Second, within our experimental
variation, we find that the marginal effect of a higher frequency-cap (F15 vs. F5) is not lower
than the lower frequency cap (F5 vs. F0). These findings show no evidence of negative effect
or even diminishing effect of advertising.
6.3 Implications for advertisers
Our paper has several implications for managers. First, we show that retargeting with a
simple generic creative has a causal effect on consumer behavior and it attracts users back
to the advertiser. These effects exist for users at early, or later stage of their decision-making
27Consistent with this conception, we observe that users who received a positive frequency cap in week 1received 5% more impressions from BuildDirect in week 2, on average, relative to those that got F0 in week1.
33
process. This finding is useful for managers who are considering engaging in retargeting and
worry about the selection problems in comparing the behavior of individuals who get retar-
geted advertising with those that do not in the absence of an experiment. We demonstrate
a novel technique that uses a PSA campaign to tag the experimental groups and makes it
possible to estimate the causal effects of online advertising. This technique provides a way
for the advertiser to gauge the impact of ad spending independently, without relying on
cooperation of the ad-platform. Using this technique we demonstrate that the effectiveness
can be misjudged in the absence of an experiment. For example, comparing the return prob-
abilities in the condition with advertising turned on (F15), one can see that cart abandoners
are more likely to return (39.4% in the first week), compared to product viewers (20.23%).
In the absence of a control group, a simple correlational analysis would say that retargeting
is more effective for cart-abandoners, whereas our experiment shows that it affects product
viewers more. Second, we find that retargeting increases users’ engagement at both the ex-
tensive and intensive margin. This is a novel finding that alerts managers to study not just
advertising’s effect on visits but also the quality of visits – perhaps an important outcome
metric. Third, the effect of retargeting starts immediately – within a day of the user leaving
the website. Using a “lorenz” curve (or concentration curve) analysis we find that about 50%
of the total effect of advertising in the first week occurs within the first two days, even in a
category like ours which has a large consideration time-window. These findings emphasize
the role of immediacy in retargeting campaigns, for which we are the first to provide rigorous
empirical support, to the best of our knowledge. Of course, the concentration of the effects
might vary across settings. We suggest managers estimate a lorenz-curve like ours to gauge
their campaigns. Managers can also calculate “half heavy statistics” such as the number of
days it takes to accumulate a target % impact of advertising. This information can be used
to make inter-temporal adjustment to bids. Our study provides an experimental approach
to measure the duration of impact. The estimated duration of impact can help managers set
an appropriate “look back” or “view through” window, which is the time period in which
the impact of the campaign is measured.
Fourth, the finding of complementarity of advertising over time has a direct implication
for managers. It suggests that the advertising plan needs to be set at the individual-level,
as opposed to an aggregate level. For example, an advertiser may specify an aggregate plan
buying 100 million impressions over a period of 10 days, with a frequency-cap of 10 per day. In
execution of this plan, it is possible that the advertiser reaches 100 million individuals serving
one impression to each of them, or 10 million individuals, and serving them 10 impressions
on one day. Both these executions would be suboptimal if there are complementarities over
time, as we find. The ideal situation might be specifying the number of individuals and
a schedule of frequency-caps for 10 days, so that each individual is served ads on multiple
34
days. Lastly, it might be important for managers to pay attention to competition. Our
perception is that advertisers appreciate the impact of competitors in the context of search
engine advertising. Perhaps competition is more salient when the ads of competitors are
ranked on a search page, and search engines such as Google provide proxy information for
competition such as average position in a campaign. In the context of retargeting or display
advertising competition is less salient. This is likely because the set of competitors considered
by a consumer is not directly observed. However, our proposed mechanism suggests that
competition might play an important role in determining the effectiveness of retargeted
advertising. In situations where there is little competition, the benefits from blocking other
advertisers might be minimal, potentially reducing the efficacy of advertising.
7 Conclusion
In the last few years retargeting has emerged as an important advertising channel, adopted
by majority of online advertisers. Retargeting is a unique form of advertising because, by
design, its target consumer is aware of the advertised product. For these reasons, retarget-
ing is an important topic for research. This paper attempts to answer some fundamental
questions about retargeting — whether, and how it affects consumer behavior. Examination
of this question using observational data is fraught with concerns about causal inference due
to selection of consumers who see such advertising. Strong correlations between exposure
to retargeting advertising and subsequent behavior are not necessarily causal because the
targeted nature of this advertising implies that advertising exposures are delivered to indi-
viduals who have a high propensity to purchase in any case. Our experimental design is one
of the first attempts in the experimental literature to get to the causal effect of retargeting
ad exposures (relative to no exposure), and examining the role of shifting ad exposures over
time. We do not limit ourselves to the overall, highly relevant question of whether retarget-
ing works. We ask how patterns of retargeting work, and using this, we throw light on the
mechanisms by which retargeting might work.
Our data show that retargeting does affect consumer engagement – it increases the like-
lihood of the users returning to the website and also engaging more by visiting the website
more frequently (section 5.1). The effect of retargeting starts immediately, and is the high-
est in the first week after the consumer first left the website. Further, there is evidence of
complementarity – advertising in week 2 has a larger effect on consumer behavior if they
were subject to advertising in week 1. These findings are consistent with a defensive role of
retargeting in which it serves the purpose of hoarding attention or blocking competitors in a
competitive market. Our findings have clear implications for advertisers. They suggest that
advertising initially may be important, even though the advertised product is likely to be
35

more salient in the consumer’s mind during this time. If a user is not advertised to in the
first week, advertising later might not be effective.
We also demonstrate a method to execute advertising experiments using tag-campaigns
which an advertiser can implement without requiring an elaborate collaboration with the
ad platform. Our estimate of the cost of executing the tag campaign for our experiment is
$1,856. For a simpler experiment that aims to just test whether advertising causes users to
return to the advertiser’s website (i.e. conduct our test in Table 5) would require significantly
fewer observations and can be conducted at a substantially lower cost.
One limitation of the current analysis in the paper is that outcomes are limited to online
behavior of user engagement such as visits, rather than purchases. This is a tradeoff we
had to undertake. The number of experimental conditions required to address our research
question reduces the sample-size per condition, and therefore reduces our statistical power
required to study other measures. Another limitation is that our experiment was limited
to the advertising the firm does on one (DoubleClick) platform. Simultaneously, the firm
was advertising on other retargeting platforms as well (notably, Criteo). Therefore, our
control group did not receive zero exposure to retargeting. Thus, we measure the effects of
retargeting at the margin, over and above the effects of such other advertising. In future
experiments, we hope to obtain a better understanding of retargeting at lower frequencies.
36

References
AdRoll (2014): “State of the Industry: A Close Look at Retargeting and the Programmatic
Marketer,” .
Barry, T. E. (1987): “The development of the hierarchy of effects: An historical perspec-
tive,” Current issues and Research in Advertising, 10(1-2), 251–295.
Blake, T., C. Nosko, and S. Tadelis (2014): “Consumer Heterogeneity and Paid Search
Effectiveness: A Large Scale Field Experiment,” Econometrica (forthcoming).
Bleier, A., and M. Eisenbeiss (2015): “Personalized online advertising effectiveness:
The interplay of what, when, and where,” Marketing Science, 34(5), 669–688.
Desai, P. S., W. Shin, and R. Staelin (2014): “The company that you keep: when to
buy a competitor’s keyword,” Marketing Science, 33(4), 485–508.
Goldfarb, A., and C. Tucker (2011a): “Advertising bans and the substitutability of
online and offline advertising,” Journal of Marketing Research, 48(2), 207–227.
(2011b): “Online display advertising: Targeting and obtrusiveness,” Marketing
Science, 30(3), 389–404.
Helft, M., and T. Vega (2010): “Retargeting Ads Follow Surfers to Other Sites,” The
New York Times.
Hoban, P. R., and R. E. Bucklin (2014): “Effects of Internet Display Advertising in the
Purchase Funnel: Model-Based Insights from a Randomized Field Experiment,” Journal
of Marketing Research (forthcoming).
IndustryReport (2014): “State of the Industry Retargeting Report,” Discussion paper.
Janiszewski, C., H. Noel, and A. G. Sawyer (2003): “A meta-analysis of the spacing
effect in verbal learning: Implications for research on advertising repetition and consumer
memory,” Journal of consumer research, 30(1), 138–149.
Jeziorski, P., and S. Moorthy (2014): “Advertiser Prominence Effects in Search Ad-
vertising,” Working Paper, University of California, Berkeley.
Johnson, G. A., R. A. Lewis, and E. I. Nubbemeyer (2015): “Ghost Ads: Improving
the Economics of Measuring Ad Effectiveness,” Working Paper, University of Rochester.
37
Kalyanam, K., J. McAteer, J. Marek, J. Hodges, and L. Lin (2015): “Cross
channel effects of search engine advertising on brick and mortar retail sales: Insights from
multiple large scale field experiments on google.com,” Discussion paper, Working Paper,
Santa Clara University.
Lambrecht, A., and C. Tucker (2013): “When Does Retargeting Work? Information
Specificity in Online Advertising,” Journal of Marketing Research, 50(5), 561–576.
Lavidge, R., and G. A. Steiner (1961): “A model for predictive measurements of ad-
vertising effectivness,” Journal of Marketing, 25, 59–62.
Lewis, R. A., and D. H. Reiley (2014): “Online ads and offline sales: measuring the
effect of retail advertising via a controlled experiment on Yahoo!,” Quantitative Marketing
and Economics, 12(3), 235–266.
Manchanda, P., J.-P. Dube, K. Y. Goh, and P. K. Chintagunta (2006): “The
Effect of Banner Advertising on Internet Purchasing,” Journal of Marketing Research,
43(1), 98–108.
Moriguchi, T., G. Xiong, and X. Luo (2016): “Retargeting Ads in the Upper and
Lower Purchase Funnel: Online Field Experiments,” Working Paper, Waseda University.
Narayanan, S., and K. Kalyanam (2015): “Position Effects in Search Advertising and
their Moderators: A Regression Discontinuity Approach,” Marketing Science, 34(3), 388–
407.
Nelson, P. (1974): “Advertising as Information,” Journal of Political Economy, 82(4),
729–754.
Pechmann, C., and D. W. Stewart (1988): “Advertising repetition: A critical review
of wearin and wearout,” Current issues and research in advertising, 11(1-2), 285–329.
Rutz, O. J., and R. E. Bucklin (2011): “From Generic to Branded: A Model of Spillover
in Paid Search Advertising,” Journal of Marketing Research, 48(1), 87–102.
Sahni, N. S. (2015): “Effect of temporal spacing between advertising exposures: Evidence
from online field experiments,” Quantitative Marketing and Economics, 13(3), 203–247.
Sahni, N. S. (2016): “Advertising spillovers: evidence from online field-experiments and
implications for returns on advertising,” Journal of Marketing Research.
38
Sayedi, A., K. Jerath, and K. Srinivasan (2014): “Competitive poaching in sponsored
search advertising and its strategic impact on traditional advertising,” Marketing Science,
33(4), 586–608.
Tellis, G. J. (2003): Effective advertising: Understanding when, how, and why advertising
works. Sage.
Vakratsas, D., and T. Ambler (1999): “How advertising works: what do we really
know?,” The Journal of Marketing, pp. 26–43.
Vakratsas, D., F. M. Feinberg, F. M. Bass, and G. Kalyanaram (2004): “The
shape of advertising response functions revisited: A model of dynamic probabilistic thresh-
olds,” Marketing Science, 23(1), 109–119.
Villas-Boas, J. M. (1993): “Predicting advertising pulsing policies in an oligopoly: A
model and empirical test,” Marketing Science, 12(1), 88–102.
39
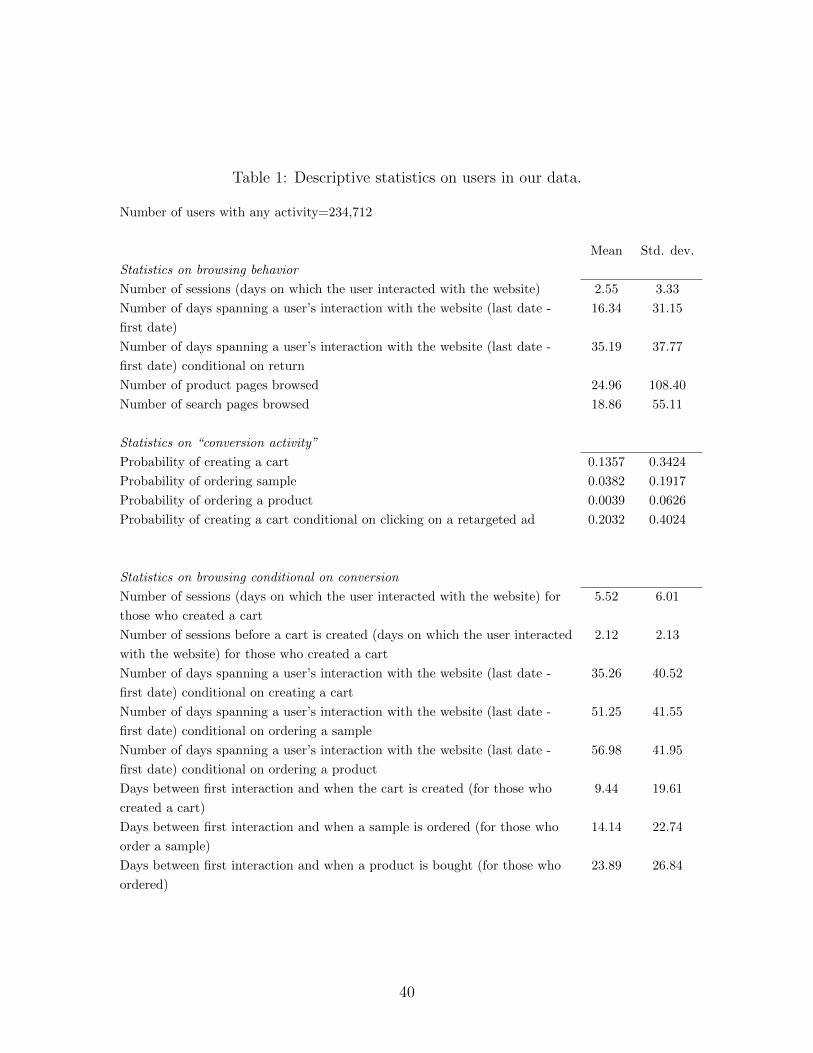
Table 1: Descriptive statistics on users in our data.
Number of users with any activity=234,712
Mean Std. dev.
Statistics on browsing behavior
Number of sessions (days on which the user interacted with the website) 2.55 3.33
Number of days spanning a user’s interaction with the website (last date -
first date)
16.34 31.15
Number of days spanning a user’s interaction with the website (last date -
first date) conditional on return
35.19 37.77
Number of product pages browsed 24.96 108.40
Number of search pages browsed 18.86 55.11
Statistics on “conversion activity”
Probability of creating a cart 0.1357 0.3424
Probability of ordering sample 0.0382 0.1917
Probability of ordering a product 0.0039 0.0626
Probability of creating a cart conditional on clicking on a retargeted ad 0.2032 0.4024
Statistics on browsing conditional on conversion
Number of sessions (days on which the user interacted with the website) for
those who created a cart
5.52 6.01
Number of sessions before a cart is created (days on which the user interacted
with the website) for those who created a cart
2.12 2.13
Number of days spanning a user’s interaction with the website (last date -
first date) conditional on creating a cart
35.26 40.52
Number of days spanning a user’s interaction with the website (last date -
first date) conditional on ordering a sample
51.25 41.55
Number of days spanning a user’s interaction with the website (last date -
first date) conditional on ordering a product
56.98 41.95
Days between first interaction and when the cart is created (for those who
created a cart)
9.44 19.61
Days between first interaction and when a sample is ordered (for those who
order a sample)
14.14 22.74
Days between first interaction and when a product is bought (for those who
ordered)
23.89 26.84
40

Competitor Percentage of individuals whovisited BuildDirect, and also
visited the competitor
For baseline reference:Percentage of individuals in the
population who visit thecompetitor (unconditional on
visiting BuildDirect)
HOMEDEPOT.COM 50.50% 13.6%
LOWES.COM 34.80% 8.6%
WAYFAIR.COM 34.40% 5.6%
LUMBERLIQUIDATORS.COM 17.30% 0.3%
BUILD.COM 13.30% 0.2%
Table 2: Assessing competition. The table shows the percentage of individuals who visitedBuildDirect.com and also visited another competitor’s website. Source comScore Medi-aMetrix, April 2015.
Table 3: Randomization Checks: Test for differences of means across treatment conditions
(1) Product viewers campaign (2) Cart creators campaign
Dependent measure p(>F) p(>F)
Num of days of activity 0.672 0.562
Num Visits 0.861 0.295
Num Carts Created 0.210 0.747
Num of Orders 0.653 0.460
Num of Samples 0.054 0.489
Days of activity greaterthan 0
0.446 0.961
Num Visits greater than 0 0.322 0.975
Num Carts Created greaterthan 0
0.336 0.366
Num of Orders greaterthan 0
0.382 0.682
Num of Samples greaterthan 0
0.600 0.825
N = 234,595, DF=75 N = 23,710, DF=3
All DVs for pre-experimental period
41
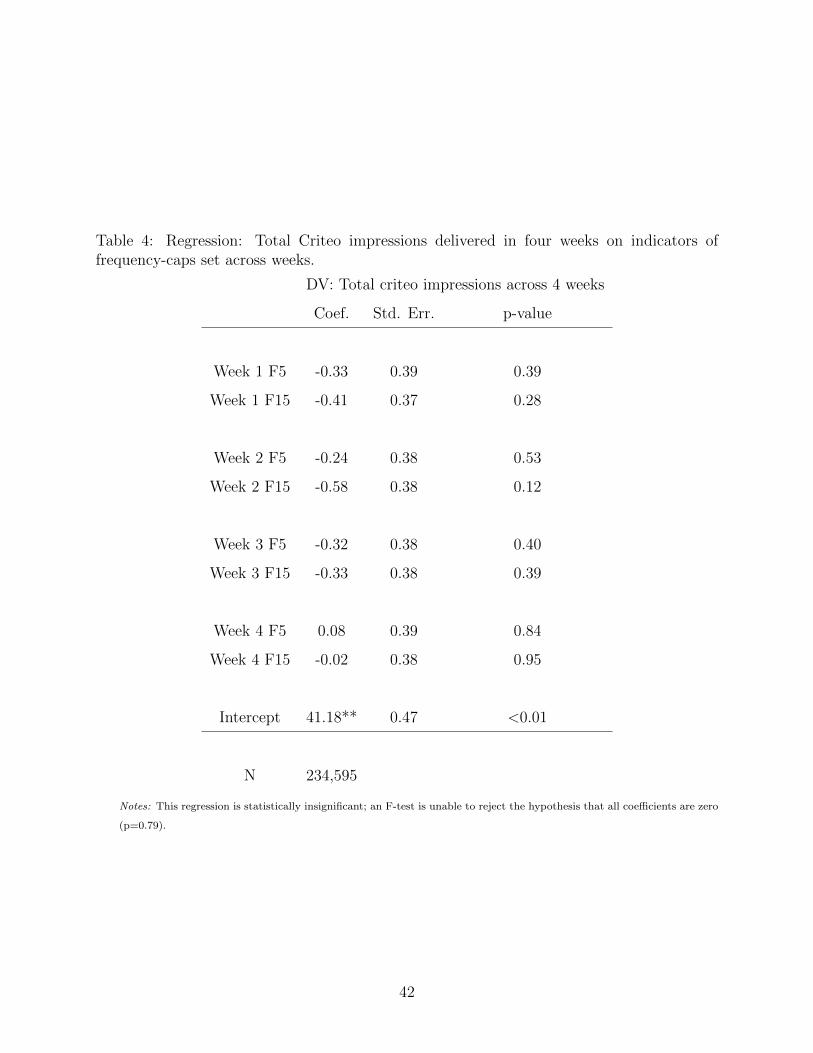
Table 4: Regression: Total Criteo impressions delivered in four weeks on indicators offrequency-caps set across weeks.
DV: Total criteo impressions across 4 weeks
Coef. Std. Err. p-value
Week 1 F5 -0.33 0.39 0.39
Week 1 F15 -0.41 0.37 0.28
Week 2 F5 -0.24 0.38 0.53
Week 2 F15 -0.58 0.38 0.12
Week 3 F5 -0.32 0.38 0.40
Week 3 F15 -0.33 0.38 0.39
Week 4 F5 0.08 0.39 0.84
Week 4 F15 -0.02 0.38 0.95
Intercept 41.18** 0.47 <0.01
N 234,595
Notes: This regression is statistically insignificant; an F-test is unable to reject the hypothesis that all coefficients are zero
(p=0.79).
42

Tab
le5:
Eff
ect
ofR
etar
geti
ng
onvis
its
info
ur
wee
ks
afte
ren
teri
ng
the
exp
erim
ent:
Pro
duct
-Vie
wer
sC
ampai
gn
(1)
(2)
(3)
(4)
DV
:vis
its
info
ur
wee
ks≥
1D
V:
vis
its
info
ur
wee
ks≥
2D
V:
vis
its
info
ur
wee
ks≥
3D
V:
vis
its
info
ur
wee
ks≥
4
Coeff
Std
.er
rC
oeff
Std
.er
rC
oeff
Std
.er
rC
oeff
Std
.er
r
Indic
ator
for
adve
rtis
ing
swit
ched
on
0.02
96**
*0.
0091
0.02
91**
*0.
0091
0.02
32**
*0.
0088
0.01
81**
0.00
83
Inte
rcep
t(B
asel
ine:
F0
condit
ion)
0.20
23**
*0.
0073
0.20
23**
*0.
0073
0.18
62**
*0.
0071
0.16
25**
*0.
0067
N8,
999
8,99
98,
999
8,99
9
Note
s:(*
p<
0.1
;**
p<
0.0
5,
***
p<
0.0
1)
Th
eta
ble
pre
sents
coeffi
cien
tsan
dro
bu
stst
an
dard
erro
rsfr
om
sever
al
OL
Sre
gre
ssio
ns
acr
oss
its
colu
mn
s.F
or
the
pu
rpose
of
this
an
aly
sis,
we
pool
data
for
thre
eco
nd
itio
ns
inw
hic
had
ver
tisi
ng
freq
uen
cy-c
ap
rem
ain
edco
nst
ant,
spec
ifica
lly,
F0
thro
ugh
ou
t,or
F5
thro
ugh
ou
tor
F15
thro
ugh
ou
t.
Th
ein
dep
end
ent
vari
ab
lein
each
of
the
regre
ssio
ns
isan
ind
icato
rof
an
exp
erim
enta
lco
nd
itio
nin
wh
ich
reta
rget
ing
was
turn
edon
.T
he
dep
end
ent
vari
ab
lefo
rth
efi
rst
colu
mn
isan
ind
icato
rof
wh
eth
erth
eu
ser
cam
eb
ack
toth
ew
ebsi
tein
the
fou
rw
eeks
aft
eren
teri
ng
of
the
exp
erim
ent.
Th
eco
effici
ent
for
the
ind
icato
rof
ad
ver
tisi
ng
bei
ng
on
isp
osi
tive
and
sign
ifica
nt,
sugges
tin
gth
at
reta
rget
ing
bri
ngs
back
peo
ple
wh
ow
ou
ldn
ot
have
vis
ited
the
web
site
inth
en
ext
fou
rw
eeks.
Colu
mn
s(2
),(3
)an
d(4
)
inves
tigate
wh
eth
erth
eu
sers
’act
ivit
yin
crea
ses
bey
on
dju
stco
min
gback
an
dvis
itin
gth
ew
ebsi
teon
ce.
Th
ean
aly
sis
show
sth
at
ther
eis
asi
gn
ifica
nt
shif
tin
dis
trib
uti
on
of
vis
its
bey
on
d1.
43
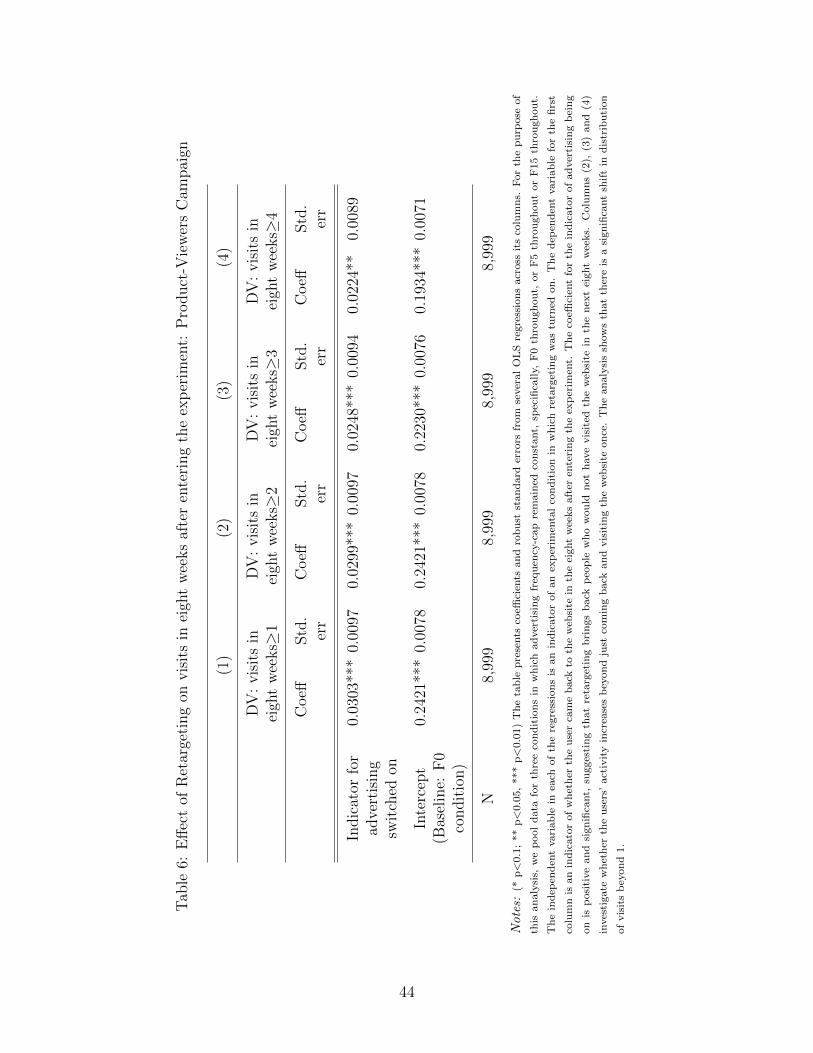
Tab
le6:
Eff
ect
ofR
etar
geti
ng
onvis
its
inei
ght
wee
ks
afte
ren
teri
ng
the
exp
erim
ent:
Pro
duct
-Vie
wer
sC
ampai
gn
(1)
(2)
(3)
(4)
DV
:vis
its
inei
ght
wee
ks≥
1D
V:
vis
its
inei
ght
wee
ks≥
2D
V:
vis
its
inei
ght
wee
ks≥
3D
V:
vis
its
inei
ght
wee
ks≥
4
Coeff
Std
.er
rC
oeff
Std
.er
rC
oeff
Std
.er
rC
oeff
Std
.er
r
Indic
ator
for
adve
rtis
ing
swit
ched
on
0.03
03**
*0.
0097
0.02
99**
*0.
0097
0.02
48**
*0.
0094
0.02
24**
0.00
89
Inte
rcep
t(B
asel
ine:
F0
condit
ion)
0.24
21**
*0.
0078
0.24
21**
*0.
0078
0.22
30**
*0.
0076
0.19
34**
*0.
0071
N8,
999
8,99
98,
999
8,99
9
Note
s:(*
p<
0.1
;**
p<
0.0
5,
***
p<
0.0
1)
Th
eta
ble
pre
sents
coeffi
cien
tsan
dro
bu
stst
an
dard
erro
rsfr
om
sever
al
OL
Sre
gre
ssio
ns
acr
oss
its
colu
mn
s.F
or
the
pu
rpose
of
this
an
aly
sis,
we
pool
data
for
thre
eco
nd
itio
ns
inw
hic
had
ver
tisi
ng
freq
uen
cy-c
ap
rem
ain
edco
nst
ant,
spec
ifica
lly,
F0
thro
ugh
ou
t,or
F5
thro
ugh
ou
tor
F15
thro
ugh
ou
t.
Th
ein
dep
end
ent
vari
ab
lein
each
of
the
regre
ssio
ns
isan
ind
icato
rof
an
exp
erim
enta
lco
nd
itio
nin
wh
ich
reta
rget
ing
was
turn
edon
.T
he
dep
end
ent
vari
ab
lefo
rth
efi
rst
colu
mn
isan
ind
icato
rof
wh
eth
erth
eu
ser
cam
eb
ack
toth
ew
ebsi
tein
the
eight
wee
ks
aft
eren
teri
ng
the
exp
erim
ent.
Th
eco
effici
ent
for
the
ind
icato
rof
ad
ver
tisi
ng
bei
ng
on
isp
osi
tive
an
dsi
gn
ifica
nt,
sugges
tin
gth
at
reta
rget
ing
bri
ngs
back
peo
ple
wh
ow
ou
ldn
ot
have
vis
ited
the
web
site
inth
en
ext
eight
wee
ks.
Colu
mn
s(2
),(3
)an
d(4
)
inves
tigate
wh
eth
erth
eu
sers
’act
ivit
yin
crea
ses
bey
on
dju
stco
min
gback
an
dvis
itin
gth
ew
ebsi
teon
ce.
Th
ean
aly
sis
show
sth
at
ther
eis
asi
gn
ifica
nt
shif
tin
dis
trib
uti
on
of
vis
its
bey
on
d1.
44

Tab
le7:
Eff
ect
ofR
etar
geti
ng
onvis
its
info
ur
wee
ks
afte
ren
teri
ng
the
exp
erim
ent:
Car
t-cr
eato
rsC
ampai
gn
(1)
(2)
(3)
(4)
DV
:vis
its
info
ur
wee
ks≥
1D
V:
vis
its
info
ur
wee
ks≥
2D
V:
vis
its
info
ur
wee
ks≥
3D
V:
vis
its
info
ur
wee
ks≥
4
Coeff
Std
.er
rC
oeff
Std
.er
rC
oeff
Std
.er
rC
oeff
Std
.er
r
Indic
ator
for
adve
rtis
ing
swit
ched
on
0.02
04**
0.00
810.
0206
**0.
0081
0.01
69**
0.00
800.
0172
**0.
0079
Inte
rcep
t(B
asel
ine:
F0
condit
ion)
0.37
51**
*0.
0058
0.37
44**
*0.
0058
0.35
26**
*0.
0057
0.32
23**
*0.
0056
N14
,351
14,3
5114
,351
14,3
51
Note
s:(*
p<
0.1
;**
p<
0.0
5,
***
p<
0.0
1)
Th
eta
ble
pre
sents
coeffi
cien
tsan
dro
bu
stst
an
dard
erro
rsfr
om
sever
al
OL
Sre
gre
ssio
ns
acr
oss
its
colu
mn
s.F
or
the
pu
rpose
of
this
an
aly
sis,
we
pool
data
for
thre
eco
nd
itio
ns
inw
hic
had
ver
tisi
ng
freq
uen
cy-c
ap
rem
ain
edco
nst
ant,
spec
ifica
lly,
F0
thro
ugh
ou
t,or
F15
thro
ugh
ou
t(r
ecall
that
the
cart
-cre
ato
rsca
mp
aig
nd
idn
ot
have
aco
nd
itio
nw
ith
freq
uen
cyca
pof
5).
Th
ein
dep
end
ent
vari
ab
lein
each
of
the
regre
ssio
ns
isan
ind
icato
rof
an
exp
erim
enta
lco
nd
itio
n
inw
hic
hre
targ
etin
gw
as
turn
edon
.T
he
dep
end
ent
vari
ab
lefo
rth
efi
rst
colu
mn
isan
ind
icato
rof
wh
eth
erth
eu
ser
cam
eb
ack
toth
ew
ebsi
tein
the
fou
rw
eeks
aft
er
ente
rin
gof
the
exp
erim
ent.
Th
eco
effici
ent
for
the
ind
icato
rof
ad
ver
tisi
ng
bei
ng
on
isp
osi
tive
an
dsi
gn
ifica
nt,
sugges
tin
gth
at
reta
rget
ing
bri
ngs
back
peo
ple
wh
ow
ou
ld
not
have
vis
ited
the
web
site
inth
en
ext
fou
rw
eeks.
Colu
mn
s(2
),(3
)an
d(4
)in
ves
tigate
wh
eth
erth
eu
sers
’act
ivit
yin
crea
ses
bey
on
dju
stco
min
gb
ack
an
dvis
itin
gth
e
web
site
on
ce.
Th
ean
aly
sis
show
sth
at
ther
eis
asi
gn
ifica
nt
shif
tin
dis
trib
uti
on
of
vis
its
bey
on
d1.
45

Tab
le8:
Eff
ect
ofR
etar
geti
ng
onvis
its
inei
ght
wee
ks
afte
ren
teri
ng
the
exp
erim
ent:
Car
t-cr
eato
rsC
ampai
gn
(1)
(2)
(3)
(4)
DV
:vis
its
inei
ght
wee
ks≥
1D
V:
vis
its
inei
ght
wee
ks≥
2D
V:
vis
its
inei
ght
wee
ks≥
3D
V:
vis
its
inei
ght
wee
ks≥
4
Coeff
Std
.er
rC
oeff
Std
.er
rC
oeff
Std
.er
rC
oeff
Std
.er
r
Indic
ator
for
adve
rtis
ing
swit
ched
on
0.01
99**
0.00
830.
0199
**0.
0083
0.01
66**
0.00
820.
0165
**0.
0081
Inte
rcep
t(B
asel
ine:
F0
condit
ion)
0.42
07**
*0.
0059
0.42
00**
*0.
0059
0.39
68**
*0.
0058
0.36
64**
*0.
0057
N14
,351
14,3
5114
,351
14,3
51
Note
s:(*
p<
0.1
;**
p<
0.0
5,
***
p<
0.0
1)
Th
eta
ble
pre
sents
coeffi
cien
tsan
dro
bu
stst
an
dard
erro
rsfr
om
sever
al
OL
Sre
gre
ssio
ns
acr
oss
its
colu
mn
s.F
or
the
pu
rpose
of
this
an
aly
sis,
we
pool
data
for
thre
eco
nd
itio
ns
inw
hic
had
ver
tisi
ng
freq
uen
cy-c
ap
rem
ain
edco
nst
ant,
spec
ifica
lly,
F0
thro
ugh
ou
t,or
F15
thro
ugh
ou
t(r
ecall
that
the
cart
-cre
ato
rsca
mp
aig
nd
idn
ot
have
aco
nd
itio
nw
ith
freq
uen
cyca
pof
5).
Th
ein
dep
end
ent
vari
ab
lein
each
of
the
regre
ssio
ns
isan
ind
icato
rof
an
exp
erim
enta
lco
nd
itio
n
inw
hic
hre
targ
etin
gw
as
turn
edon
.T
he
dep
end
ent
vari
ab
lefo
rth
efi
rst
colu
mn
isan
ind
icato
rof
wh
eth
erth
eu
ser
cam
eb
ack
toth
ew
ebsi
tein
the
eight
wee
ks
aft
er
ente
rin
gof
the
exp
erim
ent.
Th
eco
effici
ent
for
the
ind
icato
rof
ad
ver
tisi
ng
bei
ng
on
isp
osi
tive
an
dsi
gn
ifica
nt,
sugges
tin
gth
at
reta
rget
ing
bri
ngs
back
peo
ple
wh
ow
ou
ld
not
have
vis
ited
the
web
site
inth
en
ext
eight
wee
ks.
Colu
mn
s(2
),(3
)an
d(4
)in
ves
tigate
wh
eth
erth
eu
sers
’act
ivit
yin
crea
ses
bey
on
dju
stco
min
gb
ack
an
dvis
itin
gth
e
web
site
on
ce.
Th
ean
aly
sis
show
sth
at
ther
eis
asi
gn
ifica
nt
shif
tin
dis
trib
uti
on
of
vis
its
bey
on
d1.
46
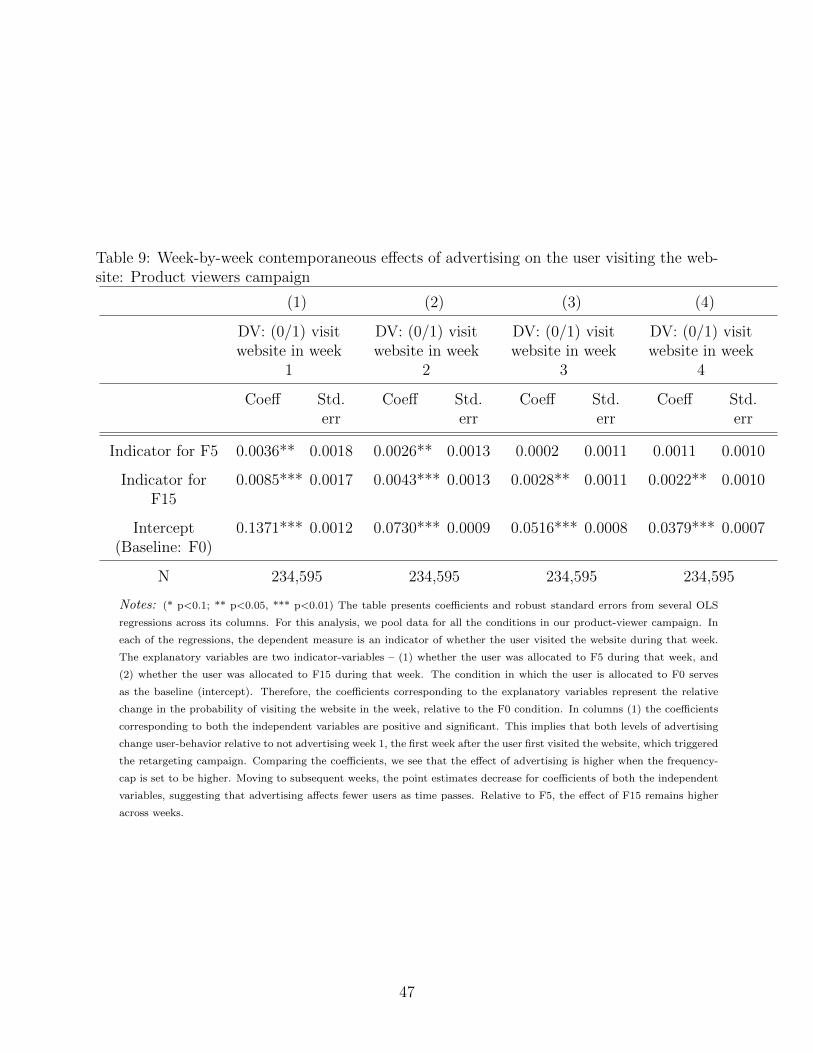
Table 9: Week-by-week contemporaneous effects of advertising on the user visiting the web-site: Product viewers campaign
(1) (2) (3) (4)
DV: (0/1) visitwebsite in week
1
DV: (0/1) visitwebsite in week
2
DV: (0/1) visitwebsite in week
3
DV: (0/1) visitwebsite in week
4
Coeff Std.err
Coeff Std.err
Coeff Std.err
Coeff Std.err
Indicator for F5 0.0036** 0.0018 0.0026** 0.0013 0.0002 0.0011 0.0011 0.0010
Indicator forF15
0.0085*** 0.0017 0.0043*** 0.0013 0.0028** 0.0011 0.0022** 0.0010
Intercept(Baseline: F0)
0.1371*** 0.0012 0.0730*** 0.0009 0.0516*** 0.0008 0.0379*** 0.0007
N 234,595 234,595 234,595 234,595
Notes: (* p<0.1; ** p<0.05, *** p<0.01) The table presents coefficients and robust standard errors from several OLS
regressions across its columns. For this analysis, we pool data for all the conditions in our product-viewer campaign. In
each of the regressions, the dependent measure is an indicator of whether the user visited the website during that week.
The explanatory variables are two indicator-variables – (1) whether the user was allocated to F5 during that week, and
(2) whether the user was allocated to F15 during that week. The condition in which the user is allocated to F0 serves
as the baseline (intercept). Therefore, the coefficients corresponding to the explanatory variables represent the relative
change in the probability of visiting the website in the week, relative to the F0 condition. In columns (1) the coefficients
corresponding to both the independent variables are positive and significant. This implies that both levels of advertising
change user-behavior relative to not advertising week 1, the first week after the user first visited the website, which triggered
the retargeting campaign. Comparing the coefficients, we see that the effect of advertising is higher when the frequency-
cap is set to be higher. Moving to subsequent weeks, the point estimates decrease for coefficients of both the independent
variables, suggesting that advertising affects fewer users as time passes. Relative to F5, the effect of F15 remains higher
across weeks.
47
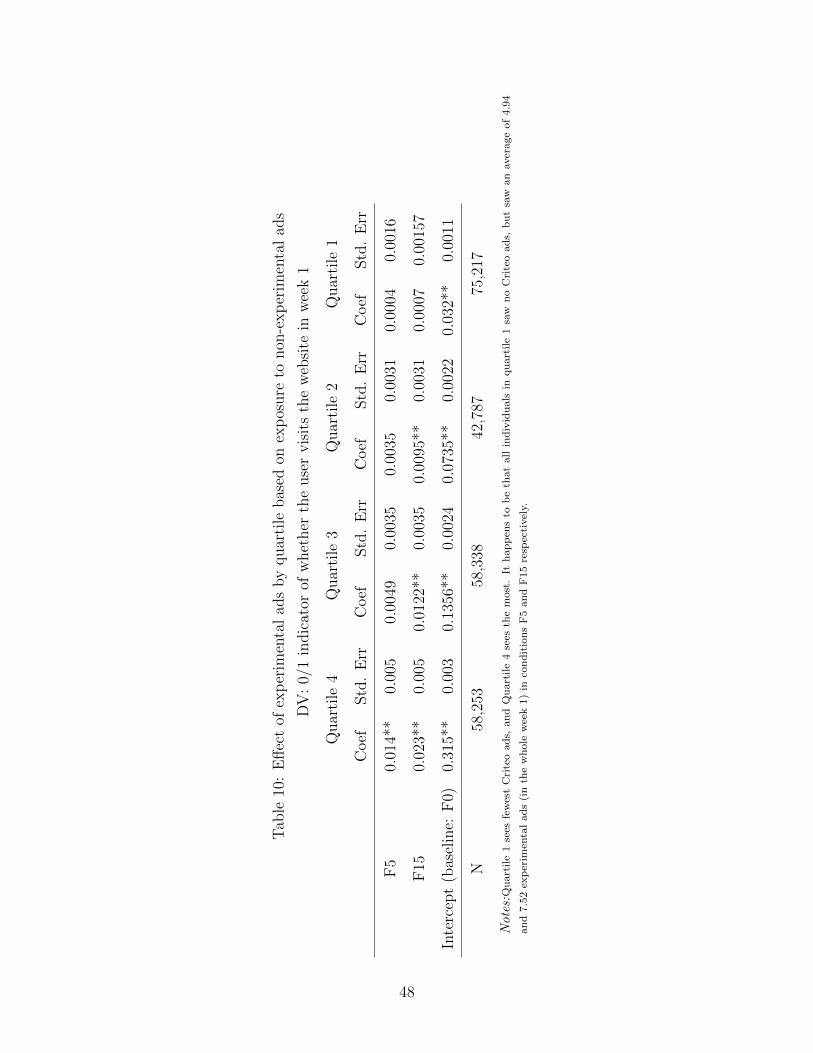
Tab
le10
:E
ffec
tof
exp
erim
enta
lad
sby
quar
tile
bas
edon
exp
osure
tonon
-exp
erim
enta
lad
s
DV
:0/
1in
dic
ator
ofw
het
her
the
use
rvis
its
the
web
site
inw
eek
1
Quar
tile
4Q
uar
tile
3Q
uar
tile
2Q
uar
tile
1
Coef
Std
.E
rrC
oef
Std
.E
rrC
oef
Std
.E
rrC
oef
Std
.E
rr
F5
0.01
4**
0.00
50.
0049
0.00
350.
0035
0.00
310.
0004
0.00
16
F15
0.02
3**
0.00
50.
0122
**0.
0035
0.00
95**
0.00
310.
0007
0.00
157
Inte
rcep
t(b
asel
ine:
F0)
0.31
5**
0.00
30.
1356
**0.
0024
0.07
35**
0.00
220.
032*
*0.
0011
N58
,253
58,3
3842
,787
75,2
17
Note
s:Q
uart
ile
1se
esfe
wes
tC
rite
oad
s,an
dQ
uart
ile
4se
esth
em
ost
.It
hap
pen
sto
be
that
all
ind
ivid
uals
inqu
art
ile
1sa
wn
oC
rite
oad
s,b
ut
saw
an
aver
age
of
4.9
4
an
d7.5
2ex
per
imen
tal
ad
s(i
nth
ew
hole
wee
k1)
inco
nd
itio
ns
F5
an
dF
15
resp
ecti
vel
y.
48
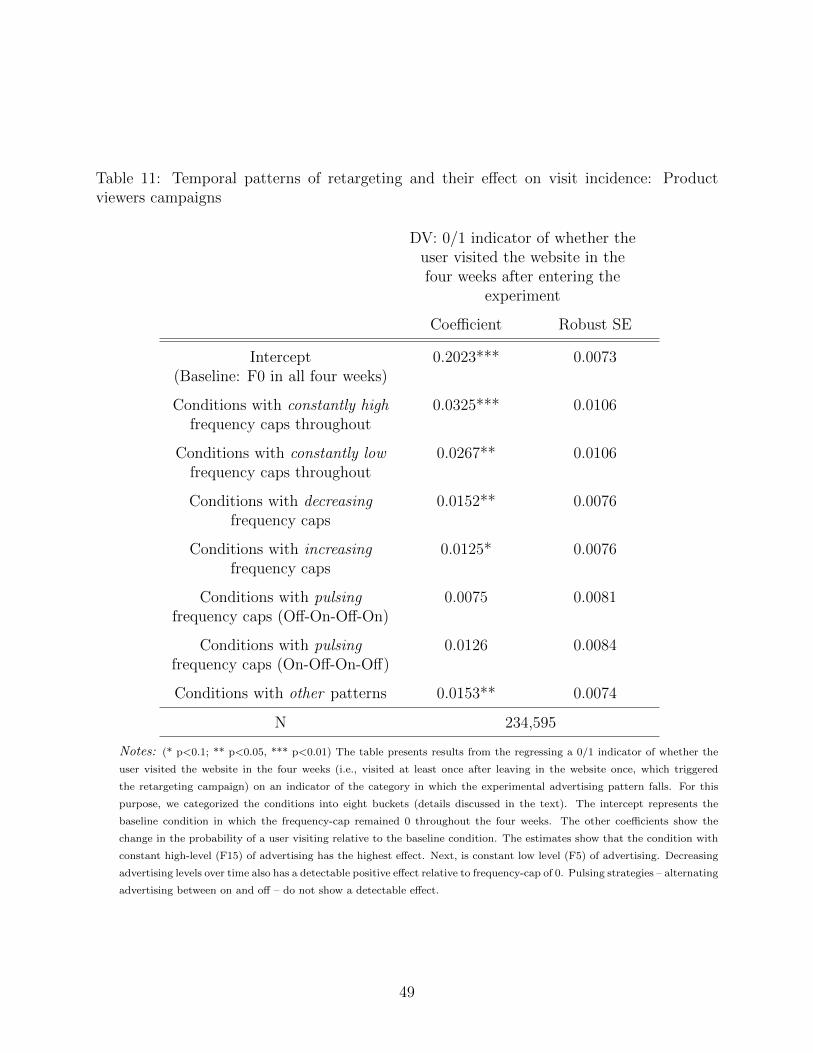
Table 11: Temporal patterns of retargeting and their effect on visit incidence: Productviewers campaigns
DV: 0/1 indicator of whether theuser visited the website in thefour weeks after entering the
experiment
Coefficient Robust SE
Intercept(Baseline: F0 in all four weeks)
0.2023*** 0.0073
Conditions with constantly highfrequency caps throughout
0.0325*** 0.0106
Conditions with constantly lowfrequency caps throughout
0.0267** 0.0106
Conditions with decreasingfrequency caps
0.0152** 0.0076
Conditions with increasingfrequency caps
0.0125* 0.0076
Conditions with pulsingfrequency caps (Off-On-Off-On)
0.0075 0.0081
Conditions with pulsingfrequency caps (On-Off-On-Off)
0.0126 0.0084
Conditions with other patterns 0.0153** 0.0074
N 234,595
Notes: (* p<0.1; ** p<0.05, *** p<0.01) The table presents results from the regressing a 0/1 indicator of whether the
user visited the website in the four weeks (i.e., visited at least once after leaving in the website once, which triggered
the retargeting campaign) on an indicator of the category in which the experimental advertising pattern falls. For this
purpose, we categorized the conditions into eight buckets (details discussed in the text). The intercept represents the
baseline condition in which the frequency-cap remained 0 throughout the four weeks. The other coefficients show the
change in the probability of a user visiting relative to the baseline condition. The estimates show that the condition with
constant high-level (F15) of advertising has the highest effect. Next, is constant low level (F5) of advertising. Decreasing
advertising levels over time also has a detectable positive effect relative to frequency-cap of 0. Pulsing strategies – alternating
advertising between on and off – do not show a detectable effect.
49

Table 12: Temporal patterns of retargeting and their effect in visit incidence: Cart creatorscampaigns
DV: 0/1 indicator of whether theuser visited the website in thefour weeks after entering the
experiment
Condition Coefficient Robust SE
Intercept(baseline: F0 F0 F0 F0)
0.3751*** 0.0058
F0 F0 F15 F15 0.0103 0.0091
F15 F15 F0 F0 0.0022 0.0092
F15 F15 F15 F15 0.0204** 0.0081
N 23,710
Notes: (* p<0.1; ** p<0.05, *** p<0.01) The table presents results from the regressing a 0/1 indicator of whether the
user visited the website in the four weeks (i.e., visited at least once after leaving in the website once, which triggered the
retargeting campaign) on an indicator of the experimental condition the user is allocated to. The intercept represents
the baseline condition in which the frequency-cap remained 0 throughout the four weeks. The other coefficients show
the change in the probability of a user visiting relative to the baseline condition. The only condition in which we find
a detectable effect on visits is the one with advertising turned on in all four weeks. The other two condition in which
advertising is turned on either initially or late, are not statistically different from the condition with all F0s.
50
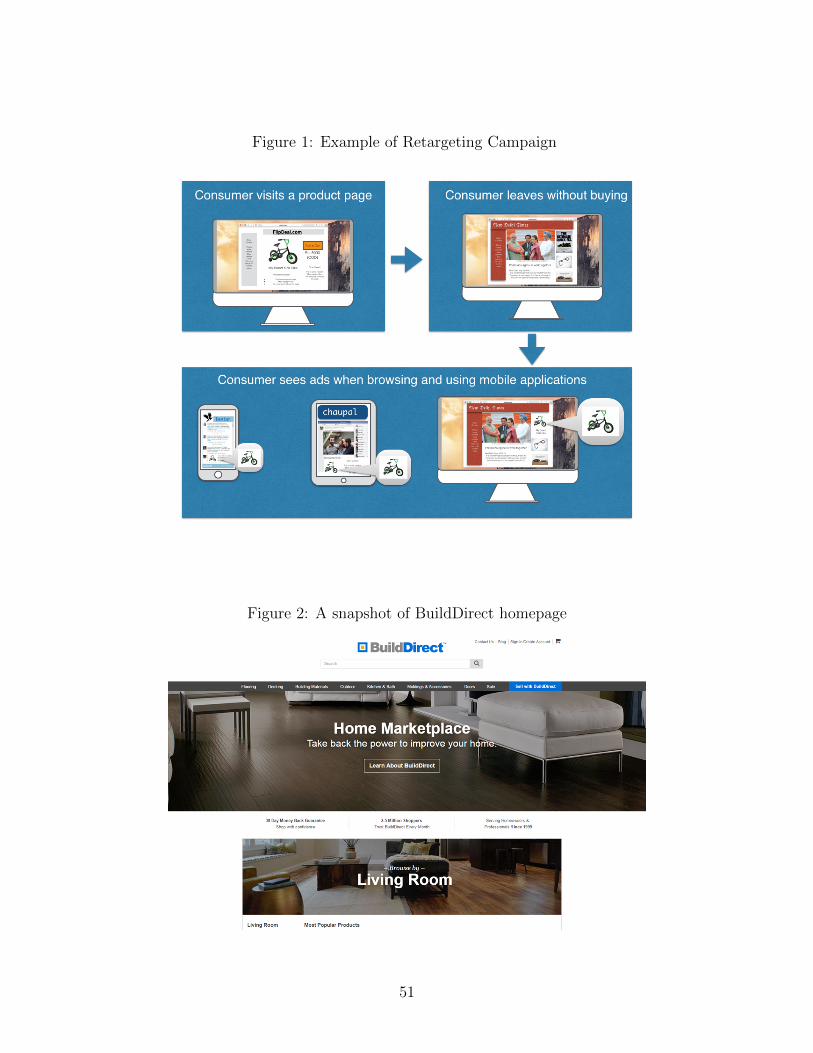
Figure 1: Example of Retargeting Campaign
Figure 2: A snapshot of BuildDirect homepage
51

Figure 3: A snapshot of an example search page on builddirect.com
52

Figure 4: A snapshot of an example product page on builddirect.com
53

Figure 5: A snapshot of an example page seen after creating a cart
54
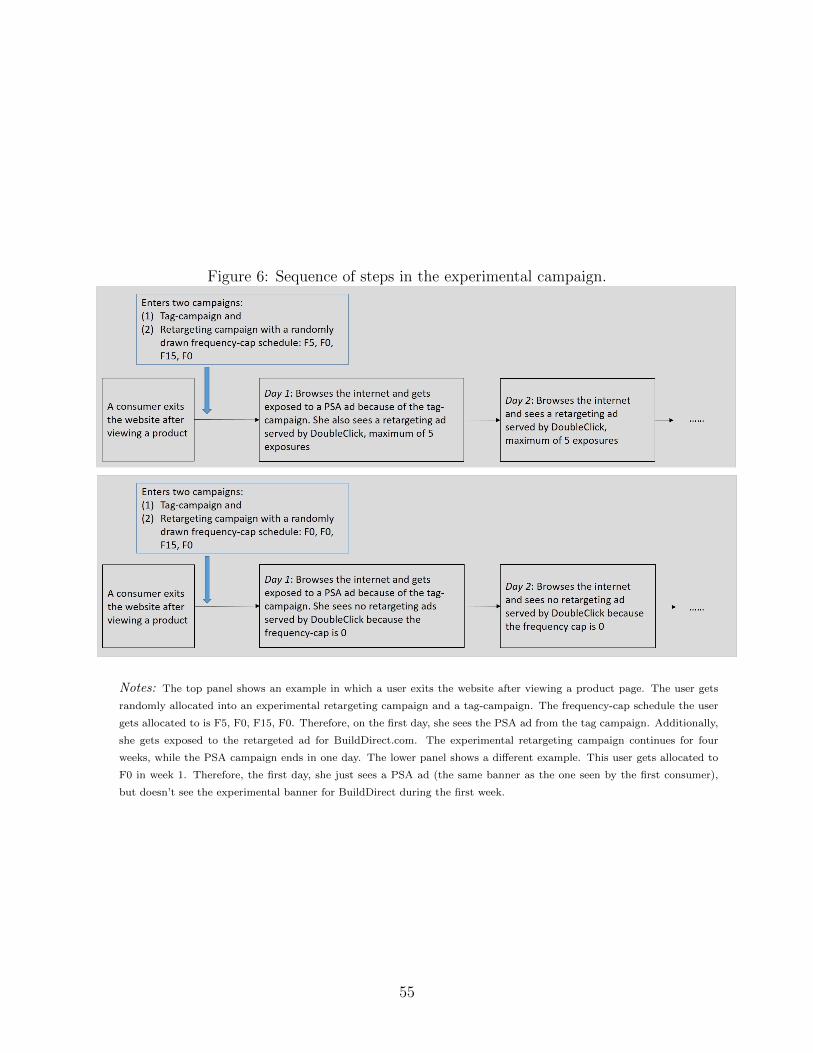
Figure 6: Sequence of steps in the experimental campaign.
Notes: The top panel shows an example in which a user exits the website after viewing a product page. The user gets
randomly allocated into an experimental retargeting campaign and a tag-campaign. The frequency-cap schedule the user
gets allocated to is F5, F0, F15, F0. Therefore, on the first day, she sees the PSA ad from the tag campaign. Additionally,
she gets exposed to the retargeted ad for BuildDirect.com. The experimental retargeting campaign continues for four
weeks, while the PSA campaign ends in one day. The lower panel shows a different example. This user gets allocated to
F0 in week 1. Therefore, the first day, she just sees a PSA ad (the same banner as the one seen by the first consumer),
but doesn’t see the experimental banner for BuildDirect during the first week.
55
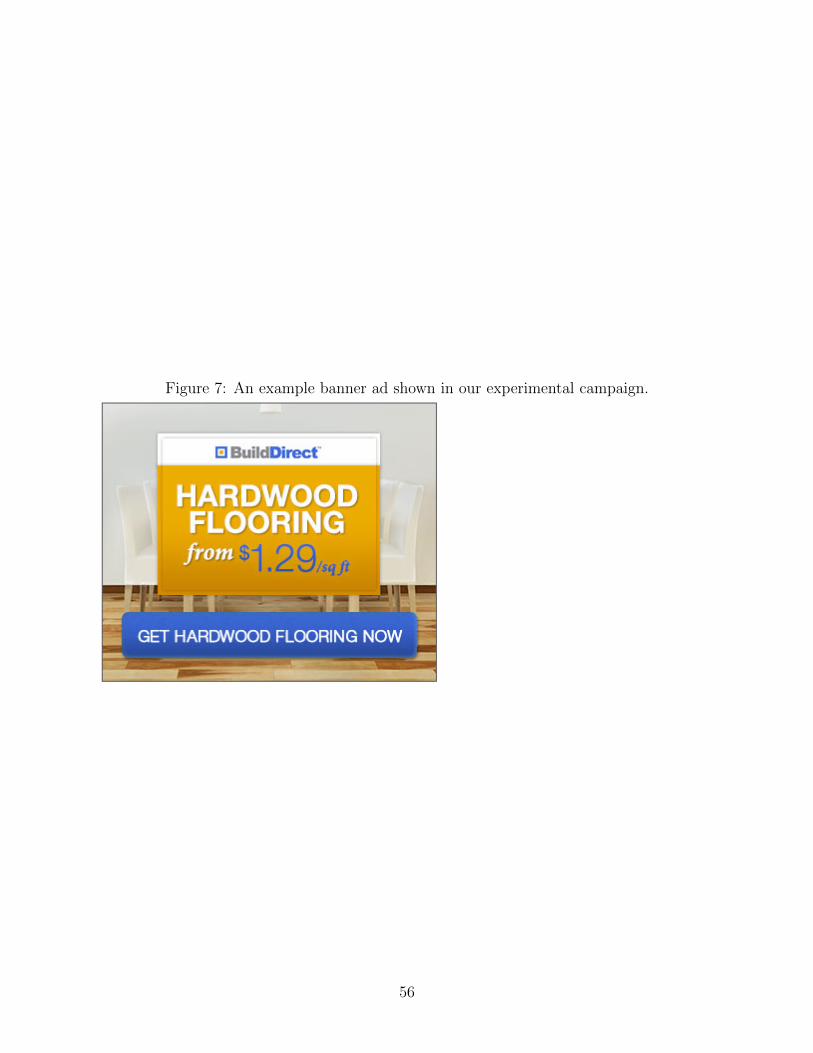
Figure 7: An example banner ad shown in our experimental campaign.
56
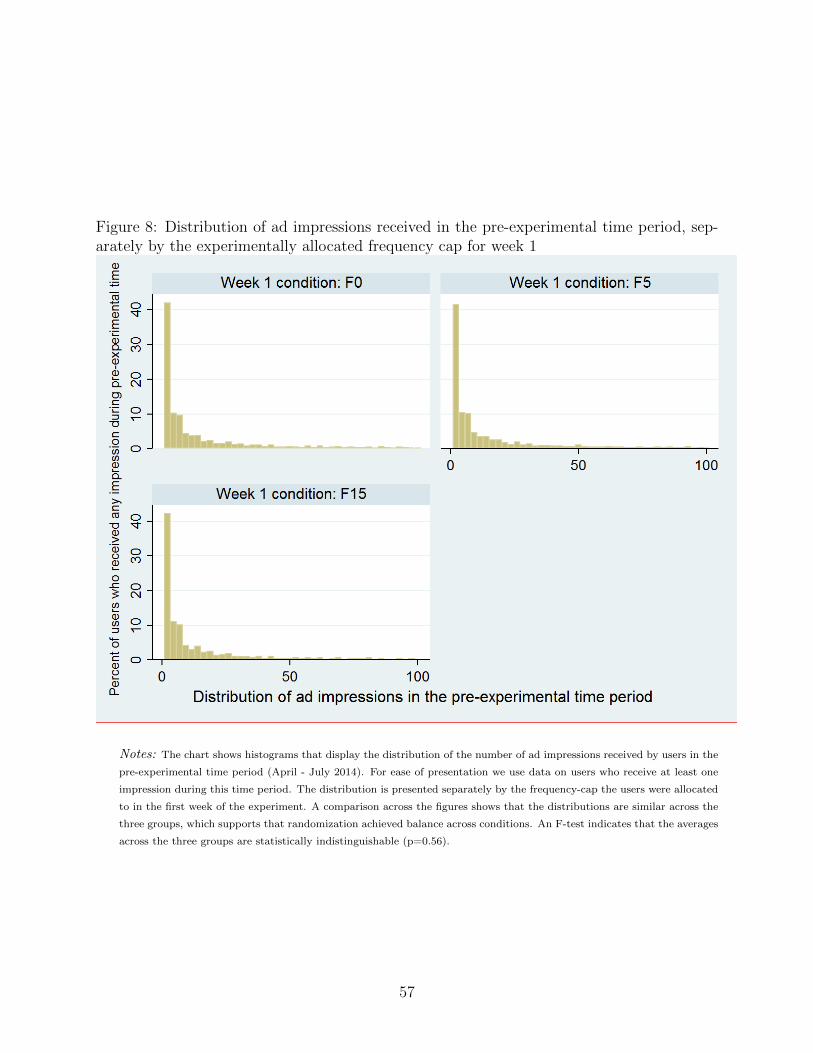
Figure 8: Distribution of ad impressions received in the pre-experimental time period, sep-arately by the experimentally allocated frequency cap for week 1
Notes: The chart shows histograms that display the distribution of the number of ad impressions received by users in the
pre-experimental time period (April - July 2014). For ease of presentation we use data on users who receive at least one
impression during this time period. The distribution is presented separately by the frequency-cap the users were allocated
to in the first week of the experiment. A comparison across the figures shows that the distributions are similar across the
three groups, which supports that randomization achieved balance across conditions. An F-test indicates that the averages
across the three groups are statistically indistinguishable (p=0.56).
57
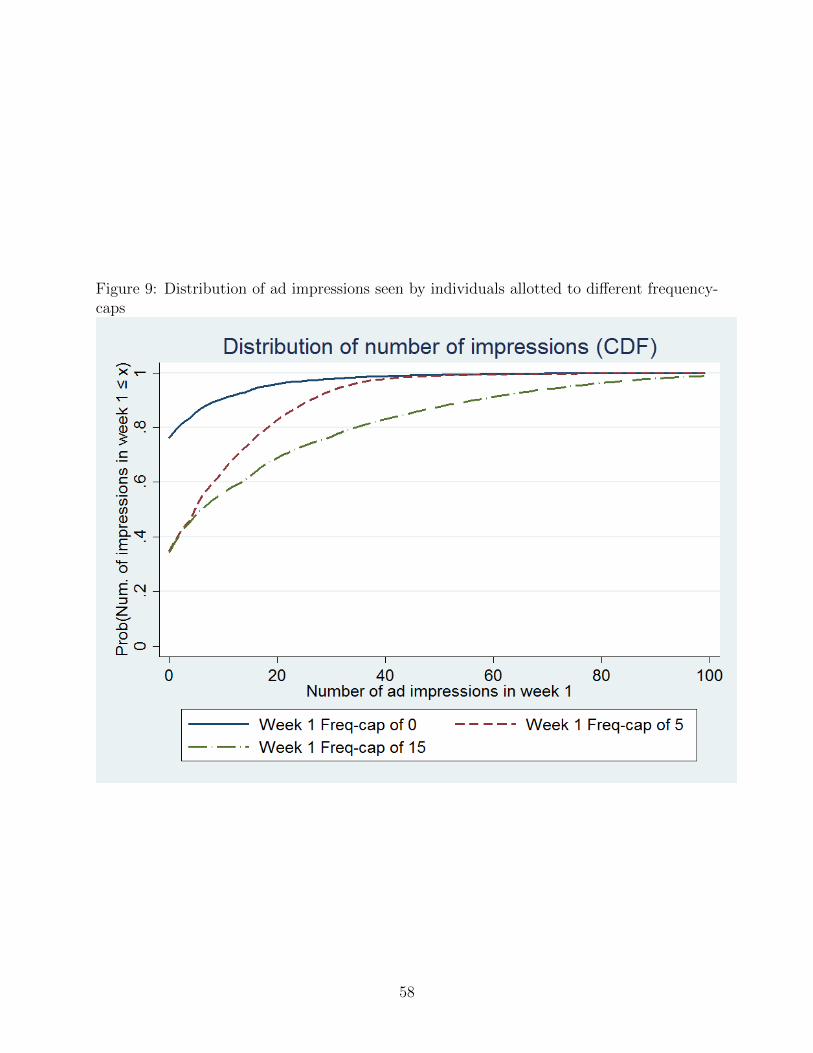
Figure 9: Distribution of ad impressions seen by individuals allotted to different frequency-caps
58
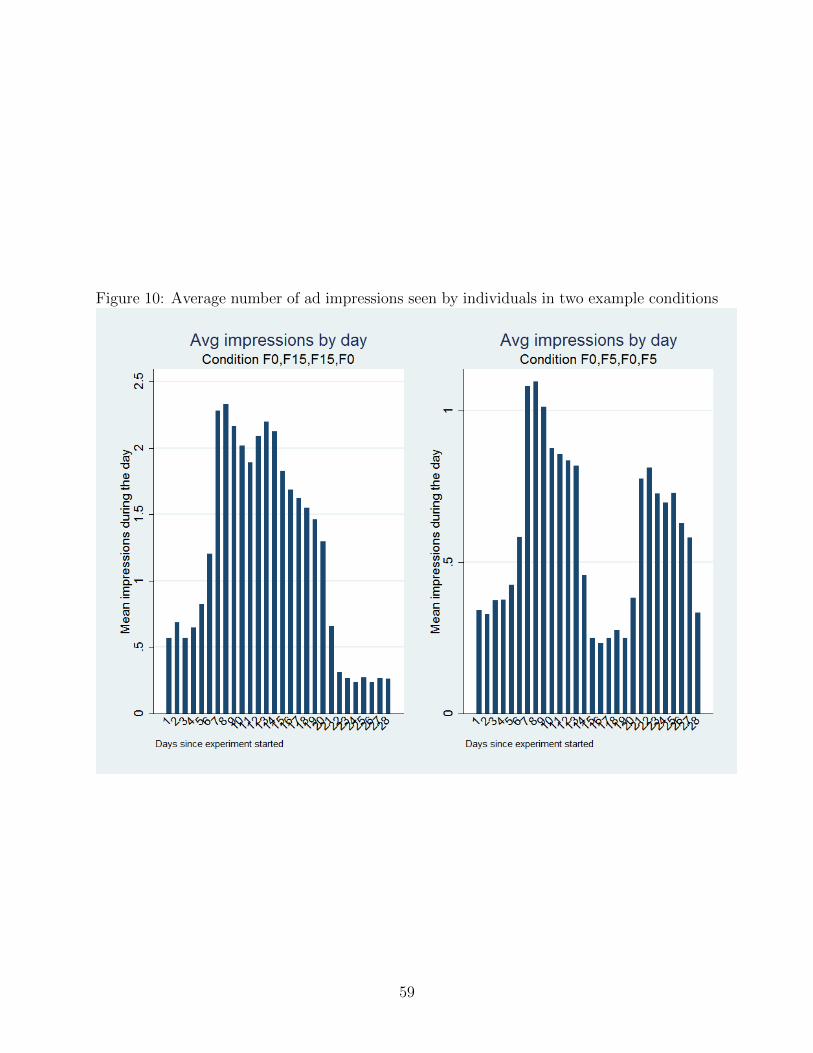
Figure 10: Average number of ad impressions seen by individuals in two example conditions
59
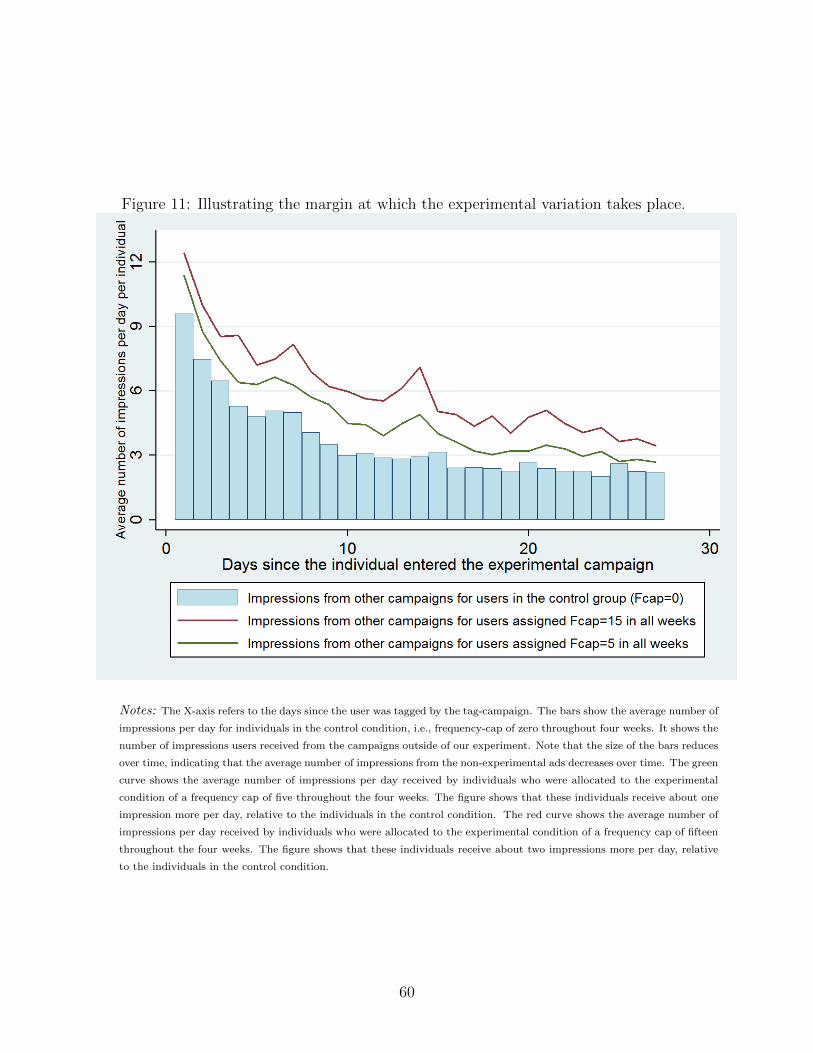
Figure 11: Illustrating the margin at which the experimental variation takes place.
Notes: The X-axis refers to the days since the user was tagged by the tag-campaign. The bars show the average number of
impressions per day for individuals in the control condition, i.e., frequency-cap of zero throughout four weeks. It shows the
number of impressions users received from the campaigns outside of our experiment. Note that the size of the bars reduces
over time, indicating that the average number of impressions from the non-experimental ads decreases over time. The green
curve shows the average number of impressions per day received by individuals who were allocated to the experimental
condition of a frequency cap of five throughout the four weeks. The figure shows that these individuals receive about one
impression more per day, relative to the individuals in the control condition. The red curve shows the average number of
impressions per day received by individuals who were allocated to the experimental condition of a frequency cap of fifteen
throughout the four weeks. The figure shows that these individuals receive about two impressions more per day, relative
to the individuals in the control condition.
60
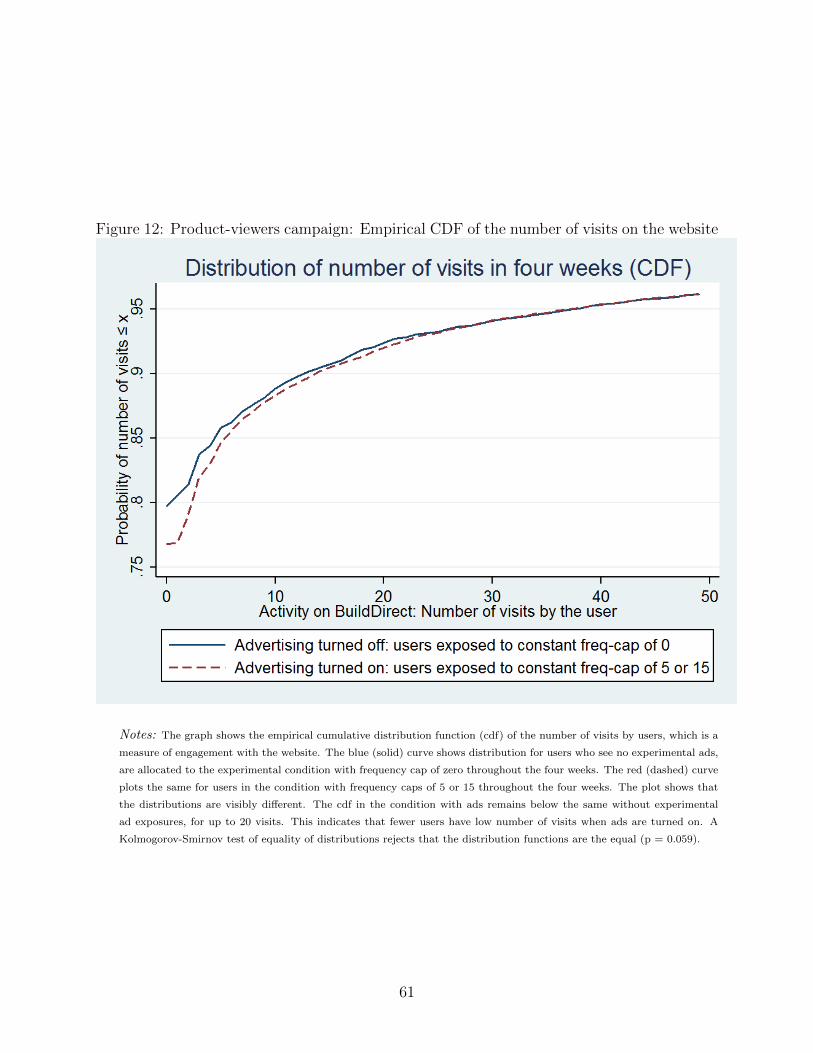
Figure 12: Product-viewers campaign: Empirical CDF of the number of visits on the website
Notes: The graph shows the empirical cumulative distribution function (cdf) of the number of visits by users, which is a
measure of engagement with the website. The blue (solid) curve shows distribution for users who see no experimental ads,
are allocated to the experimental condition with frequency cap of zero throughout the four weeks. The red (dashed) curve
plots the same for users in the condition with frequency caps of 5 or 15 throughout the four weeks. The plot shows that
the distributions are visibly different. The cdf in the condition with ads remains below the same without experimental
ad exposures, for up to 20 visits. This indicates that fewer users have low number of visits when ads are turned on. A
Kolmogorov-Smirnov test of equality of distributions rejects that the distribution functions are the equal (p = 0.059).
61
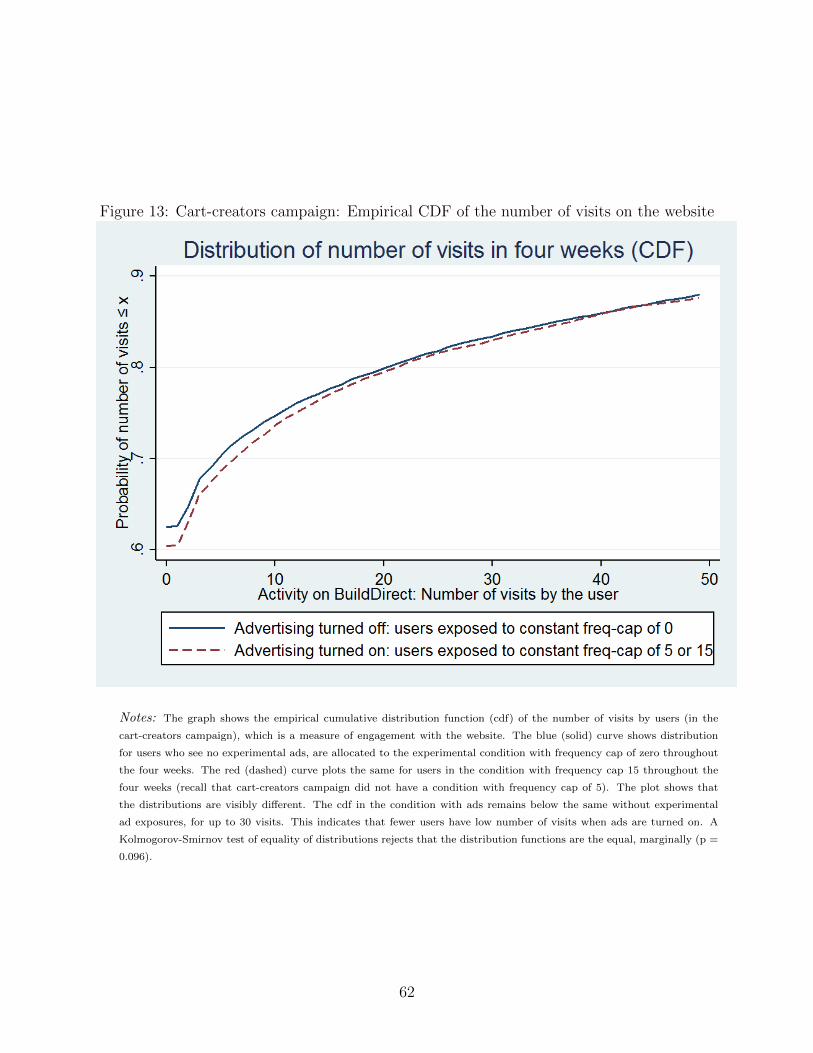
Figure 13: Cart-creators campaign: Empirical CDF of the number of visits on the website
Notes: The graph shows the empirical cumulative distribution function (cdf) of the number of visits by users (in the
cart-creators campaign), which is a measure of engagement with the website. The blue (solid) curve shows distribution
for users who see no experimental ads, are allocated to the experimental condition with frequency cap of zero throughout
the four weeks. The red (dashed) curve plots the same for users in the condition with frequency cap 15 throughout the
four weeks (recall that cart-creators campaign did not have a condition with frequency cap of 5). The plot shows that
the distributions are visibly different. The cdf in the condition with ads remains below the same without experimental
ad exposures, for up to 30 visits. This indicates that fewer users have low number of visits when ads are turned on. A
Kolmogorov-Smirnov test of equality of distributions rejects that the distribution functions are the equal, marginally (p =
0.096).
62
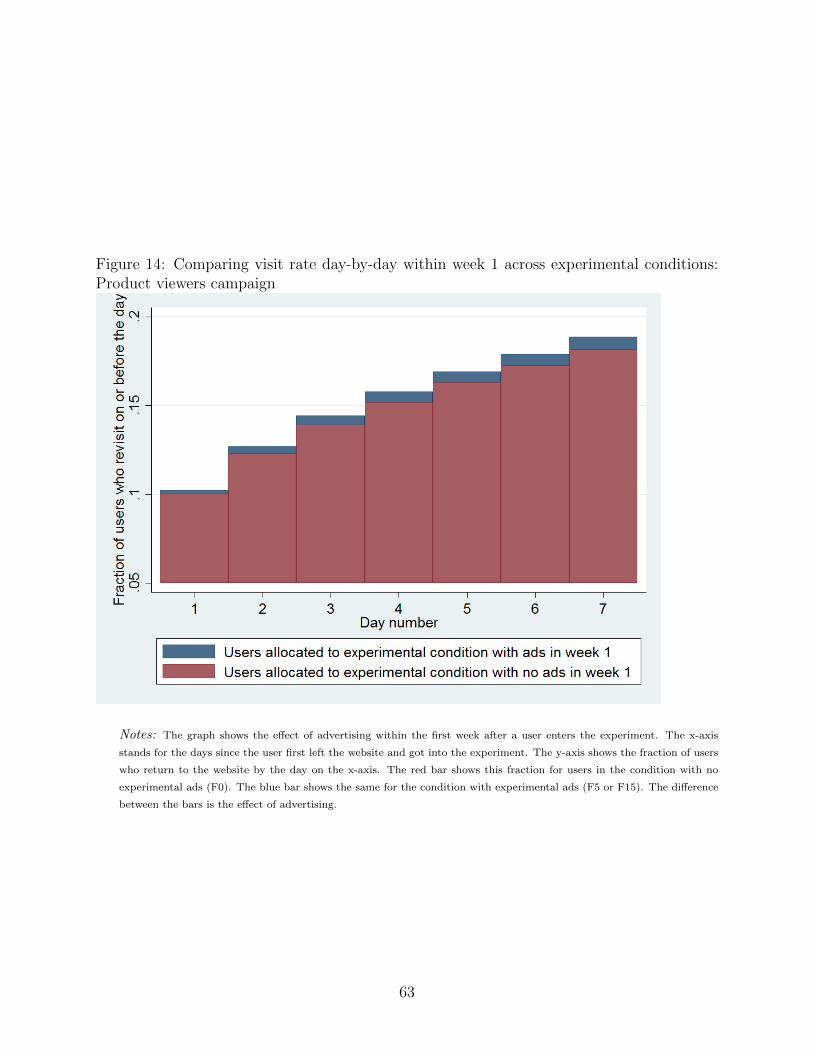
Figure 14: Comparing visit rate day-by-day within week 1 across experimental conditions:Product viewers campaign
Notes: The graph shows the effect of advertising within the first week after a user enters the experiment. The x-axis
stands for the days since the user first left the website and got into the experiment. The y-axis shows the fraction of users
who return to the website by the day on the x-axis. The red bar shows this fraction for users in the condition with no
experimental ads (F0). The blue bar shows the same for the condition with experimental ads (F5 or F15). The difference
between the bars is the effect of advertising.
63
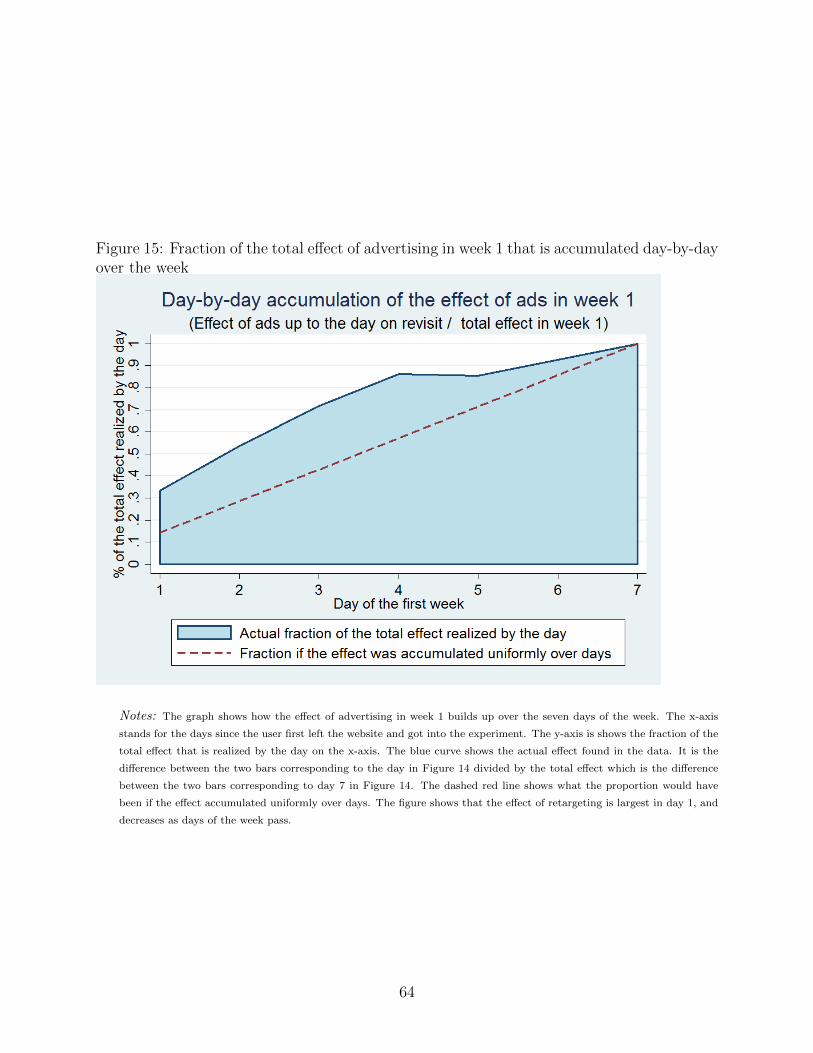
Figure 15: Fraction of the total effect of advertising in week 1 that is accumulated day-by-dayover the week
Notes: The graph shows how the effect of advertising in week 1 builds up over the seven days of the week. The x-axis
stands for the days since the user first left the website and got into the experiment. The y-axis is shows the fraction of the
total effect that is realized by the day on the x-axis. The blue curve shows the actual effect found in the data. It is the
difference between the two bars corresponding to the day in Figure 14 divided by the total effect which is the difference
between the two bars corresponding to day 7 in Figure 14. The dashed red line shows what the proportion would have
been if the effect accumulated uniformly over days. The figure shows that the effect of retargeting is largest in day 1, and
decreases as days of the week pass.
64
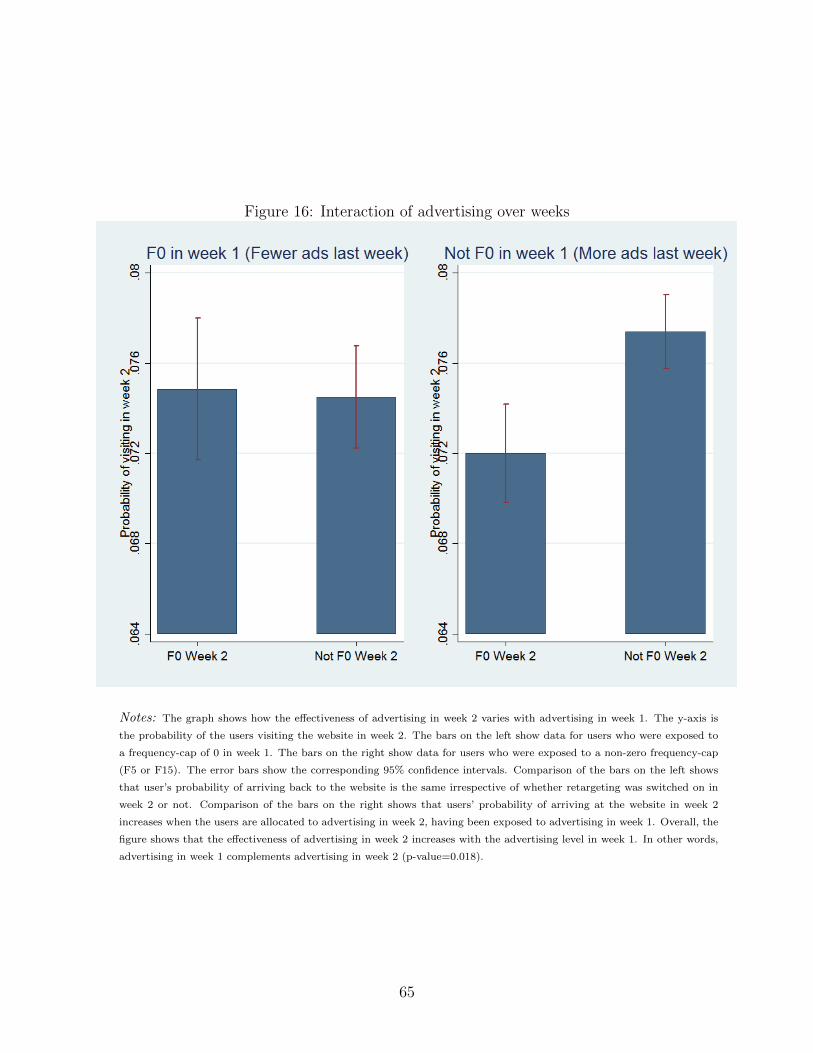
Figure 16: Interaction of advertising over weeks
Notes: The graph shows how the effectiveness of advertising in week 2 varies with advertising in week 1. The y-axis is
the probability of the users visiting the website in week 2. The bars on the left show data for users who were exposed to
a frequency-cap of 0 in week 1. The bars on the right show data for users who were exposed to a non-zero frequency-cap
(F5 or F15). The error bars show the corresponding 95% confidence intervals. Comparison of the bars on the left shows
that user’s probability of arriving back to the website is the same irrespective of whether retargeting was switched on in
week 2 or not. Comparison of the bars on the right shows that users’ probability of arriving at the website in week 2
increases when the users are allocated to advertising in week 2, having been exposed to advertising in week 1. Overall, the
figure shows that the effectiveness of advertising in week 2 increases with the advertising level in week 1. In other words,
advertising in week 1 complements advertising in week 2 (p-value=0.018).
65
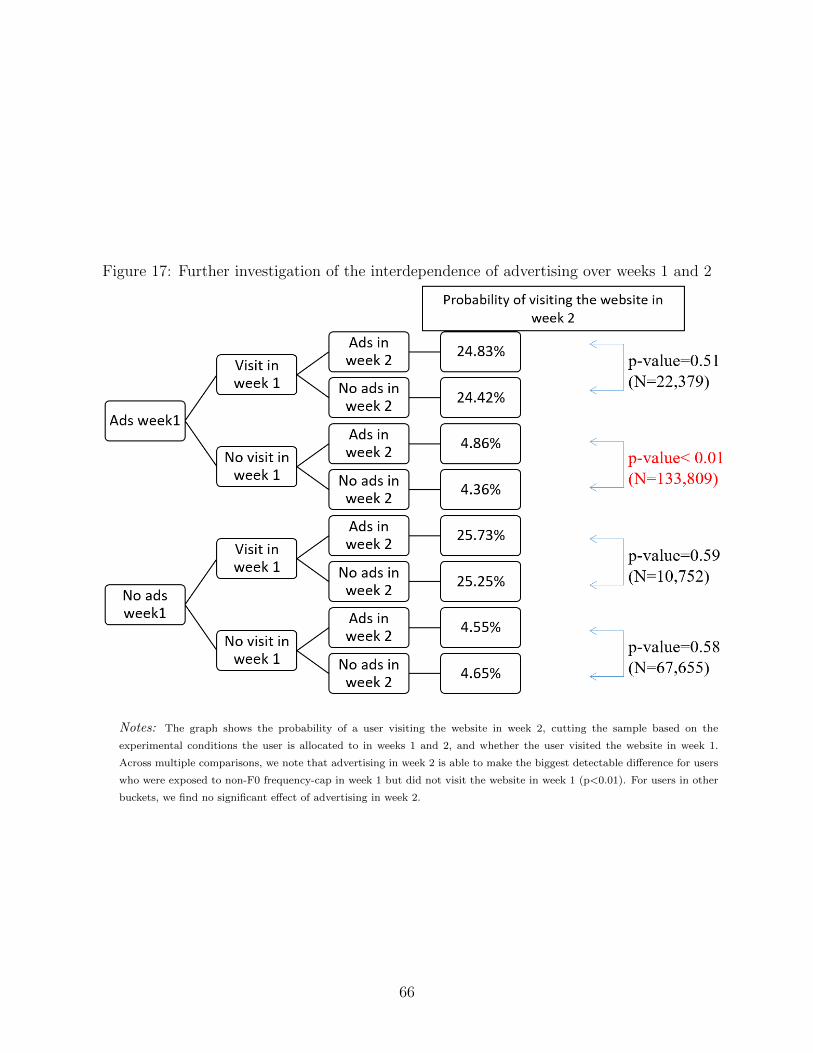
Figure 17: Further investigation of the interdependence of advertising over weeks 1 and 2
Notes: The graph shows the probability of a user visiting the website in week 2, cutting the sample based on the
experimental conditions the user is allocated to in weeks 1 and 2, and whether the user visited the website in week 1.
Across multiple comparisons, we note that advertising in week 2 is able to make the biggest detectable difference for users
who were exposed to non-F0 frequency-cap in week 1 but did not visit the website in week 1 (p<0.01). For users in other
buckets, we find no significant effect of advertising in week 2.
66

Figure 18: Screenshots showing advertisers occupying multiple ad-slots on the same page
Notes: The graph displays two examples of a common situation in which the same advertiser occupies multiple slots on
the same page. The screenshot on the left shows a page with two ads by BuildDirect, and the one on the right shows a
page with two ads from LumberLiquidator, which is BuildDirect’s competitor
67


