

An introduction to the NRAC formula and the work of TAGRA

Needs based formula
To enable every person in Scotland to have equal access to high quality health
services according to their need
• Based on population – but just a start

Resource allocation in practice
Relative need due to
morbidity and life
circumstances
Additional Needs
×
Unavoidable Excess Costs of
Supply
Relative costs of
providing services to
different geographical
areas
×
NRACWeighted
Target Share
%
═
Relative need due to age and sex profile×
Age-Sex Cost Weights
Population
Board population
share%
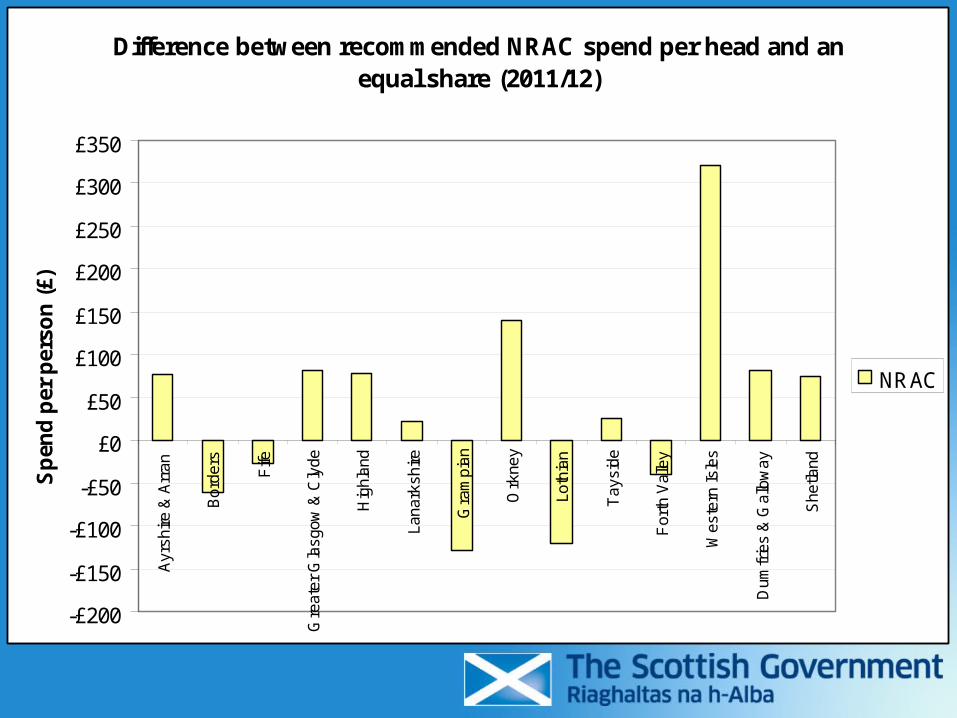
Difference between recommended NRAC spend per head and an equal share (2011/12)
-£200
-£150
-£100
-£50
£0
£50
£100
£150
£200
£250
£300
£350A
yrsh
ire &
Arr
an
Bor
ders
Fife
Gre
ater
Gla
sgow
& C
lyde
Hig
hlan
d
Lana
rksh
ire
Gra
mpi
an
Ork
ney
Loth
ian
Tay
side
For
th V
alle
y
Wes
tern
Isle
s
Dum
frie
s &
Gal
low
ay
She
tland
Sp
end
per
per
son
(£)
NRAC
Difference between recommended NRAC spend per head and an equal share (2011/12) - Population
-200
-150
-100
-50
0
50
100
150
200
250
300
350A
yrsh
ire &
Arr
an
Bor
ders
Fife
Gre
ater
Gla
sgow
& C
lyde
Hig
hlan
d
Lana
rksh
ire
Gra
mpi
an
Ork
ney
Loth
ian
Tay
side
For
th V
alle
y
Wes
tern
Isle
s
Dum
frie
s &
Gal
low
ay
She
tland
Sp
end
per
per
son
(£)

Difference between recommended NRAC spend per head and an equal share (2011/12) - Age sex
-£200
-£150
-£100
-£50
£0
£50
£100
£150
£200
£250
£300
£350
Ayr
shire
& A
rran
Bor
ders
Fife
Gre
ater
Gla
sgow
& C
lyde
Hig
hlan
d
Lana
rksh
ire
Gra
mpi
an
Ork
ney
Loth
ian
Tay
side
For
th V
alle
y
Wes
tern
Isle
s
Dum
frie
s &
Gal
low
ay
She
tland
Sp
end
per
per
son
(£)
Age-sex

Difference between recommended NRAC spend per head and an equal share (2011/12) - Age sex and MLC (cumulative)
-£200
-£150
-£100
-£50
£0
£50
£100
£150
£200
£250
£300
£350A
yrsh
ire &
Arr
an
Bor
ders
Fife
Gre
ater
Gla
sgow
& C
lyde
Hig
hlan
d
Lana
rksh
ire
Gra
mpi
an
Ork
ney
Loth
ian
Tay
side
For
th V
alle
y
Wes
tern
Isle
s
Dum
frie
s &
Gal
low
ay
She
tland
Sp
end
per
per
son
(£)
Age-sex
MLC

Difference between recommended NRAC spend per head and an equal share (2011/12) - MLC and UXC (cumulative)
-£200
-£150
-£100
-£50
£0
£50
£100
£150
£200
£250
£300
£350A
yrsh
ire &
Arr
an
Bor
ders
Fife
Gre
ater
Gla
sgow
& C
lyde
Hig
hlan
d
Lana
rksh
ire
Gra
mpi
an
Ork
ney
Loth
ian
Tay
side
For
th V
alle
y
Wes
tern
Isle
s
Dum
frie
s &
Gal
low
ay
She
tland
Sp
end
per
per
son
(£)
MLC
UXC

Difference between recommended NRAC spend per head and an equal share (2011/12)
-£200
-£150
-£100
-£50
£0
£50
£100
£150
£200
£250
£300
£350A
yrsh
ire &
Arr
an
Bor
ders
Fife
Gre
ater
Gla
sgow
& C
lyde
Hig
hlan
d
Lana
rksh
ire
Gra
mpi
an
Ork
ney
Loth
ian
Tay
side
For
th V
alle
y
Wes
tern
Isle
s
Dum
frie
s &
Gal
low
ay
She
tland
Sp
end
per
per
son
(£)
NRAC

Difference between recommended NRAC spend per head and an equal share (2011/12) - Overall and HCHS
-£200
-£150
-£100
-£50
£0
£50
£100
£150
£200
£250
£300
£350
£400A
yrsh
ire &
Arr
an
Bor
ders
Fife
Gre
ater
Gla
sgow
& C
lyde
Hig
hlan
d
Lana
rksh
ire
Gra
mpi
an
Ork
ney
Loth
ian
Tay
side
For
th V
alle
y
Wes
tern
Isle
s
Dum
frie
s &
Gal
low
ay
She
tlandS
pen
d p
er p
erso
n (
£)
OverallNRAC
HCHSNRAC

Data sources
• Does not use SIMD
• Does not use data zones
• Requires national data
• Requires small area data
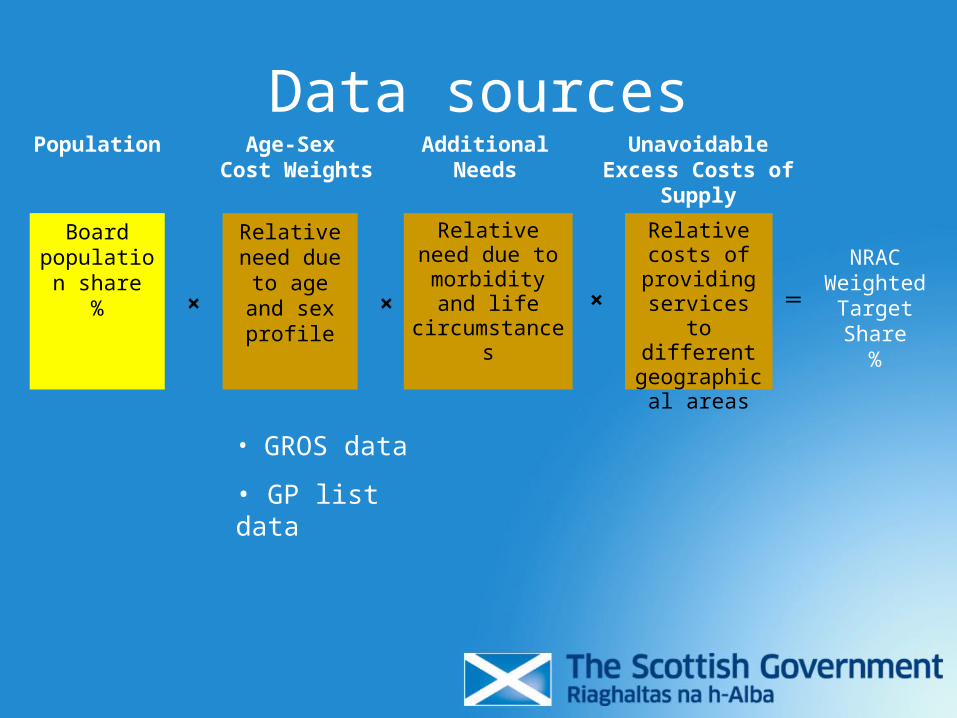
Data sources
Relative need due to age and sex
profile
Relative need due to morbidity
and life circumstances
Relative costs of providing services to
different geographical
areas
NRACWeighted
Target Share
%
Unavoidable Excess Costs of
Supply
Population Additional Needs
× × × ═
Age-Sex Cost Weights
Board population
share%
• GROS data
• GP list data

• Differs by specialty – SFR 5s
• Up to 20 different age bands
Data sources
Relative need due to age and sex
profile
Relative need due to morbidity
and life circumstances
Relative costs of providing services to
different geographical
areas
NRACWeighted
Target Share
%
Unavoidable Excess Costs of
Supply
Population Additional Needs
× × × ═
Age-Sex Cost Weights
Board population
share%

Acute and Care of the Elderly
• Standardized mortality rates
• Long term limiting illness rate
Maternity
• Mean house price
• Birth rate
Data sources
Relative need due to age and sex
profile
Relative need due to morbidity
and life circumstances
Relative costs of providing services to
different geographical
areas
NRACWeighted
Target Share
%
Unavoidable Excess Costs of
Supply
Population Additional Needs
× × × ═
Age-Sex Cost Weights
Board population
share%

Mental health and learning difficulties
• Severe disablement allowance
• % living in one person households
• % living in socially rented housing
Data sources
Relative need due to age and sex
profile
Relative need due to morbidity
and life circumstances
Relative costs of providing services to
different geographical
areas
NRACWeighted
Target Share
%
Unavoidable Excess Costs of
Supply
Population Additional Needs
× × × ═
Age-Sex Cost Weights
Board population
share%

• Urban rural classification
• Community travel survey
• SAF remoteness adjustment
Data sources
Relative need due to age and sex
profile
Relative need due to morbidity
and life circumstances
Relative costs of providing services to
different geographical
areas
NRACWeighted
Target Share
%
Unavoidable Excess Costs of
Supply
Population Additional Needs
× × × ═
Age-Sex Cost Weights
Board population
share%

TAGRA

Background to TAGRA
• Formed after NRAC report
• Maintains and develops formula
• Brings together Government, NHS Boards, and academics
• Forum for stakeholder engagement
• Work programme of improvements

Members – from boardsRichard Copeland NHS GG&C
Garry Coutts NHS Highland
Karen Facey NHS Forth Valley
Malcolm Iredale NHS Highland
Alan Gall NHS Grampian
Douglas Griffin NHS GG&C
Fiona Ramsay NHS Forth Valley
Andrew Richmond NHS Tayside
John Ross Scott NHS Orkney
George Walker NHS Lothian

Recent work
• The impact of the NRAC formula on remote and rural areas of Scotland
• Overall, treatment appropriate
• Areas for further work

2011/12 work plan
• Further work on remote and rural issues
• Review of MLC adjustment

Questions?


