
CEMAC – Clean Energy Manufacturing Analysis Center 1
Analysis of Manufacturing Clean Energy Technologies & CEMAC Benchmark Report
Jill Engel-Cox, Ph.D., Director, CEMAC Brian Walker, Ph.D, DOE EERE Presentation to the Department of Commerce Renewable Energy and Energy Efficiency Advisory Committee (REEEAC) 24 May 2016

CEMAC – Clean Energy Manufacturing Analysis Center 2
Summary
1. Clean Energy Manufacturing Analysis Center 2. Example of Clean Energy Manufacturing Analysis 3. Benchmark Report Development 4. Questions, Answers, and Discussion
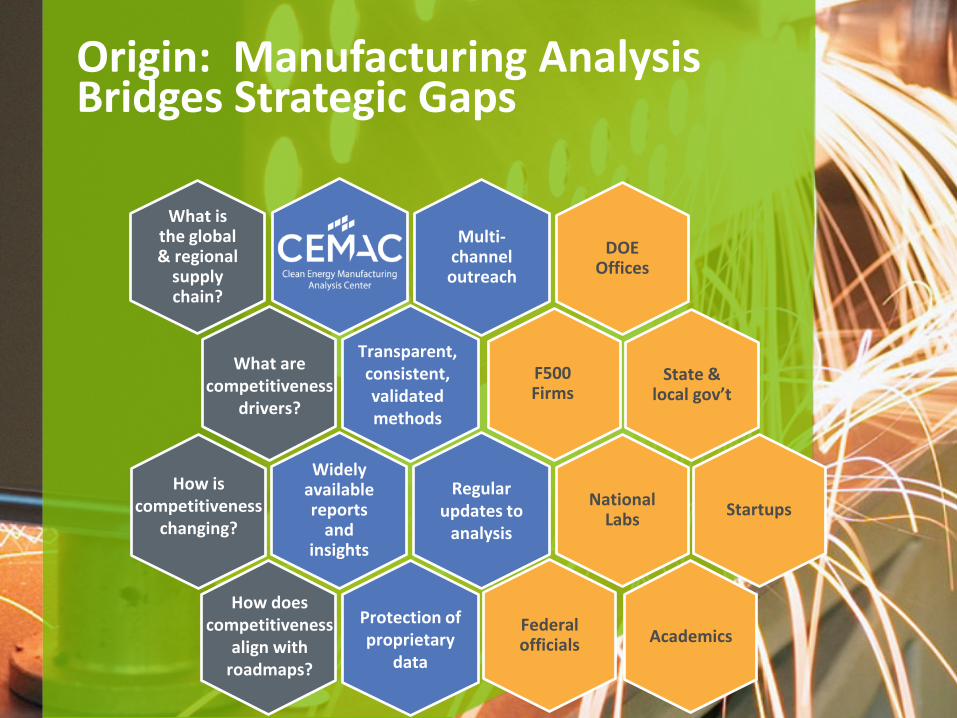
Origin: Manufacturing Analysis Bridges Strategic Gaps
National Labs
DOE Offices
Startups
Federal officials
State & local gov’t
Academics
F500 Firms
What is the global & regional
supply chain?
How is competitiveness
changing?
How does competitiveness
align with roadmaps?
What are competitiveness
drivers?
Widely available reports
and insights
Regular updates to
analysis
Multi-channel outreach
Transparent, consistent, validated methods
Protection of proprietary
data

CEMAC – Clean Energy Manufacturing Analysis Center 4
Focus on Clean Energy Technologies
Clean energy technologies are those that: 1.produce energy with fewer
environmental impacts than conventional technologies, or
2.enable existing technologies to operate more efficiently, consuming fewer natural resources
3.includes renewable energy, cleaner non-renewable energy, and energy efficiency technologies
4.applications in electricity generation, fuel production, and sustainable transportation
Wide Band Gap Devices
for Industrial
Motors
Hydrogen Filling Stations
Additive Manufacturing: Wind & Hydro
Biomass-Derived
Chemicals & Products
Energy-Efficient
Insulated Windows
Conventional and Advanced Heat Pumps
LED Commercial
Lighting
Geothermal Binary Power
Plants
Li-ion Batteries
Wind
Carbon Fiber
PV
CEMAC – Clean Energy Manufacturing Analysis Center 5
CEMAC Vision & Mission
The Clean Energy Manufacturing Analysis Center (CEMAC) will be a definitive world leader of credible, objective, and recurring global clean energy manufacturing analysis to promote the transition to a clean energy economy. The Clean Energy Manufacturing Analysis Program will: • Deliver world class analysis, benchmarking, and insights of supply chains
and manufacturing for clean energy technologies • Engage decisionmakers to inform their decisions on investment strategies
and policy to promote economic growth and competitiveness in the transition to a clean energy economy
• Develop innovative models and tools, distinctive talent, and unique and high-impact publications
• Increase capacity of other analysts to conduct clean energy manufacturing analysis through collaboration and training
CEMAC – Clean Energy Manufacturing Analysis Center 6
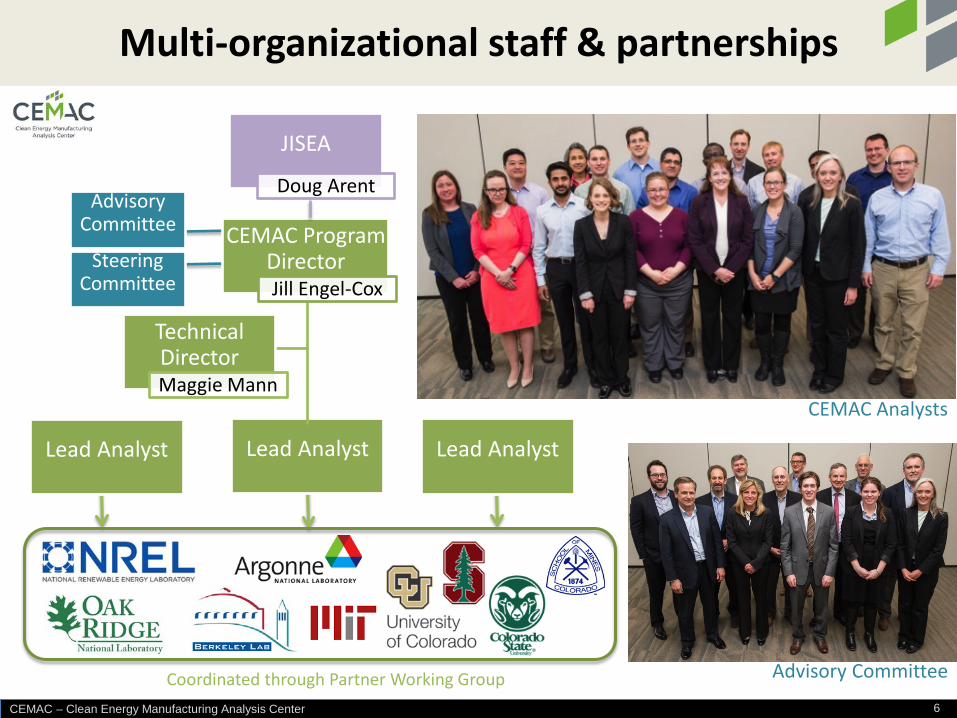
Multi-organizational staff & partnerships
Advisory Committee CEMAC Program
Director Jill Engel-Cox
Lead Analyst
Technical Director Maggie Mann
JISEA
Doug Arent
Lead Analyst Lead Analyst
Coordinated through Partner Working Group
Steering Committee
Advisory Committee
CEMAC Analysts
CEMAC – Clean Energy Manufacturing Analysis Center 7
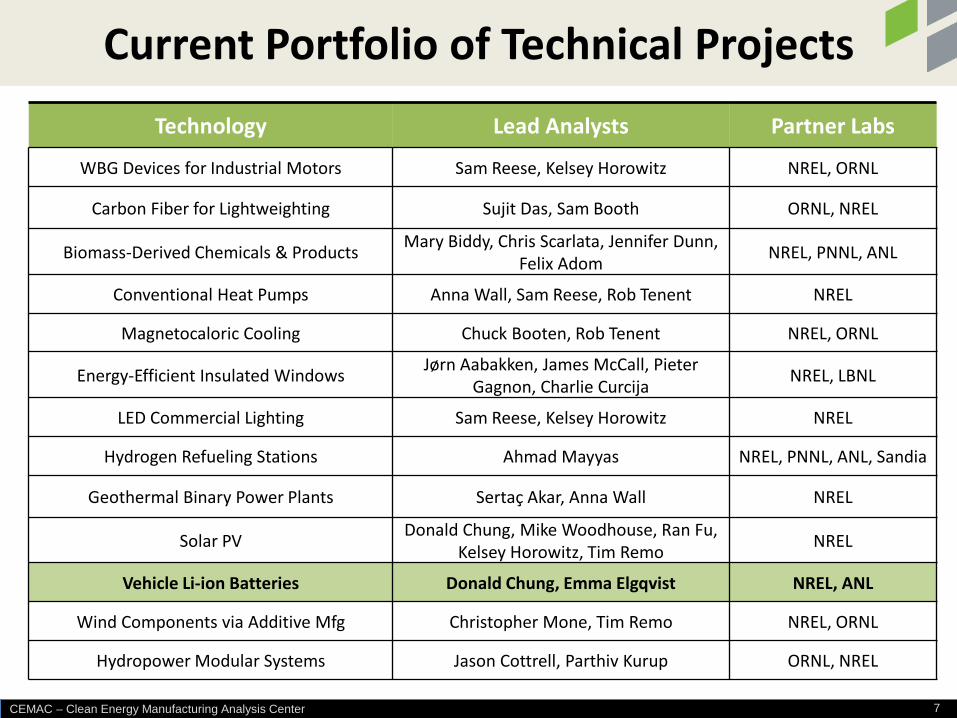
Current Portfolio of Technical Projects Technology Lead Analysts Partner Labs
WBG Devices for Industrial Motors Sam Reese, Kelsey Horowitz NREL, ORNL
Carbon Fiber for Lightweighting Sujit Das, Sam Booth ORNL, NREL
Biomass-Derived Chemicals & Products Mary Biddy, Chris Scarlata, Jennifer Dunn, Felix Adom NREL, PNNL, ANL
Conventional Heat Pumps Anna Wall, Sam Reese, Rob Tenent NREL
Magnetocaloric Cooling Chuck Booten, Rob Tenent NREL, ORNL
Energy-Efficient Insulated Windows Jørn Aabakken, James McCall, Pieter Gagnon, Charlie Curcija NREL, LBNL
LED Commercial Lighting Sam Reese, Kelsey Horowitz NREL
Hydrogen Refueling Stations Ahmad Mayyas NREL, PNNL, ANL, Sandia
Geothermal Binary Power Plants Sertaç Akar, Anna Wall NREL
Solar PV Donald Chung, Mike Woodhouse, Ran Fu, Kelsey Horowitz, Tim Remo NREL
Vehicle Li-ion Batteries Donald Chung, Emma Elgqvist NREL, ANL
Wind Components via Additive Mfg Christopher Mone, Tim Remo NREL, ORNL
Hydropower Modular Systems Jason Cottrell, Parthiv Kurup ORNL, NREL

Automotive Lithium-ion Battery (LIB) Supply Chain
Donald Chung, Emma Elgqvist, CEMAC With contributions from experts at Argonne National Laboratory, National Renewable Energy Laboratory, U.S. Department of Energy, and Industry Partners
CEMAC – Clean Energy Manufacturing Analysis Center 9
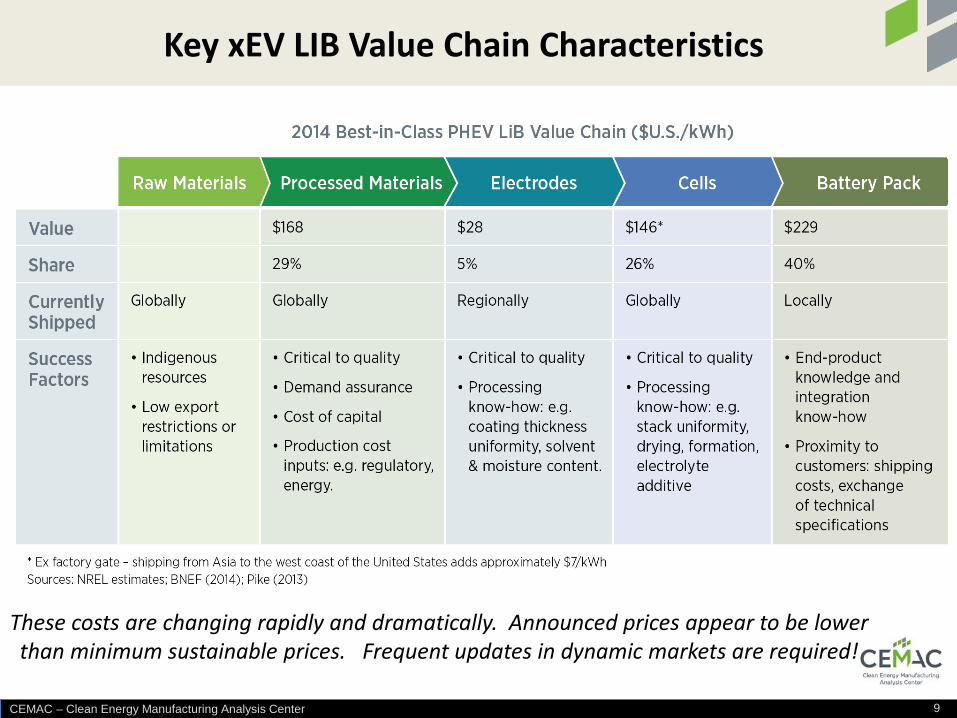
Key xEV LIB Value Chain Characteristics
These costs are changing rapidly and dramatically. Announced prices appear to be lower than minimum sustainable prices. Frequent updates in dynamic markets are required!

CEMAC ▪ Clean Energy Manufacturing Analysis Center ▪ ManufacturingCleanEnergy.org 10 CEMAC ▪ Clean Energy Manufacturing Analysis Center ▪ ManufacturingCleanEnergy.org
LIB Cell Manufacturing Locations and Capacity: Today, LIB Cell Manufacturing Is Heavily Concentrated in Asia…
Note: This map includes factories that are fully and partially commissioned, under construction, and announced. Capacity is not disclosed for all factories. Source: Corporate reporting. Bloomberg New Energy Finance BNEF (2016).
CEMAC ▪ Clean Energy Manufacturing Analysis Center ▪ ManufacturingCleanEnergy.org CEMAC ▪ Clean Energy Manufacturing Analysis Center ▪ ManufacturingCleanEnergy.org
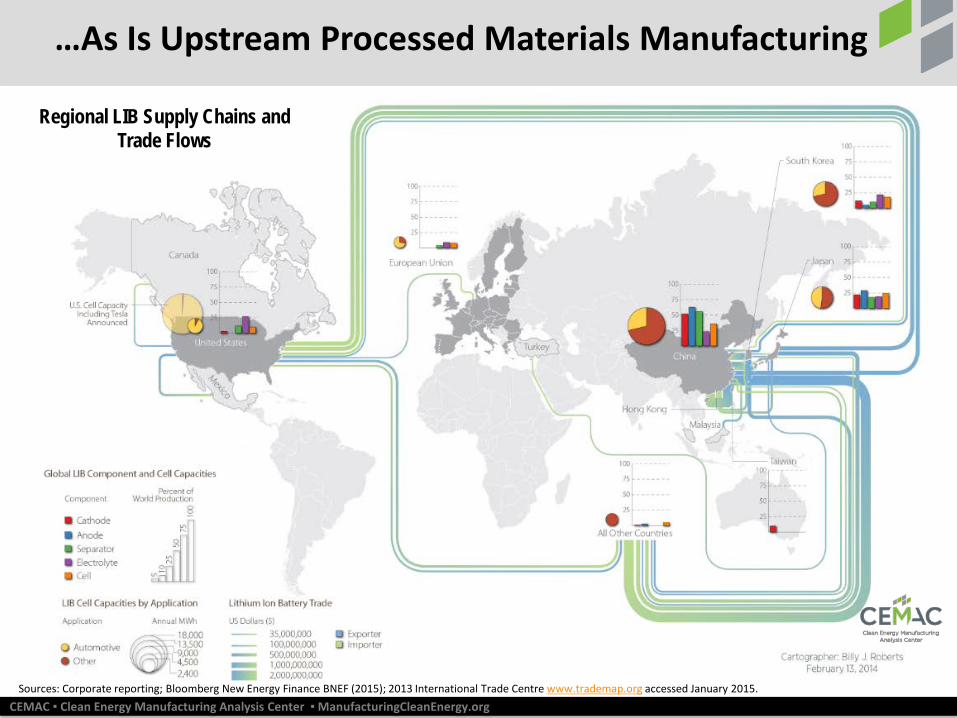
…As Is Upstream Processed Materials Manufacturing
Regional LIB Supply Chains and Trade Flows
Sources: Corporate reporting; Bloomberg New Energy Finance BNEF (2015); 2013 International Trade Centre www.trademap.org accessed January 2015.

CEMAC ▪ Clean Energy Manufacturing Analysis Center ▪ ManufacturingCleanEnergy.org
Sources of raw materials for Lithium Ion Batteries
CEMAC ▪ Clean Energy Manufacturing Analysis Center ▪ ManufacturingCleanEnergy.org CEMAC ▪ Clean Energy Manufacturing Analysis Center ▪ ManufacturingCleanEnergy.org
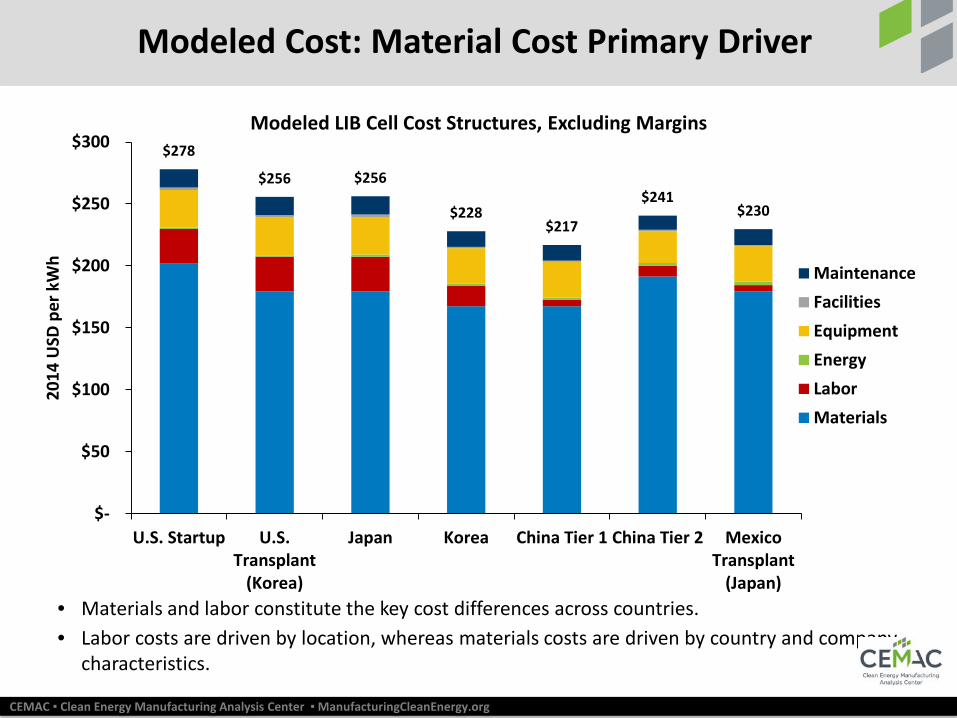
Modeled Cost: Material Cost Primary Driver
• Materials and labor constitute the key cost differences across countries. • Labor costs are driven by location, whereas materials costs are driven by country and company
characteristics.
Modeled LIB Cell Cost Structures, Excluding Margins $278
$256 $256
$228 $217
$241 $230
$-
$50
$100
$150
$200
$250
$300
U.S. Startup U.S.Transplant
(Korea)
Japan Korea China Tier 1 China Tier 2 MexicoTransplant
(Japan)
2014
USD
per
kW
h
MaintenanceFacilitiesEquipmentEnergyLaborMaterials
CEMAC – Clean Energy Manufacturing Analysis Center 14
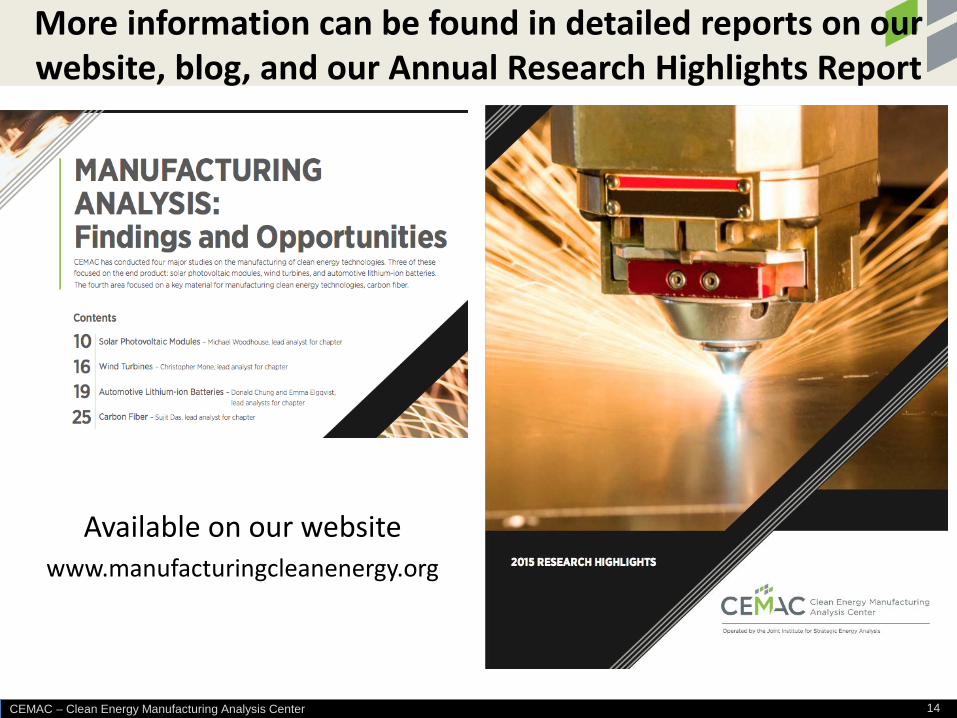
More information can be found in detailed reports on our website, blog, and our Annual Research Highlights Report
Available on our website www.manufacturingcleanenergy.org
14

Benchmark Report
Debbie Sandor, David Keyser, Donald Chung, CEMAC With contributions from experts at Colorado School of Mines, Colorado State University, and the CEMAC Advisory Committee
CEMAC – Clean Energy Manufacturing Analysis Center 16
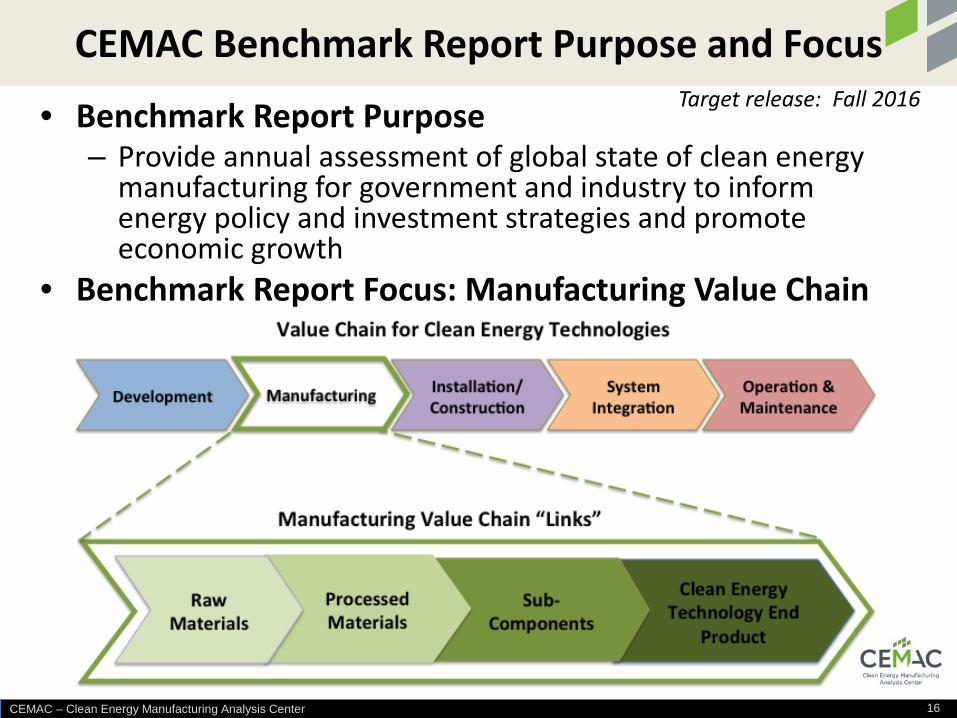
• Benchmark Report Purpose – Provide annual assessment of global state of clean energy
manufacturing for government and industry to inform energy policy and investment strategies and promote economic growth
• Benchmark Report Focus: Manufacturing Value Chain
16
CEMAC Benchmark Report Purpose and Focus Target release: Fall 2016
CEMAC – Clean Energy Manufacturing Analysis Center 17
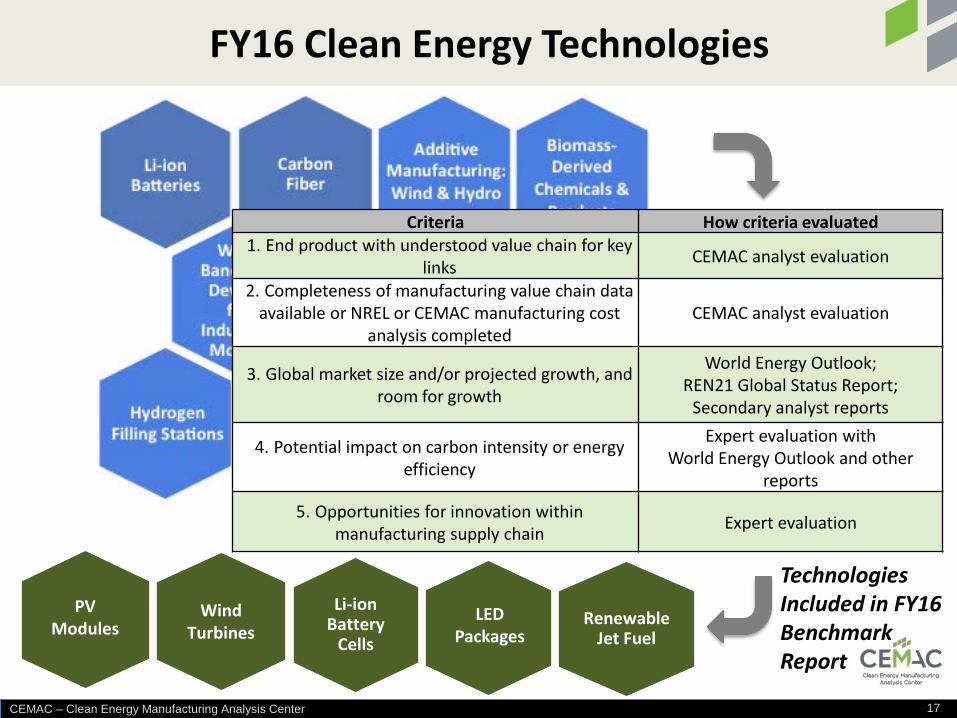
FY16 Clean Energy Technologies
Technologies Included in FY16 Benchmark Report
Renewable Jet Fuel
LED Packages
Li-ion Battery
Cells
Wind Turbines
PV Modules
Criteria How criteria evaluated 1. End product with understood value chain for key
links CEMAC analyst evaluation
2. Completeness of manufacturing value chain data available or NREL or CEMAC manufacturing cost
analysis completed CEMAC analyst evaluation
3. Global market size and/or projected growth, and room for growth
World Energy Outlook; REN21 Global Status Report;
Secondary analyst reports
4. Potential impact on carbon intensity or energy efficiency
Expert evaluation with World Energy Outlook and other
reports
5. Opportunities for innovation within manufacturing supply chain Expert evaluation
CEMAC – Clean Energy Manufacturing Analysis Center 18
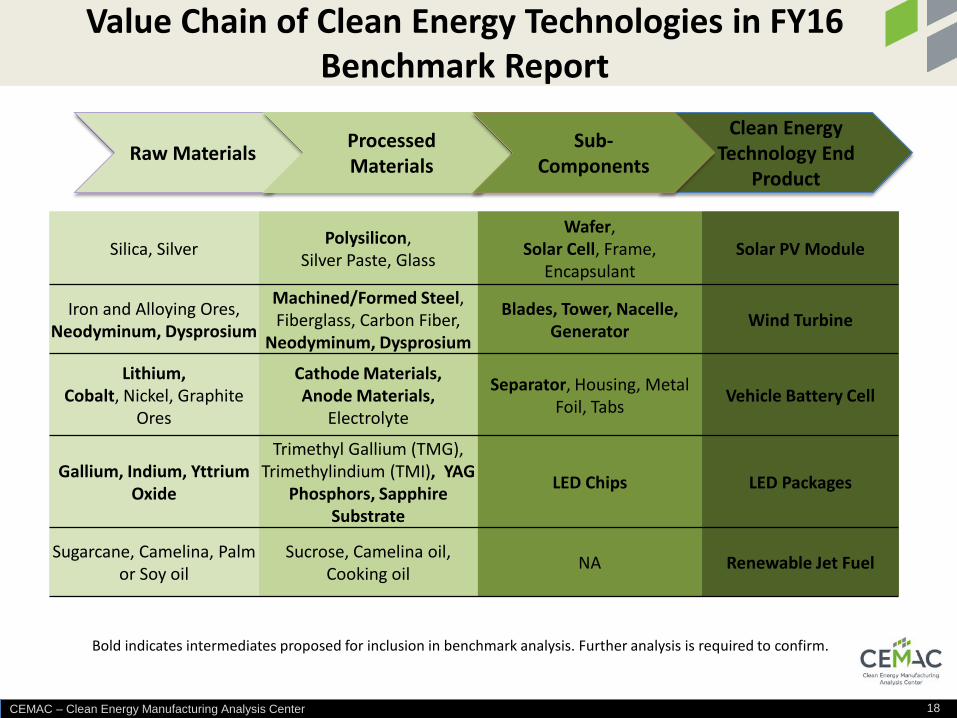
Silica, Silver Polysilicon, Silver Paste, Glass
Wafer, Solar Cell, Frame,
Encapsulant Solar PV Module
Iron and Alloying Ores, Neodyminum, Dysprosium
Machined/Formed Steel, Fiberglass, Carbon Fiber,
Neodyminum, Dysprosium
Blades, Tower, Nacelle, Generator Wind Turbine
Lithium, Cobalt, Nickel, Graphite
Ores
Cathode Materials, Anode Materials,
Electrolyte
Separator, Housing, Metal Foil, Tabs Vehicle Battery Cell
Gallium, Indium, Yttrium Oxide
Trimethyl Gallium (TMG), Trimethylindium (TMI), YAG
Phosphors, Sapphire Substrate
LED Chips LED Packages
Sugarcane, Camelina, Palm or Soy oil
Sucrose, Camelina oil, Cooking oil NA Renewable Jet Fuel
Raw Materials Processed Materials
Clean Energy Technology End
Product
Sub-Components
Bold indicates intermediates proposed for inclusion in benchmark analysis. Further analysis is required to confirm.
Value Chain of Clean Energy Technologies in FY16 Benchmark Report

CEMAC – Clean Energy Manufacturing Analysis Center 19
FY16 Benchmark Report Countries
• South Korea • Taiwan • UK • US
• Brazil • Canada • China • Germany
• India • Japan • Malaysia • Mexico
Criteria for inclusion include: • Market size • Manufacturing capacity across the value chain • Data availability (trade and I-O databases)

CEMAC – Clean Energy Manufacturing Analysis Center 20
Proposed CEMAC Benchmarks Benchmark Definition Scope
Trade/Economic Benchmarks
All benchmarks estimated:
• By country • By technology • By value chain
“link” • Aggregated across
technologies
Manufacturing Value Added
Comprehensive estimate of clean energy manufacturing contribution to national and global economies
Trade Flows International snapshot of clean energy trade activity across the manufacturing value chain
Market Benchmarks
Market Size Clean energy technology market size to indicate their relative importance within countries and globally
Manufacturing Capacity and Production
Clean energy manufacturing capacity and utilization around the world
Manufacturing Value Added is expected to be the single most important metric that will be reported every year as a barometer of how the U.S. and other nations
are doing in terms of manufacturing value add creation, in each relevant technology and in aggregate across all covered clean energy technologies

CEMAC – Clean Energy Manufacturing Analysis Center 21
CEMAC Benchmark Methodologies and Data Sources Benchmark Key Goal(s) Approach Data/Data Sources
Trade/Economic Benchmarks
Value Added
• Provide comprehensive estimate of clean energy manufacturing contribution to national and global economies
• Using I-O data for relevant manufacturing industries, the revenues from technology cost analysis can be used to estimate the value added of known inputs to that technology.
• OCED I-O database; World I-O database; U.S. Bureau of Economic Analysis (BEA); IMPLAN*; CEMAC/ EERE/ NREL clean energy technology manufacturing analysis
Trade Flows
• Provide international snapshot of clean energy trade activity across the manufacturing value chain
• The value of trade flows can be derived from imports and exports data using estimates of clean energy manufacturing contributions based on other published studies.
• U.S. ITC database on imports and exports: World Trade Atlas
Market Benchmarks
Market Size
• Provide insight into relative importance of clean energy technologies within countries and across the globe
• Published industry-specific data can be synthesized to estimate the total global and top country market size.
• Market reports and other secondary sources; customized reports via market research firms and consultants Manufacturing
Capacity/Production
• Provide insight into clean energy manufacturing capacity utilization around the world
• Published industry-specific market data can be synthesized to estimate manufacturing capacity and production.
CEMAC – Clean Energy Manufacturing Analysis Center 22
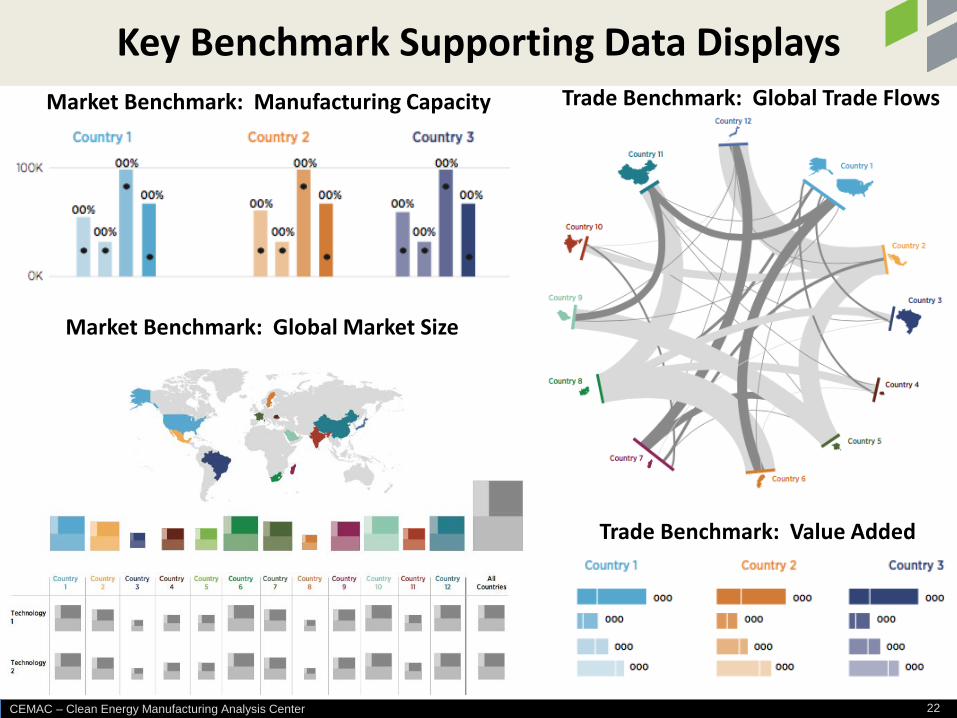
Key Benchmark Supporting Data Displays Trade Benchmark: Global Trade Flows
Trade Benchmark: Value Added
Market Benchmark: Global Market Size
Market Benchmark: Manufacturing Capacity

CEMAC – Clean Energy Manufacturing Analysis Center 23
• Next Steps for Benchmark Report – Complete analysis and draft Benchmark Report (mid to late June) – Benchmark Report review/revision (July – Aug) – Publish FY16 Benchmark Report (Fall)
• Contribution of Department of Commerce – Receiving expert advice and review from staff at International Trade
Administration and others at DOC – Interested in input to make Benchmark report and other studies useful to
government and industry
• CEMAC would like to increase collaboration with partners – Sponsored proprietary or open analysis – Jointly sponsored sector studies with similar industries and agencies – Share information to contribute to studies
CEMAC Benchmark Report Next Steps and How You Might Contribute

CEMAC ▪ Clean Energy Manufacturing Analysis Center ▪ ManufacturingCleanEnergy.org CEMAC ▪ Clean Energy Manufacturing Analysis Center ▪ ManufacturingCleanEnergy.org
Questions, Answers, and Discussion
Thank you!
Website: www.manufacturingcleanenergy.org

CEMAC – Clean Energy Manufacturing Analysis Center 25
CEMAC Advisory Committee provides input Paul Camuti Senior Vice President Innovation & Chief Technology Officer Ingersoll-Rand, Davidson, NC Tom Catania, Chair Executive in Residence, ERB Institute University of Michigan, Ann Arbor, MI Dylan Cooper Lead Energy Marketing Specialist The Dow Chemical Company Houston, TX Phyllis Cuttino Director, Clean Energy Initiative The Pew Charitable Trusts, Washington, DC David Eaglesham Chief Executive Officer Pellion Technologies Cambridge, MA Steven Freilich DuPont Central R&D (Emeritus) Ford, PA
Victoria Gunderson International Trade Specialist Department of Commerce Washington, DC Paul Kaleta Executive Vice President First Solar, Inc., Tempe, AZ Wayne Mays Director, Engineering Iberdrola Renewables Portland, OR Ken Ostrowski Director, McKinsey & Co. Atlanta, GA Ryan Preclaw Director in Credit Strategy Barclays, New York, NY Swami Venkataraman Vice President – Senior Credit Officer, Global Project & Infrastructure Finance Moody’s Investors Service New York, NY Charles W. Wessner
Professor, Global Innovation Policy Georgetown University, Washington, DC Matt Zaluzec Manager of the Materials and Manufacturing Research Ford Motor Company Canton, MI

CEMAC – Clean Energy Manufacturing Analysis Center 26
Summary of manufacturing analysis types Analysis Type Sample Outputs Benefits
1. Supply Chain Analysis
• Identification of key supply chain links, and their geographic distribution
• Supply curves for critical or scarce elements
• Improved understanding of potentially risky elements within the supply chain
• Combined with cost modeling, enables quantitative analysis of impacts to production costs
2. Bottom-up Cost Analysis
• Detailed engineering analysis of production processes
• Cost structure and drivers at each process stage and link in value chain
• Benchmarking of current costs
• Development, analysis, and validation of manufacturing technology value propositions
• Analytical basis for setting technology cost, price, and performance targets
3. Technology Manufacturing
Roadmaps
• Cost-benefit analysis of proposed technology performance and manufacturing process improvements
• Rigorous method to compare technology development pathways
• Identification and prioritization of R&D areas based on cost and technology impacts
4. Site Selection Support and
Dynamic Modeling
• Analysis of regional differences in production costs
• Analysis of location and other contextual information impacting manufacturing
• Models of change scenarios and effect on manufacturing costs and supply chains
• Better informed decision making for siting facilities and sourcing materials and components
• Informed feasibility assessment of manufacturing locations, both domestic and internationally
• Identification of risks with most impact and of mitigation approaches

CEMAC – Clean Energy Manufacturing Analysis Center 27
Elements of Manufacturing Analysis
• Innovation potential • Manufacturing experience: Learn
by Doing • Intellectual property • Cost of energy • Cost of manufacturing • Availability of investment capital • Low-cost labor requirements &
availability • Product quality • Skilled labor requirements &
availability • Tax policy • Currency fluctuations • Import and export policies
• Availability of a reliable grid • Automation/advanced
manufacturing • Raw material availability • Ease of transportation • Existing supply chains • Synergistic industries and
clustering • Existing or growing market • Ease of doing business • Safety • Regulations • Inventory costs and supply chain
delays
CEMAC – Clean Energy Manufacturing Analysis Center 28
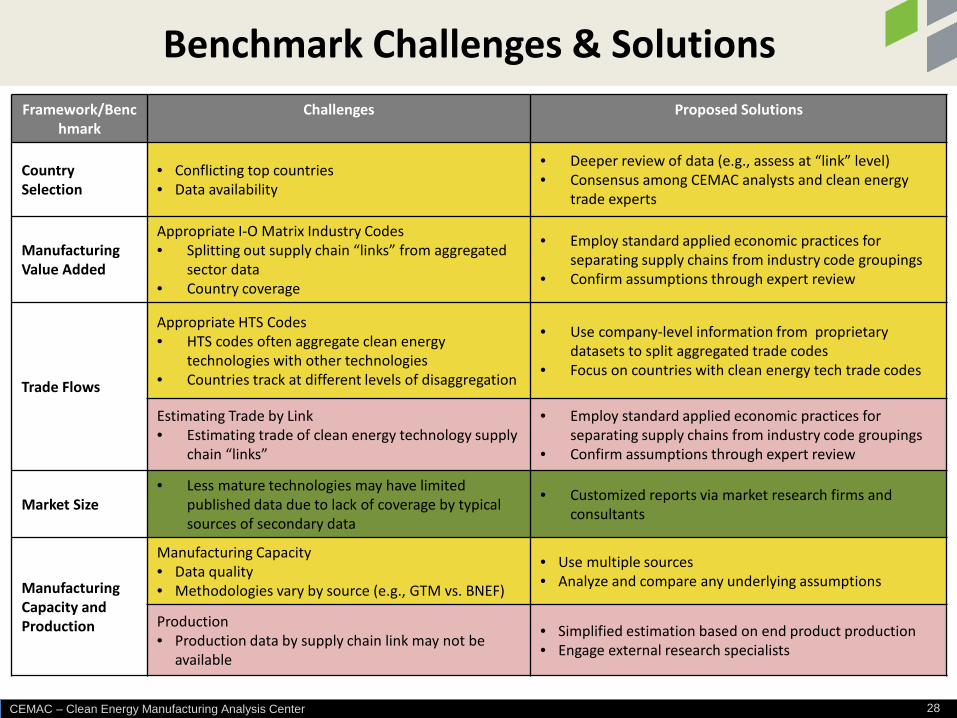
Benchmark Challenges & Solutions Framework/Benc
hmark Challenges Proposed Solutions
Country Selection
• Conflicting top countries • Data availability
• Deeper review of data (e.g., assess at “link” level) • Consensus among CEMAC analysts and clean energy
trade experts
Manufacturing Value Added
Appropriate I-O Matrix Industry Codes • Splitting out supply chain “links” from aggregated
sector data • Country coverage
• Employ standard applied economic practices for separating supply chains from industry code groupings
• Confirm assumptions through expert review
Trade Flows
Appropriate HTS Codes • HTS codes often aggregate clean energy
technologies with other technologies • Countries track at different levels of disaggregation
• Use company-level information from proprietary datasets to split aggregated trade codes
• Focus on countries with clean energy tech trade codes
Estimating Trade by Link • Estimating trade of clean energy technology supply
chain “links”
• Employ standard applied economic practices for separating supply chains from industry code groupings
• Confirm assumptions through expert review
Market Size • Less mature technologies may have limited
published data due to lack of coverage by typical sources of secondary data
• Customized reports via market research firms and consultants
Manufacturing Capacity and Production
Manufacturing Capacity • Data quality • Methodologies vary by source (e.g., GTM vs. BNEF)
• Use multiple sources • Analyze and compare any underlying assumptions
Production • Production data by supply chain link may not be
available
• Simplified estimation based on end product production • Engage external research specialists

CEMAC – Clean Energy Manufacturing Analysis Center 29
The CEMAC approach integrates engagement and analysis
Proposal
Review literature
Cost model
Technical, market inputs
Project selection
Refine analysis
Publication
Informed by clients + stakeholders
Informed by industry
Suggestions from stakeholders
Based on industry-validated method
From industry interviews
From industry engagement
Feedback from industry, other stakeholders
Uptake by public, private sector
Impact


