

Analytics for NetApp E-Series AutoSupport Data
Using Big Data Technologies
Jialiang Zhang
Electrical Engineering and Computer SciencesUniversity of California at Berkeley
Technical Report No. UCB/EECS-2016-24
http://www.eecs.berkeley.edu/Pubs/TechRpts/2016/EECS-2016-24.html
May 1, 2016
Copyright © 2016, by the author(s).All rights reserved.
Permission to make digital or hard copies of all or part of this work forpersonal or classroom use is granted without fee provided that copies arenot made or distributed for profit or commercial advantage and that copiesbear this notice and the full citation on the first page. To copy otherwise, torepublish, to post on servers or to redistribute to lists, requires prior specificpermission.

Analytics for NetApp E-Series AutoSupport Data
Using Big Data Technologies
by
Jialiang Zhang
Masters Project Paper
Presented to the Faculty of the Graduate Division of
The University of California at Berkeley
in Partial Fulfillment
of the Requirements
for the Degree of
Master of Engineering in
Electrical Engineering and Computer Sciences
The University of California at Berkeley
May 2014
DO NOT CIRCULATE
ii
Acknowledgements
Many thanks to my faulty committee members Professor Lee Fleming and
Professor Michael Franklin, my industry advisors Jordan Hambleton and Mittha
Manjunath from NetApp, and my teammates Achal Pandey and Huisi Tong.

iii
Abstract
Analytics for NetApp E-Series AutoSupport Data
Using Big Data Technologies
Jialiang Zhang
University of California at Berkeley, 2014
Supervisor: Lee Fleming
Our capstone project, utilizing novel Big Data technology, was to help NetApp
Inc. develop the AutoSupport (ASUP) Ecosystem for their E-series products [1]. With
this software framework, NetApp Inc. was able to collect normalized data, perform
predictive analytics and generate effective solutions for its E-series products customers.
We used the Star Schema for the data warehousing structure and built seven dimension
tables and two fact tables to handle the plethora of E-series ASUP data. To refine our
decision and eliminate improper technologies, we made a comparison of many eligible
Big Data technologies with respect to their technical strengths and weaknesses. We
utilized the latest Spark/Shark Big Data technology developed by Berkeley AMPLab [2]
to construct the software framework. Additionally, to perform the featured predictive
analytics we used K-means Clustering and K-fold cross-validation machine learning
techniques on the normalized data set.
My main contribution in this project was to develop a parser to convert the
majority of the E-series product’s daily/weekly and event-based ASUP logs into the

iv
normalized data format. After performing multiple trials and the overall assessment of
both the difficulty and feasibility of different data parsing approaches, I recommended
the approach of parsing the text-based data in raw ASUP data set. Based on the
normalized data I generated, we then successfully built a prototype. And we expected that
with our ASUP framework and predictive data analysis function, NetApp would have
more power and efficiency in resolving the E-series product issue for its customer. At the
same time, our project on ASUP framework would revolutionize NetApp’s data storage
and customer support business and help the company exploit its niche market in the Big
Data industry.

v
Table of Contents
List of Tables ..........................................................................................................vi
List of Figures ....................................................................................................... vii
Chapter 1 Introduction ...........................................................................................1
1.1 Company and Products .............................................................................1
1.2 Project Overview.......................................................................................2
1.3 My Contributions ......................................................................................2
Chapter 2 Literature Review..................................................................................4
2.1 Competitors' Strategy ................................................................................4
2.2 NetApp's Strategy .....................................................................................6
Chapter 3 Methodology .........................................................................................8
3.1 ASUP Environment ..................................................................................9
3.2 Dataset.....................................................................................................10
3.3 Technology Comparison .........................................................................10
3.4 Data Storage Mechanism ........................................................................11
3.5 Data Parsing and Storing ........................................................................11
3.6 Data Querying and Insights ....................................................................12
Chapter 4 Discussion ...........................................................................................13
4.1 Technology Comparison Matrix .............................................................13
4.2 Data Parsing ............................................................................................14
4.3 Star Schema Data Structure ....................................................................17
Chapter 5 Conclusion...........................................................................................18
Appendix Data Parser Presentation Slides...........................................................20
Bibliography...........................................................................................................23
vi
List of Tables
Table 1: Existing Landscape of Data Storage and Analysis Market .................4
Table 2: Technology Comparison Matrix .......................................................13

vii
List of Figures
Figure 1: NetApp E2600 Storage System ..........................................................1
Figure 2: NetApp AutoSupport Infrastructure ...................................................9
Figure 3: ASUP Data Processing Using Binary -> XML
-> Tabular Format Approach ............................................................15
Figure 4: Star Schema Structure .......................................................................17
Page 1
Chapter 1: Introduction
1.1 COMPANY AND PRODUCTS
NetApp Inc. is a traditional computer storage and data management company. According
to International Data Corporation (IDC), in the second quarter of 2013, NetApp Inc. achieved
13.3% of market share in external disk storage systems [3]. Its major competitors are EMC
Corporation, International Business Machines Corporation (IBM), Seagate Technology PLC and
Western Digital Corporation (WD).
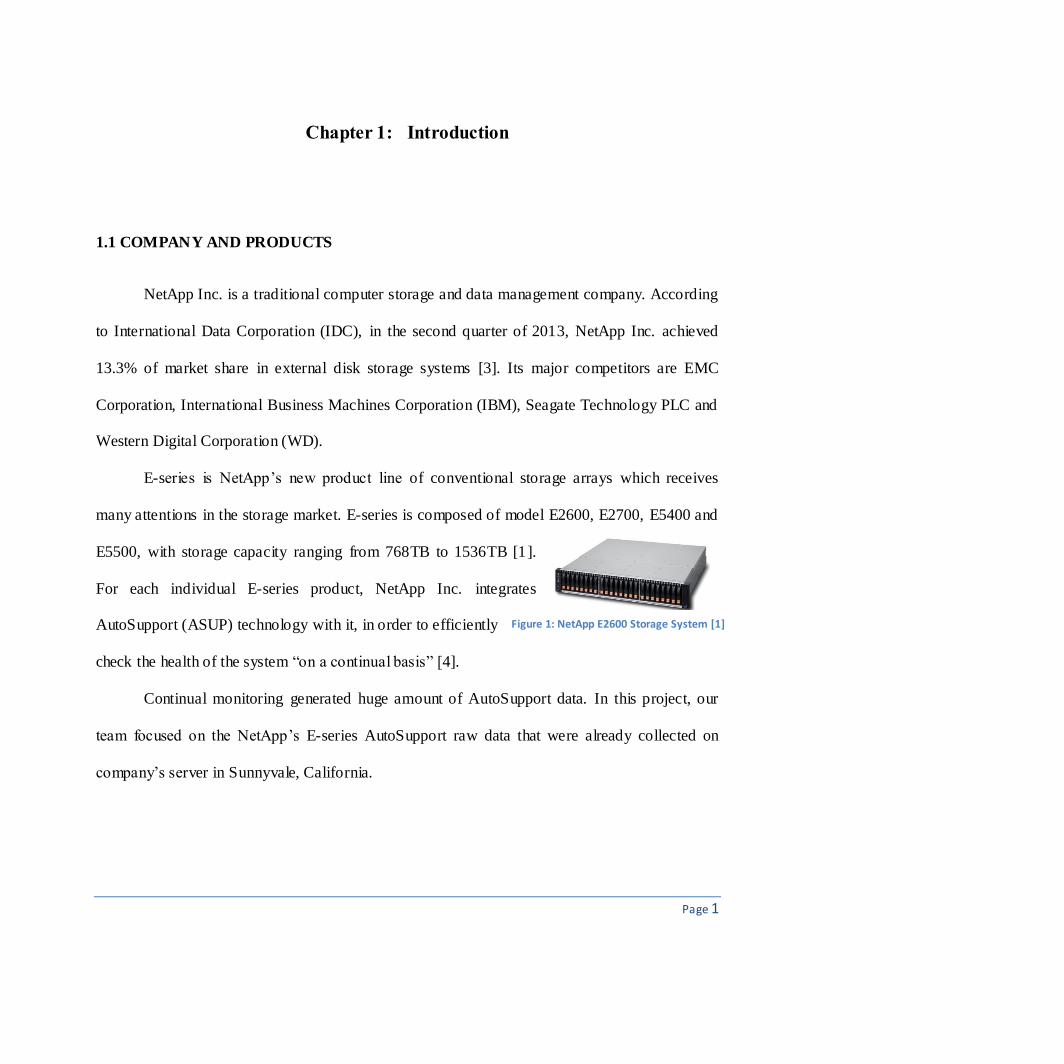
E-series is NetApp’s new product line of conventional storage arrays which receives
many attentions in the storage market. E-series is composed of model E2600, E2700, E5400 and
E5500, with storage capacity ranging from 768TB to 1536TB [1].
For each individual E-series product, NetApp Inc. integrates
AutoSupport (ASUP) technology with it, in order to efficiently
check the health of the system “on a continual basis” [4].
Continual monitoring generated huge amount of AutoSupport data. In this project, our
team focused on the NetApp’s E-series AutoSupport raw data that were already collected on
company’s server in Sunnyvale, California.
Figure 1: NetApp E2600 Storage System [1]

Page 2
1.2 PROJECT OVERVIEW
“Big Data” refers to the data that is “large or fast moving” and the current “conventional
databases and technologies” are not sufficient enough to analyze them.1The advent of Big Data
technologies, such as distributed systems and in-memory computing, data repository with SQL
compatibility and various machine learning algorithms have successfully “facilitated easier
analysis of large amounts of data”. 1 Our capstone project, utilizing novel Big Data technology,
is to help NetApp Inc. develop an AutoSupport (ASUP) Ecosystem for their E-series products.
At the customer end, plethora of daily/weekly E-series log files is generated worldwide
every day. What is more, when the E-series storage system encounters an abnormal event, for
example, a system level warning or a failure due to disk malfunction, an event-based log will be
filed immediately. With this software framework, NetApp is able to capture the significant root
cause from multiple warnings or failures reported, perform predictive analysis based on them and
generate effective solutions for its customers.
1.3 MY CONTRIBUTION
While working with the other two Master of Engineering students together, my major
contribution to the capstone project were as following:
1Referencing “NetApp Capstone Team Strategy Paper” in Jan., 2014 2Using NetApp internal AutoSupport data search engine

Page 3
1) Helped to investigate and understand the hardware configuration of NetApp’s E-series
product and how ASUP worked.
2)cParticipated in designing the evaluation matrix for different Big Data technologies.
3) Researched one of Big Data technologies – Phoenix from Salesforce.com Inc.
4) Participated in building the Star Schema data structure for ASUP data.
5) Accomplished ASUP raw log files data parsing and cleaning.
6) Generated tables containing necessary information in a normalized format for data
repository, and had data cleaned for the team to analyze.

Page 4
Chapter 2: Literature Review
Admittedly, there are many data storage service providers in the market who are advocate
of Big Data technologies. Other than NetApp, EMC Corporation, Cisco Systems, International
Business Machines Corporation (IBM), Seagate Technology PLC and Western Digital
Corporation (WD) are all storage array solution companies who are potential competitors to
NetApp. Table 1 below illustrates their key technologies, product trend, target and user group,
and whether they are equipped with predictive ability or not.
Table 1: Existing Landscape of Data Storage and Analysis Market
Competitor NetApp EM C Cisco IBM Seagate WD
Product
Name
AutoSupport
(ASUP)
Fully
Automated St orage
Tiering
(FAST )
Storage Area
Networking
(SAN)
Predictive Failure
Analysis
(PFA)
SimplyRAID™
technology
WD
Smart Ware
Product Target
E-series Product
All Product Lines
Network St orage
Hard Drive St orage
NAS Storage My Book Series
Core
Process
Predictive
Analysis &
Solution
“SP Collect”
Receive
– Confirm
– Solve
– Prevent
Diagnostics Indication
N/A
N/A
Product
User
Engineers /
Customers
Engineers /
Customers Engineers Engineers Customers Customers
Predictive Ability
Yes No No Yes No No
2.1 COMPETITORS’ STRATEGY
As the NetApp Project Strategy Paper emphasizes, huge amount of data requires fast-
paced analysis and efficient management, especially in this Big Data Era.1 To promote “Big Data

Page 5
analytics”, EMC Corporation developed “Pivotal HD Solution”. In their marketing literature,
“pivotal” solution referred to their utilization of Apache Hadoop distribution application, which
was advertised as the revolutionary in “Hadoop analytics for unstructured Big Data” [5].
Similarly, as a worldwide leader in networking, Cisco IT chose Hadoop to deliver its
commitment that “Enterprise Hadoop architecture, built on Cisco UCS (Unified Computing
System) Common Platform Architecture (CPA) for Big Data, unlocks hidden business
intelligence” [6]. What is more, in their promotional material, IBM emphasized “Big Data
platform”, whose key capabilities included: “Hadoop-based analytics”, “Streaming Computing”
and “Data Warehousing”, with prominence on analytic applications of “Business Intelligence”
and “Predictive Analytics” [7]. Unwilling to lag behind, traditional storage solution companies
were dedicatedly building their own Big Data technology. As Mike Crump, VP of Seagate and
Harrie Netel, director of Seagate denoted, “Seagate puts Big Data in action” with the “automated
ODT (Outgoing DPPM Test)” and eCube technologies based on its own “Seagate’s Enterprise
Data Warehouse (EDW)” [8]. WD (Western Digital), another major disk drive manufacturer,
announced that they used Hadoop and Hortonworks to “optimize manufacturing with longer
retention of sensor data” [9]. It is predictable that this market will evolve rapidly, and in order to
survive, our ASUP ecosystem development for NetApp needs to exploit a niche market in this
industry.

Page 6
2.2 NETAPP’S STRATEGY
For NetApp Inc. the proper use of Big Data technology in our project will have a positive
impact on its future business, because the successful deployment of Big Data technology on E-
series products will “necessitates secure, robust and low-cost solutions for data storage and
management”, as emphasized in NetApp Strategy Paper.1 When AutoSupport was first
introduced in NetApp white paper in 2007, it was highlighted that NetApp would have a more
than “65% chance of resolving a customer case in less than one day” instead of only “35%
[chances] without AutoSupport data” [10].
On the other hand, as the database structure has become increasingly complex, our
strategy for NetApp in the project is a radical evolution in the industry. MapReduce was the
milestone in data mining, processing and management, like Dr. Jeff Ullman claimed in his book
Mining of Massive Datasets, “Implementations of MapReduce enable many of the most common
calculations on large-scale data to be performed on computing clusters efficiently” [11]. Later,
the MapReduce methodology was integrated with Hadoop Hive, specifically, HiveQL “which are
compiled into map-reduce jobs executed on Hadoop” as demonstrated by Ashish Thusoo et al. in
the paper entitled Hive - A Warehousing Solution Over a Map-Reduce Framework in 2011 [12].
Since then, the tool was tailored to handle large data set and was very powerful, and many
companies still relied on it. However, we chose to use Berkeley Shark, which was Spark on top
of Hadoop Hive with SQL compatibility. One of the special features of Shark was the fact that
Shark could implement MapReduce functions approximately a hundred times faster [2], which
was an ideal choice for fast-paced big data analysis. As illustrated in Table 1 above, with the
help of Berkeley Shark technology, our data analysis function which required the predictive

Page 7
nature and real- time feature over large-scale data set became feasible. This was innovative and
would dramatically improve the user experience of NetApp’s customers.
Actually, for all the IT companies in this Big Data era, the key to the success is whether
the company can master the advanced technology and seize the opportunity in a niche market.
Our project on E-series ASUP framework will revolutionize NetApp’s data storage and customer
support business and help the company exploit its niche market in the Big Data industry.
Page 8
Chapter 3: Methodology
One of our tasks in this project was to gain extensive knowledge by researching,
analyzing and testing various Big Data technologies for the E-series ASUP framework. Initially,
we made our technology selection list with Spark/Shark from Berkeley AMPLab [2], Impala [13]
and Parquet [14] from Cloudera, Phoenix from Saleforce.com [15] and Clydesdale from Google
and IBM [16]. We then set up various benchmarks to compare these technologies in order to
narrow down our list. After we finalized the decision to utilize the latest Berkeley Spark/Shark as
our key technology, we developed the data storage schema, constructed the data repository
thereafter and parsed the ASUP raw log files into tabular format data for the repository. At the
same time, we made progress on Berkeley Shark configuration based on NetApp’s computing
clusters, with which we could store the large-scale parsed data, perform analysis and offer
predictive solutions using machine learning techniques. Since my work is majorly focused on
data parsing, this paper will be centered on data processing accordingly.

Page 9
3.1 ASUP ENVIRONMENT
Figure 2 on the right is a demonstration of ASUP
infrastructure from NetApp’s AutoSupport documents
online [4]. NetApp developed this technology many
years ago, and integrated it with several branded product
lines in order to continuously and efficiently monitor the
health of storage systems. It is achieved by constantly
sending ASUP reports back to NetApp headquarter and “My AutoSupport” online platform. As
an effective troubleshooting tool, AutoSupport targets both of the NetApp support engineers and
product customers.
Although AutoSupport was already deployed in many other NetApp products, it had not
been integrated with NetApp’s E-series product line. Since E-series products are becoming one
of NetApp’s featured products, the company is desired to make this integration accomplished
soon. And that is the goal of our capstone project.
Figure 2: NetApp AutoSupport Infrastructure [4]
Page 10
3.2 DATASET
Since one storage system can generate multiple AutoSupport reports continuously in just
a short period of time, it is a pressure for us to do data cleaning and analysis. Likely, it is due to a
hardware failure or a system warning occurred before. But within each of the AutoSupport
report, most of the contents are duplicated. Therefore, how to efficiently extract the root cause of
the problem becomes significant.
The size of an ASUP dataset varies greatly from a few megabytes to several hundreds of
megabytes in total, depending on how large the storage system is and whether the AutoSupport
data is a daily log or a system warning type.
These are the raw datasets that we used for our capstone project. With access to the
NetApp’s repository of AutoSupport raw data, we can continuously collect these data globally.
However, to process and integrate the huge dataset demands novel Big Data technologies rather
than traditional database and data management solutions.
3.3 TECHNOLOGY COMPARISON
We made technical comparison of five eligible Big Data technologies, namely Berkeley
Spark/Shark, Cloudera Impala and Parquet, Salesforce.com Phoenix and Google Clydesdale.
They all have various advantages and disadvantages. And one of our tasks in this project was to
narrow down this list, and made a final decision on which technology we were going to use to

Page 11
construct the framework. In order to achieve that goal, we did research on their hardware
limitations and computing constraints one by one, and list our evaluation standards and results to
examine each single technology.
3.4 DATA STORAGE MECHANISM
In order to efficiently organize and store all of the normalized data, we utilized the Star
Schema data structure. The Star Schema consisted of fact tables and dimension tables, in which
fact tables stored the central metrics and information, whereas dimension tables were data
warehouse linked to the fact tables.
3.5 DATA PARSING AND STORING
After choosing Berkeley Spark/Shark technology, it was important to install and
configure it properly on the NetApp’s company computing cluster. Our computing cluster
consisted of one master node and three worker nodes. And we installed the Berkeley
Spark/Shark with the latest release on February 2014 on all of the cluster nodes. With that
accomplished, I began to work on data parser, convert the ASUP raw data into tabular format to
store in data repository.

Page 12
3.6 DATA QUERYING AND INSIGHTS
Last but not least, we spent time and effort on identifying example use cases for
NetApp’s E-series products, and generating insightful data queries. Because this was one of our
key tasks for the project, we wanted to offer valuable and predictive solutions for our customer.
A simple use case would be to collect any drive errors from one system, performing
analysis on its system configuration, record of repairing, capacity usage and device running time
etc., aggregating similar errors and identifying the root cause, and predicting what the next time
that the potential failure would occur. We applied K-means clustering and K-fold cross-
validation machine learning algorithms on our dataset and generated insightful conclusions
accordingly.

Page 13
Chapter 4: Discussion
4.1 TECHNOLOGY COMPARISON MATRIX
Table 2 below presents the technology comparison results we concluded for five major
advanced Big Data technologies.
Table 2: Technology Comparison Matrix [17]
Name Spark Impala Phoenix Parquet Clydesdale
Company UCB/Apache Cloudera Salesforce Cloudera/Twitter Google/IBM
Ease of Setup Easy Easy Easy Medium Hard
Compatibility Hive Hive HBase Hadoop
SQL Like
Star Schema
Unstructured
Data
Not for Non-
scalar Data
Accelerated
Storage Format Columnar Columnar Columnar
Bulk Data Load
In-memory
UDF
Predictive
Analytics
Available APIs Java, Python,
Scala Java Java Java Java
Maturity High Medium Medium Medium Low
Note
In-memory
computing, faster
data queries,
ideally suited for
machine learning
Best
integration
with Parquet
Table Join
function not
available in
Phoenix
Version
2.1.2
Requires extensive
configuration, query
dependent, not
suitable for mult iple
queries
Still a research
prototype.
Performance
varies
depending on
query type
Users IBM, Yahoo!,
Intel, Groupon Cloudera Salesforce
Salesforce, Couldera,
Twitter Google, IBM
Our Choice

Page 14
The evaluation standards are:
1. Company: The entity who developed and supported such technology
2. Ease of Setup: To measure how easy it is for users to setup and configure such technology
3. Compatibility: To examine whether such technology is compatible with HIVE/HBase/Hadoop
4. SQL Like: To examine whether such technology has the SQL skin, which is easy to develop
5. Star Schema: To examine whether such technology supports “Star Schema”
6. Unstructured Data: To survey how well such technology handles the unstructured data like txt
7. Accelerated Storage Format: To identify if such technology utilizes Columnar data format
8. Bulk Data Load: To examine whether such technology supports large size data bulk loading
9. In-memory : To observe if such technology has the function of in-memory computation
10. UDF: To examine if such technology has the User Defined Function features
11. Predictive Analytics: To survey whether such technology has the predictive analytics function
12. Available APIs: To examine what APIs it supports, like Java, Python or Scala
13. Maturity: To measure how mature such technology is, in the level of High, Medium and Low
14. Extra Note: Other significant features, functions, releasing or development notes
15. Users: The example of companies/entities who utilize or deploy such technology
4.2 DATA PARSING
One of my major tasks in this capstone project was to parse the raw log files and extract
valuable data from them. At the early stage of our project, we discovered that there was a binary
file in the log file jar. Utilizing an internal java-based parser, we could convert these binary files
into semi-structured xml files for preliminary analysis. However, xml file was not valuable to us,
because this type of data format was not compatible with databases and none of the machine
learning algorithms could be applied upon. We needed to further normalize these data and
convert them into tabular format, then store them into our databases residing on powerful
computing clusters, aggregate them further to perform the predictive analysis using modern
Page 15
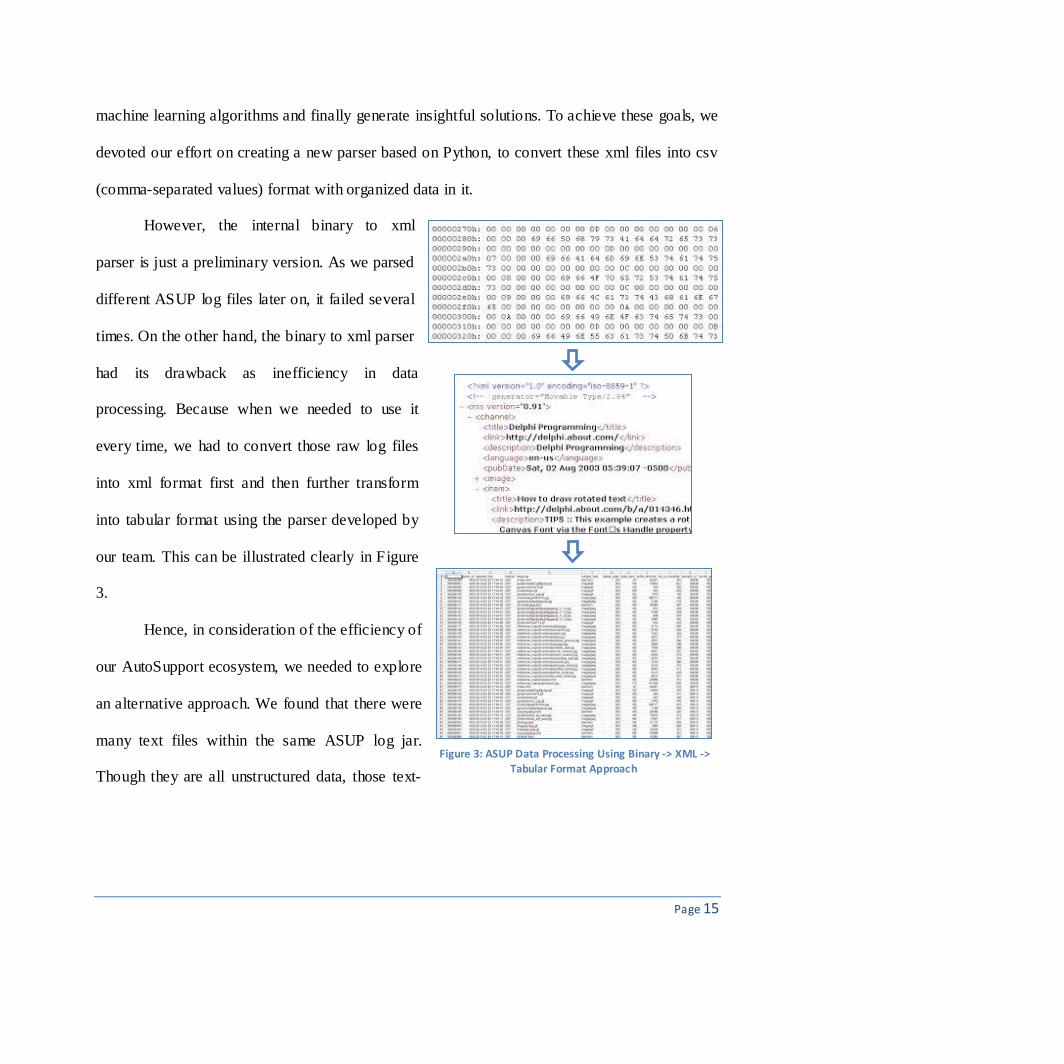
Figure 3: ASUP Data Processing Using Binary -> XML ->
Tabular Format Approach
machine learning algorithms and finally generate insightful solutions. To achieve these goals, we
devoted our effort on creating a new parser based on Python, to convert these xml files into csv
(comma-separated values) format with organized data in it.
However, the internal binary to xml
parser is just a preliminary version. As we parsed
different ASUP log files later on, it failed several
times. On the other hand, the binary to xml parser
had its drawback as inefficiency in data
processing. Because when we needed to use it
every time, we had to convert those raw log files
into xml format first and then further transform
into tabular format using the parser developed by
our team. This can be illustrated clearly in Figure
3.
Hence, in consideration of the efficiency of
our AutoSupport ecosystem, we needed to explore
an alternative approach. We found that there were
many text files within the same ASUP log jar.
Though they are all unstructured data, those text-
Page 16
based data contain almost equally sufficient and valuable information as the binary files. So we
decided to set aside the previous approach, and begin to develop a new parser aiming to parse
these text-based data. This process is clearly illustrated in the appendix.
I wrote a parser based on Python, which took in the text files in ASUP log file jar, and
generated all the tables automatically. The parser would extract all the key words in the text file,
like the ID of various physical components, the generation date of the ASUP report, date of
manufacturing etc. as column names in the table, and the associated value or description to those
key words would be stored in a tabular format in a csv file.
As discussed in section 3.2, the same storage system could continuously generate
multiple ASUP reports in a short period of time. These datasets were mostly alike to each other,
so to simply bulk load those in the data repository without proper process might cause
overwriting problems. To deal with such issue, I utilized the “Partitioning” function in Hive, as
well as Shark (because Shark was Spark on top of Hive), to solve this issue. Since the ASUP
generation date had sufficient precision, we decided to use it as the partition field to differentiate
distinct ASUP data, or the data generated by the same ASUP but in different time period.

Page 17
4.3 STAR SCHEMA DATA STRUCTURE
I also participated in designing the data structure for the repository. Figure 4 below is the
sample Star Schema we created for ASUP data warehousing:
As discussed in previous sections,
large-scale ASUP data were all stored
following this structure on computing cluster.
For different dimension tables, we used IDs of
various components as the primary key to link
to the fact tables. And as claimed above, each
table contained a partition field when storing in
data repository.
Figure 4: Star Schema Structure [17]
Page 18
Chapter 5: Conclusion
At this time, we have successfully designed the data structure, configured Spark/Shark on
computing clusters, had the majority of ASUP data parsed and cleaned for use, and generated
several use cases insights based on machine learning algorithm already.
To review my part of work, the biggest difficulty I encountered was to parse the
unstructured text-based AutoSupport data. Yet at the same time, I realized that it was important
to have a clean and normalized dataset generated for machine learning application, user interface
development and future predictive analysis. The difficulty lay in the fact that my parser might
work well on one version of AutoSupport, but turn out to be a failure totally when testing on
other AutoSupport versions, simply due to the new lines added in other AutoSupport versions.
To overcome this difficulty, I had to run and test my parser on multiple AutoSupport versions
one by one. Fortunately, I found out that all of the AutoSupport reports were in a “normalized”
format to some degree. The total amount of information, or the column names in tabular data
format after conversion, was set and fixed. The only difference was that some AutoSupport
versions tended to omit certain hardware information, which might not be configured in the
storage system. Therefore, I drawn the conclusion that to develop a parser for such unstructured
text format data, it was important to aggregate all of the possible information first, no matter
whether it existed in the current dataset or not. Furthermore, some parsing techniques, like the
look-up table mechanism, should be used to parse the dataset completely, instead of parsing the
dataset line by line or by searching key words in it.
Page 19
In the future, continued work can be done in the areas of implementing more machine
learning algorithms on the whole set of E-series AutoSupport data, constructing a friendly user
interface for potential customers, and continuing working to make the E-series AutoSupport
ecosystem more efficient and robust.
Page 20
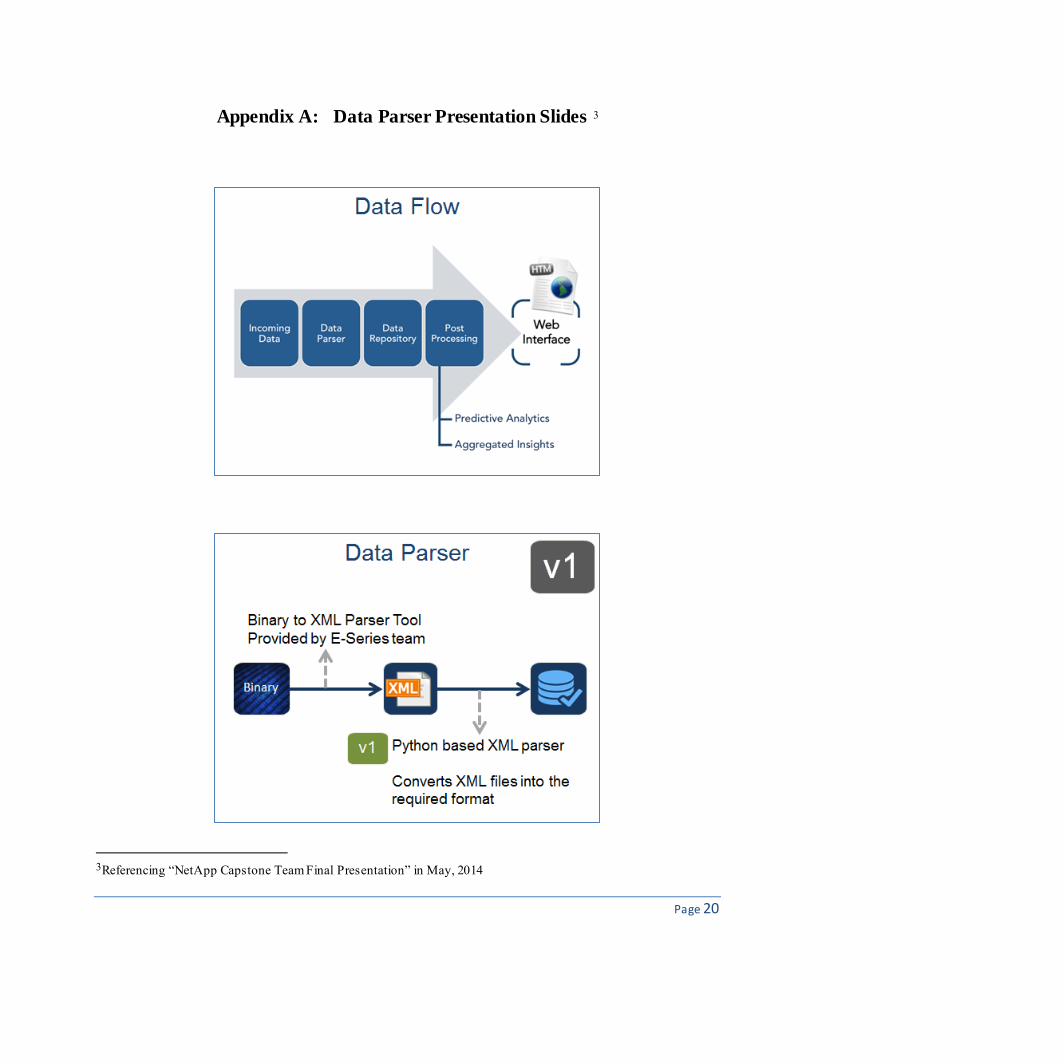
Appendix A: Data Parser Presentation Slides23
3Referencing “NetApp Capstone Team Final Presentation” in May, 2014

Page 21

Page 22

Page 23
Bibliography
[1] [Online]chttp://www.netapp.com/us/products/storage-systems/e5400/e5400-product-comparison.aspx
[2] [Online] http://spark.apache.org/research.html
[3] [Online] http://www.idc.com/getdoc.jsp?containerId=prUS24302513
[4] [Online] http://www.netapp.com/us/services-support/autosupport.aspx
[5] [Online].http://www.emc.com/microsites/big-data-explorer/index.htm#content
/which/analytics/, last access Jan. 30, 2014.
[6] [Online].http://www.cisco.com/en/US/solutions/collateral/ns340/ns1176/data-
center/BigData_Case_Study-1.html/, last access Jan. 31, 2014.
[7] [Online]. http://www-01.ibm.com/software/data/bigdata/, last access Jan. 31, 2014.
[8] [Online].http://storageeffect.media.seagate.com/2013/04/storage-effect/seagate-puts-
big-data-in-action-a-case-study/, last access Feb. 1, 2014.
[9] [Online].http://hortonworks.com/customer/western-digital/, last access Feb. 2, 2014.
[10] "Proactive Health Management with AutoSupport" NetApp White Paper. Network
Appliance, Inc. Technical Report. WP-7027-0907. Sept. 2007.
[11] J. Ullman, "Mining of Massive Datasets" pp.19, Cambridge University Press,
December 30, 2011.
[12] A. Thusoo, J. Sarma, N. Jain, Z. Shao, P. Chakka, S. Anthony, H. Liu, P. Wyckoff and R. Murthy, “Hive - A Warehousing Solution Over a Map-Reduce Framework”.
Proceedings of the VLDB Endowment. Vol. 2 Issue 2. Pp. 1626-1629. August 2009.
[13][Online]http://www.cloudera.com/content/cloudera/en/products-and-
services/cdh/impala.html
[14] [Online] http://parquet.io/
[15] [Online] https://github.com/forcedotcom/phoenix
[16] T. Kaldewey, E. Shekita, S. Tata, “Clydesdale: Structured Data Processing on
MapReduce” IBM Almaden Research Center, Google. http://www.timkaldewey.de/pubs/Clydesdale__EDBT12.pdf
[17] A. Pandey, H. Tong and J. Zhang, "Analytics for E-Series AutoSupport Using Big Data
Technologies." Poster, NetApp Inc., Sunnyvale, CA, Tech. Rep., Nov., 2013.


