
IN PAS T T WO Y E ARS , PE-BACKED E X I T VAL UE T O TAL S $ 1 .0 7 TPAGE 4»
CORP OR AT E ACQUISI T IONS SURGE IN T O TAL VAL UE , HI T T ING $ 360B IN 20 15PAGE 7»
PE-BACKED IP O VAL UAT ION SL IDE S F OR SECOND Y E AR IN A ROWPAGE 9»
AND COMPANY INVENTORY2015 Annual
Credits & ContactPitchBook Data, Inc.
JOHN GABBERT Founder, CEO
ADLEY BOWDEN Vice President,
Market Development & Analysis
ContentNIZAR TARHUNI Senior Analyst
BRIAN LEE Data Analyst
JENNIFER SAM Senior Graphic Designer
JESS CHAIDEZ Graphic Designer
Contact PitchBook pitchbook.com
RESEARCH
EDITORIAL
SALES
COPYRIGHT © 2016 by PitchBook Data, Inc. All rights reserved. No part of this publication may be reproduced in any form or by any means—graphic, electronic, or mechanical, including photocopying, recording, taping, and information storage and retrieval systems—without the express written permission of PitchBook Data, Inc. Contents are based on information from sources believed to be reliable, but accuracy and completeness cannot be guaranteed. Nothing herein should be construed as any past, current or future recommendation to buy or sell any security or an offer to sell, or a solicitation of an offer to buy any security. This material does not purport to contain all of the information that a prospective investor may wish to consider and is not to be relied upon as such or used in substitution for the exercise of independent judgment.
Introduction 3
Overview 4–5
Exits by Type & Industry 6
Corporate Acquisitions 7
Secondary Buyouts 8
IPOs 9
Company Inventory 10
Contents
2 PITCHBOOK 2015 ANNUAL PE EXITS & COMPANY INVENTORY REPORT

A disequilibrium between sellers and buyersIntroduction
2015 remained a strong year for private equity sellers as the quantity of
acquisitive buyers in the market outpaced that of sellers, contributing to
sustained high valuations for those looking to exit. While seller expectations
remained high, and many were certainly able to negotiate attractive terms in
sales processes, those same sellers faced issues finding attractive deals to put
capital to work, continuing a bifurcation between success in buying and selling
for PE.
Trends around popular exit ramps remained similar to what we’ve observed
recently, with strategic acquisitions accounting for the bulk of PE-backed sales,
followed by PE-to-PE buyouts. Strategic and PE buyers have found themselves
in the same processes bidding for deals, increasing competition and helping pad
exit values for sellers—again a double-edged sword for PE as they look to close
deals on both sides of the table. With a wave of new fund managers spinning out
vehicles focused on utilizing operational expertise and a deeper understanding
of certain sectors, these general partners have been able to help underpin
growth in secondary buyouts, deeming their expertise a strategic advantage
over other bidders and subsequently bidding much more aggressively.
PE-backed inventory levels remain inflated, and with managers scouring for
opportunities after years of overly successful fundraising efforts, we don’t
expect this to change in a meaningful way. The rate of investments in the past,
such as those made in 2007, has contributed to a rise in zombie vehicles, as fund
managers face substantial challenges exiting various companies. Consequently,
when you consider these aging assets in conjunction with the dire need of
dealmakers to capitalize on any market stutters that could open up a window for
investors to become more aggressive, that inventory will remain at least flat in
the coming future.
This report spans PE-backed exits in North America and Europe. We hope
you find the enclosed data and insights helpful as you assess the macro PE
landscape. As always, feel free to contact us with any questions.
MAKE WAY FOR
SMARTER, ON-THE-FLY MEETING PREP
US +1 206.623.1986
UK +44 (0)207.190.9809
pitchbook.com
Introducing PitchBook
Mobile. The same
excellent data, technology
and service from the
PitchBook Platform, now
available on a mobile
device.
Search:
“PitchBook”
Available for
NIZAR TARHUNI
Senior Analyst
3 PITCHBOOK 2015 ANNUAL PE EXITS & COMPANY INVENTORY REPORT
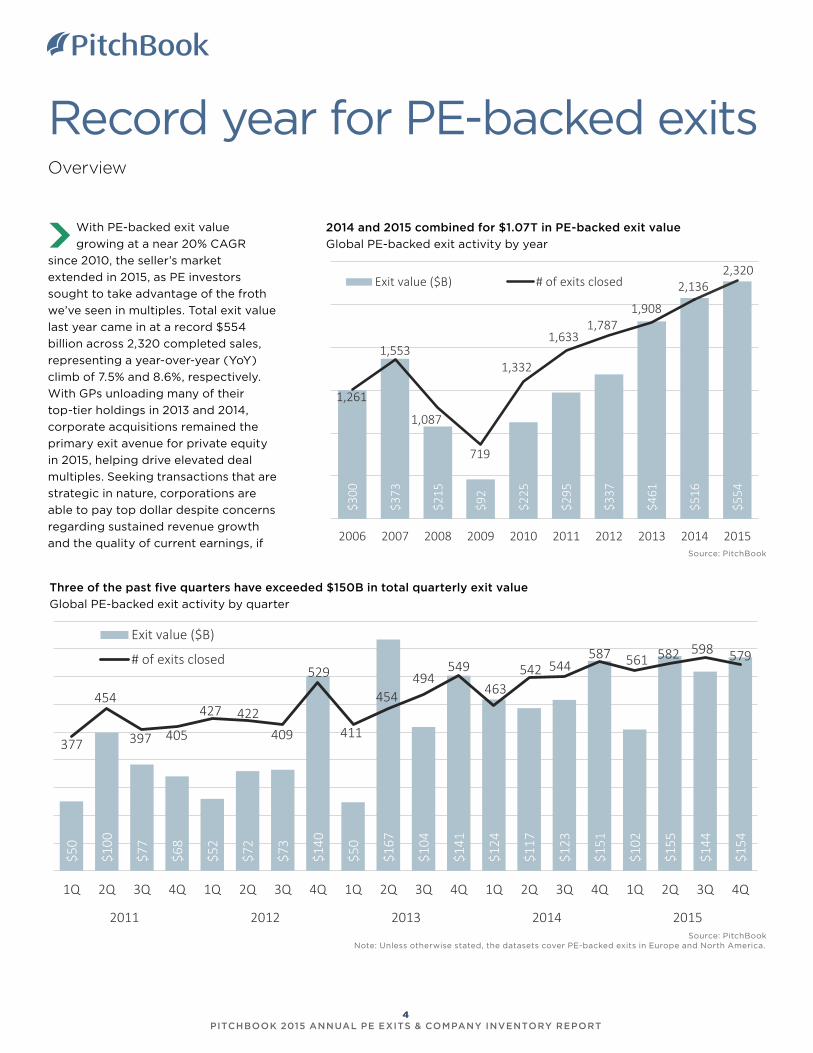
Record year for PE-backed exitsOverview
With PE-backed exit value
growing at a near 20% CAGR
since 2010, the seller’s market
extended in 2015, as PE investors
sought to take advantage of the froth
we’ve seen in multiples. Total exit value
last year came in at a record $554
billion across 2,320 completed sales,
representing a year-over-year (YoY)
climb of 7.5% and 8.6%, respectively.
With GPs unloading many of their
top-tier holdings in 2013 and 2014,
corporate acquisitions remained the
primary exit avenue for private equity
in 2015, helping drive elevated deal
multiples. Seeking transactions that are
strategic in nature, corporations are
able to pay top dollar despite concerns
regarding sustained revenue growth
and the quality of current earnings, if
Three of the past five quarters have exceeded $150B in total quarterly exit value
Global PE-backed exit activity by quarter
2014 and 2015 combined for $1.07T in PE-backed exit value
Global PE-backed exit activity by year
Source: PitchBook
$300
$373
$215
$92
$225
$295
$337
$461
$516
$554
1,261
1,553
1,087
719
1,332
1,6331,787
1,908
2,1362,320
2006 2007 2008 2009 2010 2011 2012 2013 2014 2015
Exit value ($B) # of exits closed
$50
$100
$77
$68
$52
$72
$73
$140
$50
$167
$104
$141
$124
$117
$123
$151
$102
$155
$144
$154
377
454
397 405
427 422409
529
411
454494
549
463542 544
587 561 582 598 579
1Q 2Q 3Q 4Q 1Q 2Q 3Q 4Q 1Q 2Q 3Q 4Q 1Q 2Q 3Q 4Q 1Q 2Q 3Q 4Q
2011 2012 2013 2014 2015
Exit value ($B)
# of exits closed
Source: PitchBookNote: Unless otherwise stated, the datasets cover PE-backed exits in Europe and North America.
4 PITCHBOOK 2015 ANNUAL PE EXITS & COMPANY INVENTORY REPORT
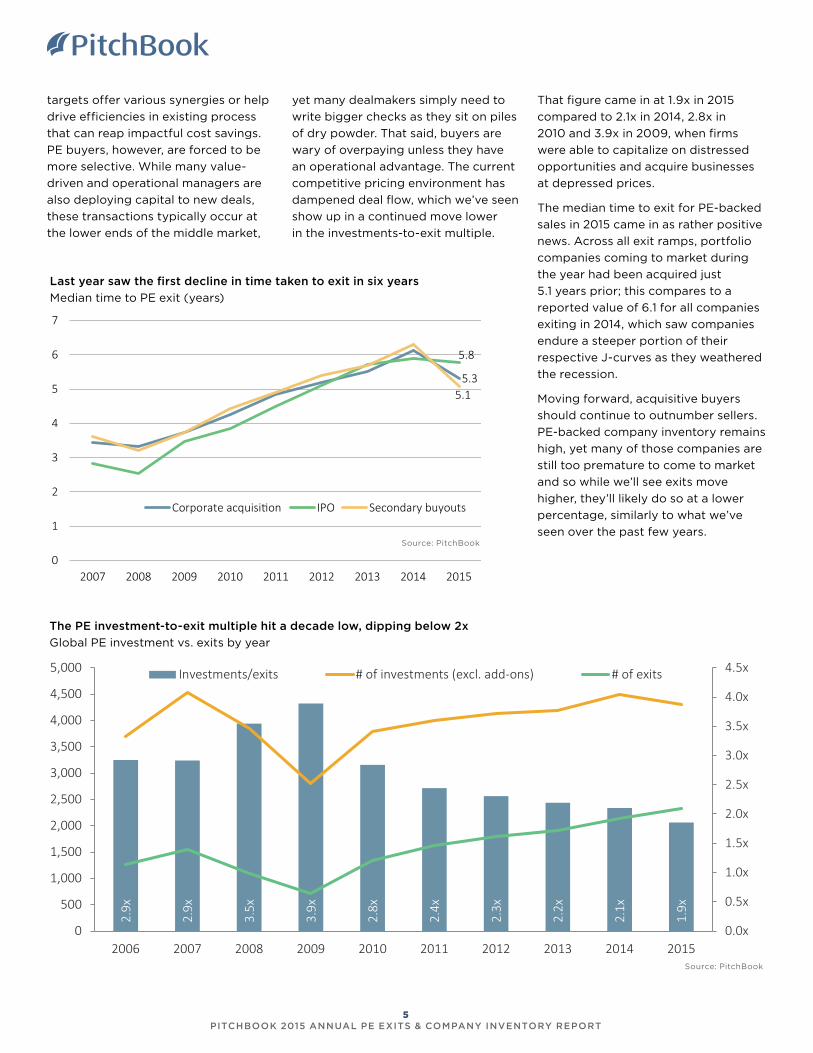
The PE investment-to-exit multiple hit a decade low, dipping below 2x
Global PE investment vs. exits by year
Last year saw the first decline in time taken to exit in six years
Median time to PE exit (years)
0
1
2
3
4
5
6
7
2007 2008 2009 2010 2011 2012 2013 2014 2015
Corporate acquisition IPO Secondary buyouts
5.8
5.35.1
Source: PitchBook
2.9x
2.9x
3.5x
3.9x
2.8x
2.4x
2.3x
2.2x
2.1x
1.9x
0.0x
0.5x
1.0x
1.5x
2.0x
2.5x
3.0x
3.5x
4.0x
4.5x
0
500
1,000
1,500
2,000
2,500
3,000
3,500
4,000
4,500
5,000
2006 2007 2008 2009 2010 2011 2012 2013 2014 2015
Investments/exits # of investments (excl. add-ons) # of exits
Source: PitchBook
targets offer various synergies or help
drive efficiencies in existing process
that can reap impactful cost savings.
PE buyers, however, are forced to be
more selective. While many value-
driven and operational managers are
also deploying capital to new deals,
these transactions typically occur at
the lower ends of the middle market,
yet many dealmakers simply need to
write bigger checks as they sit on piles
of dry powder. That said, buyers are
wary of overpaying unless they have
an operational advantage. The current
competitive pricing environment has
dampened deal flow, which we’ve seen
show up in a continued move lower
in the investments-to-exit multiple.
That figure came in at 1.9x in 2015
compared to 2.1x in 2014, 2.8x in
2010 and 3.9x in 2009, when firms
were able to capitalize on distressed
opportunities and acquire businesses
at depressed prices.
The median time to exit for PE-backed
sales in 2015 came in as rather positive
news. Across all exit ramps, portfolio
companies coming to market during
the year had been acquired just
5.1 years prior; this compares to a
reported value of 6.1 for all companies
exiting in 2014, which saw companies
endure a steeper portion of their
respective J-curves as they weathered
the recession.
Moving forward, acquisitive buyers
should continue to outnumber sellers.
PE-backed company inventory remains
high, yet many of those companies are
still too premature to come to market
and so while we’ll see exits move
higher, they’ll likely do so at a lower
percentage, similarly to what we’ve
seen over the past few years.
5 PITCHBOOK 2015 ANNUAL PE EXITS & COMPANY INVENTORY REPORT

IT saw a whopping $98.8B in total exit value last year,
an increase of 50% over 2014
Global PE-backed exits ($B) by industry
Strategics dominate, but 2015 saw $153B in value
exited through SBOs
Global PE-backed exits ($B) by type
B2B and B2C combined accounted for nearly 60% of
all PE-backed exits last year
Global PE-backed exits (#) by industry
The number of secondary buyouts eclipsed 950 to
reach a high for the decade
Global PE-backed exits (#) by type
Exits by type & industry
0
500
1,000
1,500
2,000
2,500
2006 2007 2008 2009 2010 2011 2012 2013 2014 2015
Corporate acquisition IPO
Secondary buyout $0
$100
$200
$300
$400
$500
$600
2006 2007 2008 2009 2010 2011 2012 2013 2014 2015
Corporate acquisition IPO
Secondary buyout
Source: PitchBook
Source: PitchBook
0
500
1,000
1,500
2,000
2,500
2006 2007 2008 2009 2010 2011 2012 2013 2014 2015
B2B B2C
Energy Financial services
Healthcare IT
Materials & resources
$0
$100
$200
$300
$400
$500
$600
2006 2007 2008 2009 2010 2011 2012 2013 2014 2015
B2B B2C
Energy Financial services
Healthcare IT
Materials & resources
Source: PitchBook
Source: PitchBook
Strategic M&A has been the primary driver of exit value for PE sellers, although SBOs played a considerable role.
Healthcare exits grew in count by 19% YoY, accounting for a massive $67.7B in 2015, 12% of total annual exit value.
6 PITCHBOOK 2015 ANNUAL PE EXITS & COMPANY INVENTORY REPORT

Strategics predominateCorporate acquisitions
Accounting for more than 54% of
all PE-backed exits in 2015, the
corporate acquisition ramp remains
the most sought-after exit avenue for
In the past three years, strategic M&A value has totaled $963B
Global corporate acquisitions by year
A slight decline year-over-year
Median corporate acquisition valuation/EBITDA
multiples
Despite sliding from 2014, last year sustained a high
level of median deal size
Median corporate acquisition size ($M)
$150
$151
$140
$72
$134
$201
$193
$296
$307
$360
606
759646
441
761
9161,023 1,038
1,1251,263
2006 2007 2008 2009 2010 2011 2012 2013 2014 2015
Exit value ($B)
# of exits closed
Source: PitchBook
$180
$172
$0
$20
$40
$60
$80
$100
$120
$140
$160
$180
$200
2006 2007 2008 2009 2010 2011 2012 2013 2014 2015
9.7x9.0x
0.0x
2.0x
4.0x
6.0x
8.0x
10.0x
12.0x
14.0x
2006 2007 2008 2009 2010 2011 2012 2013 2014 2015Source: PitchBook Source: PitchBook
PE. Since the $133.6 billion in total exit
value generated via sales to strategics
in 2010, the ramp has seen total exit
value grow at a CAGR of 22%, with
$360 billion being exited across 1,263
corporate buys last year. The record
amount of PE-backed inventory
continues to contribute to the asset
class serving as a playground for
corporate acquirers unable to show
appealing growth to shareholders
amid a changing business landscape
and an ostensibly slowing global
economy. Further, as competitors
continue to seek acquisitive growth,
companies are at times being forced
to shift their strategies away from
traditional organic growth in fear of
losing market share. The healthcare
and technology sectors accounted for
the largest percentage growth in total
capital exited to strategics. PE-backed
tech sector sales in 2015 amounted
to over $64 billion while healthcare
represented $55.5 billion, representing
respective yearly growth rates of 63%
and near 80%.
7 PITCHBOOK 2015 ANNUAL PE EXITS & COMPANY INVENTORY REPORT
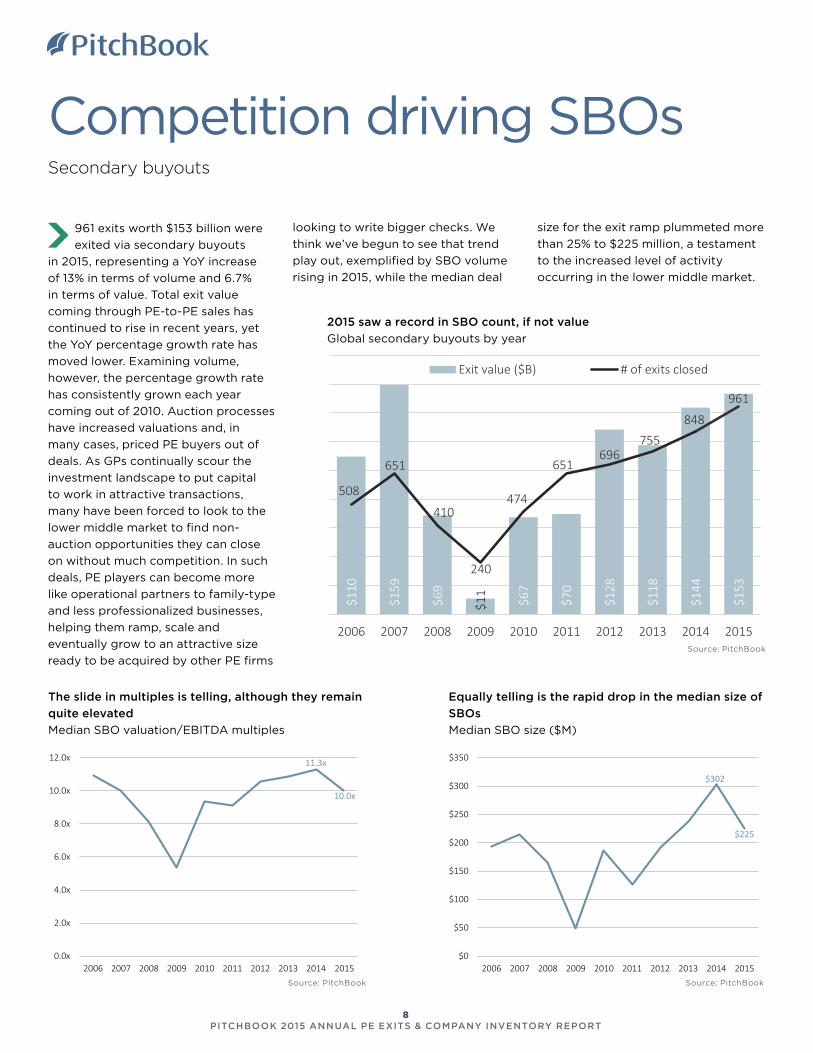
Competition driving SBOsSecondary buyouts
961 exits worth $153 billion were
exited via secondary buyouts
in 2015, representing a YoY increase
of 13% in terms of volume and 6.7%
in terms of value. Total exit value
coming through PE-to-PE sales has
continued to rise in recent years, yet
the YoY percentage growth rate has
moved lower. Examining volume,
however, the percentage growth rate
has consistently grown each year
coming out of 2010. Auction processes
have increased valuations and, in
many cases, priced PE buyers out of
deals. As GPs continually scour the
investment landscape to put capital
to work in attractive transactions,
many have been forced to look to the
lower middle market to find non-
auction opportunities they can close
on without much competition. In such
deals, PE players can become more
like operational partners to family-type
and less professionalized businesses,
helping them ramp, scale and
eventually grow to an attractive size
ready to be acquired by other PE firms
2015 saw a record in SBO count, if not value
Global secondary buyouts by year
The slide in multiples is telling, although they remain
quite elevated
Median SBO valuation/EBITDA multiples
Equally telling is the rapid drop in the median size of
SBOs
Median SBO size ($M)
Source: PitchBook
$302
$225
$0
$50
$100
$150
$200
$250
$300
$350
2006 2007 2008 2009 2010 2011 2012 2013 2014 2015Source: PitchBook
11.3x
10.0x
0.0x
2.0x
4.0x
6.0x
8.0x
10.0x
12.0x
2006 2007 2008 2009 2010 2011 2012 2013 2014 2015Source: PitchBook
looking to write bigger checks. We
think we’ve begun to see that trend
play out, exemplified by SBO volume
rising in 2015, while the median deal
size for the exit ramp plummeted more
than 25% to $225 million, a testament
to the increased level of activity
occurring in the lower middle market.
$110
$159
$69
$11
$67
$70
$128
$118
$144
$153
508
651
410
240
474
651696
755848
961
2006 2007 2008 2009 2010 2011 2012 2013 2014 2015
Exit value ($B) # of exits closed
8 PITCHBOOK 2015 ANNUAL PE EXITS & COMPANY INVENTORY REPORT
With corporate buyers offering
PE-backed portfolio companies
attractive price tags, and niche GPs
able to offer outsized valuations for
other PE-backed companies that fall
within their operational focuses, the
need and incentive to take companies
public remains subdued. Capital
markets remain a resource of last
resort for many debt-laden companies
needing to reduce leverage levels
and establish relationships to help
The median IPO valuation slid to a low unseen since
2008, at $714M
Global PE-backed IPO size & valuation ($M)
Close to three quarters of all PE-backed IPOs were
within their targets last year
Global PE-backed IPOs hitting range (#)
Global PE-backed IPO median valuation/EBITDA
multiples
Overall, 2015 was quite the down year for PE-backed
public offerings, relative to 2013 and 2014
Global PE-backed IPOs by year
raise future capital quicker if need
be, yet outside of this scenario, only
best-in-class businesses are finding
success via public listings. Close to $41
billion was raised in public offerings
last year across just 96 listings. On a
yearly basis, this represents a decline
of 38% in total offering value and
41% in total listings. The median PE-
backed offering size, however, was
up near 9% over last year, coming in
at the highest level we’ve tracked at
$268 million. This is again partially
attributable to select, debt-strapped
companies opting to go public in light
of subdued interest from other PE
firms and corporate acquirers wary
of adequately servicing an increased
debt load. Speaking to the ability of
top-tier businesses to successfully
float, 11% of companies going public
last year were able to list at the high
end of their pricing range, a pleasant
surprise compared to the 4.4% seen in
2014. Further, just 14.5% of companies
priced at the low end of their expected
ranges, relative to near 24% of
companies pricing lower in 2014.
IPOs
$41
$36
$7 $9 $24
$25
$16
$47
$65
$41
147 143
31
38
97
66 68
115
163
96
2006 2007 2008 2009 2010 2011 2012 2013 2014 2015
Offering value ($B)
# of IPOs
$247 $268
$853
$714
$0
$200
$400
$600
$800
$1,000
$1,200
2006 2007 2008 2009 2010 2011 2012 2013 2014 2015
Median offering size ($M)
Median valuation ($M)
Source: PitchBook
Source: PitchBook
8.5x
9.8x
0.0x
2.0x
4.0x
6.0x
8.0x
10.0x
12.0x
2006 2007 2008 2009 2010 2011 2012 2013 2014 2015Source: PitchBook
0%
10%
20%
30%
40%
50%
60%
70%
80%
90%
100%
2010 2011 2012 2013 2014 2015
High Within target LowSource: PitchBook
Note: IPO valuation calculated as the offering share price multiplied by the
total number of outstanding shares.
9 PITCHBOOK 2015 ANNUAL PE EXITS & COMPANY INVENTORY REPORT
Company inventory
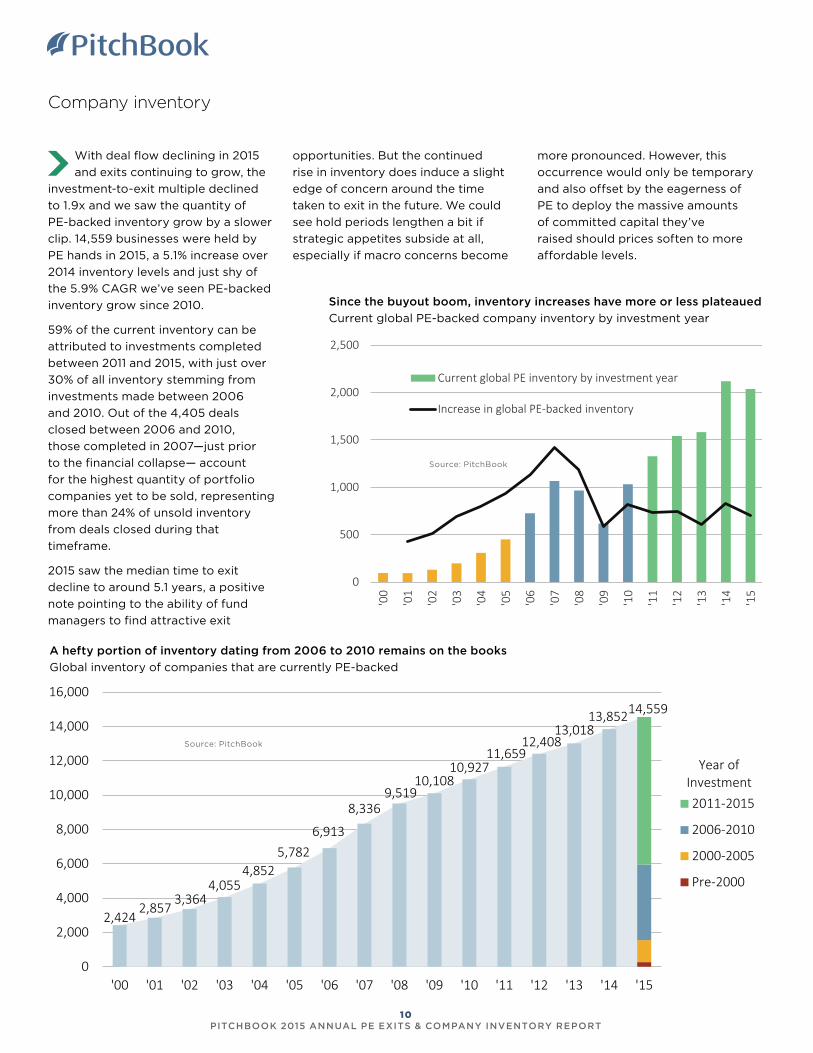
With deal flow declining in 2015
and exits continuing to grow, the
investment-to-exit multiple declined
to 1.9x and we saw the quantity of
PE-backed inventory grow by a slower
clip. 14,559 businesses were held by
PE hands in 2015, a 5.1% increase over
2014 inventory levels and just shy of
the 5.9% CAGR we’ve seen PE-backed
inventory grow since 2010.
59% of the current inventory can be
attributed to investments completed
between 2011 and 2015, with just over
30% of all inventory stemming from
investments made between 2006
and 2010. Out of the 4,405 deals
closed between 2006 and 2010,
those completed in 2007—just prior
to the financial collapse— account
for the highest quantity of portfolio
companies yet to be sold, representing
more than 24% of unsold inventory
from deals closed during that
timeframe.
2015 saw the median time to exit
decline to around 5.1 years, a positive
note pointing to the ability of fund
managers to find attractive exit
A hefty portion of inventory dating from 2006 to 2010 remains on the books
Global inventory of companies that are currently PE-backed
Since the buyout boom, inventory increases have more or less plateaued
Current global PE-backed company inventory by investment year
0
500
1,000
1,500
2,000
2,500
'00
'01
'02
'03
'04
'05
'06
'07
'08
'09
'10
'11
'12
'13
'14
'15
Current global PE inventory by investment year
Increase in global PE-backed inventory
Source: PitchBook
2,4242,857
3,3644,055
4,8525,782
6,913
8,3369,519
10,10810,927
11,65912,408
13,01813,85214,559
0
2,000
4,000
6,000
8,000
10,000
12,000
14,000
16,000
'00 '01 '02 '03 '04 '05 '06 '07 '08 '09 '10 '11 '12 '13 '14 '15
2011-2015
2006-2010
2000-2005
Pre-2000
Year of Investment
Source: PitchBook
opportunities. But the continued
rise in inventory does induce a slight
edge of concern around the time
taken to exit in the future. We could
see hold periods lengthen a bit if
strategic appetites subside at all,
especially if macro concerns become
more pronounced. However, this
occurrence would only be temporary
and also offset by the eagerness of
PE to deploy the massive amounts
of committed capital they’ve
raised should prices soften to more
affordable levels.
10 PITCHBOOK 2015 ANNUAL PE EXITS & COMPANY INVENTORY REPORT

Contact PitchBook
pitchbook.com
RESEARCH [email protected]
EDITORIAL [email protected]
SALES [email protected]

YOUR JOURNEY TO STRONGER RETURNS STARTS HERE
With data on:
Companies
Investors
Deals
M&A
Limited partners
Funds
Financials
Advisors
People
Request a free trial
US +1 206.623.1986
UK +44 (0)207.190.9809
pitchbook.com
The PitchBook Platform for private equity
• Strengthen your LP relationships
• Build a better portfolio
• Exit efficiently and successfully
• Elevate your firm with award-winning technology


