

DAnSKe BAnK A/S
HolmenS KAnAl 2-12
DK-1092 KøBenHAvn K
tel. +45 33 44 00 00
Cvr-nr. 611262 28-KøBenHAvn
www.DAnSKeBAnK.Com
An
nu
Al
re
po
rt
20
11 DANSKE BANK PLC
ANNUAL REPORT 2012

Danske Bank Plc
BoarD of Directors´ rePort ............................................. 3
ifrs financial statements ........................................................... 10
consolidated statement of comprehensive income ... 10
consolidated Balance sheet ........................................................ 11
statement of changes in equity ................................................ 11
cash flow statement ......................................................................... 12
notes to the financial statements .................. 13
summary of significant accounting Policies ................. 13
income statement ................................................................................23
corporate Governance .....................................................................25
risk management ................................................................................29
segment information .........................................................................38
other notes: .....................................................................................40
1 net interest income ................................................................40
2 fee and commission income and expenses .........40
3 net trading income .................................................................40
4 other operating income ...................................................... 41
5 net income from investments ........................................ 41
6 staff costs .....................................................................................41
7 share-based payment ..........................................................41
8 other operating expenses,
depreciations and impairments....................................43
9 audit fees ......................................................................................43
10 loan impairment charges .................................................44
11 taxes ................................................................................................44
12 Balance sheet classification
and maturity analysis ..........................................................45
13 fair value .......................................................................................47
14 cash and balances at central banks .........................48
15 loans and receivables .........................................................49
16 financial instruments .........................................................50
17 investments in associates ................................................53
18 intangible assets and goodwill .....................................53
19 investment property .............................................................54
20 Property, plant and equipment ......................................54
21 other assets ................................................................................55
22 tax assets and liabilities ...................................................55
23 amounts owed to credit institutions
and customers ...........................................................................55
24 Debt securities in issue.......................................................56
25 other liabilities .........................................................................57
26 Provisions ....................................................................................57
27 contingent liabilities and commitments ................57
28 related party disclosures .................................................59
29 equity and reserves ...............................................................60
Danske Bank Plc financial statements
(fas)...............................................................................................................61
income statement ................................................................................61
Balance sheet .........................................................................................62
notes to the financial statements ..................64
accounting policies ............................................................................64
other notes to the financial
statements ........................................................................................65
Danske Bank Plc BoarD of Directors´
ProPosal to the annual General meetinG
for the DistriBution of the Profits of the
Parent comPany .........................................................................82
Danske Bank Plc is a Finnish bank which is part of the Danske Bank Group. Danske Bank Group is one of the largest
financial enterprises in the Nordic region. This Annual Report includes Danske Bank Plc and its subsidiaries.
CONTENTS
DANSKE BANK PLC / FINANCIAL STATEMENTS AND ANNUAL REPORT 2012 2

DANSKE BANK PLC / FINANCIAL STATEMENTS AND ANNUAL REPORT 2012 3
DANSKE BANK PLC BOARD OF DIRECTORS´ REPORT 2012
Changes in the operating environment
World economic growth slowed in 2012. the
international monetary fund estimates that world
growth in 2012 will remain at 3.3 per cent, down from
3.8 per cent in the previous year. europe’s weak
economic situ ation and worries about the endurance
of the euro area were particular causes of uncertainty
for the global economy. Growth was stronger in the
usa than in europe, but the economic outlook became
more cautious also on the other side of the atlantic.
the presidential and congressional elections in
november and the economic tightening measures in
late 2012 caused uncertainty in the us economy. on
the emerging markets, growth was generally clearly
faster than in the western countries, but the growth
rate declined from the previous level. in china, annual
growth fell below the 8 per cent level in the second
and third quarters. in uncertain conditions, price
pressures on raw materials eased, and inflation
remained low in various parts of the world. on the
other hand, unemployment was higher than its natural
level, and the employment trend was downward at the
end of the year.
the poor state of the economy and low inflation led
to exceptional support measures by the european
central Bank (ecB). at the end of December 2011 and
february 2012, the ecB lent nearly eur 1,000 billion
to the european banking sector on favourable terms.
the ecB also lowered its refinancing rate to a record
low level of 0.75 per cent in July. these measures
contributed to the decline of market interest rates, and
the 12-month euribor was at 0.54 per cent at the end
of the year. housing loan interest rates fell to record-
low levels in finland, although credit margins were
raised during the year. housing loan interest rates in
finland were the lowest of the euro states, with the
average interest rate at 1.68 per cent in november.
the interest rates of the most creditworthy states,
such as Germany and finland, remained at historically
low levels. the outcome of Greece’s debt arrangement
was that investors and banks had to record losses in
march. the interest rates of spain and italy rose at the
beginning of the year as investors doubted the
countries’ debt sustainability. it was only after the
ecB President mario Draghi promised in July that the
central bank would do whatever it takes to save the
euro and would, if necessary, buy large quantities of
euro area crisis states’ government bonds that the
markets calmed down, and the interest rates of the
crisis countries fell to a clearly lower level. the crisis
and the lack of confidence raised banks’ refinancing
costs, and in order to secure profitability they sought
to transfer these to customer financing margins.
Banks also tightened credit policy in the euro area.
economic integration in the euro area was deepened,
and in late June, the first steps towards a euro area
bank union were taken when the establishment of a
european bank supervisor and the possibility of direct
assistance to banks from shared european assets
were agreed upon at the eu summit.
finland’s gross domestic product remained near the
previous year’s level in 2012. household consumer
demand partially protected finland against the euro
crisis. Private consumption grew by 2 per cent in
January-september, while exports and imports
contracted by around 1 per cent. however, the outlook
deteriorated towards the end of the year, as the private
consumption peak was not reached, the value of new
industrial orders declined virtually throughout the
year, and the number of granted building permits and
housing starts declined. early in the year, consumer
demand was supported by pay rises in line with a
framework decision and an amendment to vehicle tax
in april, which encouraged households and companies
to focus their consumption on the early part of the
year. the uncertain economic situation was reflected
in the postponement of investments. the economy was
steadied by the moderate house price rise and the low
number of bankruptcies, causing banks’ credit losses
to remain reasonable. the number of corporate
bankruptcies in January-november 2012 remained
on the same level as previous year.
the seasonally adjusted unemployment rate remained
at 7.5 per cent in the early part of the year. in the latter
part of the year, the unemployment rate rose to 8 per
cent. the financial situation of households was
DANSKE BANK PLC / FINANCIAL STATEMENTS AND ANNUAL REPORT 2012 4
improved by historically low interest rates. early in the
year, consumer prices were still rising at an annual
rate of over 3 per cent, but in november inflation fell
to 2.2 per cent. the amendments to indirect taxes
carried out during the year raised inflation by nearly
a percentage point. consumer confidence rose early in
the year, but in June, outlooks fell to exceptionally low
levels again. consumers had cautious expectations
regarding their own finances, and their outlooks on
the finnish economy were gloomy.
Revenue performance
total income for the full financial year was near the
2011 level and amounted to eur 637.5 million
(649.8 million). net interest income for the financial
year increased to eur 358.1 million (345.7 million),
an increase of 4 per cent on the previous year. the
performance of market interest rates was visible in both
credit and lending. the Group’s funding costs continued
to grow during the financial year, as expected.
the Group’s net commission income declined by 3 per
cent compared with the same period a year earlier,
and was eur 196.4 million (202.2 million). the net
commission income performance was affected by
one-off commissions from lending recognised in the
corresponding period in 2011, for which there were no
corresponding items in this review period. net income
from transactions in securities and foreign exchange
dealing increased by 4 per cent on the previous year,
to eur 41.6 million (40.1 million). net trading income
also include a positive change in value in the units of
suomen luotto-osuuskunta held by the bank, as the
cooperative sold the entire stock of luottokunta oy
in august 2012. the Group’s other income decreased
by 34 per cent year on year to eur 39.1 million (58.9
million). in the financial statements for 2011, non-
recurring items were recognised in the Group’s other
income for which there were no corresponding items
in this review period.
Banking activities
net revenue from banking decreased by 8.3 per cent
on the previous year to eur 518.1 million (565.3
million). revenue was positively affected by the
increase in net interest income, which was due to
market interest rate movements and their effect on
credit and lending. net commission income from
banking also increased by 2.3%. income performance
was negatively influenced by the development of other
income, where there were a number of non-recurring
income items in the previous financial year but there
were no corresponding income items in the 2012
financial year. the increase in funding costs continued
during the financial year, and as a result, loan pricing
has been tightened. the organisational structure and
business practices of banking were renewed during
the financial year to respond to the market challenges
imposed on banks by low interest rates, lacklustre
economic growth, the increased cost of refinancing,
regulatory changes in the business, and the change in
customer behaviour in the internet and mobile age.
a key aspect of the renewal of business practices is
that the bank will be able to harness all available
channels (branches, financial centres, private bank
units, telephone services and electronic channels) into
a single entity for serving the customer.
When customers are given a chance to choose their
method of banking, they increasingly choose a remote
banking method. this has allowed us to reassess the
bank’s branch network, and we have consequently
been able to reduce the number of branches.
improving the features of the eBank, together with
other efficient channels, has been one of the most
important development areas for a long time, and
Danske Bank currently has 534,000 active eBank
users. Demand for mobile banking services also
continued to grow significantly during the financial
year. investment functions were added to the tablet
Bank. Danske Bank Plc currently has 155,000 mobile
and tablet bank customers.
at the beginning of the year, an iPad version of
investment-themed magazine was launched, and the
navigator asset management strategy was included in
the asset management service package. a total of 26
new investment bonds were also launched on the
market during the financial year. over 6,300 new long-
term savings agreements were made during the year.
Markets
Despite the prolonged uncertainty in the capital
markets, the income of the Danske markets business
was positive and amounted to eur 61.6 million (51.6
million). income and customer activity remained at the
high level attained in the previous year both in fixed
income and foreign currency products. the business
area received positive feedback in a number of
customer satisfaction surveys conducted during the
year and has solidified its market share position
among the top two in several product areas.

DANSKE BANK PLC / FINANCIAL STATEMENTS AND ANNUAL REPORT 2012 5
During the financial year, the Danske markets
business area arranged bonds for the finnish
government and for major finnish corporations,
including elisa corporation, metso corporation,
kesko corporation and stockmann plc.
Capital
Despite the cost pressures created by nervy markets
and increasing regulations, the business area’s income
was reasonably good at eur 29.1 million (36.3 million).
Danske capital continued its strong performance in
institutional asset management. according to a
survey by scandinavian financial research, Danske
capital became finland’s preferred institutional asset
manager in 2012 measured in terms of customer
relationships. the ratings for quality of operations
also continued to rise. Danske capital received
excellent marks especially in customer service. the
number of institutional customer relationships rose
substantially in 2012.
Danske invest fund management ltd is the third-
largest fund management company in finland with
a market share of 13.7 per cent. assets under
management were eur 9.1 billion at the end of
December (7.8 billion on 31 December 2011). net
subscriptions by fund management companies
registered in finland were eur 4,635 million in
January-December. in the same period, net
subscriptions by Danske invest fund management
were eur 327 million.
according to a comparison by the global fund analysis
company morningstar, Danske invest had the most
top-rated five-star funds in finland. a total of 19 of
Danske invest’s funds had either the highest (five-star)
or second-highest ranking in the comparison survey
that included 52 of the company’s funds. the average
overall star rating was 3.4.
the Danske invest european small cap fund was
ranked number one in european equity funds
registered in finland, with a return of 30.5 per cent in
2012. Danske invest excelled in emerging market
equity funds, taking first place with the Danske invest
Black sea fund, which returned 61.3% in 2012.
measured in terms of the number of unit holders, the
Danske invest compass 25 fund remained finland’s
most popular balanced fund, with nearly 63,000 unit
holders.
Result and cost structure
the Danske Bank Plc Group’s profit before taxes for
the full financial year was eur 156.8 million (147.3
million). the result was eur 115.3 million (109.8
million). net interest income and the Group’s costs
throughout the year, in particular, had a positive
impact on the result. correspondingly, the increase in
impairment charges and one-off costs had a negative
impact on the result. net impairment on loans and
receivables was eur 63.9 million (53.4 million).
individually assessed impairment charges and final
write-offs totalled eur 63.6 million (68.0 million).
eur 18.9 million (0.3 million) was recorded in
collective impairments, and recoveries came to eur
18.5 million (15.0 million). During the review period
the Group modified the parameters used in the
impairment charge models, following which an
additional one-off entry was made in receivables.
impairment charges and write-offs were mainly from
a few corporate customers.
the Danske Bank Plc Group’s operating expenses
totalled eur 416.7 million (eur 449.0 million),
a decrease of 7.2 per cent (eur 32.4 million) on the
previous year. the consolidated result for the year
was burdened by a number of one-off expenses
– over eur 14 million - from projects associated
with the reorganising of operations and expenses
associated with the Group’s name change. the Group’s
fixed costs in the financial year decreased by 8.1 per
cent year on year.
Balance sheet and funding
the Danske Bank Plc Group’s balance sheet total for
2012 was eur 31,812.8 million (27,406.1 million).
loans and receivables from customers grew by eur
938.4 million to a total of eur 25,672.0 million
(24,733.6 million). Demand for housing loans
continued to be good, and the housing loan portfolio
grew 2.8 per cent on the previous year. Deposits
increased by eur 1,228.4 million to a total of eur
16,462.9 million (15,234.6 million).
the financial and liquidity situation remained good,
and short-term funding performed well during the
year. the continuation of the exceptional market
situation was reflected in the fact that long-term
funding prices remained at a high level. Danske Bank
Plc issued eur 2 billion worth of covered bonds and
eur 47.3 million in other bonds during the year.
capital securities and terms are described in note 24.

DANSKE BANK PLC / FINANCIAL STATEMENTS AND ANNUAL REPORT 2012 6
Capital adequacy
Danske Bank Plc applies the standard method (capital
requirement for credit and operational risk) and
regulatory approaches (capital requirement for market
risks) to capital adequacy calculations. the Danske
Bank Plc Group’s capital adequacy ratio was 15.8 per
cent (14.4), which clearly exceeds the regulatory
minimum requirement. the tier 1 capital ratio was
15.8 per cent (14.4). the total capital included in
capital adequacy was eur 2,586.0 million on 31
December 2012 (eur 2,617.3 million). the Group’s
risk weighted assets were eur 16,324.7 million
(18,155.0 million).
at the request of the european Banking authority
(eBa), Danske Bank Plc’s parent company, Danske
Bank a/s, published an updated test of its
SOLVENCY Danske Bank Plc Group Danske Bank Plc
Own funds EURm 31.12.2012 31.12.2011 31.12.2012 31.12.2011
Tier 11) 2 586.0 2 617.3 2 586.7 2 632.8
Share capital 106.0 106.0 106.0 106.0
Legal reserve 271.1 271.1 261.7 261.7
Capital securities 350.0 350.0 350.0 350.0
Distributable capital 2 001.0 1 886.3 2 010.4 1 919.0
Non-controlling interest 0.6 8.2 - -
Intangible assets -2.7 -3.7 -1.4 -3.4
Proposed/actual dividend -140.0 - -140.0 -
Other deductions from Tier 1 -0.1 -0.6 -0.1 -0.6
Tier 2 - - - -
Total capital 2 586.0 2 617.3 2 586.7 2 632.8
Risk-weighted assets (on-balance sheet and off-balance sheet) 16 324.7 18 155.0 16 303.3 16 911.1
Capital requirement (8% of risk-weighted assets) 1 306.0 1 452.4 1 304.3 1 352.9
Credit and counterparty risk 1 196.0 1 345.2 1 197.3 1 248.6
Market risk 22.9 17.2 22.9 17.2
Operational risk 87.1 90.0 84.1 87.1
Solvency ratio, %
- total capital/risk-weighted assets 15.8% 14.4% 15.9% 15.6%
- Tier 1 capital/risk-weighted assets 15.8% 14.4% 15.9% 15.6%
Group capital adequacy ratio has been calculated in accordance with Credit Institutions Act Sect 5:44-48§ and 54-66§. For calculation of credit, market and
operational risk’s risk-weighted assets, Danske Bank Plc Group applies standard method.1) Danske Bank Plc Group Tier 1 includes capital securities 14% (14%). Danske Bank Plc Tier 1 includes capital securities 14% (14%).
capitalisation level in october 2012 that was
calculated in accordance with the methods used in the
2011 stress test. the capital adequacy of the Danske
Bank Group exceeded the level required to pass the
stress test by a clear margin, as was the case in the
previous year.
as a result of the financial crisis, banks’ capital
adequacy requirements are being tightened. the
objective of the tighter regulations is to improve the
quality of banks’ capital, reduce the cyclical nature of
the capital requirement and banks’ indebtedness, and
impose quantitative limits on liquidity risks. the
changes, planned for entry into force during 2013–
2019, are still being drafted and their eventual effects
cannot be assessed with certainty

DANSKE BANK PLC / FINANCIAL STATEMENTS AND ANNUAL REPORT 2012 7
Employees and organization
the Group had 2,252 employees (2,501) at the end of
the financial year, which was 249 persons, or 10.0 per
cent, less than at the end of 2011. During the review
period, 16 people transferred from Danske Bank Plc
to the helsinki branch of Danske Bank a/s. of all the
employees, 94.7 per cent were employed in banking
activities, 2.8 per cent in markets and 2.5 per cent in
capital.
Credit ratings
in may 2012 both standard & Poor’s and moody’s
downgraded Danske Bank Plc’s ratings. standard &
Poor’s lowered its counterparty credit ratings to
a-/a-2 (from a/a-1) and changed outlook from
negative to stable. in the course of a major review
of 114 european financial institutions that was
announced on 15 february 2012, moody’s
downgraded Danske Bank Plc’s the long-term
deposit rating to a2 (from (a1) with stable outlook.
the Prime-1 short term rating was affirmed. the
announcements were simultaneous with downgrade
announcements for the parent company Danske Bank
a/s. in november 2012 standard & Poor’s revised its
outlook for the bank rating from stable to positive.
Danske Bank Plc’s Board of Directors and auditors
During the financial year, the members of Danske
Bank Plc’s Board of Directors were thomas f. Borgen
(chairman until 1 June 2012), tonny thierry
andersen (chairman from 1 June 2012), Per Damborg
skovhus (Vice chairman until 1 June 2012), henrik
ramlau-hansen (Vice chairman from 1 June 2012),
niels-ulrik mousten, mikael ericson (until 1 June
2012), Georg schubiger (until 1 June 2012), ilkka
hallavo (from 1 september 2012), esko mäkeläinen
and maija strandberg.
the annual General meeting of Danske Bank Plc
chose kPmG oy ab, a firm of authorised public
accountants, as its auditor, with Petri kettunen, aPa,
as the auditor with principal responsibility.
related party loans and receivables can be found in
note 28 and corporate governance from page 25.
Changes in Danske Bank Plc’s shares, ownership and
group structure
sampo Bank Plc changed its name to Danske Bank Plc
as of november 15th 2012.
the Danske Bank Plc Group is part of the Danske
Bank Group. the parent company of the Danske Bank
Group is Danske Bank a/s. the parent company of the
Danske Bank Plc Group is Danske Bank Plc.
the following were also Danske Bank Plc Group
companies on 31 December 2012: Danske invest fund
management ltd, kiinteistömaailma oy, aurinkopihan
Palvelut oy, mB equity Partners oy and mB
mezzanine funD ii ky. as Danske Bank Plc’s holding
in as. oy espoon leppävaaran aurinkopiha fell below
50 per cent at the end of may 2012, the company is
now presented under associated companies.
Danske Bank Plc’s share capital is eur 106 million,
divided into 106,000 shares. Danske Bank a/s holds
the entire stock of Danske Bank Plc.
Risk management
the main objective of risk management is to ensure
that the capital base is adequate in relation to the risks
arising from the business activities. the Board of
Directors of Danske Bank Plc establishes the
principles of risk management, risk limits and other
general guidelines according to which risk
management is organised at Danske Bank Plc. to
ensure that the bank’s risk management organisation
meets both the external and internal requirements,
the Board of Directors has set up a risk committee,
the main objective of which is to ensure Danske Bank
Plc’s compliance with the risk management guidelines
issued by the Board of Directors and that Danske
Bank Plc monitors all types of risk and provides
reports to the appropriate parties. the Board has also
established an asset and liability committee (alco),
which is responsible for monitoring and directing the
management of structural balance sheet interest rate
risk positions in accordance with Danske Bank Plc’s
policies and delegated limits. alco also determines
the operating target levels for liquidity risk
management and oversees the management of
liquidity risk. the risk management unit monitors
daily business operations together with the finance
department’s market risk team.
in addition to the capital adequacy calculation, risks
in the Danske Bank Plc Group are described and
assessed internally through economic capital
indicators, which describe the amount of capital
needed to bear different kinds of risks. the capital
DANSKE BANK PLC / FINANCIAL STATEMENTS AND ANNUAL REPORT 2012 8
requirement is adequately covered by equity, capital
securities and debenture loans. the principal risks
associated with the Danske Bank Plc Group’s
activities are credit risk, interest rate and liquidity
risks of banking book, operational risks and various
business risks.
the Group’s risk position remained at a good level. the
principal risks associated with the Group’s business
operations involve developments in the general
economic operating environment and investment
market and future changes in financial regulations.
in relation to the loan and guarantee portfolio, bad
and doubtful debts were at a low level. the majority of
net write-offs and impairment charges consisted of
customer-specific impairment charges. there was
a decrease in the volume of bad and doubtful debts
in comparison with the previous year, and these
amounted to eur 180.6 million (197.0 million) or 0.79
per cent (0.85) of the loan and guarantee portfolio.
the Danske Bank Plc Group has not invested in the
bonds of GiiPs countries.
a more detailed account of risks and risk management
can be found in the risk management note at page 31.
Events after the reporting period
the Board of Directors of Danske Bank Plc has 28th
of January 2013 decided to transfer its asset finance
business to a subsidiary. Danske finance ltd is
established for the purpose.
Outlook
the weak economic situation in europe is causing
uncertainty in the financial markets. the main risks
from the Bank’s point of view concern the trends in the
global economy and the financial markets. the
unpredictability in the financial markets and the weak
state of the economy are having a negative impact on
the economy in general and consequently on the result
for the Group.
helsinki, 6 february 2013
Danske Bank Plc
Board of Directors
DANSKE BANK PLC / FINANCIAL STATEMENTS AND ANNUAL REPORT 2012 9
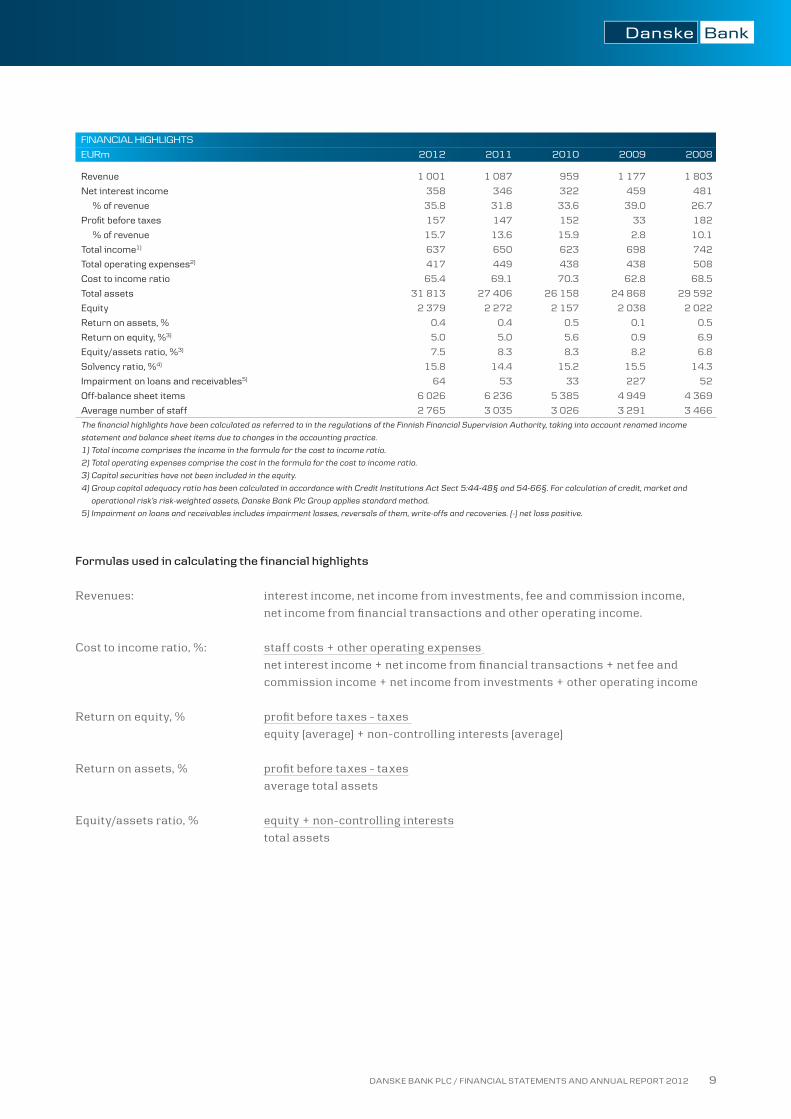
FINANCIAL HIGHLIGHTS
EURm 2012 2011 2010 2009 2008
Revenue 1 001 1 087 959 1 177 1 803
Net interest income 358 346 322 459 481
% of revenue 35.8 31.8 33.6 39.0 26.7
Profit before taxes 157 147 152 33 182
% of revenue 15.7 13.6 15.9 2.8 10.1
Total income1) 637 650 623 698 742
Total operating expenses2) 417 449 438 438 508
Cost to income ratio 65.4 69.1 70.3 62.8 68.5
Total assets 31 813 27 406 26 158 24 868 29 592
Equity 2 379 2 272 2 157 2 038 2 022
Return on assets, % 0.4 0.4 0.5 0.1 0.5
Return on equity, %3) 5.0 5.0 5.6 0.9 6.9
Equity/assets ratio, %3) 7.5 8.3 8.3 8.2 6.8
Solvency ratio, %4) 15.8 14.4 15.2 15.5 14.3
Impairment on loans and receivables5) 64 53 33 227 52
Off-balance sheet items 6 026 6 236 5 385 4 949 4 369
Average number of staff 2 765 3 035 3 026 3 291 3 466
The financial highlights have been calculated as referred to in the regulations of the Finnish Financial Supervision Authority, taking into account renamed income
statement and balance sheet items due to changes in the accounting practice.
1) Total income comprises the income in the formula for the cost to income ratio.
2) Total operating expenses comprise the cost in the formula for the cost to income ratio.
3) Capital securities have not been included in the equity.
4) Group capital adequacy ratio has been calculated in accordance with Credit Institutions Act Sect 5:44-48§ and 54-66§. For calculation of credit, market and
operational risk’s risk-weighted assets, Danske Bank Plc Group applies standard method.
5) Impairment on loans and receivables includes impairment losses, reversals of them, write-offs and recoveries. (-) net loss positive.
Formulas used in calculating the financial highlights
revenues: interest income, net income from investments, fee and commission income,
net income from financial transactions and other operating income.
cost to income ratio, %: staff costs + other operating expenses
net interest income + net income from financial transactions + net fee and
commission income + net income from investments + other operating income
return on equity, % profit before taxes - taxes
equity (average) + non-controlling interests (average)
return on assets, % profit before taxes - taxes
average total assets
equity/assets ratio, % equity + non-controlling interests
total assets

DANSKE BANK PLC / FINANCIAL STATEMENTS AND ANNUAL REPORT 2012 10
CONSOLIDATED STATEMENT OF COMPREHENSIVE INCOME
EURm Note 1–12/2012 1–12/2011
Interest income 1 665.2 723.0
Interest expense 1 -307.1 -377.3
Net interest income 358.1 345.7
Fee income 2 252.9 261.7
Fee expenses 2 -56.6 -59.5
Net trading income 3 41.6 40.1
Other operating income 4 39.1 58.9
Net income from investments 5 2.2 2.9
Total operating income 637.5 649.8
Staff costs 6 -169.2 -175.8
Other operating expenses 8 -221.8 -237.2
Depreciations and impairments 8 -25.7 -36.0
Total operating expenses -416.7 -449.0
Loan impairment charges 10 -63.9 -53.4
Profit before taxes 156.8 147.3
Taxes 11 -41.6 -37.5
Total comprehensive income for the year 115.3 109.8
Attributable to
Equity holders of parent company 114.7 108.3
Non-controlling interest 0.6 1.5
IFRS FINANCIAL STATEMENTS
DANSKE BANK PLC / FINANCIAL STATEMENTS AND ANNUAL REPORT 2012 11
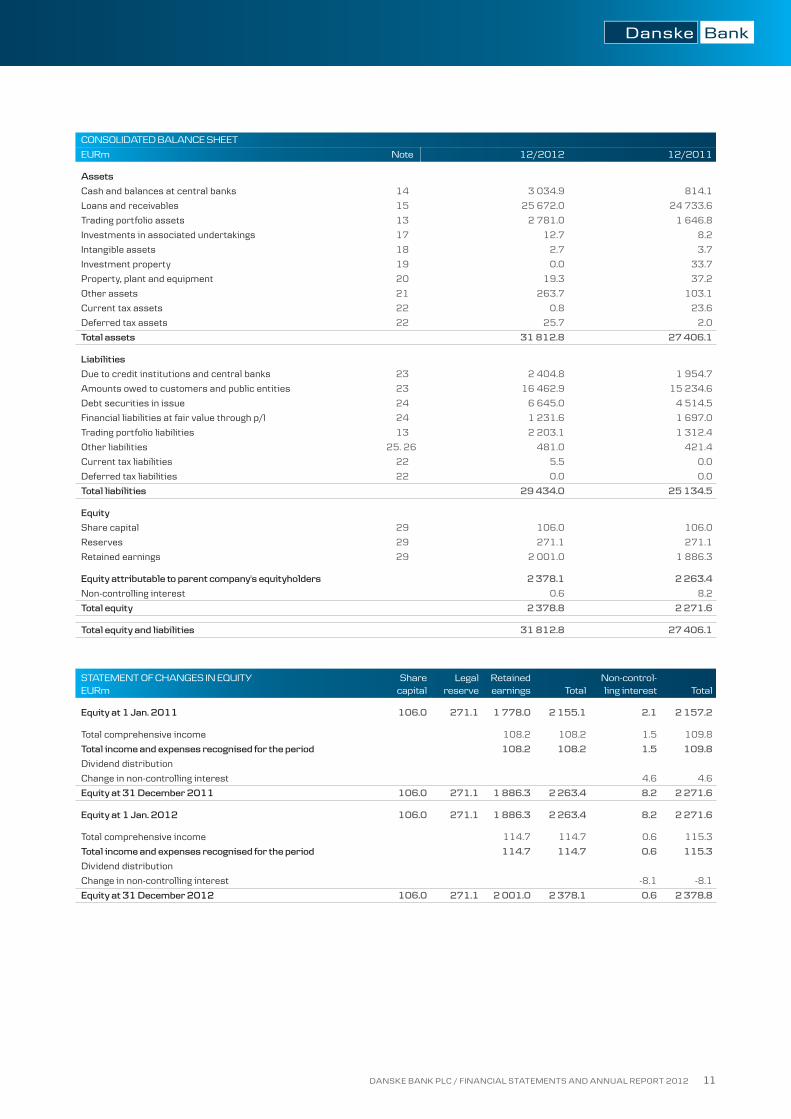
CONSOLIDATED BALANCE SHEET
EURm Note 12/2012 12/2011
Assets
Cash and balances at central banks 14 3 034.9 814.1
Loans and receivables 15 25 672.0 24 733.6
Trading portfolio assets 13 2 781.0 1 646.8
Investments in associated undertakings 17 12.7 8.2
Intangible assets 18 2.7 3.7
Investment property 19 0.0 33.7
Property, plant and equipment 20 19.3 37.2
Other assets 21 263.7 103.1
Current tax assets 22 0.8 23.6
Deferred tax assets 22 25.7 2.0
Total assets 31 812.8 27 406.1
Liabilities
Due to credit institutions and central banks 23 2 404.8 1 954.7
Amounts owed to customers and public entities 23 16 462.9 15 234.6
Debt securities in issue 24 6 645.0 4 514.5
Financial liabilities at fair value through p/l 24 1 231.6 1 697.0
Trading portfolio liabilities 13 2 203.1 1 312.4
Other liabilities 25. 26 481.0 421.4
Current tax liabilities 22 5.5 0.0
Deferred tax liabilities 22 0.0 0.0
Total liabilities 29 434.0 25 134.5
Equity
Share capital 29 106.0 106.0
Reserves 29 271.1 271.1
Retained earnings 29 2 001.0 1 886.3
Equity attributable to parent company's equityholders 2 378.1 2 263.4
Non-controlling interest 0.6 8.2
Total equity 2 378.8 2 271.6
Total equity and liabilities 31 812.8 27 406.1
STATEMENT OF CHANGES IN EQUITYEURm
Share capital
Legal reserve
Retained earnings Total
Non-control-ling interest Total
Equity at 1 Jan. 2011 106.0 271.1 1 778.0 2 155.1 2.1 2 157.2
Total comprehensive income 108.2 108.2 1.5 109.8
Total income and expenses recognised for the period 108.2 108.2 1.5 109.8
Dividend distribution
Change in non-controlling interest 4.6 4.6
Equity at 31 December 2011 106.0 271.1 1 886.3 2 263.4 8.2 2 271.6
Equity at 1 Jan. 2012 106.0 271.1 1 886.3 2 263.4 8.2 2 271.6
Total comprehensive income 114.7 114.7 0.6 115.3
Total income and expenses recognised for the period 114.7 114.7 0.6 115.3
Dividend distribution
Change in non-controlling interest -8.1 -8.1
Equity at 31 December 2012 106.0 271.1 2 001.0 2 378.1 0.6 2 378.8
DANSKE BANK PLC / FINANCIAL STATEMENTS AND ANNUAL REPORT 2012 12
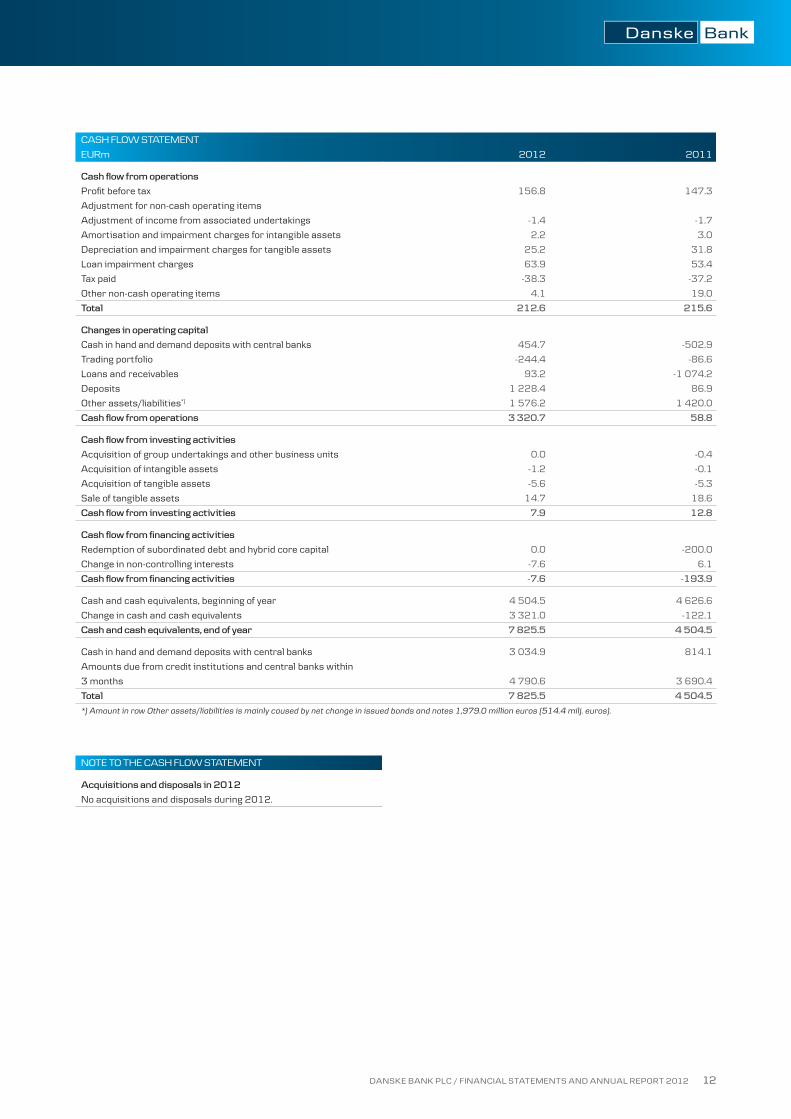
CASH FLOW STATEMENT
EURm 2012 2011
Cash flow from operations
Profit before tax 156.8 147.3
Adjustment for non-cash operating items
Adjustment of income from associated undertakings -1.4 -1.7
Amortisation and impairment charges for intangible assets 2.2 3.0
Depreciation and impairment charges for tangible assets 25.2 31.8
Loan impairment charges 63.9 53.4
Tax paid -38.3 -37.2
Other non-cash operating items 4.1 19.0
Total 212.6 215.6
Changes in operating capital
Cash in hand and demand deposits with central banks 454.7 -502.9
Trading portfolio -244.4 -86.6
Loans and receivables 93.2 -1 074.2
Deposits 1 228.4 86.9
Other assets/liabilities*) 1 576.2 1 420.0
Cash flow from operations 3 320.7 58.8
Cash flow from investing activities
Acquisition of group undertakings and other business units 0.0 -0.4
Acquisition of intangible assets -1.2 -0.1
Acquisition of tangible assets -5.6 -5.3
Sale of tangible assets 14.7 18.6
Cash flow from investing activities 7.9 12.8
Cash flow from financing activities
Redemption of subordinated debt and hybrid core capital 0.0 -200.0
Change in non-controlling interests -7.6 6.1
Cash flow from financing activities -7.6 -193.9
Cash and cash equivalents, beginning of year 4 504.5 4 626.6
Change in cash and cash equivalents 3 321.0 -122.1
Cash and cash equivalents, end of year 7 825.5 4 504.5
Cash in hand and demand deposits with central banks 3 034.9 814.1
Amounts due from credit institutions and central banks within
3 months 4 790.6 3 690.4
Total 7 825.5 4 504.5
*) Amount in row Other assets/liabilities is mainly caused by net change in issued bonds and notes 1,979.0 million euros (514.4 milj. euros).
NOTE TO THE CASH FLOW STATEMENT
Acquisitions and disposals in 2012
No acquisitions and disposals during 2012.
DANSKE BANK PLC / FINANCIAL STATEMENTS AND ANNUAL REPORT 2012 13
DANSKE BANK PLC GROUPNOTES TO THE FINANCIAL STATEMENTS
ACCOunTing PRinCiPLEsgroup in brief
Danske Bank Plc Group is part of the Danske Bank
Group, which is one of the largest financial enterprise
in the nordic region. Danske Bank Group operates in
15 countries and has more than five million private
customers. the Group is headquartered in
copenhagen and Danske Bank’s share is quoted on
the copenhagen stock exchange.
Danske Bank Plc has more than 1.1 million personal
customers and about 90,000 corporate and
institutional customers in finland. at the moment
Danske Bank Plc has 93 branches.
signiFiCAnT ACCOunTing POLiCiEsgeneral
Danske Bank Plc Group presents its consolidated
financial statements in accordance with the
international financial reporting standards (ifrss),
issued by the international accounting standards
Board (iasB) and ifric interpretations issued by
ifrs interpretations committee, as endorsed by the
eu. certain additional requirements in accordance
with finnish accounting act, finnish act on credit
institutions and finnish financial supervision
standards have also been applied. Danske Bank Plc
Group has not changed its significant accounting
policies from those followed in annual report 2011.
the consolidated financial statements are presented
in euro (eur), in million euros with one decimal,
unless otherwise stated. figures in notes are rounded
so combined individual figures might differ from the
presented total amount.
standards and interpretations not yet in force
the iasB has issued a number of amendments to
international financial reporting standards that have
not yet come into force. similarly, the ifric has issued
a new interpretation that has not yet come into force.
the paragraphs below list the standards and inter-
pretations that are likely to affect the Group’s financial
reporting.
in october 2010, the iasB amended ifrs 9, financial
instruments. this version is the first part of a standard
expected to replace the requirements of ias 39 in
2012. the amended ifrs 9 now includes principles on
classification and derecognition of financial
instruments. Principles for impairment and hedge
accounting are expected to follow in 2013 or later.
the transitional rules adopted in the amended ifrs 9
imply implementation of the standard by 2015. the eu
has decided to postpone adoption of the amended ifrs
9 until the details of the entire standard are known.
under ifrs 9, financial assets are classified on the
basis of the business model adopted for managing the
assets and on the basis of their contractual cash flow
characteristics, including any embedded derivatives
(unlike ias 39, ifrs 9 no longer requires bifurcation).
assets held with the objective of collecting contractual
cash flows that are solely payments of principal and
interest on the principal amount outstanding are
measured at amortised cost. other assets are
measured at fair value through profit or loss.
the principles applicable to financial liabilities are
largely unchanged from ias 39. Generally, financial
liabilities are still measured at amortised cost with
bifurcation of embedded derivatives not closely
related to a host contract. financial liabilities
measured at fair value comprise derivatives, the
trading portfolio and liabilities designated at fair value
through profit or loss. however, value adjustments
relating to the inherent credit risk of financial
liabilities designated at fair value are recognised
in other comprehensive income unless this leads
to an accounting mismatch.
ifrs 9 incorporates the existing derecognition
principles of ias 39.
meaningful classification of financial instruments
is not possible without information about the future
parts of ifrs 9 to clarify the overall accounting
effects of the standard.

DANSKE BANK PLC / FINANCIAL STATEMENTS AND ANNUAL REPORT 2012 14
the iasB ended its project on consolidation in
may 2011 by issuing a number of new international
financial reporting standards (ifrs 10, ifrs 11 and
ifrs 12) and revised standards (ias 27 and ias 28).
With these standards the iasB establishes a uniform
definition of control to be used for determining
whether an entity should be consolidated and
introduces enhanced disclosure requirements for
consolidated and unconsolidated entities, joint
arrangements and associated undertakings.
Danske Bank Plc Group will adopt the standard
form 1 January 2014 in accordance with the eu’s
postponement of the effective date by one year.
the Group does not expect the new requirements to
significantly change its consolidation of undertakings.
in may 2011, the iasB issued ifrs 13, fair Value
measurement. the standard introduces a new
definition of fair value and provides guidance on how
to measure and disclose fair value. ifrs 13 applies
when another standard requires fair value to be used
or *disclosed. the standard was adopted from 1
January 2013. adoption did not result any significant
effect on the Group’s financial results.
in June 2011, the iasB issued an amended ias 19,
employee Benefits. the amended standard eliminates
the option to defer the recognition of actuarial gains
and losses on defined benefit pension plans, known as
the “corridor method”. the present value of net pension
assets and obligations must be recognised in the
balance sheet instead. the Group will adopt the
standard from the beginning of 2013, but this
standard will not affect its present financial results.
in December 2011, the iasB clarified the ias 32
requirements for offsetting financial instruments.
the clarification is not expected to change the
offsetting of financial instruments to any significant
degree. the iasB also enhanced its ifrs 7 disclosure
requirements to include both gross and net amounts
when offsetting financial instruments and rights to
additional set-off in the event of counterparty default.
the changes, which have not yet been adopted by
the eu, must be implemented in 2014 and 2013,
respectively.
COnsOLiDATiOnsubsidiaries
the consolidated financial statements cover Danske
Bank Plc and group undertakings in which the Group
has control over financial and operating policy
decisions. control is said to exist if Danske Bank Plc
directly or indirectly holds more than half of the voting
rights in an undertaking or otherwise has power to
control management and operating policy decisions,
provided that most of the return on the undertaking
accrues to the Group and that the Group assumes most
of the risk. operating policy control may be exercised
through agreements about the undertaking’s activities.
Potential voting rights that are exercisable on the
balance sheet date are included in the assessment of
whether Danske Bank Plc controls an undertaking.
the consolidated financial statements are prepared by
consolidating items of the same nature and
eliminating intra-group transactions, balances and
trading profits and losses.
undertakings acquired are included in the accounts
at the time of acquisition. the net assets of such
undertakings (assets including identifiable intangible
assets, less liabilities and contingent liabilities) are
included in the financial statements at fair value on
the date of acquisition according to the acquisition
method.
if the cost of acquisition (including direct transaction
costs until 1 January 2010) exceeds the fair value of
the net assets acquired, the excess amount is
recognised as goodwill. Goodwill is recognised in the
functional currency of the undertaking acquired. if the
fair value of the net assets exceeds the cost of
acquisition (negative goodwill), the excess amount is
recognised as income at the date of acquisition. the
portion of the acquisition that is attributable to non-
controlling interests does not include goodwill.
Divested undertakings are included in the accounts
until the transfer date.
Associated undertakings
associated undertakings are businesses, other than
subsidiaries, in which the Group has holdings and
significant influence but not control. the Group
generally classifies undertakings as associated
undertakings if Danske Bank Plc, directly or
indirectly, holds 20-50% of the share capital and
has influence over management and operating
policy decisions.
holdings are recognised at cost at the date of
acquisition and are subsequently measured according
to the equity method. the proportionate share of the

DANSKE BANK PLC / FINANCIAL STATEMENTS AND ANNUAL REPORT 2012 15
net profit and loss of the individual undertaking is
included under net income from investments.
the proportionate share of the profit and loss on
transactions between associated undertakings and
group undertakings is eliminated.
list of subsidiaries and associated undertakings
included in the consolidated annual report can be
found from page 81.
segment reporting
the Group consists of a number of business units and
resource and support functions. the business units
are segmented according to organizational structure.
inter-segment transactions are settled on an arm’s-
length basis. expenses incurred centrally, including
expenses incurred by support, administrative and
back-office functions, are charged to the business
units according to consumption and activity at
calculated unit prices or market prices, if available.
segment assets and liabilities are assets and
liabilities that are used for maintaining the operating
activities of a segment or have come into existence as
a result of such activities and that are either directly
attributable or may be reasonably allocated to a
segment. a calculated share of shareholders’ equity is
allocated to each segment. other assets and liabilities
are recognised in the other activities segment.
liquidity expenses are allocated on the basis of a
maturity analysis of loans and deposits. Prices are
based on interbank rates and funding spreads.
Offsetting
assets and liabilities are netted when the Group has
a legally enforceable right to set off recognised
amounts and intends either to settle the balance
on a net basis or to realise the asset and settle the
liability simultaneously.
Translation of transactions in foreign currency
the presentation currency of the consolidated
financial statements is euro which is also the
functional currency. monetary assets and liabilities in
foreign currency are translated at the exchange rates
at the balance sheet date. exchange rate adjustments
of monetary assets and liabilities arising as a result of
differences in the exchange rates at the transaction
date and at the balance sheet date are recognised in
the income statement.
transactions in foreign currency are translated at the
exchange rate of the unit’s functional currency at the
transaction date. Gains and losses on exchange rate
differences between the transaction date and the
settlement date are recognised in the income
statement. non-monetary assets and liabilities in
foreign currency that are subsequently revalued at fair
value are translated at the exchange rates at the date of
revaluation. exchange rate adjustments are included in
the fair value adjustment of an asset or liability. other
non-monetary items in foreign currency are translated
at the exchange rates at the transaction date.
Critical accounting policies and estimates
management’s judgment, estimates and assumptions of
future events that will significantly affect the carrying
amounts of assets and liabilities underlie the preparation
of the Group’s consolidated financial statements.
the estimates and assumptions that are deemed
critical to the consolidated financial statements are
• t hefairvaluemeasurementoffinancial
instruments
• t hemeasurementofloansandadvances
• t hemeasurementofgoodw ill
• t herecognit ionofdeferredtaxassets
the estimates and assumptions are based on
premises that management finds reasonable but are
inherently uncertain and unpredictable. the premises
may be incomplete, unexpected future events or
situations may occur, and other parties may arrive at
other estimated values.
Fair value measurement of financial instruments
measurements of financial instruments based on
prices quoted in an active market or based on
generally accepted models employing observable
market data are not subject to critical estimates.
measurements of financial instruments that are only
to a limited extent based on observable market data,
such as unlisted shares and certain bonds for which
there is no active market, are subject to estimates.
the estimated fair value of illiquid bonds significantly
depends on the estimated current credit spread.
Measurement of loans and advances
the Group makes impairment charges to account for
any impairment of loans and advances that occurs after
initial recognition. impairment charges consist of
individual and collective charges and rely on a number

DANSKE BANK PLC / FINANCIAL STATEMENTS AND ANNUAL REPORT 2012 16
of estimates, including identification of loans or
portfolios of loans with objective evidence of
impairment, expected future cash flows and the
value of collateral. the Group determines the need for
impairment charges on the basis of customers’ expected
ability to repay their debts. their ability depends on a
number of factors, including the customers’ earnings
capacity and trends in general economic growth and
unemployment. expectations of deteriorating repayment
ability reduce credit quality and lead to downgrading of
customers. the extent of losses incurred under non-
performing loan agreements depends, among other
factors, on the value of collateral provided.
Measurement of goodwill
Goodwill on acquisition is tested for impairment once
a year or more frequently if indications of impairment
exist. impairment testing requires management to
estimate future cash flows from acquired units.
a number of factors affect the value of such cash
flows, including discount rates.
Recognition of deferred tax assets
Deferred tax assets arising from unused tax losses
are recognised to the extent that such losses can be
offset against tax on future profit. recognition of
deferred tax assets requires management to assess
the probability and amount of future taxable profit at
units with unused tax losses
Classification and recognition of financial
instruments in balance sheet
Purchases and sales of financial instruments are
measured at fair value at the settlement date.
Classification
at initial recognition, a financial asset is assigned to
one of the following two categories:
• t radingport foliomeasuredatfairvaluet hrough
profit and loss
• loansandadvancesmeasuredatamort isedcost
at initial recognition, a financial liability is assigned to
one of the following three categories:
• t radingport foliomeasuredatfairvaluet hrough
profit and loss
• financialliabilit iesdesignatedatfairvalue
through profit or loss
• ot herfinancialliabilit iesmeasuredatamort ised
cost
Recognition
the purchase and sale of financial assets and
liabilities at fair value through profit or loss are
recognised in the balance sheet on the settlement
date, or the date on which the Group agrees to buy or
sell the asset or liability in question. loans granted
are recognised as financial assets on the date on
which the customer draws the loan and other
receivables on the trans action date.
Derivative instruments, quoted securities and foreign
exchange spot transactions are recognized on and
derecognized from the balance sheet on the
settlement date.
financial assets and liabilities are offset and the
net amount reported in balance sheet only if there
is a legally enforceable right to offset the recognised
amounts and there is an intention to settle on a net
basis.
financial assets are derecognised when the
contractual right to receive cash flows from the
financial assets has expired or the Group has
transferred all risks and rewards of ownership.
financial liabilities are derecognised when they are
extinguished, i.e. when the obligation is discharged,
cancels or expires.
transaction costs are included in the initial carrying
amount, unless the item is measured at fair value
through the profit and loss.
Due from credit institutions and central banks
amounts due from credit institutions and central banks
comprise amounts due from other credit institutions
and term deposits with central banks. reverse
transactions (purchases of securities from credit
institutions and central banks that the Group agrees
to resell at a later date) are recognised as amounts
due from credit institutions and central banks.
amounts due from credit institutions and central
banks are measured at amortised cost as described
under loans and advances at amortised cost.
Trading portfolio (assets and liabilities)
the trading portfolio includes financial assets and
liabilities acquired or undertaken by the Group for sale
or repurchase in the near term. the trading portfolio
also contains collectively managed financial assets
and liabilities for which a pattern of short-term profit

DANSKE BANK PLC / FINANCIAL STATEMENTS AND ANNUAL REPORT 2012 17
taking exists. Derivatives, including bifurcated
embedded derivatives, form part of the trading
portfolio.
the trading portfolio is measured at fair value through
profit and loss. realised and unrealised capital gains
and losses and dividends are carried in the income
statement under net trading income.
Fair value option – financial liabilities designated as at
fair value through profit and loss
financial liabilities at fair value through profit and loss
includes issued certificates of deposits.
financial liabilities at fair value through profit and loss
are measured at fair value. interest income and
expenses on financial instruments carried at fair
value are presented in net interest income, realised
and unrealised capital gains and losses are included
in net trading income.
Hedge accounting
the Group uses derivatives to hedge the interest rate
risk on fixed-rate assets and fixed-rate liabilities
measured at amortised cost. hedged risks that meet
specific criteria qualify for fair value hedge accounting
and are treated accordingly. the interest rate risk on
the hedged assets and liabilities is measured at fair
value through profit or loss.
if the hedge criteria cease to be met, the accumulated
value adjustments of the hedged items are amortised
over the term to maturity.
Loans and advances at amortised cost
loans and advances consists of loans and advances
disbursed directly to borrowers and loans and
advances acquired after disbursement. loans and
advances extended or acquired by the Group for
resale in the near term are included in the trading
portfolio. loans and advances includes conventional
bank loans, finance leases and reverse transactions,
except for transactions with credit institutions and
central banks.
at initial recognition, loans and advances are
measured at fair value plus transaction costs.
subsequently, they are measured at amortised cost,
according to the effective interest method, less any
impairment charges. the difference between the value
at initial recognition and the redemption value is
amortised over the term to maturity and recognised
under interest income. if fixed-rate loans and
advances and amounts due are accounted for under
hedge accounting that is determined effective, the fair
value of the hedged interest rate risk is added to the
amortised cost of the assets.
impairment
if objective evidence of impairment of a loan, an
advance or an amount due exists, and the effect of
the impairment event or events on the expected cash
flow from the loan is reliably measurable, the Group
determines the impairment charge individually.
significant loans, advances and amounts due are
tested individually for impairment at the end of each
reporting period.
objective evidence of impairment of loans and
advances exists if at least one of the following events
has occurred:
• Theborrowerisexperiencingsignificantfinancial
difficulties
• Theborrower’sact ions,suchasdefaultor
delinquency in interest or principal payments, lead
to a breach of contract
• TheGroup,forareasonsrelat ingtot heborrower’s
financial difficulty, grants to the borrower a
concession that the Group would not otherwise
grant
• Itbecomesprobablet hatt heborrowerw illenter
bankruptcy or other financial restructuring
the impairment charge equals the difference between
the carrying amount of the loan and the present value
of the most likely future cash flows from the loan and is
assessed by credit officers. the present value of fixed-
rate loans and advances is calculated at the original
effective interest rate, whereas the present value of
loans and advances with a variable rate of interest is
calculated at the current effective interest rate.
the customer’s debt is written down to the amount
that the borrower is expected to be able to repay after
a financial restructuring. if financial restructuring is
not possible, the write-down equals the estimated
recoverable amount in the event of bankruptcy. if the
borrower’s ability to repay depends significantly on
the assets that have been provided as collateral (asset
financing), the customer’s debt is written down to the
fair value of the collateral.
DANSKE BANK PLC / FINANCIAL STATEMENTS AND ANNUAL REPORT 2012 18
loans and advances without objective evidence of
impairment are included in an assessment of
collective impairment at portfolio level. collective
impairment is calculated for portfolios of loans and
advances with similar credit characteristics when
impairment of expected future cash flows from a
portfolio has occurred. the collective impairment
charge reflects downgrading of customer ratings over
time (migration). the loans and advances are divided
into portfolios on the basis of current ratings.
calculation of charges also factors in loan portfolios
for customers with upgraded ratings.
the cash flows are specified by means of parameters
used for solvency calculations and historical loss
data adjusted for use in the financial statements,
for example. the adjustment reflects the loss
identification period shown by the Group’s empirical
data. this period is the period from the first evidence
of impairment to the determination of a loss at
customer level.
collective impairment is calculated as the difference
between the carrying amount of the loans and
advances of the portfolio and the present value of
expected future cash flows.
the collective impairment charge based on migration
is adjusted if the Group is aware of market conditions
at the balance sheet date that are not fully reflected in
the Group’s models. in times of favourable economic
conditions, adjustments will reduce the impairment
charge, while it may increase in an economic
downturn. examples of such market conditions are
levels of unemployment and housing prices.
impairment charges for loans, advances and
guarantees are booked in an allowance account and
set off against loans and advances or recognised as
provisions for guarantees. impairment charges for
loans and advances are recorded under loan
impairment charges in the income statement. if
subsequent events show that impairment is not
permanent, charges are reversed.
loans and advances that are considered uncollectible
are written off. Write-offs are debited to the allowance
account. loans and advances are written off once the
usual collection procedure has been completed and
the loss on the individual loan or advance can be
calculated. if the full loss is not expected to be realised
until after a number of years, for example in the event
of administration of complex estates, a partial write-
off is recognised, reflecting the Group’s claim less
collateral, estimated dividend and other cash flows.
in accordance with the effective interest method,
interest is recognised on the basis of the value of
the loans and advances less impairment charges.
consequently, part of the allowance account balance
is set aside for future interest income until the time
of write-off.
Leases
Group as a lessor
leases in which assets are leased out and
substantially all the risks and rewards of ownership
are transferred to the lessee are classified as finance
leases. finance leases are recognised as receivables
in the balance sheet at an amount equal to the net
investment in the leases. the lease payment is
allocated between the repayment of principal and
interest income. the interest income is amortised over
the lease period so as to achieve a constant periodic
rate of return on the remaining net investment for the
lease term. finance leases are included in loans and
receivables and interest in interest income.
leases in which assets are leased out and the Group
retains substantially all the risks and rewards of
ownership are classified as operating leases. these
rented assets are included in Property, plant and
equipment in the balance sheet. they are depreciated
over their expected useful lives on the basis consistent
with similar owned property, plant and equipment, and
thy impairment losses are recognised on the same
basis as for these items. rental income on assets held
as operating leases is recognised on a straight-line
basis over the lease term in profit and loss.
Group as a lessee
leases of assets in which substantially all the risks
and rewards of ownership are transferred to the
Group are classified as finance leases. finance leases
are recognised at the lease’s inception at the lower of
the fair value of the leased asset and the present value
of the minimum leases payments. the corresponding
obligation is included in other liabilities in the balance
sheet. the assets acquired under financial leases are
amortised or depreciated over the shorter of the
asset’s useful life and the lease term. each lease
payment is allocated between the liability and the
interest expense. the interest expense is amortised
over the lease period to produce a constant periodic
DANSKE BANK PLC / FINANCIAL STATEMENTS AND ANNUAL REPORT 2012 19
rate of interest on the remaining balance of the
liability for each period.
assets in which the lessor retains substantially all the
risks and rewards of ownership are classified as
operating leases and they are included in the lessor’s
balance sheet. Payment made on operating leases are
recognised on a straight-line basis over the lease term
as rental expenses in profit and loss.
inTAngiBLE AssETsgoodwill
Goodwill arises on the acquisition of an undertaking
and is calculated as the difference between the cost
of the undertaking and the fair value of its net assets,
including contingent liabilities, at the time of acquisition.
Goodwill is allocated to cash-generating units at the
level at which management monitors the investment.
Goodwill is not amortised; instead each cash-
generating unit is tested for impairment once a year or
more frequently if indications of impairment exist.
Goodwill is written down to its recoverable amount
through profit or loss if the carrying amount of the net
assets of the cash-generating unit exceeds the higher
of the assets’ fair value less costs to sell and their
value in use, which equals the present value of the
future cash flows expected from the unit.
Other intangible assets
software acquired is measured at cost, including
expenses incurred to make each software application
ready for use. software acquired is amortised over its
expected useful life, which is usually three years,
according to the straight-line method.
software developed by the Group is recognised as an
asset if the cost of development is reliably measurable
and analyses show that the future earnings from
using the individual software applications exceed
cost. cost is defined as development costs incurred to
make each software application ready for use. once a
software application has been developed, the cost is
amortised over the expected useful life, which is
usually three years, according to the straight-line
method. the cost of development consists primarily of
direct remuneration and other directly attributable
development costs. expenses incurred in the planning
phase are not included but booked when incurred.
identifiable intangible assets taken over on the
acquisition of undertakings are measured at the time
of acquisition at their fair value and amortised over
their expected useful lives, which are usually three
years, according to the straight-line method. the value
of intangible assets with indefinite useful lives is not
amortised, but the assets are tested for impairment at
least once a year according to the principles applicable
to goodwill.
other intangible assets to be amortised are tested for
impairment if indications of impairment exist, and the
assets are subsequently written down to their
recoverable amount.
costs attributable to the maintenance of intangible
assets are expensed in the year of maintenance.
investment property
investment property is real property, including real
property let under operating leases, which the Group
owns for the purpose of receiving rent and/or
obtaining capital gains. the section on domicile
property below explains the distinction between
domicile and investment property.
on acquisition, investment property is measured at cost,
including transaction costs, and subsequently measured
at fair value. fair value adjustments and rental income
are recognised under other income in the income
statement. real property taken over by the Group under
non-performing loan agreements that is expected
to be sold within 12 months of classification is valued
in accordance with principled used for investment
property but presented as assets held for sale.
the fair value is assessed at least once a year.
assessment is based on the actual selling prices,
market prices and evaluations made by external
valuators. Based on the assessment of future events
and information available management has
determined the fair value.
Tangible assets
tangible assets includes domicile property, machinery,
furniture and fixtures. machinery, furniture and
fixtures covers equipment, vehicles, furniture, fixtures,
leasehold improvement and leased assets.
Domicile property
Domicile property is real property occupied by the
Group’s administrative departments, branches and
other service units. real property with both domicile
and investment property elements is allocated

DANSKE BANK PLC / FINANCIAL STATEMENTS AND ANNUAL REPORT 2012 20
proportionally to the two categories if the elements
are separately sellable. if that is not the case, such real
property is classified as domicile property, unless the
Group occupies less than 10% of the total floorage.
Domicile property is measured at cost plus property
improvement expenditure and less depreciation and
impairment charges. the straight-line depreciation of
the property is based on the expected scrap value and
an estimated useful life of 20 to 50 years. real
property held under long-term leases is depreciated
on a progressive scale.
investment property which becomes domicile property
because the Group starts using it for its own activities
is measured at fair value at the time of reclassification.
Domicile property which becomes investment property
is measured at fair value at the time of reclassification.
Domicile property which, according to a publicly
announced plan, the Group expects to sell within 12
months is recognised as an asset held for sale under
other assets. the same principle applies to property
taken over in connection with the settlement of debt if
such property is likely to be sold within 12 months.
however, if such property is unlikely to be sold within
this period, it is classified as investment property.
Machinery, furniture and fixtures
equipment, vehicles, furniture, fixtures and property
improvement expenditure are measured at cost less
depreciation and impairment charges. assets are
depreciated over their expected useful lives, which
are usually three years, according to the straight-line
method. leasehold improvements are depreciated
over the term of the individual lease, with a maximum
of 10 years.
Lease assets
lease assets consists of assets, except real property,
let under operating leases. lease assets are measured
using the same valuation technique as that applied by
the Group to its other equipment, vehicles, furniture
and fixtures. When, at the end of the lease period,
lease assets are put up for sale, the assets are
transferred to other assets.
impairment
tangible assets are tested for impairment if indications
of impairment exist. an impaired asset is written down
to its recoverable amount, which is the higher of its fair
value less costs to sell and its value in use.
Other assets
other assets includes interest and commission due,
prepayments and lease assets put up for sale at the
expiry of lease agreements.
lease assets put up for sale are measured at the lower
of their carrying amount at the time of reclassification
(expiry of lease agreements) and their fair value less
expected costs to sell.
Amounts due to credit institutions and central banks/
Deposits
amounts due to credit institutions and central banks
and Deposits include amounts received under repo
transactions (sales of securities which the Group
agrees to repurchase at a later date).
amounts due to credit institutions and central banks
and Deposits are measured at amortised cost and
where hedge accounting applies at amortised cost
plus the fair value of the hedged interest rate risk.
Other issued bonds/subordinated debt
other issued bonds and subordinated debt comprise
bonds issued by the Group. subordinated debt is
liabilities in the form of subordinated loan capital and
other capital investments which, in case of the Group’s
voluntary or compulsory winding-up, will not be repaid
until the claims of its ordinary creditors have been met.
other issued bonds and subordinated debt are
measured at amortised cost plus the fair value of the
hedged interest rate risk.
the yield on some issued bonds depends on an index
that is not closely linked to the bonds’ financial
characteristics, for example an equity or commodity
index. such embedded derivatives are bifurcated and
measured at fair value in the trading portfolio.
Other liabilities and provisions
other liabilities includes accrued interest, fees and
commissions that do not form part of the amortised
cost of a financial instrument. other liabilities also
includes pension obligations and provisions for other
obligations, such as lawsuits and guarantees.
a provision is recognised if, as a result of a past event,
the Group has a present legal or constructive
obligation that can be estimated reliably, and it is
probable that an outflow of economic benefits will be
required to settle the obligation.

DANSKE BANK PLC / FINANCIAL STATEMENTS AND ANNUAL REPORT 2012 21
if a lawsuit is likely to result in a payment obligation, a
liability is recognised if it can be measured reliably.
the liability is recognised at the present value of
expected payments.
Fair value
the fair value of financial assets and liabilities is
measured on the basis of quoted market prices of
financial instruments traded in active markets.
if an active market exists, fair value is based on the
most recently observed market price at the balance
sheet date.
if a financial instrument is quoted in a market that is
not active, the Group bases its valuation on the most
recent transaction price. it adjusts the price for
subsequent changes in market conditions, for instance
by including transactions in similar financial
instruments that are motivated by normal business
considerations.
if an active market does not exist, the fair value of
standard and simple financial instruments, such as
interest rate and currency swaps and unlisted bonds,
is measured according to generally accepted
measurement methods. market-based parameters are
used to measure fair value. the fair value of more
complex financial instruments, such as swaptions,
interest rate caps and floors, and other otc products,
is measured on the basis of internal models, many of
which are based on valuation techniques generally
accepted within the industry.
the results of calculations made on the basis of
valuation techniques are often estimates, because
exact values cannot be determined from market
observations. consequently, additional parameters,
such as liquidity and counterparty risk, are
sometimes used to measure fair value.
if, at the time of acquisition, a difference arises
between the value of a financial instrument calculated
on the basis of non-observable inputs and actual cost
[day-one profit and loss] and the difference is not the
result of transaction costs, the Group calibrates the
model parameters to the actual cost.
Pension obligations
the Group’s pension obligations consist of defined
contribution benefit pension plan for its personnel.
under defined contribution pension plans, the Group
pays regular contributions to insurance company and
has no legal of constructive obligations to pay future
contribution. such payments are expensed as they are
earned by the staff, and the obligations under the
plans are taken over by the insurance companies and
other institutions.
irrevocable loan commitments and guarantees
at initial recognition, irrevocable loan commitments
and guarantees are recognised at the amount of
premiums received. subsequently, guarantees are
measured at the higher of the received premium
amortised over the guarantee period and the provision
made, if any. Provisions for irrevocable loan
commitments and guarantees are recognised under
other liabilities if it is probable that drawings will be
made under a loan commitment or claims will be made
under a guarantee and the amount payable can be
reliably measured. the liability is measured at the
present value of expected payments. irrevocable loan
commitments are discounted in accordance with the
interest terms.
Deferred tax assets/Deferred tax liabilities
Deferred tax on all temporary differences between the
tax base of assets and liabilities and their carrying
amounts is accounted for in accordance with the
balance sheet liability method. Deferred tax is
recognised under Deferred tax assets and Deferred
tax liabilities.
the Group does not recognise deferred tax on
temporary differences between the tax base and
the carrying amounts of goodwill not subject to
amortisation for tax purposes and other items if the
temporary differences arose at the time of acquisition
without effect on net profit or taxable income. if the tax
base may be calculated according to several sets of tax
regulations, deferred tax is measured in accordance
with the regulations that apply to the use of the asset or
settlement of the liability as planned by management.
tax assets arising from unused tax losses and unused
tax credits are recognised to the extent that such
unused tax losses and unused tax credits can be used.
Deferred tax is measured on the basis of the tax
regulations and rates that, according to the rules in
force at the balance sheet date, are applicable in the
relevant countries at the time the deferred tax is
expected to crystallise as current tax. changes in
deferred tax as a result of changes in tax rates are
recognised in the income statement.

DANSKE BANK PLC / FINANCIAL STATEMENTS AND ANNUAL REPORT 2012 22
Current tax assets/Current tax liabilities
current tax assets and liabilities are recognised on
the balance sheet as the estimated tax payable on the
profit for the year adjusted for prepaid tax and accrued
and due tax payments for previous years.
tax assets and liabilities are netted if permitted by law
and provided that the items are expected to be subject
to net or simultaneous settlement.
Fiduciary activities
the fiduciary services supplied by Danske Bank Plc
Group are discretionary asset management services,
mutual fund services and securities custody services.
in these activities, assets are held and placed on behalf
of customers. these assets and the income arising
thereon are excluded from these financial statements,
as they are not asset of Danske Bank Plc Group.
DANSKE BANK PLC / FINANCIAL STATEMENTS AND ANNUAL REPORT 2012 23
interest income and expenses
interest income and expenses arising from interest-
bearing financial instruments measured at amortised
cost are recognised in the income statement according
to the effective interest method on the basis of the
cost of the individual financial instrument. interest
includes amortised amounts of fees that are an
integral part of the effective yield on a financial
instrument, such as origination fees, and amortised
differences between cost and redemption price, if any.
interest income and expenses also include interest on
financial instruments measured at fair value, but not
interest on assets and deposits under pooled schemes
and unit-linked investment contracts; the latter is
recognised under net trading income. origination fees
on loans measured at fair value are recognised under
interest income at origination.
interest on loans and advances subject to individual
impairment is recognised on the basis of the impaired
value.
Fee income and expenses
fee income and expenses are broken down into fees
generated by activities and fees generated by portfolios.
income from and expenses for services provided over
a period of time, such as guarantee commissions and
investment management fees, are accrued over the
period. transaction fees, such as brokerage and
custody fees, are recognised on completion of the
individual transaction.
net trading income
net trading income includes realised and unrealised
capital gains and losses on trading portfolio assets
and other securities as well as exchange rate
adjustments and dividends. the effect on profit or loss
of fair value hedge accounting is also recognised
under net trading income.
Other income
other income includes rental income and lease
payments under operating leases, fair value
adjustments of investment property, amounts received
on the sale of lease assets and gains and losses on the
sale of other tangible and intangible assets.
income from associated undertakings
income from associated undertakings comprises the
Group’s proportionate share of the net profit or loss of
the individual undertakings.
Profit on sale of associated undertakings
the profit on sale of associated and group
undertakings is the difference between the selling
price and the carrying amount, including goodwill, if
any, of such sale.
sTAFF COsTs AnD ADMinisTRATivE ExPEnsEsstaff costs
salaries and other remuneration that the Group
expects to pay for work carried out during the year
are expensed under staff costs and administrative
expenses. this item includes salaries, performance-
based pay, expenses for share-based payments,
holiday allowances, anniversary bonuses, pension
costs and other remuneration.
Performance-based pay and share-based payments
Performance-based pay is expensed as it is earned.
Part of the performance-based pay for the year is paid
in the form of equity-settled options (suspended in
2008) and conditional shares. share options may not
be exercised until three years after the grant date and
are conditional on the individual employee’s not
having resigned from the Group. rights to conditional
shares vest up to five years after the grant date,
provided that the employee, with the exception of
retirement, has not resigned from the Group. in
addition to this requirement, the vesting of rights
earned from 2010 is conditional on certain
performance targets.
the fair value of share-based payments at the grant
date is expensed over the service period that
unconditionally entitles the employee to the payment.
the intrinsic value of the options is expensed in the
year in which the share-based payments are earned,
while the time value is accrued over the remaining
INCOME STATEMENT
DANSKE BANK PLC / FINANCIAL STATEMENTS AND ANNUAL REPORT 2012 24
service period. expenses are set off against
shareholders’ equity. subsequent fair value
adjustments are not carried in the income statement.
Amortisation, depreciation and impairment charges
in addition to amortisation, depreciation and
impairment charges for intangible and tangible assets,
the Group expenses the carrying amount of lease
assets sold at the expiry of a lease agreement.
Loan impairment charges
loan impairment charges includes losses on and
impairment charges for loans, advances, amounts
due from credit institutions and guarantees, as well
as fair value adjustments of the credit risk on loans
measured at fair value.
the item also includes impairment charges and
realised gains and losses on tangible assets and
businesses taken over by the Group under non-
performing loan agreements if the assets qualify as
held-for-sale assets. similarly, subsequent value
adjustments of assets that the Group has taken over
and does not expect to sell within 12 months are
recognised under loan impairment charges.
Tax
calculated current and deferred tax on the profit for
the year and adjustments of tax charges for previous
years are recognised in the income statement. current
tax is calculated based on the valid tax rate.
Cash flow statement
the Group has prepared its cash flow statement
according to the indirect method. the statement is
based on the pre-tax profit for the year and shows the
cash flows from operating, investing and financing
activities and the increase or decrease in cash and
cash equivalents during the year.
cash and cash equivalent consists of cash in hand and
demand deposits with central banks and amounts due
from credit institutions and central banks with
original maturities shorter than three months.
DANSKE BANK PLC / FINANCIAL STATEMENTS AND ANNUAL REPORT 2012 25
CORPORATE GOVERNANCE
general meeting
the ultimate decision-making power in the company
is exercised by its shareholders at a General meeting
of shareholders.
Board of Directors
a chairman, vice chairman and at least three but no
more than seven ordinary members are elected to
the Board of Directors for an indefinite term by the
General meeting of shareholders.
the Board of Directors comprised the follow persons:
tonny thierry andersen (chairman), henrik ramlau-
hansen (vice chairman), niels-ulrik mousten, ilkka
hallavo, esko mäkeläinen and maija strandberg.
among the current Board members esko mäkeläinen
and maija strandberg are independent of the Danske
Bank Group.
the Board of Directors is responsible for looking after
the company’s administration and appropriate
organization of operations, and ensuring that the
supervision of the company’s accounting and asset
management has been arranged suitably. the Board
handles all matters that are of extensive and
fundamental importance for the operation of the
company and the entire Group. the Board takes
decisions on matters such as the Danske Bank Plc
Group’s business strategy, and it approves the budget
and the principles for arranging the Danske Bank Plc
Group’s risk management and internal control. the
Board also approves the objectives for the Group’s
human resources planning and monitors the
implementation of these objectives, and it decides the
basis for the Group’s remuneration system and other
far-reaching matters that concern the personnel. in
accordance with the principles of good governance,
the Board also ensures that the company, in its
operations, endorses the corporate values set out
for compliance.
the Board of Directors approved written rules of
procedure on 4 march 2010, defining the Board’s
duties and its meeting arrangements. the Board
conducts an annual review of its activities and
working practices in the form of an internal self-
assessment. the Board of Directors and the chief
executive officer (ceo) shall manage the company and
the entire Group in a professional manner and in
accordance with sound and prudent business
principles.
the Board of Directors of Danske Bank Plc convened
eleven times during 2012. in accordance with the
decision of the General meeting, Board members who
are not from within the Danske Bank Group were paid
an annual fee of eur 35,000.
Committees appointed by the Board of Directors
to ensure that the bank’s risk management
organisation meets both the external and internal
requirements, the Board of Directors has set up a
risk committee chaired by Danske Bank Plc’s ceo.
the principal function of the risk committee is to
ensure that:
• DanskeBankPlccompliesw it ht heguidanceon
risks issued by the Board of Directors
• DanskeBankPlcmonitorsallt y pesofriskand
reports on these to the relevant parties including
Danske Bank Plc’s Board of Directors
• DanskeBankPlc’sv iewofrisksisconsistentw it h
the risk strategy of the Danske Bank Group
• DanskeBankPlcfollowst heriskpoliciesoft he
Danske Bank Group
• DanskeBankPlccompliesw it hallt heregulator y
requirements.
Danske Bank Plc’s Board of Directors has also set up
the asset and liability committee (alco). the alco
is responsible for monitoring and administering the
structural interest rate risk in the balance sheet in
accordance with the committee’s view of interest
rates, Danske Bank Plc’s policies and delegated limits,
and it also decides on measures to protect the balance
sheet within the framework of the risk management
strategy and limits. the alco also determines the
operating target levels for liquidity risk management
and oversees the management of liquidity risk.
Chief Executive Officer and group Executive Committee
Danske Bank Plc’s Board of Directors appoints the
ceo and if necessary Deputy ceo. the ceo is

DANSKE BANK PLC / FINANCIAL STATEMENTS AND ANNUAL REPORT 2012 26
responsible for the company’s day-to-day management
in accordance with the limited liability companies
act and the instructions and orders issued by the
Board of Directors. the ceo’s duties include managing
and overseeing the company’s business operations,
preparing matters for consideration by the Board of
Directors and executing the decisions of the Board.
Danske Bank Plc’s ceo until 1.9.2012 was ilkka
hallavo (b. 1956) and as from 1.9.2012 Johanna
lamminen (b. 1966). risto tornivaara (b. 1958) acted
as Deputy ceo until 1.6.2012.
in 2012, the ceos were paid a salary and fringe
benefits of eur 384,434.95 in total. the ceos and
Deputy ceo received no shares or share-based rights
as remuneration during the financial year.
ceos period of notice is six months and the severance
compensation payable to the ceo in addition to the
salary paid for the period of notice equal to six months’
salary. ilkka hallavo’s, who was ceo until 1.9.2012,
period of notice has been eight months and the
compensation payable in addition to the salary for the
period of notice corresponds to 12 months’ salary.
in managing the company’s operations the ceo is aided
by the Group executive committee, which convenes at
the invitation of its chairman once a month. the Group
executive committee is responsible for supporting the
ceo in the preparation and implementation of
corporate strategy, coordination of the Group’s
operations, preparation and implementation of
significant or fundamental matters, and ensuring
internal cooperation and communication.
in managing its operations, Danske Bank Plc complies
with high moral and ethical standards. the company
constantly ensures that its operations comply with all
applicable laws and regulations. the responsibility for
supervising compliance with laws and regulations lies
with the operating management and the Board of
Directors. Various rules and regulations have been
issued to support operations and ensure that applicable
laws and regulations are observed throughout the
organisation.
Remuneration
the Danske Bank Plc Group operates a remuneration
scheme covering the entire personnel. the aim of the
remuneration scheme is to support the implementation
of the company’s strategy and to achieve the targets
set for the business areas. the Danske Bank Plc
Group is part of the Danske Bank Group. the
compensation committee set up by the Board of
Directors of Danske Bank a/s is responsible for
preparation of the Danske Bank Group’s remuneration
policy and any modifications to that policy.
Preparation of Danske Bank Plc’s remuneration policy
is based on the remuneration policy of Danske Bank
Group and takes due account of local regulations.
Preparation of Danske Bank Plc’s remuneration policy
is the responsibility of its compensation committee,
which is led by the head of human resources and
includes representatives of the bank’s business and
control functions. the remuneration policy is subject
to the approval of Danske Bank Plc’s Board of
Directors, which also monitors the implementation
and functioning of the policy each year. as a result of
the monitoring, the compensation committee submits
proposals and recommendations to the Board
concerning remuneration or modifications to the
existing remuneration scheme. the compensation
committee also monitors compliance with the
remuneration system and oversees the remuneration
for personnel responsible for the company’s risk
management and control functions.
the Group’s system of awarding variable bonuses is
part of its personnel incentives and part of the system
for committing staff to the company and to its targets.
in accordance with the remuneration policy, fixed
remuneration is nevertheless the most significant
element of the remuneration system. fixed salaries
rise either on the basis of a collective bargaining
agreement or on the basis of a personal increment
determined by the person’s superior. Pay rises require
the approval of the superior’s superior in accordance
with the remuneration policy guidelines. the Group
has no separate fringe benefits of any significance.
the Danske Bank Plc Group’s remuneration system
includes restrictions to ensure that no variable
bonuses are paid if the Group’s profit performance is
not favourable. the proportion given as variable
bonuses may not exceed the amount of fixed salaries
under most of the circumstances; instead, bonuses
can be no more than approx. 75% of fixed salaries.
the remuneration indicators are specified each year
by the directors of the business areas, and based on
the outcome of these the bonus for each business unit
is divided among the areas, teams and individual
employees. in all measurements a significant
DANSKE BANK PLC / FINANCIAL STATEMENTS AND ANNUAL REPORT 2012 27
weighting at the team and individual level is given to
the achievement of financial targets. supervisors also
give an assessment of whether all the Danske Bank
Plc Group personnel have performed their work in
compliance with the Group’s ethical rules and values.
the Board of Directors maintains an up-to-date list of
so-called risk takers and the bonuses paid to them.
risk takers are defined as those who work in the
company’s managerial positions, in internal control
tasks or who otherwise, on the basis of their work,
have a material influence on the Group’s risk position.
under the remuneration scheme principles, average
40% of the bonus for risk takers is paid only after
three years have elapsed.
Personnel Fund
the members of the Danske Bank Plc Group’s
Personnel fund comprise all personnel of Danske
Bank Plc and its subsidiaries except for those
members of the management teams and boards of
directors of Group companies who have an
employment contract, the chief executives/managing
directors of Group companies and other personnel
who are part of the management and who fall within
the sphere of the management remuneration system.
in respect of Danske Bank Plc and its finnish
subsidiaries, the estimate of the profit-sharing
bonuses to be paid on 2012 from the Personnel fund
is eur 0.0 million (eur 0.2 million).
Auditors
Danske Bank Plc has one auditor, which must be a firm
of authorised public accountants approved by the
central chamber of commerce. the term of the
auditor lasts until the next annual General meeting
following the auditor’s appointment.
Danske Bank Plc’s auditor is kPmB oy ab, a firm of
authorised public accountants, with Petri kettunen,
authorized Public accountant as the auditor with
principal responsibility. the primary function of the
statutory audit is to verify that the company’s financial
statements provide a true and fair view of the
company’s performance and financial position for
each accounting period.
in 2012, the Danske Bank Plc Group paid eurm 0.2
and the parent company eurm 0.1 in auditing fees.
the auditing firm also charged other fees, which
amounted to eurm 0.4 for the Group and eurm 0.4
for the parent company.
Description of the main features of the internal
control and risk management systems related to the
financial reporting process
Danske Bank Plc is a wholly owned subsidiary of
Danske Bank a/s. Danske Bank a/s is a listed
company and is the parent company of the Danske
Bank Group. the governance of the Danske Bank
Group accords with the legislative requirements
concerning Danish listed companies and especially
with the legislative requirements concerning
companies in the financial sector. the Danske Bank
Group complies in all essential respects with the good
governance recommendations issued by Denmark’s
committee on corporate Governance. further
information on the principles concerning corporate
governance in the Danske Bank Group is available at
the following internet address: www.danskebank.com.
Danske Bank Plc is a bond issuer and therefore
publishes the following description of the main
features of the internal control and risk management
systems related to its financial reporting process.
at Danske Bank Plc internal control is used for
purposes that include ensuring
• t hecorrect nessoffinancialreport ingandofot her
information used in management decision-making
• compliancew it hlawsandregulat ionsandw it h
the decisions of administrative organs and other
internal rules and procedures.
the company’s management operates the system of
control and supervision in order to reduce the
financial reporting risks and to oversee compliance
with reporting rules and regulations. With the controls
imposed the aim is to prevent, detect and rectify any
errors and distortions in financial reporting, though
this cannot guarantee the complete absence of errors.
Danske Bank Plc ’s Board of Directors regularly
assesses whether the company’s internal control
and risk management systems are appropriately
organised. the Board’s assessment is based on e.g.
documentation prepared by the company’s internal
audit unit. the Board also receives the report of an
external auditor on the bank’s administration and
on the state of its internal control. the Board and the
ceo regularly receive information on the company’s
financial position, changes in rules and regulations
and compliance with these within the Group.

DANSKE BANK PLC / FINANCIAL STATEMENTS AND ANNUAL REPORT 2012 28
the work of internal audit is subject to the Danske
Bank Group’s term of reference. this guidance states
that the internal auditing tasks include ensuring the
adequacy and efficiency of internal control and of the
controls on administrative, accounting and risk
management procedures. internal audit also ensures
that reporting is reliable and that laws and regulations
are complied with appropriately. in the auditing
process internal audit complies with the international
internal auditing standards and ethical principles and
audit also uses auditing procedures approved by the
Group that are based on examining and testing the
functioning of the control arrangements. local
internal auditing is undertaken in cooperation with the
Group’s internal audit.
internal audit performs function-specific and product-
specific audits and issues recommendations
concerning these and also monitors implementation of
the recommendations. internal audit also participates
in the auditing of annual and interim accounts and
provides internal consultancy and issues independent
expert opinions.
internal audit reports its auditing work to the Board of
Directors. the auditing strategy requires the approval
of the Board each year.
Good accounting practice is based on carefully
specified authorisations within the Group, appropriate
division of work tasks, regular reporting and the
transparency of activities. in management’s internal
reporting the same principles are observed as in
external reporting, and the principles are the same
throughout the Group. the Group’s common it system
creates the basis for reliable documentation of
accounting data and reduces the financial reporting
risks.
management accounting supports the bank’s senior
management by producing monitoring and analysis of
the performance of different business segments. the
reporting is produced not only for the bank’s top/
senior management but also for its segment and area
management. the indicators monitored vary from
monitoring of the quantity and quality of activities
and sales to reporting of risk-adjusted profitability.
most of the indicators are monitored monthly, but
selected indicators are monitored weekly or even
daily. management accounting also monitors the
bank’s market share and developments among
competitors and in the operating environment.
Besides the parties referred to above, supervision at
Danske Bank Plc is also undertaken by the risk
committee set up by the Board of Directors. the
committee’s chairman is the bank’s ceo. the purpose
of the risk committee is to oversee the bank’s
compliance with all guidance on risk management set
by the Board. more on the Danske Bank Plc Group’s
risk management can be read on page 31 of the
financial statements.

DANSKE BANK PLC / FINANCIAL STATEMENTS AND ANNUAL REPORT 2012 29
Risk Management general principles and governance
the main objectives of the risk management
processes are to ensure that risks are properly
identified, risk measurement is independent and the
capital base is adequate in relation to the risks. the
risks related to the Danske Bank Plc Group’s activities
and the sufficiency of the companies’ capitalisation in
relation to these risks is regularly evaluated. clearly
defined strategies and responsibilities, together with
strong commitment to the risk management process,
are our tools to manage risks.
the Board of Directors of Danske Bank Plc, together
with the Boards of Danske Bank Plc’s subsidiaries,
is responsible for ensuring that the Danske Bank Plc
Group’s risks are properly managed and controlled.
the Danske Bank Plc’s Board sets the principles of
risk management and provides guidance on the
organisation of risk management and internal control
in the business areas. to ensure that the risk
governance structure is adequate both in terms of
internal and external needs, the Board has established
a risk committee and nominated Danske Bank Plc’s
ceo as chairman of the committee.
the committee’s main tasks are:
• toensuret hatDanskeBankPlciscompliantw it h
the risk instructions issued by the Board of
Directors
• toensuret hatallriskt y pesinDanskeBankPlc
are monitored and reported to relevant parties
including the Board of Directors
• toensuret hatDanskeBankPlc’sv iewonriskis
aligned with Danske Bank Group’s risk strategy
• toensuret hatDanskeBankGroup’sriskpolicies
are implemented in Danske Bank Plc
• toensuret hatDanskeBankPlcf ulfilsall
regulatory requirements.
the asset and liability committee (alco) has also
been set by the Board. alco is responsible for
monitoring and directing the management of
structural interest rate risk of the balance sheet in
accordance with its own interest rate views, the
Bank’s policies and delegated limits including
approving any required balance sheet hedging activity
in line with risk management strategies and limits.
alco also determines the operational targets for the
liquidity risk management and oversees the liquidity
risk management.
DANSKE BANK RISK MANAGEMENT DISCLOSURES
Figure 4.1 Risk governance
structure
Business linesCredit
ALCO
Risk Committee
Board of Directors
OperationsLegal & ComplianceFinanceRisk
Management

DANSKE BANK PLC / FINANCIAL STATEMENTS AND ANNUAL REPORT 2012 30
Danske Bank Plc Group’s risk management, which is
an independent unit outside the business areas,
monitor Danske Bank Plc Group’s risk position
according to the principles and limits set by the Board
of Danske Bank Plc. the head of risk management is
chief risk officer who reports to Danske Bank Plc’s
ceo and is responsible for adequate and sound
oversight of Danske Bank Plc Group’s risk
management, providing an overview of Danske Bank
Plc Group’s risks and creating an overall risk picture.
the cro’s responsibilities cover all of the Bank’s
risks across risk types and organisational units, and
risks relating to outsourced activities. the credit risk
team is responsible for independent monitoring and
reporting of credit risks.
finance is responsible for market and liquidity risk
day-to-day monitoring and follow up, asset and
liability management as well as solvency reporting
(including the icaaP process).
it is the responsibility of each business area that all
the principles and limits set by the Danske Bank Plc’s
Board of Directors, committees set by the Board or
risk management unit are followed in the business
processes and decision making.
Principles and practices of risk management in
Danske Bank Plc Group are carried out consistently
with risk policies of Danske Bank Group and
supported by corresponding Danske Bank Group
functions. additional information on Danske Bank
Group level risks and Danske Bank Group’s risk
approaches can be found in Danske Bank Group’s
annual report and risk management report for 2012.
CAPiTAL REQuiREMEnTs AnD MAnAgEMEnTMinimum regulatory capital
Banking is a highly regulated business. there are
formal rules for minimum capital and capital structure
in capital adequacy regulation. also banks largest
exposures are limited based on capital included in the
capital adequacy own funds.
credit institutions act gives multiple options for
methods institutions may use in capital adequacy
calculation. Danske Bank Plc Group applies standard
method for credit and operational risks. market risks
are calculated according to regulatory approaches;
internal models are not used in regulatory reporting.
capital adequacy is reported quarterly to financial
supervision authority (fin-fsa). all Danske Bank Plc
Group companies fulfilled the regulatory minimum
capital requirements during 2012. minimum capital
requirements set by capital adequacy regulation are
presented in the risk table 1 below. total capital
requirement has decreased eur 146 million due to a
decrease in credit and counterparty risk.
RISK TABLE 1
Pillar 1 regulatory capital requirements by portfolio, EURm 2012 2011
Capital requirements for credit and
counterparty credit risk 1196 1345
Central governments and central banks 0 1
Administrative bodies and non-commercial
undertakings 2 4
Institutions 65 65
Corporates 574 641
Retail 141 244
Real estate 380 351
Past due items 27 30
Items belonging to regulatory high-risk
categories 3 1
Covered bonds 0 0
Other items 5 9
Securitisations positions 0 0
Capital requirement for market risk 23 17
General and specific risk 20 15
Commodity risk 3 2
Settlement risk 0 0
Capital requirement for operational risk 87 90
Total capital requirement 1306 1452
Total own funds 2586 2617
Capital management process
the basis of the Danske Bank Plc Group’s capital
management practices is the regulatory framework in
the capital requirements Directive (crD) with the
icaaP (internal capital adequacy assessment
Process) in Pillar 2.
Danske Bank Plc Group’s icaaP consists of
evaluating all relevant risks that the Danske Bank Plc
Group is exposed to. Besides the Pillar i risk types –
credit, market and operational risks – the Bank sets
capital aside for interest rate risk of the banking book,
business risk and, if required by stress tests, for
business cycle volatility buffer. liquidity risk is taken
into account through stress testing.

DANSKE BANK PLC / FINANCIAL STATEMENTS AND ANNUAL REPORT 2012 31
the latest Danske Bank Plc Group icaaP report was
prepared, approved by Danske Bank Plc’s Board and
delivered to fin-fsa in December 2012. the report
includes assessment of all internal and external
capital requirements Danske Bank Plc Group must
fulfil. the requirements have been stressed to reflect
severe negative development in economic
environment over three years’ time horizon. the
report shows that Danske Bank Plc Group is well
capitalized and has adequate capital buffers against
possible negative changes in market environment.
Main risk types
the major risks associated with Danske Bank Plc
Group’s activities are the credit risk arising from
banking, interest rate risk and liquidity risk.
operational and business risks are inherent in all
business areas.
the banking result mainly depends on loan and
deposit margins, business volumes, the size and
structure of the balance sheet, the general level of
interest rates, impairment losses and cost efficiency.
the margin between loans and deposits in banking,
with a moderate interest rate and liquidity risk profile,
changes slowly. Possible sources of result fluctuations
are unexpected losses in the credit and operational
risk areas. in banking and investment services, the
fees gathered from customer business are also
an important source of earnings. Because fees are
exposed to changes in business volume, profitability
is mostly exposed to changes in general economic
activity and customer behaviour.
Credit risk
credit risk is the risk of losses arising because
counterparties or debtors fail to meet all or part of their
payment obligations to the Bank. credit risk includes
country, settlement and counterparty credit risk.
Danske Bank Plc Group’s guidelines lay down uniform
principles for credit risk taking, with the aim of
ensuring high quality in the credit process. Danske
Bank Plc’s Board of Directors annually approves the
credit risk appetite policy, which sets the parameters
for new lending and diversification of credit risk from
different viewpoints. lending is focused on customers
operating in finland. limits are set for risk
concentrations, measured by the ratio of a customer
group’s nominal exposures to the Bank’s total capital.
risk concentration parameters are set at a
substantially more conservative level than the
minimum required by regulation. in addition limits are
set to some industries.
Based on Danske Bank Plc’s Board of Directors
delegation, credit decision authority is given to
Danske Bank a/s Board of Directors and delegated to
the management of the Danske Bank Plc’s credit
department and to authorised credit officers in the
business units. the amount of the authorisation varies
according to customer rating, total exposure and
collateral level. all credit applications are initiated
and prepared in the business units. credit decisions
are primarily based on rating, loan repayment ability,
collateral and other risk mitigates offered, as well as
acceptable return on allocated capital.
Credit risks of corporate customers
all major corporate customers have a customer
account officer, who is familiar with the customer’s
business and monitors its development. customers
with significant exposures are analysed by credit
analysts independent of the business. customers
with smaller exposures are continuously assessed
with scoring models.
credit risk monitoring consists of continuous
monitoring of macro-economic and industry
development, as well as customer creditworthiness,
collateral values and covenants. Business units’ credit
positions are reviewed systematically at least once a
year. the credit review includes monitoring the quality
of credit decisions and implementation of action plans
initiated in order to reduce the risks of the lowest rated
customers. Development of new lending is monitored
on a monthly basis against credit policy targets.
Product limits, overdrafts, delayed payments, arrears
and excesses are monitored on a daily basis.
Credit risks of personal customers
Personal customers are credit scored by application
and behavioural scorecards. these scoring models
utilise public and internal information on borrower
payment behaviour, education, employment and other
relevant factors as explanatory variables in
forecasting customer creditworthiness.
as part of loan granting process, the debt servicing
capacity is assessed and stressed by using higher
interest rates compared to current levels. long-term
loans to personal customers are mainly collateralised
by housing company shares or residential real estate.

DANSKE BANK PLC / FINANCIAL STATEMENTS AND ANNUAL REPORT 2012 32
Credit exposure
the figures in risk tables 2 to 7 show the Danske
Bank Plc Group’s credit exposure. internal receivables
between Danske Bank Plc Group companies have
been eliminated from these figures. exposures to
Danske Bank a/s Group are reported separately in
the risk tables 3 to 5.
reporting of credit exposure relating to lending
activities covers credit limits in use, guarantees and
irrevocable loan commitments. credit exposure of
trading and investing activities includes positive fair
value of derivative contracts, as well as fair value of
trading book bonds and shares.
RISK TABLE 2.
Total credit exposure, EURm 2012 2011
Credit exposure relating to lending activities 32 861 29 642
Credit exposure relating to trading and
investing activities 2 781 1 647
Total 35 642 31 289
credit exposure relating to lending activities does not
directly reconcile to the balance sheet notes, because
cash and certain off-balance sheet items are not
included in the credit exposure.
Credit exposure relating to lending activities
Danske Bank Plc Group’s lending-related credit
exposure activities amounted to eur 32.9 billion at
end of 2012, of which personal customers account for
42 per cent and corporate customers 31 per cent.
compared to 2011 the portfolio has increased by eur
3.2 billion. 99 percent of exposures were in eu
countries. new lending was concentrated in finland
during 2012.
RISK TABLE 3
Credit exposure relating to lending activities by segment , EURm 2012 2011
Personal 13 918 13 594
Corporate 10 095 10 352
Financials 695 740
Public 3 610 1 424
Total 28 318 26 110
Group internal 4 543 3 532
Total 32 861 29 642
Danske Bank Plc Group’s lending-related credit
exposure is presented by industry in risk table 4.
the portfolio is well diversified across industries, with
a high share of private sector lending, which is
composed mainly of housing loans covered with real
estate collateral.
RISK TABLE 4
Credit exposure relating to lending activities by industry, EURm 2012 2011
Central and local governments 3 610 1 424
Subsidised housing companies 993 942
Banks 334 383
Diversified financials 320 329
Other financials 41 27
Energy and utilities 780 748
Consumer Discretionary 1 103 1 222
Consumer Stables 708 822
Commercial property 2 228 2 182
Constructions and building products 912 901
Transportation and shipping 454 633
Other industrials 1 207 1 199
IT 136 144
Materials 1 033 1 114
Health care 318 255
Telecommunication services 223 192
Personal customers 13 918 13 594
Total 28 318 26 110
Group internal 4 543 3 532
Total 32 861 29 642
Danske Bank Plc Group’s credit exposure by credit
classification is presented in risk table 5. in line with
Danske Bank a/s Group’s credit process, Danske
Bank Plc Group’s customers are classified according
to risk and the classification is updated whenever new
information about the customers is received. the main
objectives of the risk classification are to rank Danske
Bank Plc Group’s customer base according to default
risk, estimating the probability of default (PD) of each
customer.
RISK TABLE 5
Credit exposure relating to lending activities by rating, EURm
Rating 2012 2011
1 3 376 694
2 798 673
3 2 999 2 490
4 4 976 3 977
5 4 941 5 126
6 3 667 4 245
7 4 238 5 258
8 2 260 2 611
9 512 536
10 227 156
11 325 346
Total 28 318 26 110
Group internal 4 543 3 532
Total 32 861 29 642
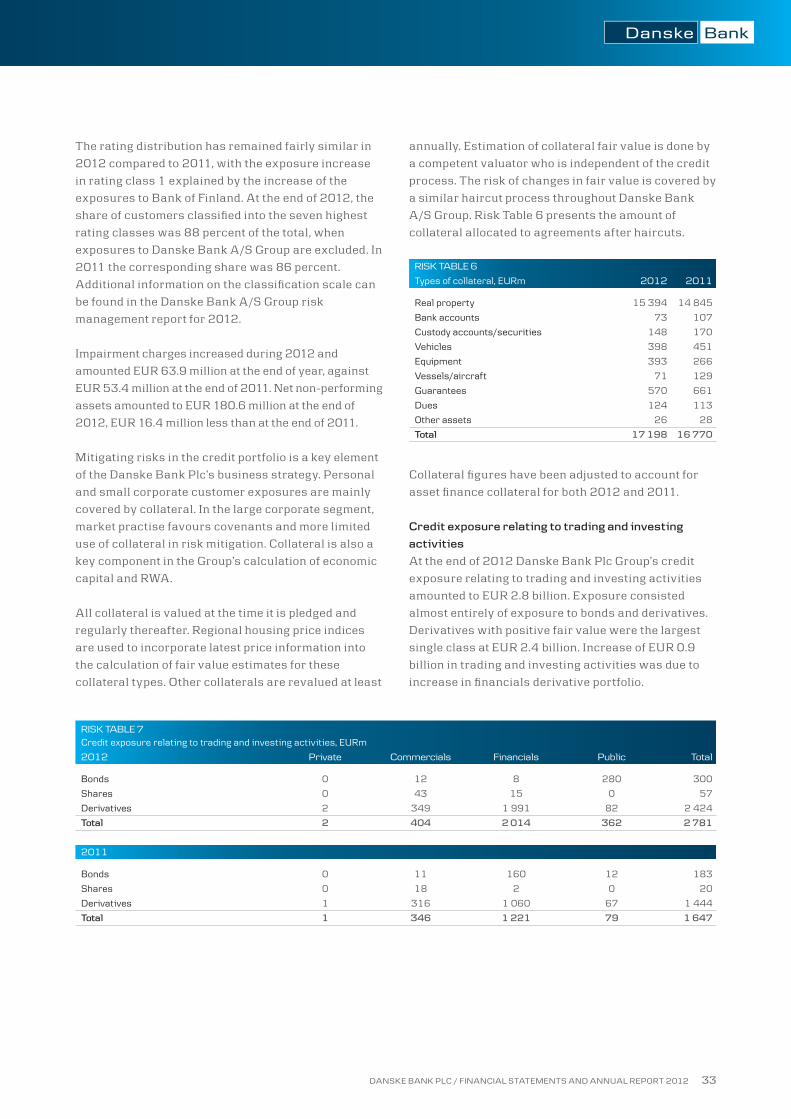
DANSKE BANK PLC / FINANCIAL STATEMENTS AND ANNUAL REPORT 2012 33
the rating distribution has remained fairly similar in
2012 compared to 2011, with the exposure increase
in rating class 1 explained by the increase of the
exposures to Bank of finland. at the end of 2012, the
share of customers classified into the seven highest
rating classes was 88 percent of the total, when
exposures to Danske Bank a/s Group are excluded. in
2011 the corresponding share was 86 percent.
additional information on the classification scale can
be found in the Danske Bank a/s Group risk
management report for 2012.
impairment charges increased during 2012 and
amounted eur 63.9 million at the end of year, against
eur 53.4 million at the end of 2011. net non-performing
assets amounted to eur 180.6 million at the end of
2012, eur 16.4 million less than at the end of 2011.
mitigating risks in the credit portfolio is a key element
of the Danske Bank Plc’s business strategy. Personal
and small corporate customer exposures are mainly
covered by collateral. in the large corporate segment,
market practise favours covenants and more limited
use of collateral in risk mitigation. collateral is also a
key component in the Group’s calculation of economic
capital and rWa.
all collateral is valued at the time it is pledged and
regularly thereafter. regional housing price indices
are used to incorporate latest price information into
the calculation of fair value estimates for these
collateral types. other collaterals are revalued at least
annually. estimation of collateral fair value is done by
a competent valuator who is independent of the credit
process. the risk of changes in fair value is covered by
a similar haircut process throughout Danske Bank
a/s Group. risk table 6 presents the amount of
collateral allocated to agreements after haircuts.
RISK TABLE 6
Types of collateral, EURm 2012 2011
Real property 15 394 14 845
Bank accounts 73 107
Custody accounts/securities 148 170
Vehicles 398 451
Equipment 393 266
Vessels/aircraft 71 129
Guarantees 570 661
Dues 124 113
Other assets 26 28
Total 17 198 16 770
collateral figures have been adjusted to account for
asset finance collateral for both 2012 and 2011.
Credit exposure relating to trading and investing
activities
at the end of 2012 Danske Bank Plc Group’s credit
exposure relating to trading and investing activities
amounted to eur 2.8 billion. exposure consisted
almost entirely of exposure to bonds and derivatives.
Derivatives with positive fair value were the largest
single class at eur 2.4 billion. increase of eur 0.9
billion in trading and investing activities was due to
increase in financials derivative portfolio.
RISK TABLE 7Credit exposure relating to trading and investing activities, EURm
2012 Private Commercials Financials Public Total
Bonds 0 12 8 280 300
Shares 0 43 15 0 57
Derivatives 2 349 1 991 82 2 424
Total 2 404 2 014 362 2 781
2011
Bonds 0 11 160 12 183
Shares 0 18 2 0 20
Derivatives 1 316 1 060 67 1 444
Total 1 346 1 221 79 1 647

DANSKE BANK PLC / FINANCIAL STATEMENTS AND ANNUAL REPORT 2012 34
Forbearance practices
under certain circumstances, the Group will grant
concessions in borrowing terms to customers that
have financial difficulties, for example if a personal
customer becomes unemployed or a business
customer sees a drop in turnover. concessions are
granted mainly if the financial difficulties are
considered to be temporary, but may also be granted
if a restructuring is considered necessary to limit
the Group’s losses on an exposure.
forbearance measures include interest-only
schedules and interest rate reductions applying for
short periods. if a customer is expected to be able to
resume normal repayments after such period, the
exposure is not considered to be subject to objective
evidence of impairment, and the impaired exposure
will be covered by collective impairment charges.
in other cases, including in connection with
restructuring, the customer will be downgraded to
rating category 10, and the entire exposure will be
impaired. the exposure is then written down to the
amount that the customer is estimated to be able to
service in the future. if the customer’s ability to repay
depends significantly on the assets that have been
provided as collateral (asset financing), the exposure
is written down to the fair value of the collateral.
once a customer has proven able to service the
restructured facility, the exposure will, after a certain
period, no longer be considered subject to objective
evidence of impairment, and the customer will move
from rating category 10 to a better category. in case of
asset financing, the write-down to the fair value of
collateral will be reversed.
Market risk
market risk is defined as the risk of losses caused by
changes in the market value of financial assets,
liabilities and off-balance sheet items resulting from
changes in market prices or rates. market risk in
Danske Bank Plc is constituted of trading activities and
the interest rate risk in the banking book. most material
risk for the Bank is the interest rate risk arising from
banking book and trading book positions. the Bank
measures the effects of interest rate changes on both
net interest income and economic value.
governance and limit structure
Danske Bank Plc’s Board of Directors sets out the risk
policy and overall limits for market risk. the Board
also decides on the general principles for managing
and monitoring market risks based on the guidelines
and allocated market risk limits provided by the
Danske Bank Group. the management of the individual
business areas is responsible for the risks the area
incurs and for actively managing these risks within the
set of allocated limits.
the Board of Directors delegates the market risk limits
to the chief executive officer of Danske Bank Plc.
market risk limits are allocated for trading activities
and for the alco position. the alco position is
decided at regular alco meetings and trades are
executed by Danske Bank markets finland, which is
part of the Danske Bank Plc.
measurement, monitoring and management reporting
on market risks is carried out on a daily basis in a
separate risk control unit. market risk exposure is
calculated in a limit control system that is linked to the
trading systems. limits are monitored systematically,
and procedures in case of limit violations have been
established for follow-up in the organization. in
addition, the risk control unit conducts intra-day spot
checks of the risks in the trading units and the alco
positions.
the chart below illustrates the limit structure and
hierarchy in Danske Bank Plc.
Limit structure and hierarchy in
Danske Bank Plc.
Chief Executive Officer
Board of Directors
Trading Positions varainhallinta/ALCOLimits: Trading Limits for Danske Bank PlcResponsible: Head of Danske Bank Markets FI
Limits: ALCO Limits for Danske Bank PlcResponsible: Danske Bank Plc’s ALCO

DANSKE BANK PLC / FINANCIAL STATEMENTS AND ANNUAL REPORT 2012 35
Market risk exposure
Danske Bank Plc markets, trades and takes positions
in products that entails a variety of market risk
components. the main activities are concentrated
around a range of fixed income assets, money-market
instruments and other assets with interest rate risk.
further more, the bank may take on interest rate risk
as part of the treasury management in accordance
with the alco limits and decisions.
Alco positions
Danske Bank Plc’s banking book interest rate risk
arises primarily from retail and corporate based
customer business which is hedged by derivatives.
interest rate risk in the banking book related to
demand deposits has been modeled separately and
included in the overall risk calculations and limits. as
part of the limit monitoring banking book interest rate
position is stress tested by a 1 percentage point
parallel increase and decrease of yield curves by
currencies.
Danske Bank Plc also estimates interest rate risk
exposure in the banking book from the earnings
perspective, called net interest income (nii) risk. it is
calculated as the greatest loss of earnings over a 12
month period from the Bank’s assets and liabilities
upon a parallel shift in yields of 1 percentage point.
Given the structure of the Bank’s balance sheet, the
greatest loss is the -1% shift scenario indicating that
Bank’s nii will decrease if interest rates fall.
the Bank also has a modest holding of unlisted shares,
which is primarily related to the banking activities.
Trading positions
trading operations in Danske Bank Plc covers
customer related business in interest rate, foreign
exchange, commodity, credit and structured products.
risk arises mainly from the movements of interest
rates in eur, ruB, usD and the Baltic currencies,
of which eur is dominating the others. foreign
exchange positions are small and are denominated
mainly in Baltic currencies along with relatively
short-term positions typically in usD and ruB. the
Bank’s commodity positions includes mainly deals
related to energy, eu allowances (eua) and certified
emission reductions (cer). commodity related
business is customer-based trading, and the unit’s
own holdings are very modest. the Bank has no direct
positions in listed shares.
trading book risks are measured and limited by
means of sensitivities, pre-defined worst case
scenarios and exposure limits by risk types. limits
are set by currencies and maturity buckets and
calculated as net and gross risks.
Risk overview
table 8 shows Danske Bank Plc’s market risk
exposure as of year-end 2012. risk figures represent
net positions, changes in economical value or risk of
loss in the Bank’s nii calculated according to
conventional risk measures.
RISK TABLE 8
Market risk exposure, EURm 2012 2011
Interest Rate Risk (1% yield curve shift up, net) 14.8 4.1
Net Interest Income Risk (1% yield curve shift) -25.3 -39.4
Net Foreign Exchange Rate Position -16.7 -22.8
Commodity Risk (10% change up in prices, net) -0.2 -0.1
Listed Equity Position -0.2 0.0
Unlisted Equities and Shares 27.9 2.0
Interest Rate Volatility Risk (1% -point change) 0.0 0.0
Foreign Exchange Volatility Risk
(1% -point change) 0.0 0.0
Liquidity risk
liquidity risk is defined as the risk of losses arising
due to:
• Lackoff undingpreventst heBankf rommeet ing
its obligations
• TheBank’sf undingcostsincrease
disproportionately
• Breachofregulator yrequirementsforliquidit y
• TheBank’sliquidit yposit ionis,orisperceived
to be, weak resulting in adverse actions from
counterparties, rating agencies or regulators.
taking liquidity risk is an inherent part of Danske
Bank Plc’s business strategy and it is managed in
support of a cautious and conservative risk profile.
the Board of Directors has approved a liquidity
policy and a contingency funding plan for the Bank.
the policy specifies the aims, limits, calculation and
responsibilities of all parts of the Bank’s liquidity risk
control and management. the purpose of the
contingency funding plan (cfP) is to ensure an
efficient and co-ordinated action plan for situations
where Danske Bank Plc or the banking system comes
under pressure in terms of liquidity.

DANSKE BANK PLC / FINANCIAL STATEMENTS AND ANNUAL REPORT 2012 36
the asset and liability committee (alco) is
responsible for ensuring that the liquidity risk is
managed in accordance with the Policy. Danske Bank
markets finland (as operating within Danske Bank
Plc) is responsible for the practical and day-to-day
liquidity management and execution of the Policy,
including assuring that the liquidity buffer is in
accordance with the Policy. the alm unit in finance
oversees the liquidity position, reports breaches
according to the escalation process, monitors triggers
as set out in cfP and conducts the stress tests and
liquidity buffer calculations. market risk in finance is
responsible for day-to-day monitoring, controlling and
reporting the liquidity risk limits. Both alm and
market risk report to alco, risk committee and
the Board as specified in the Policy.
liquidity management is based on monitoring and
management of short-term and long-term liquidity
risks. the management of operational liquidity risk
aims primarily at ensuring that Danske Bank Plc
always has a liquidity buffer that is able, in the short
term, to absorb the net effects of current transactions
and expected changes in liquidity, under both normal
and stressed conditions. Danske Bank Plc’s liquidity
buffer consists mainly of ecB eligible bonds and cash
assets in Bank of finland.
Danske Bank Plc conducts stress tests to measure its
immediate liquidity risk and to ensure that it has an
adequate amount of time to respond to crises. the
stress tests estimate liquidity risk in scenarios
covering bank-specific and systemic crises, their
combination and a capital market cut-off.
need for long term funding will be determined by
structural liquidity risk, liquidity stress test scenarios
and the maturity profile of long term funding.
structural liquidity risk is based on a breakdown by
maturity of the Bank’s assets, liabilities and off-
balance-sheet items. Danske Bank Plc bases these
calculations on the contractual due dates of individual
products but takes into account that some balance
sheet items have maturities that make their actual due
dates deviate materially from their contractual due
dates. the maturities of such items are therefore
modified to provide a more accurate view of the actual
behaviour. Danske Bank Plc also monitors its funding
mix to make sure that it is well diversified in terms of
financing sources.
liquidity risk has been in focus for Danske Bank Plc,
as well as for many other banks in europe, throughout
the year 2012. a conservative risk profile and high
rating ensured that Danske Bank Plc was able to issue
two covered bonds, eur 1 billion each, despite the
strain in funding markets. Danske Bank Plc also
estimates liquidity ratios introduced in crD iV.
though Danske Bank Plc is well prepared in terms of
funding structure in order to comply with the
requirements when they come into force, it will be
important how the rules are finalised in terms of
treatment of covered bonds in the liquidity buffer.
risk table 9 presents Danske Bank Plc’s financial
liabilities as of 31 December by maturity classes
based on contractual maturities. financial liabilities
without contractual maturity are included in the
maturity class ‘less than 3 months’.
RISK TABLE 9
Maturity profile of financial liabilities 31 December 2012 based on contractual maturities, EUR m
Liabilities Total < 3 months 3–12 months 1–5 years > 5 years
Due to credit institutions and central banks 2 418.9 2 315.2 13.6 90.0 0.0
Amounts owed to customers and public entities 16 514.4 15 332.8 1 041.0 138.3 2.3
Derivatives settled on a gross basis (cash outflows) 27 695.6 17 985.7 8 733.5 891.1 85.3
Derivatives settled on a gross basis (cash inflows) 27 713.2 17 928.3 8 736.1 965.1 83.6
Derivatives settled on a gross basis (net cash flows) 17.6 -57.4 2.6 74.0 -1.7
Derivatives settled on a net basis -1.4 40.8 -42.2 0.0 0.0
Debt securities in issue 7 536.5 1 202.3 804.5 3 364.4 2 165.3
Subordinated liabilities 358.5 125.2 0.0 233.2 0.0
Financial liabilities total 26 844.4 18 958.9 1 819.6 3 900.0 2 165.9
Guarantees and pledges 1 796.7 586.5 424.7 728.2 57.3
Undrawn loans, overdraft facilities and other 4 229.6 3 918.2 8.4 43.7 259.4

DANSKE BANK PLC / FINANCIAL STATEMENTS AND ANNUAL REPORT 2012 37
Operational risk
Danske Bank Plc Group defines operational risk in
line with the crD definition as losses resulting from
inadequate or failed internal processes, people and
systems or from external events, including legal risk.
the crD definition does not include strategic risk
and reputation risk. however, reputation risk can be
seen as a consequence of operational risk events as
well as failure to comply with laws, rules, related
self-regulatory organisation standards and code
of conducts applicable to the banking activities.
Danske Bank Plc Group thus manages reputation
risk through, among other things, high standards in
operational risk management.
operational risks are divided in Danske Bank Plc Group
into the following categories (in line with the crD):
• Internalf raud
• Externalf raud
• Deficienciesinemploymentpract icesand
workplace safety
• Deficienciesinpract icesconcerningcustomers,
products or business
• Damagetophysicalassets
• Businessdisrupt ionandsystemfailures
• Deficienciesinexecut ion,deliver yandprocess
management
operational risks are reflected, for example, in costs,
claims, loss of reputation, business disruptions or
false information concerning positions, risks and
results. the management of operational risks
enhances the efficiency of the Bank’s internal
processes and decreases fluctuations in returns.
Danske Bank Plc Group operates a culture of open
disclosure of risks in which staff should report errors
and weaknesses within the Bank so future losses may
be minimised by taking preventative measures. it is
the responsibility of business lines and resource areas
to disclose information on loss events and each
employee within Danske Bank Plc Group is
responsible for the day to day management of
operational risks and reporting of actual events within
their respective area. the risk management
organisation develops methods to manage operational
risks and co-ordinates the risk management
operations of the business units. internal audit
assesses the adequacy and efficiency of internal
control and risk management. the compliance function
assists management in ensuring that the Group and its
employees comply with applicable laws and
regulations as well as ethical standards in order to
mitigate the Group’s compliance risk as appropriate.
operational risk events data is collected
systematically in operational risk information
system (oris). events are reported to Danske Bank
Plc Group’s risk committee, Board of Directors and,
when requested, to Danske Bank Group’s operational
risk committee. events are classified into risk
categories and costs of the events are analysed.
Danske Bank Plc Group applies Danske Bank Group’s
approach for identification and management of
operational risks. Danske Bank Plc Group yearly
performs the operational risk identification and
assessment (ria) process to identify the largest
internal and external risks facing the organisation.
a report of the Bank’s key risks is approved by Danske
Bank Plc Group’s risk committee. the process also
includes monitoring of the identified risks. local key
controls and possible key risk indicators are identified
for the risks, such that the status of the risk can be
monitored over time. the results of the local ria
process are delivered to Group and thereby they are
included to the group-wide process. Possible
mitigation strategies for key risks are developed and
implemented by the business lines and resource areas
in Danske Bank Group.

DANSKE BANK PLC / FINANCIAL STATEMENTS AND ANNUAL REPORT 2012 38
segment principles
the Group consists of number of business units and
resource and support functions. the Group’s activities
are segmented into business units according to
Danske Bank Group’s organisational structure in 2012.
inter-segment transactions are settled on an arm’s-
length basis. expenses incurred centrally, including
expenses incurred by support, administrative and
back-office functions, are charged to the business
units according to consumption and activity at
calculated unit prices or at market prices, if available.
segment assets and liabilities are assets and
liabilities that are used to maintain the operating
activities of a segment or have come into existence as
a result of such activities and that are either directly
attributable to or may reasonably be allocated to a
segment. a calculated share of sharelholders’ equity
is allocated to each segment.
in the consolidated financial statements the inter-
segment transactions, assets and liabilities have been
eliminated. segment results are reported after
eliminations.
Operating segments
the Group follows business functions in four different
segments; Banking activities, markets, capital and
other.
markets is responsible for operations in the capital
markets and advisory services related to markets
area. markets consists also a part of Group’s treasury
functions. capital is responsible for Group’s asset
management operations and mutual funds. other
activities includes primarily Group’s funding and
Group’s support functions such as it services,
contact centre, product development and logistics.
The new organisation
on 1 June 2012, Danske Bank Plc Group implemented
a new organisational structure in order to strengthen
its focus on customers. With a view to a clearer
segmentation of customers, the Group now consists of
the following units:
•PersonalBank ing
•BusinessBank ing
•Corporates&Inst it ut ions
•Ot heract iv it ies(incl.DanskeCapital)
Danske Bank Plc Group will include these changes to
segment reporting as from 2013. comparative figures
for 2012 will be shown from the first half of 2013.
the Banking activities area will be split into Personal
Banking, Business Banking and corporates &
institutions. Danske markets’ performance will be
reported under corporates & institutions.
Personal Banking serves personal and private
banking customers. the unit focuses on offering first-
class self-service products and proactive advice to
customers with more complex finances. the strategy
is to concentrate efforts on mass affluent customers,
private banking customers and young customers.
Business Banking serves small and medium-sized
businesses. the unit offers strategic financial advisory
services and other business banking products.
corporates & institutions serves the largest
institutional clients and corporate customers in the
nordic region. Products and services include cash
management services and trade finance solutions.
corporates & institutions also offers fixed-income and
foreign exchange products for hedging purposes.
other activities encompasses Group treasury,
expenses for the Group’s support functions and
eliminations. Group treasury is responsible for the
Group’s strategic fixed income, foreign exchange and
equity portfolios and serves as the Group’s internal
bank. Danske capital is included in the other activities
segment and will continue to offer asset management
products to private individuals and businesses.
SEGMENT INFORMATION

DANSKE BANK PLC / FINANCIAL STATEMENTS AND ANNUAL REPORT 2012 39
OPERATING SEGMENTS, JANUARY–DECEMBER 2012
EURmBanking
Activities Markets Capital Other EliminationsDanske Bank
Plc Group
Total operating income 518.1 61.6 29.1 28.7 0.0 637.5
Total operating expenses -363.9 -21.3 -19.2 -12.2 0.0 -416.7
Loan impairment charges -63.9 0.0 0.0 0.0 0.0 -63.9
Profit before taxes 90.2 40.3 9.8 16.4 0.0 156.8
DECEMBER 31, 2012
Total assets 40 433 5 945 53 3 253 -17 872 31 813
of which loans and advances to credit inst. & customers 33 309 9 180 32 553 -17 402 25 672
Total liabilities and equity 40 433 5 945 53 3 253 -17 872 31 813
of which liabilities to credit inst. & customers 34 733 2 067 19 -549 -17 402 18 868
OPERATING SEGMENTS, JANUARY–DECEMBER 2011
EURmBanking
Activities Markets Capital Other EliminationsDanske Bank
Plc Group
Total operating income 565.3 51.6 36.3 -3.5 0.0 649.8
Total operating expenses -399.8 -22.2 -19.6 -7.5 0.0 -449.0
Loan impairment charges -59.8 6.4 0.0 0.0 0.0 -53.4
Profit before taxes 105.7 35.8 16.7 -11.0 0.0 147.3
DECEMBER 31, 2011
Total assets 39 673 4 979 50 7 179 -24 476 27 406
of which loans and advances to credit inst. & customers 38 429 9 431 156 442 -23 725 24 734
Total liabilities and equity 39 673 4 979 50 7 179 -24 476 27 406
of which liabilities to credit inst. & customers 39 168 1 638 11 -51 -23 578 17 189
In accordance with IFRS 8, Danske Bank Plc Group is required to disclose business with a single external customer that generates 10% or more of the combined
revenue. The Group has no such customers.
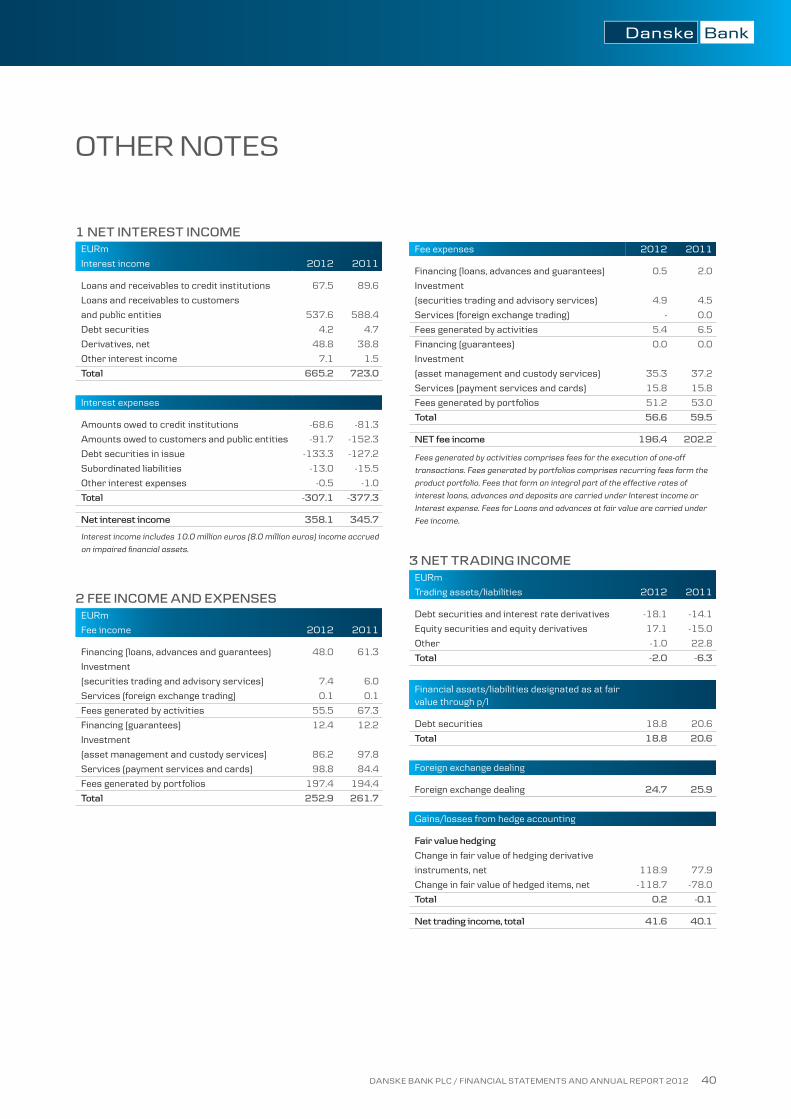
DANSKE BANK PLC / FINANCIAL STATEMENTS AND ANNUAL REPORT 2012 40
1 nET inTEREsT inCOMEEURm
Interest income 2012 2011
Loans and receivables to credit institutions 67.5 89.6
Loans and receivables to customers
and public entities 537.6 588.4
Debt securities 4.2 4.7
Derivatives, net 48.8 38.8
Other interest income 7.1 1.5
Total 665.2 723.0
Interest expenses
Amounts owed to credit institutions -68.6 -81.3
Amounts owed to customers and public entities -91.7 -152.3
Debt securities in issue -133.3 -127.2
Subordinated liabilities -13.0 -15.5
Other interest expenses -0.5 -1.0
Total -307.1 -377.3
net interest income 358.1 345.7
Interest income includes 10.0 million euros (8.0 million euros) income accrued
on impaired financial assets.
2 FEE inCOME AnD ExPEnsEsEURm
Fee income 2012 2011
Financing (loans, advances and guarantees) 48.0 61.3
Investment
(securities trading and advisory services) 7.4 6.0
Services (foreign exchange trading) 0.1 0.1
Fees generated by activities 55.5 67.3
Financing (guarantees) 12.4 12.2
Investment
(asset management and custody services) 86.2 97.8
Services (payment services and cards) 98.8 84.4
Fees generated by portfolios 197.4 194.4
Total 252.9 261.7
Fee expenses 2012 2011
Financing (loans, advances and guarantees) 0.5 2.0
Investment
(securities trading and advisory services) 4.9 4.5
Services (foreign exchange trading) - 0.0
Fees generated by activities 5.4 6.5
Financing (guarantees) 0.0 0.0
Investment
(asset management and custody services) 35.3 37.2
Services (payment services and cards) 15.8 15.8
Fees generated by portfolios 51.2 53.0
Total 56.6 59.5
nET fee income 196.4 202.2
Fees generated by activities comprises fees for the execution of one-off
transactions. Fees generated by portfolios comprises recurring fees form the
product portfolio. Fees that form an integral part of the effective rates of
interest loans, advances and deposits are carried under Interest income or
Interest expense. Fees for Loans and advances at fair value are carried under
Fee income.
3 nET TRADing inCOME EURm
Trading assets/liabilities 2012 2011
Debt securities and interest rate derivatives -18.1 -14.1
Equity securities and equity derivatives 17.1 -15.0
Other -1.0 22.8
Total -2.0 -6.3
Financial assets/liabilities designated as at fair value through p/l
Debt securities 18.8 20.6
Total 18.8 20.6
Foreign exchange dealing
Foreign exchange dealing 24.7 25.9
Gains/losses from hedge accounting
Fair value hedging
Change in fair value of hedging derivative
instruments, net 118.9 77.9
Change in fair value of hedged items, net -118.7 -78.0
Total 0.2 -0.1
net trading income, total 41.6 40.1
OTHER NOTES

DANSKE BANK PLC / FINANCIAL STATEMENTS AND ANNUAL REPORT 2012 41
4 OTHER OPERATing inCOMEEURm 2012 2011
Rental income 3.5 3.3
Operating lease income 18.5 30.3
Fair value adjustment of investment property -1.7 -1.2
Other income 18.8 26.4
Other operating income, total 39.1 58.9
Other income includes e.g. revenues from services sold to Danske Bank A/S
Helsinki Branch 10.6 million euros (7.3 million euros).
5 nET inCOME FROM invEsTMEnTsEURm 2012 2011
Income from associated undertakings 1.4 1.7
Sales profit of investment property 0.8 1.2
net income from investments, total 2.2 2.9
6 sTAFF COsTsEURm
Staff costs 2012 2011
Wages and salaries -137.9 -145.1
Pension costs - defined contribution plans -23.3 -23.1
Other social security costs -7.9 -7.7
staff costs, total -169.2 -175.8
2012
Salaries and remunerationFixed
salaries
Variable remune-ration 1)
Top Management 0.6 0.1
Risk takers 6.4 1.4
Others 117.8 13.4
2011
Salaries and remunerationFixed
salaries
Variable remune-ration 1)
Top Management 0.7 0.1
Risk takers 5.8 2.0
Others 124.9 10.3
Variable remuneration 1) 2012 2011
Cash items 14.3 11.8
Share-related items 0.5 0.6
Other items - -
Postponed salaries and remuneration
Granted during accounting period, payment
postponed to next accounting periods 8.0 6.5
Amounts paid during the accounting period,
right granted in earlier accounting periods 6.4 6.1
Compensation paid by the company for termination of employment contracts
is determined in accordance with legislation in force. During the accounting
period the company has paid signing bonuses (3 pcs) for new employees
350,000 euros.
7 sHARE-BAsED PAYMEnTuntil 2008, the Group offered top management and
management incentive programmes that consisted of
share options and rights to conditional shares.
incentive payments reflected individual performance
and also depended on financial results and other
measures of value creation for a given year. options
and rights were granted in the first quarter of the year
following the year in which they were earned.
share options – programs 2007 A and 2008 A
issued options carry a right to buy Danske Bank a/s
shares exercisable from three to seven years after
options are granted provided that the employee, with
exception of retirement, has not resigned from the
Group. Program 2007a may be exercised from 1 april
2007 until 1 april 2014 and program 2008a may
be exercised from 1 april 2008 until 1 april 2015.
the exercise price of the options is computed as the
average price of Danske Bank a/s shares for 20 stock
exchange days after the release of the annual report
plus 10%.
the fair value of the share options is calculated
according to a dividend-adjusted Black & scholes
formula. calculation of the fair value at the end of
2012 is based on the following assumptions: share
price: 12.87 eur (2011: 9.81 eur). Dividend payout
ratio: 2,5% (2011: 2,5%). rate of interest: 0.2-0.3%
(2011: 0.8-0.9%), equal to the swap rate. Volatility:
35% (2011: 50%). average time of exercise: 0–1 years
(2011: 0-2 years).the volatility is estimated on the
basis of historical volatility.
intrinsic value is expensed in the year in which the
share options are earned, while the time value is
accrued over the remaining service period, which is
the vesting period of up to five years.
Conditional shares – program 2008
rights to buy Danske Bank a/s shares under the
conditional share programme vest up to five years
after being granted provided that the employee, with
the exception of retirement, has not resigned from the
Group. in addition to this requirement, rights to shares
earned in 2011 and 2012 vest only if the Group as a
whole and the employee´s department meet certain
performance targets within the next five years. rights
to buy Danske Bank a/s shares under the conditional
share programme are granted as a portion of the
annual bonus earned
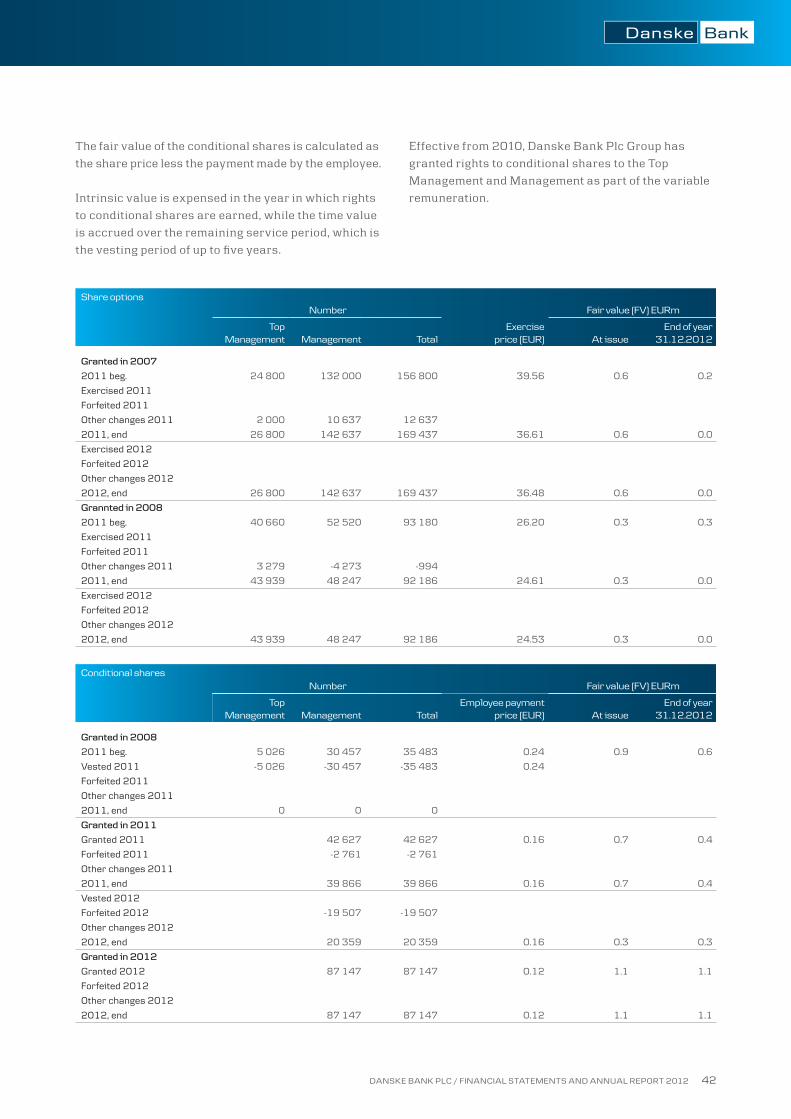
DANSKE BANK PLC / FINANCIAL STATEMENTS AND ANNUAL REPORT 2012 42
Share options Number Fair value (FV) EURm
Top Management Management Total
Exercise price (EUR) At issue
End of year 31.12.2012
granted in 2007
2011 beg. 24 800 132 000 156 800 39.56 0.6 0.2
Exercised 2011
Forfeited 2011
Other changes 2011 2 000 10 637 12 637
2011, end 26 800 142 637 169 437 36.61 0.6 0.0
Exercised 2012
Forfeited 2012
Other changes 2012
2012, end 26 800 142 637 169 437 36.48 0.6 0.0
grannted in 2008
2011 beg. 40 660 52 520 93 180 26.20 0.3 0.3
Exercised 2011
Forfeited 2011
Other changes 2011 3 279 -4 273 -994
2011, end 43 939 48 247 92 186 24.61 0.3 0.0
Exercised 2012
Forfeited 2012
Other changes 2012
2012, end 43 939 48 247 92 186 24.53 0.3 0.0
Conditional shares Number Fair value (FV) EURm
Top Management Management Total
Employee payment price (EUR) At issue
End of year 31.12.2012
granted in 2008
2011 beg. 5 026 30 457 35 483 0.24 0.9 0.6
Vested 2011 -5 026 -30 457 -35 483 0.24
Forfeited 2011
Other changes 2011
2011, end 0 0 0
granted in 2011
Granted 2011 42 627 42 627 0.16 0.7 0.4
Forfeited 2011 -2 761 -2 761
Other changes 2011
2011, end 39 866 39 866 0.16 0.7 0.4
Vested 2012
Forfeited 2012 -19 507 -19 507
Other changes 2012
2012, end 20 359 20 359 0.16 0.3 0.3
granted in 2012
Granted 2012 87 147 87 147 0.12 1.1 1.1
Forfeited 2012
Other changes 2012
2012, end 87 147 87 147 0.12 1.1 1.1
the fair value of the conditional shares is calculated as
the share price less the payment made by the employee.
intrinsic value is expensed in the year in which rights
to conditional shares are earned, while the time value
is accrued over the remaining service period, which is
the vesting period of up to five years.
effective from 2010, Danske Bank Plc Group has
granted rights to conditional shares to the top
management and management as part of the variable
remuneration.

DANSKE BANK PLC / FINANCIAL STATEMENTS AND ANNUAL REPORT 2012 43
Note 1: Share options: Adjustment of exercise price due to the share issue in 2011:
Prior to issue (DKK)
Prior to issue (EUR)
After issue (DKK)
After issue (EUR) %
2007 294.13 39.56 272.18 36.61 1.08
2008 194.74 26.20 182.98 24.61 1.06
Share options: Fair value of options translated into EUR as of 31 December 2012
FV (DKK) EUR : DKK FV (EUR)
2007 0.00 7.4604 0.00
2008 0.86 7.4604 0.12
Share options: Fair value of options translated into EUR as of 31 December 2011
FV (DKK) EUR : DKK FV (EUR)
2007 0.21 7.4342 0.03
2008 2.43 7.4342 0.33
Note 2: Conditional shares: Calc. used to calculate the fair value of conditional shares as of 31 December 2012
Share price at grant date
(DKK)
Share price at year end
(DKK) EUR : DKK
Share price at grant date
(EUR)
Share price at year end
(EUR)
Granted in 2011 125.83 95.65 7.4604 16.87 12.82
Granted in 2012 92.66 95.65 7.4604 12.42 12.82
Conditional shares: Calc. used to calculate the fair value of conditional shares as of 31 December 2011
Share price at grant date
(DKK)
Share price at year end
(DKK) EUR : DKK
Share price at grant date
(EUR)
Share price at year end
(EUR)
Granted in 2011 125.83 72.95 7.4342 16.93 9.81
8 OTHER OPERATing ExPEnsEs, DEPRECiATiOns AnD iMPAiRMEnTs
EURm
Other operating expenses 2012 2011
IT costs -50.3 -69.7
Other staff costs -17.2 -22.0
Marketing expenses -20.0 -20.1
Postage and telephone expenses -10.7 -12.1
Rental expenses -36.7 -38.4
Other -86.8 -74.9
Other operating expenses, total -221.8 -237.2
Depreciations and impairments
Depreciations of leased assets -13.5 -24.0
Other -12.2 -11.9
Depreciations and impairments, total -25.7 -36.0
Other operating expenses, depreciations and
impairments, total -247.5 -273.2
9 AuDiT FEEsEURm 2012 2011
Audit 0.2 0.3
Audit-related services - 0.0
Tax 0.0 0.1
Other services 0.4 0.1
Audit fees, total 0.6 0.5

DANSKE BANK PLC / FINANCIAL STATEMENTS AND ANNUAL REPORT 2012 44
10 LOAn iMPAiRMEnT CHARgEs
EURm
2012
Individual impairment
charges
Collective impairment
charges Recoveries Total
From loans and receivables to credit institutions - -
From loans and receivables to customers
- impairment charges 92.6 19.6 112.2
- write-offs 42.2 18.5 23.6
- reversals -92.7 -92.7
Impairment of investments in group companies 20.3 20.3
From guarantees and other off-balance sheet items
- impairment charges 1.1 1.1
- write-offs 0.0
- reversals -0.7 -0.7
Total 1–12/2012 63.6 18.9 18.5 63.9
2011
From loans and receivables to credit institutions 0.0 0.0
From loans and receivables to customers
- impairment charges 126.7 0.4 127.1
- write-offs 73.1 73.1
- reversals -119.9 15.0 -134.9
Impairment of investments in group companies
From guarantees and other off-balance sheet items
- impairment charges 0.0
- write-offs 0.0 0.0
- reversals -11.9 0.0 -11.9
Total 1–12/2011 68.1 0.3 15.0 53.4
11 TAxEsEURm 2012 2011
Taxes on taxable income for the year 44.1 21.5
Taxes arising from previous years 4.2 -1.9
Deferred taxes -6.8 17.9
Taxes for the financial year total 41.6 37.5
Reconciliation between income taxes in income statement and taxes calculated at Finnish tax rate (24,5%)
Profit before taxes 156.8 147.3
Taxes calculated at Finnish tax rate 38.4 38.3
Tax-exempt income -1.8 -0.9
Net profit from associates -0.3 -0.5
Undeductible expenses 1.0 1.3
Change of tax rate - -0.1
Other - 1.3
Taxes arising from previous years 4.2 -1.9
Taxes in income statement 41.6 37.5
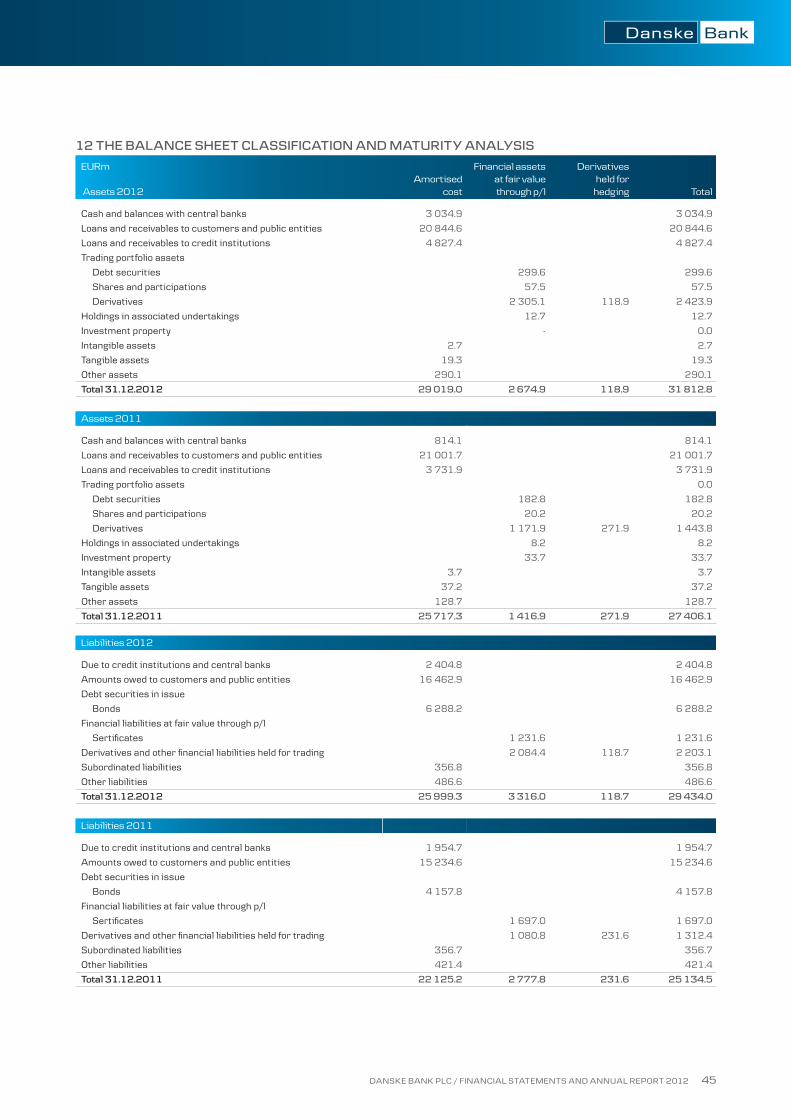
DANSKE BANK PLC / FINANCIAL STATEMENTS AND ANNUAL REPORT 2012 45
12 THE BALAnCE sHEET CLAssiFiCATiOn AnD MATuRiTY AnALYsis
EURm
Assets 2012Amortised
cost
Financial assets at fair value through p/l
Derivatives held for
hedging Total
Cash and balances with central banks 3 034.9 3 034.9
Loans and receivables to customers and public entities 20 844.6 20 844.6
Loans and receivables to credit institutions 4 827.4 4 827.4
Trading portfolio assets
Debt securities 299.6 299.6
Shares and participations 57.5 57.5
Derivatives 2 305.1 118.9 2 423.9
Holdings in associated undertakings 12.7 12.7
Investment property - 0.0
Intangible assets 2.7 2.7
Tangible assets 19.3 19.3
Other assets 290.1 290.1
Total 31.12.2012 29 019.0 2 674.9 118.9 31 812.8
Assets 2011
Cash and balances with central banks 814.1 814.1
Loans and receivables to customers and public entities 21 001.7 21 001.7
Loans and receivables to credit institutions 3 731.9 3 731.9
Trading portfolio assets 0.0
Debt securities 182.8 182.8
Shares and participations 20.2 20.2
Derivatives 1 171.9 271.9 1 443.8
Holdings in associated undertakings 8.2 8.2
Investment property 33.7 33.7
Intangible assets 3.7 3.7
Tangible assets 37.2 37.2
Other assets 128.7 128.7
Total 31.12.2011 25 717.3 1 416.9 271.9 27 406.1
Liabilities 2012
Due to credit institutions and central banks 2 404.8 2 404.8
Amounts owed to customers and public entities 16 462.9 16 462.9
Debt securities in issue
Bonds 6 288.2 6 288.2
Financial liabilities at fair value through p/l
Sertificates 1 231.6 1 231.6
Derivatives and other financial liabilities held for trading 2 084.4 118.7 2 203.1
Subordinated liabilities 356.8 356.8
Other liabilities 486.6 486.6
Total 31.12.2012 25 999.3 3 316.0 118.7 29 434.0
Liabilities 2011
Due to credit institutions and central banks 1 954.7 1 954.7
Amounts owed to customers and public entities 15 234.6 15 234.6
Debt securities in issue
Bonds 4 157.8 4 157.8
Financial liabilities at fair value through p/l
Sertificates 1 697.0 1 697.0
Derivatives and other financial liabilities held for trading 1 080.8 231.6 1 312.4
Subordinated liabilities 356.7 356.7
Other liabilities 421.4 421.4
Total 31.12.2011 22 125.2 2 777.8 231.6 25 134.5

DANSKE BANK PLC / FINANCIAL STATEMENTS AND ANNUAL REPORT 2012 46
MATURITY ANALYSIS OF THE BALANCE SHEET
EURm 2012 Total < 1 year > 1 year
Assets
Cash and balances with central banks 3 034.9 3 034.9 -
Loans and receivables to credit institutions 4 827.3 4 783.3 44.0
Loans and receivables to customers and public entities 20 844.6 3 908.1 16 936.5
Trading portfolio assets 2 781.0 694.0 2 087.0
Holdings in associated undertakings 12.7 - 12.7
Intangible assets 2.7 - 2.7
Tangible assets 19.3 - 19.3
Other assets 290.1 290.1 -
Total 31 812.8 12 710.6 19 102.2
Liabilities
Due to credit institutions and central banks 2 404.8 2 314.8 90.0
Amounts owed to customers and public entities 16 462.9 16 335.9 127.0
Debt securities in issue 7 519.8 1 990.1 5 529.7
Derivatives and other financial liabilities held for trading 2 203.1 521.0 1 682.2
Other liabilities 486.6 486.6 -
Subordinated debt 356.8 123.6 233.2
Equity 2 378.8 - 2 378.8
Total 31 812.8 21 771.9 10 040.9
2011
Assets
Cash and balances with central banks 814.1 814.1 -
Loans and receivables to credit institutions 3 731.9 3 689.4 42.5
Loans and receivables to customers and public entities 21 001.7 3 997.7 17 004.1
Trading portfolio assets 1 646.8 636.1 1 010.7
Holdings in associated undertakings 8.2 - 8.2
Intangible assets 3.7 - 3.7
Tangible assets 71.0 - 71.0
Other assets 128.7 128.7 -
Total 27 406.1 9 265.9 18 140.1
Liabilities
Due to credit institutions and central banks 1 954.7 1 864.7 90.0
Amounts owed to customers and public entities 15 234.6 15 094.0 140.7
Debt securities in issue 5 854.8 1 753.6 4 101.1
Derivatives and other financial liabilities held for trading 1 312.3 496.6 815.7
Other liabilities 421.4 421.4 -
Subordinated debt 356.7 123.5 233.2
Equity 2 271.6 - 2 271.6
Total 27 406.1 19 753.8 7 652.3
Maturity analysis of past due financial assetsEURm 2012 2011
Assets past due 30-90 days 139.4 140.0
Nonperforming assets past due at least
90 days but no more than 180 days 31.4 34.9
Nonperforming assets past due at least 180 days 137.8 123.9
Nonperforming assets of companies in
bankruptcy and guarantee claims 11.4 38.2
fixed-term deposits and demand deposits are included
in amounts owed to customers and public entities.
fixed-term deposits are recognised according to
maturity. Demand deposits have short contractual
maturities but are considered a stable funding source
with an expected maturity of more than one year.
maturity analysis for derivatives is included in note
16.

DANSKE BANK PLC / FINANCIAL STATEMENTS AND ANNUAL REPORT 2012 47
13 FAiR vALuE inFORMATiOnfinancial instruments are carried on the balance sheet
at fair value or amortised cost. summary of significant
account policies describes classification of financial
assets and liabilities by valuation type and detailed
measurement bases of financial assets and liabilities.
Financial instruments measured at fair value
the fair value is the amount for which a financial asset
can be exchanged between knowledgeable, willing
parties. if an active market exists, the Group uses a
quoted price. if a financial instrument is quoted in a
market that is not active, the Group bases its valuation
on the most recent transaction price. adjustment is
made for subsequent changes in market conditions,
for instance, by including transactions in similar
financial instruments that are assumed to be
motivated by normal business considerations. for a
number of financial assets and liabilities, no market
exists. in such cases, the Group uses recent
transactions in similar instruments and discounted
cash flows or other generally accepted estimation and
valuation techniques based on market conditions at
the balance sheet date to calculate an estimated value.
Generally, the Group applies valuation techniques to
otc derivatives and unlisted trading portfolio assets
and liabilities. the most frequently used valuation
and estimation techniques include the pricing of
transactions with future settlement and swap models
that apply present value calculations, credit pricing
models and options models, such as Black & scholes
models. in most cases, valuation is based substantially
on observable input. the valuation of unlisted shares is
based substantially on non-observable input.
financial instruments valued on the basis of quoted
prices in an active market are recognised in the
Quoted prices category (level 1). financial instruments
valued substantially on the basis of other observable
input are recognised in the observable input category
(level 2). other financial instruments are recognised
in the non-observable input category (level 3). this
category covers unlisted shares.
During the reporting period ending 31 December 2012,
there were no transfers between level 1 (Quoted
prices) and level 2 (observable input) fair value
measurements, and no transfers into and out of level 3
(non-observable input) fair value measurements.
EURm
2012Quoted
pricesObservable
input
Non- observable
input Total
Financial assets
Assets held for trading 299.0 3.0 55.0 357.0
Derivative financial instruments 43.0 2 288.0 93.0 2 424.0
Total 342.0 2 291.0 148.0 2 781.0
Financial liabilities
Debt securities at fair value - 1 231.6 - 1 231.6
Derivative financial instruments 68.0 2 029.0 106.0 2 203.0
Total 68.0 3 260.6 106.0 3 434.6
2011
Financial assets
Assets held for trading 184.0 - 19.0 203.0
Derivative financial instruments 66.0 1 300.8 77.0 1 443.8
Total 250.0 1 300.8 96.0 1 646.8
Financial liabilities
Debt securities at fair value - 1 697.0 - 1 697.0
Derivative financial instruments 72.0 1 147.4 93.0 1 312.4
Total 72.0 2 844.4 93.0 3 009.4

DANSKE BANK PLC / FINANCIAL STATEMENTS AND ANNUAL REPORT 2012 48
Shares and bond valued on non-observable input2012 Shares Bonds Total Derivatives Total
Fair value 1 January 20.0 20.0 -16.0 -16.0
Value adjustment through profit and loss -9.0 -9.0 13.0 13.0
Acquisitions 44.0 44.0 -9.0 -9.0
Fair value 31 December 55.0 - 55.0 -12.0 -12.0
2011
Fair value 1 January 23.0 23.0 -12.0 -12.0
Value adjustment through profit and loss -14.0 -14.0 0.0 0.0
Acquisitions 11.0 11.0 -4.0 -4.0
Fair value 31 December 20.0 - 20.0 -16.0 -16.0
Financial instruments at amortised cost
for vast majority of amounts due to the Group, loans,
advances and deposits, active market does not exist.
consequently, the Group bases its fair value estimates
on data showing changes in market conditions after the
initial recognition of the individual instrument and
affecting the price that would have been fixed if the
terms had been agreed at the balance sheet date. other
EURm 2012 2011
Financial assets Fair value Carrying amount Fair value Carrying amount
Cash and balances at central banks 3 034.9 3 034.9 814.1 814.1
Loans and receivables 20 774.5 20 844.6 21 058.7 21 001.7
Other financial assets 4 827.4 4 827.4 3 731.9 3 731.9
Total 28 636.8 28 706.9 25 604.7 25 547.7
Financial liabilities
Amounts owed to credit institutions and customers 18 867.9 18 867.7 17 209.3 17 189.3
Debt securities in issue 6 441.2 6 288.2 4 253.6 4 514.5
Total 25 309.1 25 155.9 21 462.9 21 703.8
14 CAsH AnD BALAnCEs AT CEnTRAL BAnKsEURm 2012 2011
Cash 18.3 22.6
Balances with central banks 3 016.7 791.5
Total 3 034.9 814.1
people may make other estimates. the maturity of items
included in cash and balances at central bank is so
short, that carrying amount represents also fair value.
in the table below are presented fair values and
carrying amounts of financial assets and liabilities at
amortised costs, including the fair value adjustment of
hedged interest rate risk.

DANSKE BANK PLC / FINANCIAL STATEMENTS AND ANNUAL REPORT 2012 49
15 LOAns AnD RECEivABLEsEURm
Loans and receivables to customers and public entities 2012 2011
By type of loan
Home loans 11 716.0 11 341.7
Consumer loans 1 216.8 1 229.5
Other retail loans 1 421.1 1 470.4
Finance lease assets1) 540.4 555.3
Other commercial loans 6 303.7 6 737.4
Impairment charges -353.5 -332.6
Total 20 844.6 21 001.7
Loans and receivables to credit institutions
Deposits 1 525.6 2 155.1
Repo agreements 3 053.0 1 450.1
Other loans 248.7 126.8
Impairment charges - -
Total 4 827.4 3 731.9
Total loans and receivables 25 672.0 24 733.6
EURm Impairment charges from loans and receivables 2012 Individual Collective Total
At January 1, 2012 308.3 24.3 332.6
+New and increased impairment charges 92.6 19.6 112.3
-Reversals of impairment charges -22.7 - -22.7
-Write-offs debited to allowance account -70.0 - -70.0
-Foreign currency translation and other items 1.3 - 1.3
At December 31,2012 309.6 43.9 353.5
2011
At January 1, 2011 297.4 25.7 323.1
+New and increased impairment charges 129.2 - 129.2
-Reversals of impairment charges -59.0 -1.4 -60.4
-Write-offs debited to allowance account -61.0 - -61.0
-Foreign currency translation and other items 1.7 - 1.7
At December 31,2011 308.3 24.3 332.6
FINANCE LEASE ASSETS INCLUDED IN LOANS1)
Reconciliation of gross investments and present value of future minimum lease payments:EURm 2012 2011
Gross investments 569.2 596.7
Less unearned finance income -28.7 -34.4
net investments in finance leases 540.4 562.3
Less unguaranteed residual values accruing to the benefit fo the lessor - -
Present value of future minimum lease payments receivable 540.4 562.3
Accumulated allowance for uncollectible minimum lease payments receivable 6.8 8.5
EURm 2012 2011
Maturities for finance lease assetsGross
investmentNet
investmentGross
investmentNet
investment
not later than one year 154.9 142.1 172.7 155.2
later than one year and not later than five years 362.7 351.7 403.0 386.5
later than five years 51.6 46.7 21.0 20.6
Total 569.2 540.4 596.7 562.3
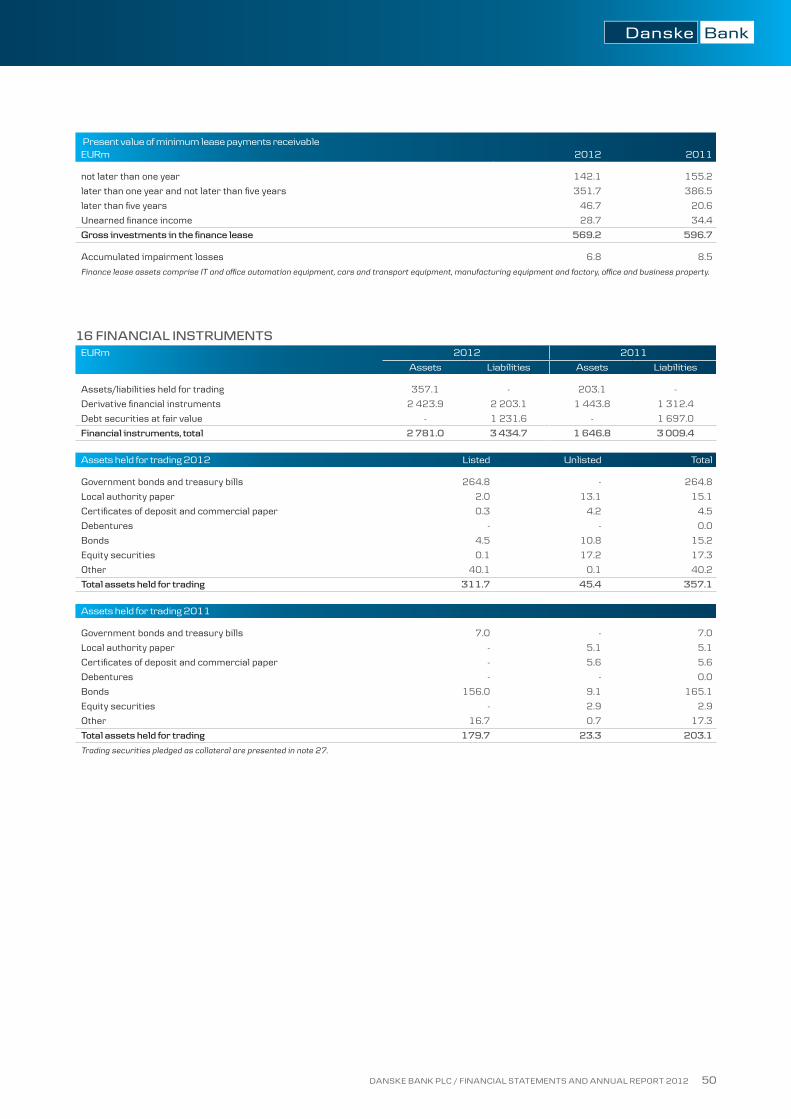
DANSKE BANK PLC / FINANCIAL STATEMENTS AND ANNUAL REPORT 2012 50
16 FinAnCiAL insTRuMEnTsEURm 2012 2011
Assets Liabilities Assets Liabilities
Assets/liabilities held for trading 357.1 - 203.1 -
Derivative financial instruments 2 423.9 2 203.1 1 443.8 1 312.4
Debt securities at fair value - 1 231.6 - 1 697.0
Financial instruments, total 2 781.0 3 434.7 1 646.8 3 009.4
Assets held for trading 2012 Listed Unlisted Total
Government bonds and treasury bills 264.8 - 264.8
Local authority paper 2.0 13.1 15.1
Certificates of deposit and commercial paper 0.3 4.2 4.5
Debentures - - 0.0
Bonds 4.5 10.8 15.2
Equity securities 0.1 17.2 17.3
Other 40.1 0.1 40.2
Total assets held for trading 311.7 45.4 357.1
Assets held for trading 2011
Government bonds and treasury bills 7.0 - 7.0
Local authority paper - 5.1 5.1
Certificates of deposit and commercial paper - 5.6 5.6
Debentures - - 0.0
Bonds 156.0 9.1 165.1
Equity securities - 2.9 2.9
Other 16.7 0.7 17.3
Total assets held for trading 179.7 23.3 203.1
Trading securities pledged as collateral are presented in note 27.
Present value of minimum lease payments receivable EURm 2012 2011
not later than one year 142.1 155.2
later than one year and not later than five years 351.7 386.5
later than five years 46.7 20.6
Unearned finance income 28.7 34.4
gross investments in the finance lease 569.2 596.7
Accumulated impairment losses 6.8 8.5
Finance lease assets comprise IT and office automation equipment, cars and transport equipment, manufacturing equipment and factory, office and business property.

DANSKE BANK PLC / FINANCIAL STATEMENTS AND ANNUAL REPORT 2012 51
DERIVATIVES
EURm 2012 2011
Derivatives held for tradingContract/no-
tional amount
Fair value Contract/no-tional amount
Fair value
Assets Liabilities Assets Liabilities
interest rate derivatives
OTC derivatives
Interest rate swaps 58 467.5 768.0 1 107.9 34 177.5 518.8 459.0
Forward rate agreements 301.0 0.1 0.1 838.6 1.1 1.0
Interest rate options, bought and sold 5 779.4 38.0 44.7 4 869.2 34.8 36.9
Total OTC derivatives 806.1 1 152.7 554.7 496.9
Exchange traded derivatives
Interest rate futures 0.1 - - 41.3 - 0.5
Interest rate options, bought and sold 1 231.7 2.7 1.9 118.4 0.6 0.6
Total exchange traded derivatives 2.7 1.9 0.6 1.1
Total interest rate derivatives 808.8 1 154.6 555.3 498.0
Foreign exchange derivatives
OTC derivatives
Cross-currency interest rate swaps 10 211.8 433.0 418.0 5 397.7 184.4 167.7
Forward foreign exchange contracts 25 433.1 337.8 343.6 19 147.8 316.8 321.2
Currency options, bought and sold 2 250.6 9.0 9.1 1 870.0 12.6 13.0
Total OTC derivatives 779.8 770.7 513.8 501.9
Total foreign exchange derivatives 779.8 770.7 513.8 501.9
Equity derivatives
OTC derivatives
Equity and equity index options, bought and sold 1 258.0 8.6 8.9 4 402.7 16.2 14.4
Equity index futures - - - - - -
Total OTC derivatives 8.6 8.9 16.2 14.4
Exchange traded derivatives
Equity index futures - - - - - -
Total exchange trade derivatives 0.0 0.0 0.0 0.0
Total equity derivatives 8.6 8.9 16.2 14.4
Other derivatives
OTC derivatives
Commodity forwards - - - - - -
Commodity futures 533.5 59.6 22.9 545.5 72.4 32.5
Credit derivatives 8.2 - - 8.0 - -
Total OTC derivatives 59.6 22.9 72.4 32.5
Exchange traded derivatives
Commodity futures 418.1 16.7 45.9 360.7 14.2 34.0
Total exchange trade derivatives 16.7 45.9 14.2 34.0
Total other derivatives 76.3 68.8 86.6 66.5
Total derivatives held for trading 1 673.5 2 003.0 1 171.9 1 080.8

DANSKE BANK PLC / FINANCIAL STATEMENTS AND ANNUAL REPORT 2012 52
interest rate and interest rate and cross currency
interest rate swaps are designated as fair value
hedges, using them as hedges against changes in
market interest rates and foreign exchange rates.
the Group uses derivative instruments for trading and
for hedging purposes. the derivatives used are foreign
exchange, interest rate, equity, commodity and credit
derivatives. Derivatives held for trading relate
primarily to customer business and, to a lesser degree
to proprietary trading. Derivatives held for hedging
purposes are used for hedging loans and liabilities.
DERIVATIVES
EURm 2012 2011
Derivatives held for hedgingContract/no-
tional amount
Fair value Contract/no-tional amount
Fair value
Assets Liabilities Assets Liabilities
Derivatives designated as fair value hedges
interest rate derivatives
Interest rate swaps 7 738.4 748.8 186.1 5 564.2 271.4 219.3
Foreign exchange derivatives
Currency options, bought and sold - - - - - -
Cross-currency interest rate swaps 496.3 1.6 14.0 95.4 0.5 12.3
Equity derivatives
Equity and equity index options, bought and sold - - - - - -
Total derivatives designated as fair value hedges 750.4 200.1 271.9 231.6
Derivatives designated as cash flow hedges
interest rate derivatives
Interest rate swaps - - - - - -
Total derivatives designated as cash flow hedges - - - -
Total derivatives held for hedging 750.4 200.1 271.9 231.6
Total derivative financial instruments 2 423.9 2 203.1 1 443.8 1 312.4
Nominal value of the underlying instrumentRemaining maturity
Less than 1 year
1–5 years
Over 5 years
Less than 1 year 1–5 years
Over 5 years
49 791.3 43 875.1 20 461.4 29 366.5 28 871.6 19 198.5
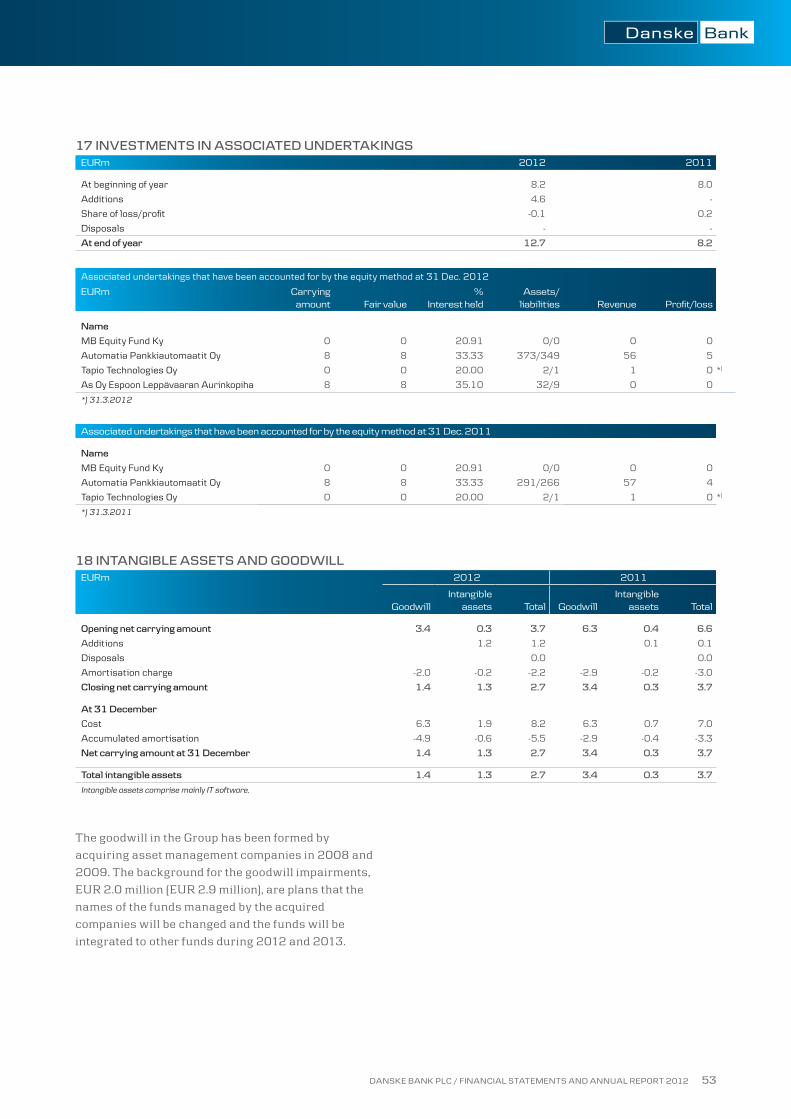
DANSKE BANK PLC / FINANCIAL STATEMENTS AND ANNUAL REPORT 2012 53
17 invEsTMEnTs in AssOCiATED unDERTAKingsEURm 2012 2011
At beginning of year 8.2 8.0
Additions 4.6 -
Share of loss/profit -0.1 0.2
Disposals - -
At end of year 12.7 8.2
Associated undertakings that have been accounted for by the equity method at 31 Dec. 2012
EURm Carrying amount Fair value
% Interest held
Assets/ liabilities Revenue Profit/loss
name
MB Equity Fund Ky 0 0 20.91 0/0 0 0
Automatia Pankkiautomaatit Oy 8 8 33.33 373/349 56 5
Tapio Technologies Oy 0 0 20.00 2/1 1 0 *)
As Oy Espoon Leppävaaran Aurinkopiha 8 8 35.10 32/9 0 0
*) 31.3.2012
Associated undertakings that have been accounted for by the equity method at 31 Dec. 2011
name
MB Equity Fund Ky 0 0 20.91 0/0 0 0
Automatia Pankkiautomaatit Oy 8 8 33.33 291/266 57 4
Tapio Technologies Oy 0 0 20.00 2/1 1 0 *)
*) 31.3.2011
18 inTAngiBLE AssETs AnD gOODWiLLEURm 2012 2011
GoodwillIntangible
assets Total GoodwillIntangible
assets Total
Opening net carrying amount 3.4 0.3 3.7 6.3 0.4 6.6
Additions 1.2 1.2 0.1 0.1
Disposals 0.0 0.0
Amortisation charge -2.0 -0.2 -2.2 -2.9 -0.2 -3.0
Closing net carrying amount 1.4 1.3 2.7 3.4 0.3 3.7
At 31 December
Cost 6.3 1.9 8.2 6.3 0.7 7.0
Accumulated amortisation -4.9 -0.6 -5.5 -2.9 -0.4 -3.3
net carrying amount at 31 December 1.4 1.3 2.7 3.4 0.3 3.7
Total intangible assets 1.4 1.3 2.7 3.4 0.3 3.7
Intangible assets comprise mainly IT software.
the goodwill in the Group has been formed by
acquiring asset management companies in 2008 and
2009. the background for the goodwill impairments,
eur 2.0 million (eur 2.9 million), are plans that the
names of the funds managed by the acquired
companies will be changed and the funds will be
integrated to other funds during 2012 and 2013.

DANSKE BANK PLC / FINANCIAL STATEMENTS AND ANNUAL REPORT 2012 54
19 invEsTMEnT PROPERTYEURm 2012 2011
Carrying amount at January 1 32.0 31.5
Additions - 0.5
Disposals -32.0 -
Carrying amount at December 31 0.0 32.0
Fair value adjustments at January 1 1.7 2.8
Fair value adjustments for the period -1.7 -1.2
Fair value adjustments at December 31 0.0 1.7
net carrying amount at December 31 0.0 33.7
20 PROPERTY, PLAnT AnD EQuiPMEnT EURm2012
Land and buildings
Leaseassets*)
Leaseholdimprovements Other Total
At 1 January
Opening net carrying amount 1.4 16.7 12.2 6.9 37.2
Additions 0.0 3.9 2.1 5.9
Disposals -1.7 -2.1 -1.9 -5.7
Transfers to and from items
Transferred to lease assets held for sale -26.3
Impairment losses
Reversals of impairment charges
Depreciations -0.1 14.5 -4.3 -2.1 8.0
Closing net carrying amount 1.4 3.2 9.7 5.0 19.3
At 31 December
Cost 3.5 8.4 38.5 106.7 157.2
Accumulated depreciation -1.8 -5.2 -28.9 -101.7 -137.5
Accumulated impairment losses -0.4 0.0 0.0 0.0 -0.4
net carrying amount 1.4 3.2 9.7 5.0 19.3
Total property, plant and equipment 1.4 3.2 9.7 5.0 19.3
2011
At 1 January
Opening net carrying amount 1.5 42.8 12.0 8.6 64.9
Additions 0.1 4.0 2.8 6.9
Disposals -3.6 -2.1 -5.7
Transfers to and from items
Transferred to lease assets held for sale -35.1
Impairment losses
Reversals of impairment charges
Depreciations -0.1 12.5 -3.8 -2.4 6.3
Closing net carrying amount 1.4 16.7 12.2 6.9 37.2
At 31 December
Cost 3.5 36.4 36.8 106.5 183.2
Accumulated depreciation -1.7 -19.7 -24.6 -99.6 -145.6
Accumulated impairment losses -0.4 0.0 0.0 0.0 -0.4
net carrying amount 1.4 16.7 12.2 6.9 37.2
Total property, plant and equipment 1.4 16.7 12.2 6.9 37.2
*) Assets under Lease assets are operating leases and mainly comprise cars.

DANSKE BANK PLC / FINANCIAL STATEMENTS AND ANNUAL REPORT 2012 55
21 OTHER AssETsEURm 2012 2011
Accrued interest 41.0 48.7
Items in transit 0.5 0.4
Other 222.1 54.0
Total 263.7 103.1
Item Other include i.a. collaterals 153.5 EURm, sales and fee receivables
about 20.1 EURm, employee pension insurance receivables 1.5 EURm,
prepaid costs 3.7 EURm.
22 TAx AssETs AnD TAx LiABiLiTiEsEURm 2012 2011
Income tax assets 0.8 23.6
Deferred tax assets 25.7 2.0
Total tax assets 26.5 25.6
Income tax liabilities 5.5 0.0
Deferred tax liabilities - -
Total tax liabilities 5.5 0.0
Deferred tax assets
Due to provisions and impairments on loans -23.1 -10.9
Due to consolidated eliminations - -3.9
Due to other items -4.8 -5.1
Set-off against deferred tax liabilities 2.2 17.9
Total -25.7 -2.0
Deferred tax liabilities
Due to provisions and impairments on loans - 11.6
Due to depreciation and impairments 2.2 5.9
Fair value measurement of investment property - 0.4
Set-off against deferred tax assets -2.2 -17.9
Total 0.0 0.0
net deferred tax asset (-)/liability (+) -25.7 -2.0
Changes in deferred taxes
Deferred tax assets/liabilities 1 January -2.0 -4.2
Recognised in the income statement:
Provisions and impairments on receivables -23.7 13.5
Amortisation/depreciation and impairments -3.7 -6.9
Valuation of investments -0.4 -0.3
Other 4.1 -4.1
net deferred tax assets (-)/liabilities (+), total
31.12. -25.7 -2.0
income tax assets, asset (-)/liability (+), net 4.8 -23.6
Total tax assets (-)/liabilities (+), net -20.9 -25.6
23 AMOunTs OWED TO CREDiT insTiTuTiOns AnD CusTOMERs
EURm
Amounts owed to credit institutions and central banks 2012 2011
Liabilities to central banks 0.3 0.4
Deposits from credit insitutions 1 898.2 1 504.6
Other liabilities owed to credit institutions 506.2 449.7
Total 2 404.8 1 954.7
Amounts owed to customers and public entities
Deposits
Demand deposits 2 805.7 2 674.6
Savings accounts 2 827.7 2 867.6
Current accounts 7 586.8 6 623.5
Money market deposits 182.6 365.9
Time deposits 3 060.1 2 702.9
Total 16 462.9 15 234.6
Total amounts owed to credit institutions
and customers 18 867.7 17 189.3

DANSKE BANK PLC / FINANCIAL STATEMENTS AND ANNUAL REPORT 2012 56
24 DEBT sECuRiTiEs in issuEEURm
Debt securities in issue 2012 2011
Certificates of deposit 1 231.6 1 697.0
Bonds and notes*) 6 288.2 4 157.8
of which in foreign currency 33.0 34.8
Total debt securities in issue 7 519.8 5 854.8
Subordinated debt securities
Capital securities 356.8 356.7
of which perpetuals 356.8 356.7
Total subordinated debt securities 356.8 356.7
Total debt securities in issue 7 876.6 6 211.5
*) Of which Finnish covered bonds EUR 5 billion (3 billion).
EURmSubordinated loan capital
Year of issueRedemption
price
Carrying amount
Borrower Principal Interest rate Maturity 2012 2011
Danske Bank Plc 125 5.407 2004 Perpertual 100% 131.3 134.0
Danske Bank Plc 100 2,410/variable 2004 Perpertual 100% 101.9 99.2
Danske Bank Plc 125 1,783/variable 2005 Perpertual 100% 123.6 123.5
Danske Bank Plc issued on 18 march 2004 eur 125
million preferred capital securities. the loan pays fixed
interest rate for the first ten years and floating rate
interest after that. the interest can be paid only from
the distributable capital. the loan is perpetual and is
repayable only with the consent of the finnish
financial supervision authority at the earliest on 31
march 2014 and on any interest payment after that.
Danske Bank Plc issued on 13 october 2004 eur 100
million preferred capital securities. the loan paid fixed
interest rate for the first year and floating rate interest
after that, however capped to 8,5 per cent p.a. the
interest can be paid only from the distributable capital.
the loan is perpetual and is repayable only with the
consent of the finnish financial supervion authority
at the earliest on 13 october 2014 and on every
interest payment date after that.
Danske Bank Plc issued on 16 December 2005 eurm
125 capital securities. the loan is a floating rate and
pays an interest at 3-month euribor plus 1.6 per cent.
the interest on the loan can be paid only from the
distributable capital. the loan is perpetual and is
repayable only with the consent of the finnish financial
supervision authority at the earliest on 18 march 2013
and on every interest payment date after that.
Danske Bank Plc Group had in issue on 31 December
2012 three capital securities included in tier 1 capital,
all of them repayable with the consent of the finnish
financial supervision authority and in one of them a
step-up clause at the earliest call. the amount included
in the own funds of primary loans in Danske Bank Plc
Group at 31 Dec. 2012 was eur 350,0 (350,0).
Danske Bank Plc issued 27 June 2012 a covered bond
with a principal of eur 1 billion and a maturity of 5
years. the loan pays an interest at 3-month euribor
plus 0.70 per cent.
Daanske Bank Plc issued 27 september 2012 a
covered bond with a principal of eur 1 billion and a
maturity of 7 years. the loan pays fixed interest rate of
1.625 per cent, which was swapped to floating rate
at 0.370 per cent over euribor.

DANSKE BANK PLC / FINANCIAL STATEMENTS AND ANNUAL REPORT 2012 57
25 OTHER LiABiLiTiEsEURm 2012 2011
Deferred interest 69.3 73.6
Items in transit 28.7 130.4
Staff commitments 30.0 33.0
VAT debt 2.3 1.6
Other 350.8 182.7
Total other liabilities 481.0 421.4
Item Other includes i.a. collateral liabilities 153.5 EURm, fee and commission
liabilities 10.6 EURm and provisions 1.7 EURm.
26 PROvisiOnsEURm 2012 2011
From off-balance sheet items 1.7 2.1
EURm From off-balance sheet items
At 1 January 2.1 2.1
Additions - -
Spent - -
Reversals of provisions 0.4 -
At 31 December 1.7 2.1
Danske Bank Plc makes individual and collective
impairment charges from irrevocable loan
commitments and guarantees. impairment charges on
loans and receivables are presented in notes 10 and 15.
27 COnTingEnT LiABiLiTiEs AnD COMMiTMEnTsEURm
Off-balance sheet items 2012 2011
Guarantees and pledges 1 796.7 1 858.9
Undrawn loans, overdraft facilities and other commitments to lend 4 229.6 4 377.0
Total 6 026.4 6 235.9
off-balance sheet items consist mainly of guarantees
and commitments to extend credit. the termination
clauses of unutilized credit facilities have been
reviewed and classification of unused credit facilities
to irrevocable commitments is partly updated.
comparative figures have been adjusted accordingly.
Guarantees including irrevocable letters of credit
comprise commitments written on behalf of
customers. commitments to extend credit are
irrevocable commitments and comprise undrawn
loans, overdraft facilities and other commitments to
lend. the commitments are stated to the amount
that can be required to be paid on the basis of the
commitment. for guarantees a provision is recognised
when the Group considers it more likely than not that
an obligation exists under its guarantees.
Danske Bank Plc Group companies are party to
various lawsuits. in view of its size, the Group does
not expect the outcomes of these pending to have
any material effect on its financial position.
ASSETS PLEDGED AS COLLATERAL FOR LIABILITIES OR CONTINGENT LIABILITIES
EURm 2012 2011
Assets pledged as collateral for liabilities Assets
pledgedLiabilities/
commitmentsAssets
pledgedLiabilities/
commitments
Trading portfolio assets
Trading securities 375.2 605.8 406.9 606.4
Loans and receivables
Loans and deposits 6 518.9 5 262.4 4 026.8 3 184.1
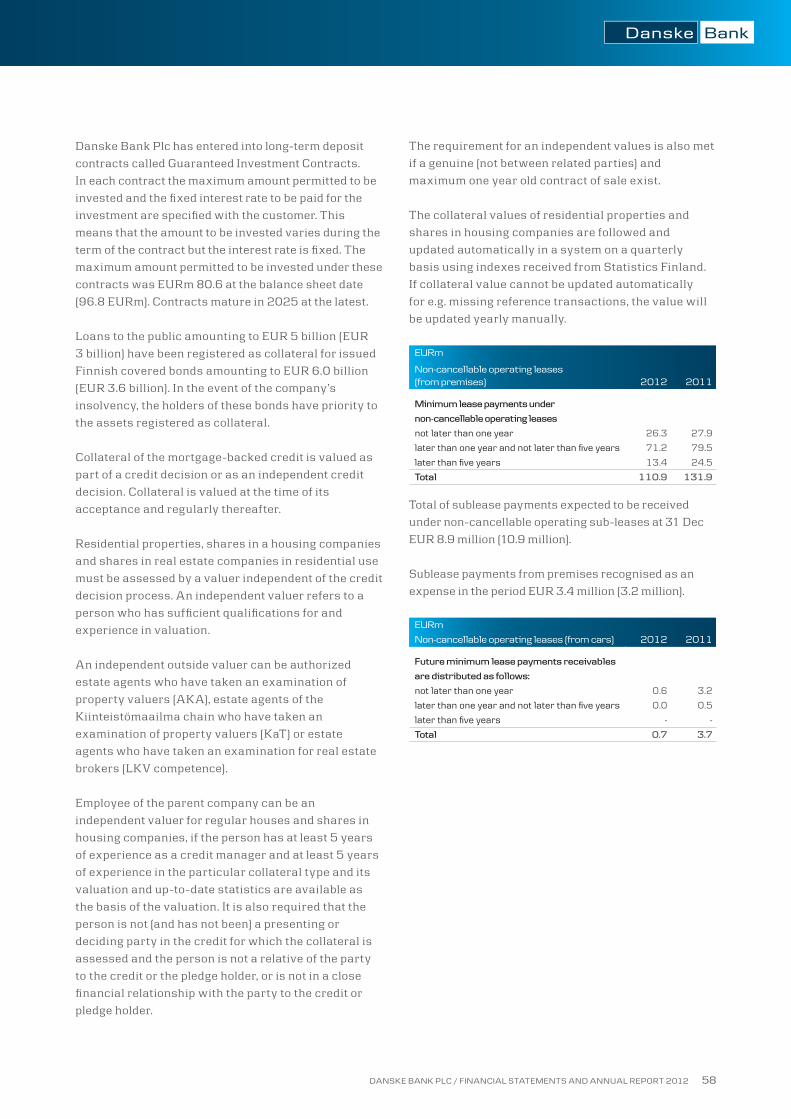
DANSKE BANK PLC / FINANCIAL STATEMENTS AND ANNUAL REPORT 2012 58
Danske Bank Plc has entered into long-term deposit
contracts called Guaranteed investment contracts.
in each contract the maximum amount permitted to be
invested and the fixed interest rate to be paid for the
investment are specified with the customer. this
means that the amount to be invested varies during the
term of the contract but the interest rate is fixed. the
maximum amount permitted to be invested under these
contracts was eurm 80.6 at the balance sheet date
(96.8 eurm). contracts mature in 2025 at the latest.
loans to the public amounting to eur 5 billion (eur
3 billion) have been registered as collateral for issued
finnish covered bonds amounting to eur 6.0 billion
(eur 3.6 billion). in the event of the company’s
insolvency, the holders of these bonds have priority to
the assets registered as collateral.
collateral of the mortgage-backed credit is valued as
part of a credit decision or as an independent credit
decision. collateral is valued at the time of its
acceptance and regularly thereafter.
residential properties, shares in a housing companies
and shares in real estate companies in residential use
must be assessed by a valuer independent of the credit
decision process. an independent valuer refers to a
person who has sufficient qualifications for and
experience in valuation.
an independent outside valuer can be authorized
estate agents who have taken an examination of
property valuers (aka), estate agents of the
kiinteistömaailma chain who have taken an
examination of property valuers (kat) or estate
agents who have taken an examination for real estate
brokers (lkV competence).
employee of the parent company can be an
independent valuer for regular houses and shares in
housing companies, if the person has at least 5 years
of experience as a credit manager and at least 5 years
of experience in the particular collateral type and its
valuation and up-to-date statistics are available as
the basis of the valuation. it is also required that the
person is not (and has not been) a presenting or
deciding party in the credit for which the collateral is
assessed and the person is not a relative of the party
to the credit or the pledge holder, or is not in a close
financial relationship with the party to the credit or
pledge holder.
the requirement for an independent values is also met
if a genuine (not between related parties) and
maximum one year old contract of sale exist.
the collateral values of residential properties and
shares in housing companies are followed and
updated automatically in a system on a quarterly
basis using indexes received from statistics finland.
if collateral value cannot be updated automatically
for e.g. missing reference transactions, the value will
be updated yearly manually.
EURm
Non-cancellable operating leases (from premises) 2012 2011
Minimum lease payments under
non-cancellable operating leases
not later than one year 26.3 27.9
later than one year and not later than five years 71.2 79.5
later than five years 13.4 24.5
Total 110.9 131.9
total of sublease payments expected to be received
under non-cancellable operating sub-leases at 31 Dec
eur 8.9 million (10.9 million).
sublease payments from premises recognised as an
expense in the period eur 3.4 million (3.2 million).
EURm
Non-cancellable operating leases (from cars) 2012 2011
Future minimum lease payments receivables
are distributed as follows:
not later than one year 0.6 3.2
later than one year and not later than five years 0.0 0.5
later than five years - -
Total 0.7 3.7
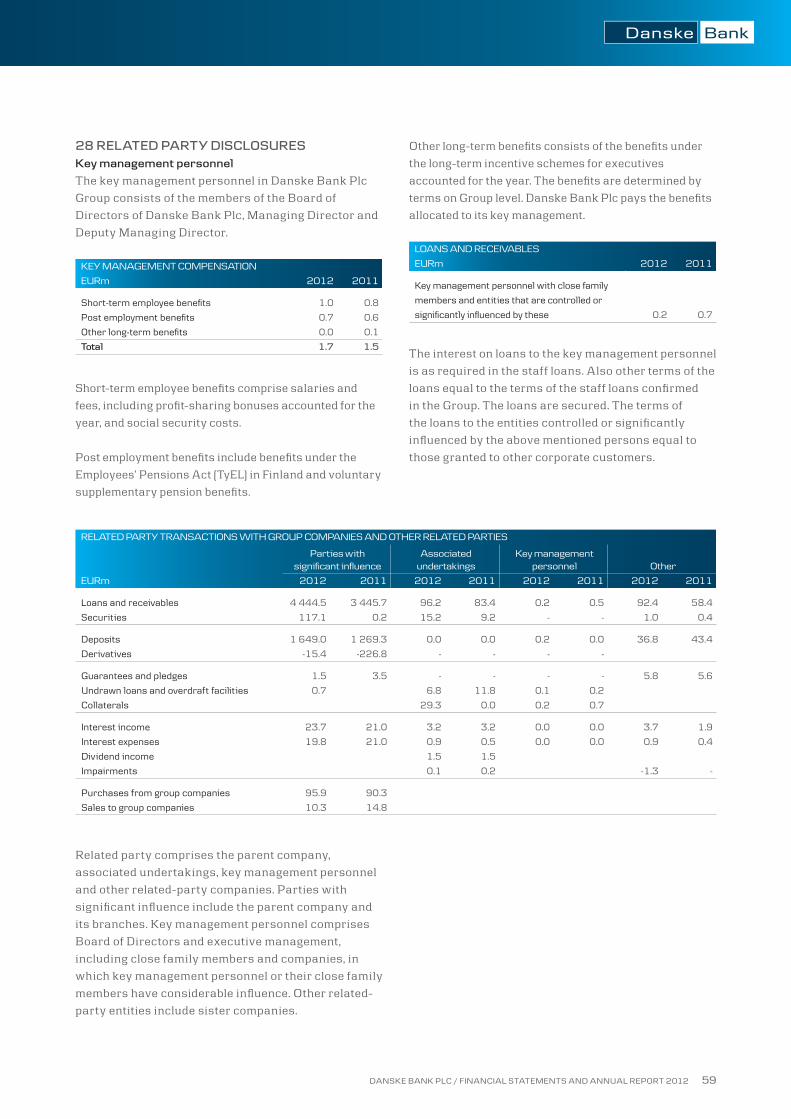
DANSKE BANK PLC / FINANCIAL STATEMENTS AND ANNUAL REPORT 2012 59
28 RELATED PARTY DisCLOsuREsKey management personnel
the key management personnel in Danske Bank Plc
Group consists of the members of the Board of
Directors of Danske Bank Plc, managing Director and
Deputy managing Director.
KEY MANAGEMENT COMPENSATION
EURm 2012 2011
Short-term employee benefits 1.0 0.8
Post employment benefits 0.7 0.6
Other long-term benefits 0.0 0.1
Total 1.7 1.5
short-term employee benefits comprise salaries and
fees, including profit-sharing bonuses accounted for the
year, and social security costs.
Post employment benefits include benefits under the
employees’ Pensions act (tyel) in finland and voluntary
supplementary pension benefits.
other long-term benefits consists of the benefits under
the long-term incentive schemes for executives
accounted for the year. the benefits are determined by
terms on Group level. Danske Bank Plc pays the benefits
allocated to its key management.
LOANS AND RECEIVABLES
EURm 2012 2011
Key management personnel with close family
members and entities that are controlled or
significantly influenced by these 0.2 0.7
the interest on loans to the key management personnel
is as required in the staff loans. also other terms of the
loans equal to the terms of the staff loans confirmed
in the Group. the loans are secured. the terms of
the loans to the entities controlled or significantly
influenced by the above mentioned persons equal to
those granted to other corporate customers.
RELATED PARTY TRANSACTIONS WITH GROUP COMPANIES AND OTHER RELATED PARTIES
EURm
Parties with significant influence
Associated undertakings
Key management personnel Other
2012 2011 2012 2011 2012 2011 2012 2011
Loans and receivables 4 444.5 3 445.7 96.2 83.4 0.2 0.5 92.4 58.4
Securities 117.1 0.2 15.2 9.2 - - 1.0 0.4
Deposits 1 649.0 1 269.3 0.0 0.0 0.2 0.0 36.8 43.4
Derivatives -15.4 -226.8 - - - -
Guarantees and pledges 1.5 3.5 - - - - 5.8 5.6
Undrawn loans and overdraft facilities 0.7 6.8 11.8 0.1 0.2
Collaterals 29.3 0.0 0.2 0.7
Interest income 23.7 21.0 3.2 3.2 0.0 0.0 3.7 1.9
Interest expenses 19.8 21.0 0.9 0.5 0.0 0.0 0.9 0.4
Dividend income 1.5 1.5
Impairments 0.1 0.2 -1.3 -
Purchases from group companies 95.9 90.3
Sales to group companies 10.3 14.8
related party comprises the parent company,
associated undertakings, key management personnel
and other related-party companies. Parties with
significant influence include the parent company and
its branches. key management personnel comprises
Board of Directors and executive management,
including close family members and companies, in
which key management personnel or their close family
members have considerable influence. other related-
party entities include sister companies.
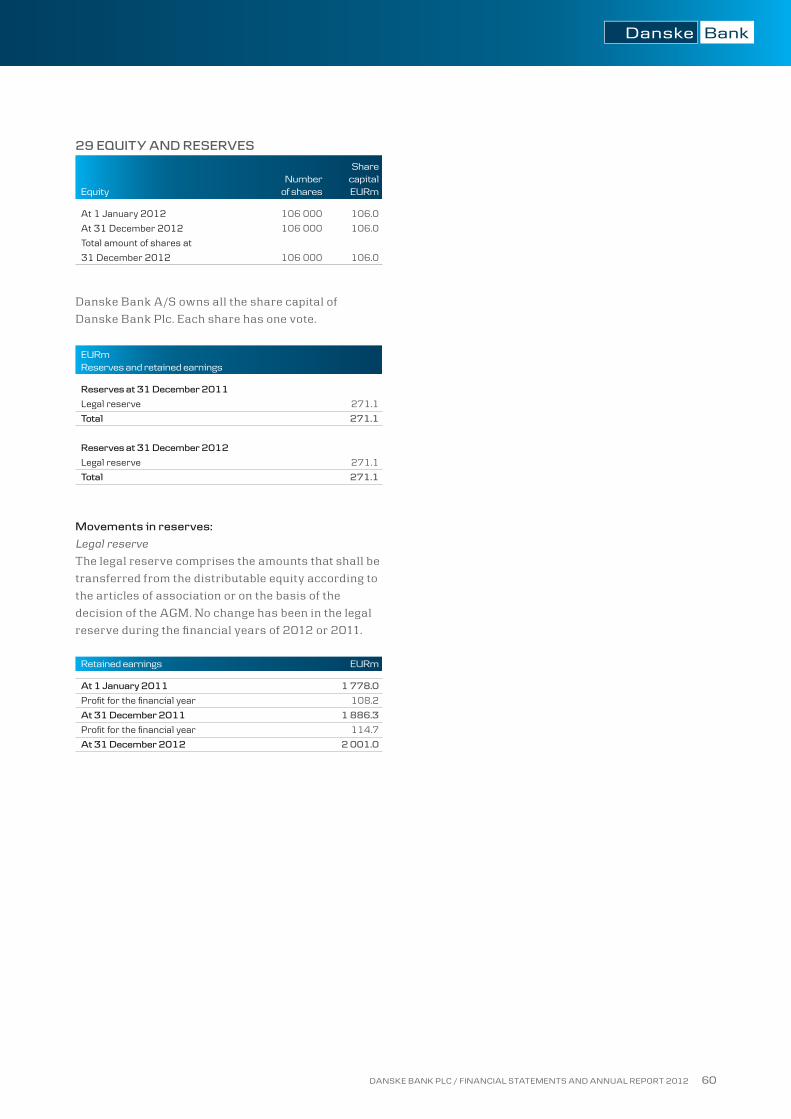
DANSKE BANK PLC / FINANCIAL STATEMENTS AND ANNUAL REPORT 2012 60
29 EQuiTY AnD REsERvEs
EquityNumber
of shares
Share capital EURm
At 1 January 2012 106 000 106.0
At 31 December 2012 106 000 106.0
Total amount of shares at
31 December 2012 106 000 106.0
Danske Bank a/s owns all the share capital of
Danske Bank Plc. each share has one vote.
EURmReserves and retained earnings
Reserves at 31 December 2011
Legal reserve 271.1
Total 271.1
Reserves at 31 December 2012
Legal reserve 271.1
Total 271.1
Movements in reserves:
Legal reserve
the legal reserve comprises the amounts that shall be
transferred from the distributable equity according to
the articles of association or on the basis of the
decision of the aGm. no change has been in the legal
reserve during the financial years of 2012 or 2011.
Retained earnings EURm
At 1 January 2011 1 778.0
Profit for the financial year 108.2
At 31 December 2011 1 886.3
Profit for the financial year 114.7
At 31 December 2012 2 001.0
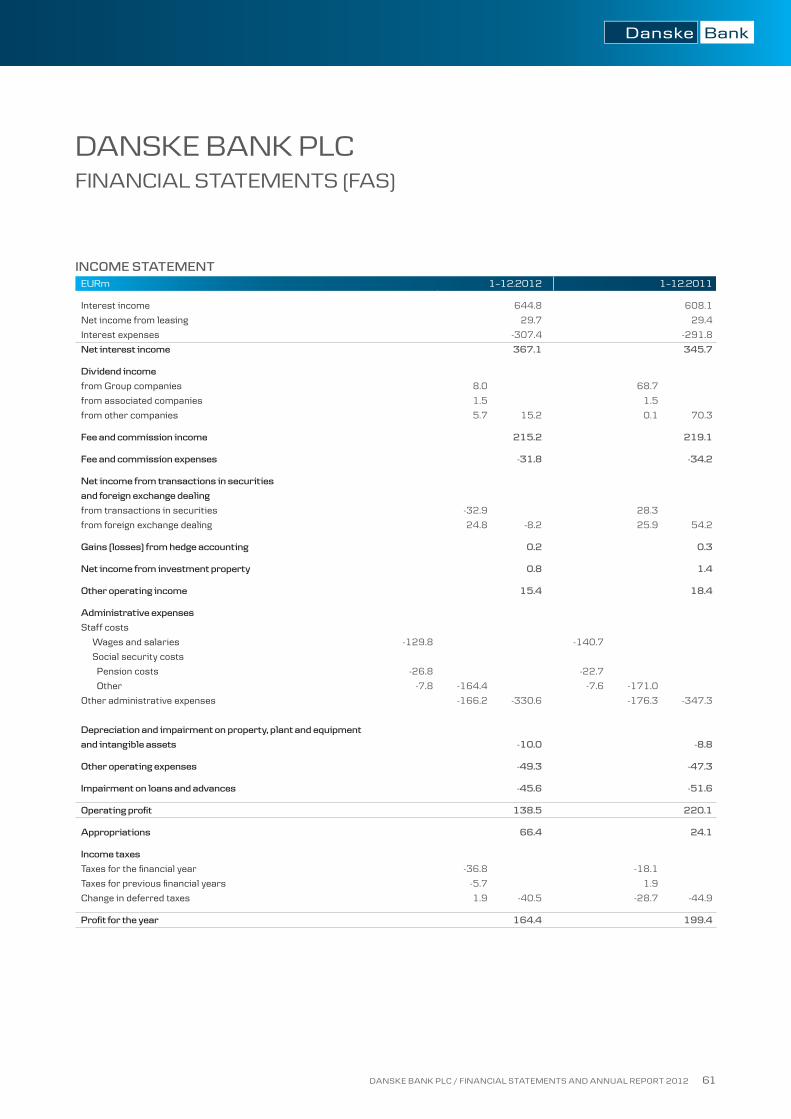
DANSKE BANK PLC / FINANCIAL STATEMENTS AND ANNUAL REPORT 2012 61
inCOME sTATEMEnTEURm 1–12.2012 1–12.2011
Interest income 644.8 608.1
Net income from leasing 29.7 29.4
Interest expenses -307.4 -291.8
net interest income 367.1 345.7
Dividend income
from Group companies 8.0 68.7
from associated companies 1.5 1.5
from other companies 5.7 15.2 0.1 70.3
Fee and commission income 215.2 219.1
Fee and commission expenses -31.8 -34.2
net income from transactions in securities
and foreign exchange dealing
from transactions in securities -32.9 28.3
from foreign exchange dealing 24.8 -8.2 25.9 54.2
gains (losses) from hedge accounting 0.2 0.3
net income from investment property 0.8 1.4
Other operating income 15.4 18.4
Administrative expenses
Staff costs
Wages and salaries -129.8 -140.7
Social security costs
Pension costs -26.8 -22.7
Other -7.8 -164.4 -7.6 -171.0
Other administrative expenses -166.2 -330.6 -176.3 -347.3
Depreciation and impairment on property, plant and equipment
and intangible assets -10.0 -8.8
Other operating expenses -49.3 -47.3
impairment on loans and advances -45.6 -51.6
Operating profit 138.5 220.1
Appropriations 66.4 24.1
income taxes
Taxes for the financial year -36.8 -18.1
Taxes for previous financial years -5.7 1.9
Change in deferred taxes 1.9 -40.5 -28.7 -44.9
Profit for the year 164.4 199.4
DANSKE BANK PLCFINANCIAL STATEMENTS (FAS)

DANSKE BANK PLC / FINANCIAL STATEMENTS AND ANNUAL REPORT 2012 62
BALAnCE sHEETASSETS
EURm 12/2012 12/2011
Cash and balances at central banks 3 034.9 814.1
Treasury bills and other eligible bills
Treasury bills 0.0 0.0
Other 258.5 258.5 0.7 0.7
Loans and advances to credit institutions
Repayable on demand 410.6 448.8
Other 4 416.7 4 827.3 3 283.1 3 731.9
Loans and advances to customers
Repayable on demand - -
Other 20 304.4 20 304.4 20 475.5 20 475.5
Lease assets 544.9 579.9
Debt securities
Issued by public bodies 21.4 11.4
Other 19.7 41.1 170.7 182.1
shares and participations 56.1 18.9
shares and participations in associated companies 5.1 5.1
shares and participations in group companies 6.3 6.3
Derivative financial instruments 2 423.9 1 443.8
Property, plant and equipment
Investment property and shares and participations in investment
property companies 4.0 6.7
Other property and shares and participations in property companies 1.4 1.4
Equipment 14.7 20.1 19.0 27.1
Other assets 211.0 67.4
Prepayments and accrued income 51.9 59.4
Deferred tax assets 29.0 6.5
31 814.6 27 418.6
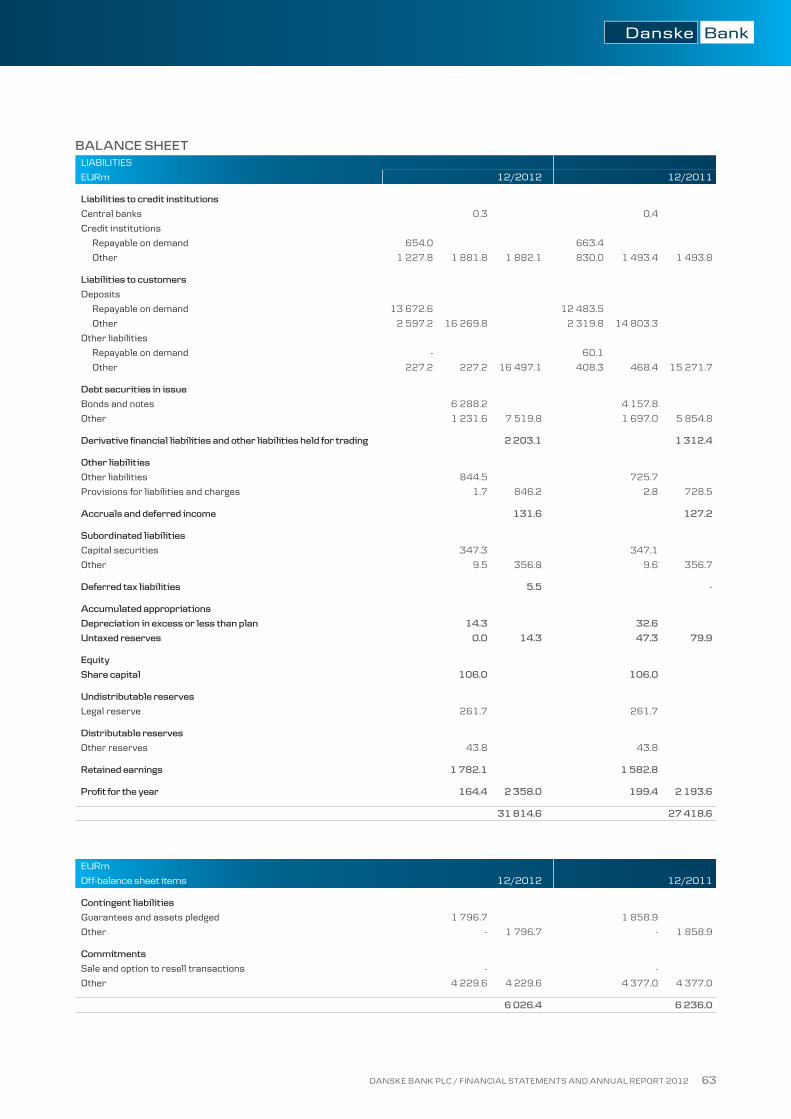
DANSKE BANK PLC / FINANCIAL STATEMENTS AND ANNUAL REPORT 2012 63
BALAnCE sHEETLIABILITIES
EURm 12/2012 12/2011
Liabilities to credit institutions
Central banks 0.3 0.4
Credit institutions
Repayable on demand 654.0 663.4
Other 1 227.8 1 881.8 1 882.1 830.0 1 493.4 1 493.8
Liabilities to customers
Deposits
Repayable on demand 13 672.6 12 483.5
Other 2 597.2 16 269.8 2 319.8 14 803.3
Other liabilities
Repayable on demand - 60.1
Other 227.2 227.2 16 497.1 408.3 468.4 15 271.7
Debt securities in issue
Bonds and notes 6 288.2 4 157.8
Other 1 231.6 7 519.8 1 697.0 5 854.8
Derivative financial liabilities and other liabilities held for trading 2 203.1 1 312.4
Other liabilities
Other liabilities 844.5 725.7
Provisions for liabilities and charges 1.7 846.2 2.8 728.5
Accruals and deferred income 131.6 127.2
subordinated liabilities
Capital securities 347.3 347.1
Other 9.5 356.8 9.6 356.7
Deferred tax liabilities 5.5 -
Accumulated appropriations
Depreciation in excess or less than plan 14.3 32.6
untaxed reserves 0.0 14.3 47.3 79.9
Equity
share capital 106.0 106.0
undistributable reserves
Legal reserve 261.7 261.7
Distributable reserves
Other reserves 43.8 43.8
Retained earnings 1 782.1 1 582.8
Profit for the year 164.4 2 358.0 199.4 2 193.6
31 814.6 27 418.6
EURm
Off-balance sheet items 12/2012 12/2011
Contingent liabilities
Guarantees and assets pledged 1 796.7 1 858.9
Other - 1 796.7 - 1 858.9
Commitments
Sale and option to resell transactions - -
Other 4 229.6 4 229.6 4 377.0 4 377.0
6 026.4 6 236.0

DANSKE BANK PLC / FINANCIAL STATEMENTS AND ANNUAL REPORT 2012 64
ACCOunTing POLiCiEs the separate financial statements of Danske Bank Plc
for 2012 have been prepared in accordance with the
provisions of chapter 9 of the act on credit
institutions (121/2007), the Decree of the ministry of
finance (150/2007) concerning annual accounts an
Group accounts of financial institutions and
investment services companies, and standard 3.1
financial statements and annual report issued by the
finnish financial supervisory authority. in addition,
the provisions of the accounting act and companies
act are followed, with the exceptions mentioned in the
act on credit institutions, 146 §.
accounting policies applied to the separate financial
statements of Danske Bank Plc are practically the
same as those applied to the consolidated financial
statements of Danske Bank Plc Group. Danske Bank
Plc Group has prepared the consolidated financial
statements in compliance with the international
financial reporting standards (ifrss) as adopted
by the eu. Policies that differ are defined below.
LEAsE AssETs lease assets are recognised in the balance sheet at
cost, less depreciation according to plan and possible
additional depreciation. the depreciation is
recognised at the amount of principal recovered from
the lease payments. Prepayments of lease assets are
also included in this item.
in income statement, net income from leasing
activities comprise lease payments less depreciation
according to plan. the item includes also additional
depreciation on lease assets, profits and losses on
disposal of the assets, fee and commission income
and other income and expenses directly attributable
to the leasing activities. other income and expenses
attributable to leasing are included in items according
to their nature.
iMPAiRMEnT OF inTAngiBLE AssETs AnD PROPERTY, PLAnT AnD EQuiPMEnTin the end of the financial year the Group assesses
whether there is any indication that an intangible
asset or an item of property, plant or equipment may
be impaired. if any such indication exists, the Group
will estimate the recoverable amount of the asset.
APPROPRiATiOnsin accordance with the finnish regulations on
accounting and taxation, companies are allowed to
include in the accounts certain untaxed reserves and
depreciation in excess or less than plan, which impact
on the taxation of the companies. companies use them
in planning their accounts and taxation. the amount of
those appropriations or changes in them does not
reflect the risks of the companies.
in the accounts the untaxed reserves and the
difference between the depreciation according to plan
and the amount deductible in the corporate taxation
are shown as a separate item in the income statement
under “appropriations” and in the Balance sheet under
“accumulated appropriations”. the appropriations
shown in income statement and Balance sheet are
presented without deducting the deferred tax liability
arising from them.
DANSKE BANK PLC
NOTES TO THE FINANCIAL STATEMENTS
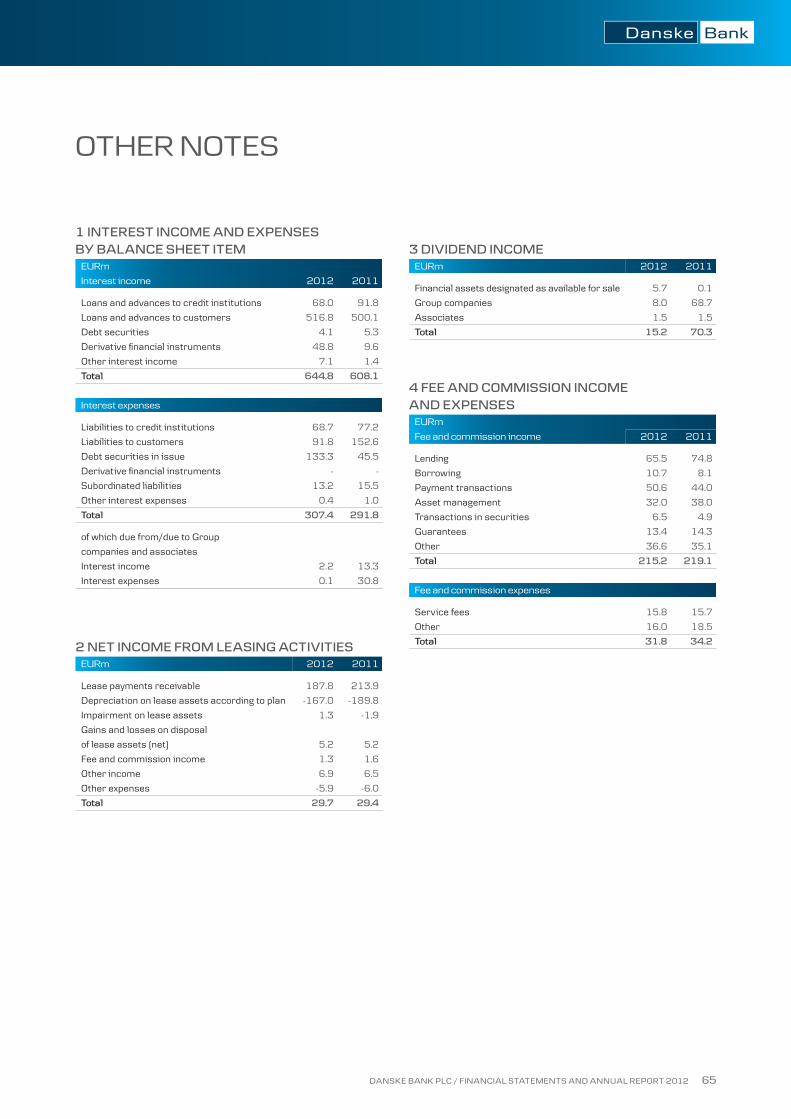
DANSKE BANK PLC / FINANCIAL STATEMENTS AND ANNUAL REPORT 2012 65
1 inTEREsT inCOME AnD ExPEnsEs BY BALAnCE sHEET iTEM
EURm
Interest income 2012 2011
Loans and advances to credit institutions 68.0 91.8
Loans and advances to customers 516.8 500.1
Debt securities 4.1 5.3
Derivative financial instruments 48.8 9.6
Other interest income 7.1 1.4
Total 644.8 608.1
Interest expenses
Liabilities to credit institutions 68.7 77.2
Liabilities to customers 91.8 152.6
Debt securities in issue 133.3 45.5
Derivative financial instruments - -
Subordinated liabilities 13.2 15.5
Other interest expenses 0.4 1.0
Total 307.4 291.8
of which due from/due to Group
companies and associates
Interest income 2.2 13.3
Interest expenses 0.1 30.8
2 nET inCOME FROM LEAsing ACTiviTiEsEURm 2012 2011
Lease payments receivable 187.8 213.9
Depreciation on lease assets according to plan -167.0 -189.8
Impairment on lease assets 1.3 -1.9
Gains and losses on disposal
of lease assets (net) 5.2 5.2
Fee and commission income 1.3 1.6
Other income 6.9 6.5
Other expenses -5.9 -6.0
Total 29.7 29.4
3 DiviDEnD inCOMEEURm 2012 2011
Financial assets designated as available for sale 5.7 0.1
Group companies 8.0 68.7
Associates 1.5 1.5
Total 15.2 70.3
4 FEE AnD COMMissiOn inCOME AnD ExPEnsEs
EURm
Fee and commission income 2012 2011
Lending 65.5 74.8
Borrowing 10.7 8.1
Payment transactions 50.6 44.0
Asset management 32.0 38.0
Transactions in securities 6.5 4.9
Guarantees 13.4 14.3
Other 36.6 35.1
Total 215.2 219.1
Fee and commission expenses
Service fees 15.8 15.7
Other 16.0 18.5
Total 31.8 34.2
OTHER NOTES
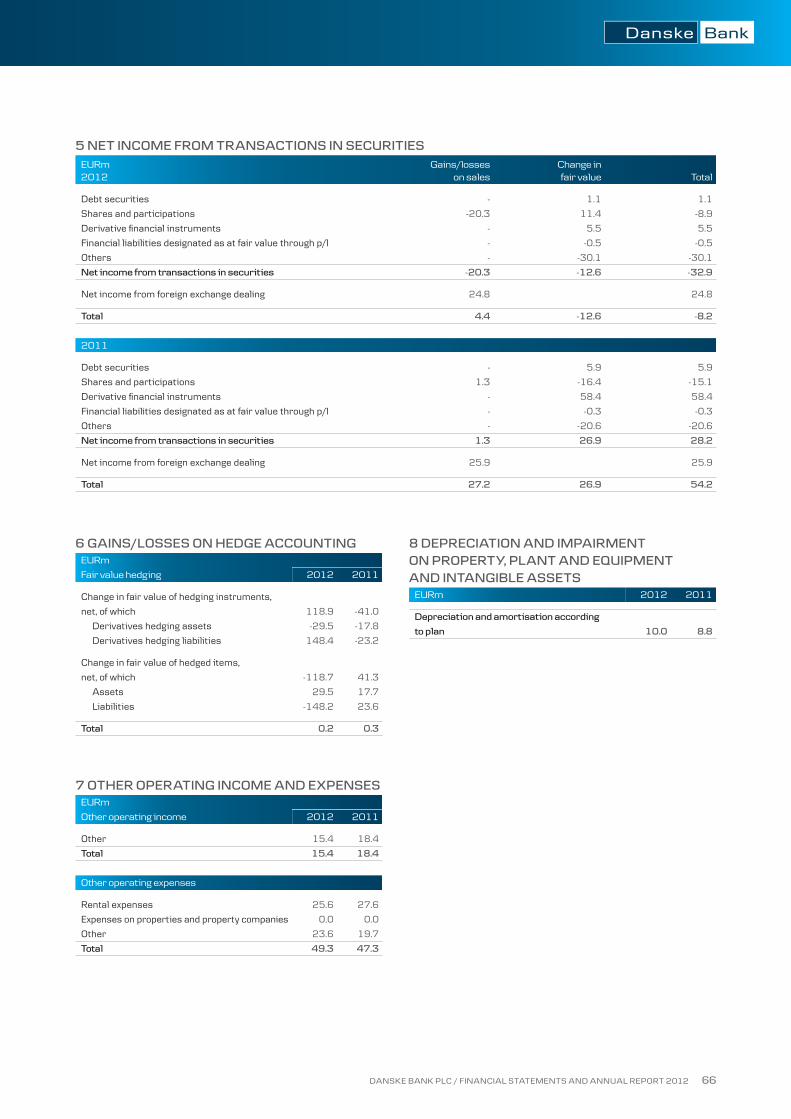
DANSKE BANK PLC / FINANCIAL STATEMENTS AND ANNUAL REPORT 2012 66
6 gAins/LOssEs On HEDgE ACCOunTingEURm
Fair value hedging 2012 2011
Change in fair value of hedging instruments,
net, of which 118.9 -41.0
Derivatives hedging assets -29.5 -17.8
Derivatives hedging liabilities 148.4 -23.2
Change in fair value of hedged items,
net, of which -118.7 41.3
Assets 29.5 17.7
Liabilities -148.2 23.6
Total 0.2 0.3
7 OTHER OPERATing inCOME AnD ExPEnsEsEURm
Other operating income 2012 2011
Other 15.4 18.4
Total 15.4 18.4
Other operating expenses
Rental expenses 25.6 27.6
Expenses on properties and property companies 0.0 0.0
Other 23.6 19.7
Total 49.3 47.3
8 DEPRECiATiOn AnD iMPAiRMEnT On PROPERTY, PLAnT AnD EQuiPMEnT AnD inTAngiBLE AssETs
EURm 2012 2011
Depreciation and amortisation according
to plan 10.0 8.8
5 nET inCOME FROM TRAnsACTiOns in sECuRiTiEsEURm2012
Gains/losses on sales
Change in fair value Total
Debt securities - 1.1 1.1
Shares and participations -20.3 11.4 -8.9
Derivative financial instruments - 5.5 5.5
Financial liabilities designated as at fair value through p/l - -0.5 -0.5
Others - -30.1 -30.1
net income from transactions in securities -20.3 -12.6 -32.9
Net income from foreign exchange dealing 24.8 24.8
Total 4.4 -12.6 -8.2
2011
Debt securities - 5.9 5.9
Shares and participations 1.3 -16.4 -15.1
Derivative financial instruments - 58.4 58.4
Financial liabilities designated as at fair value through p/l - -0.3 -0.3
Others - -20.6 -20.6
net income from transactions in securities 1.3 26.9 28.2
Net income from foreign exchange dealing 25.9 25.9
Total 27.2 26.9 54.2

DANSKE BANK PLC / FINANCIAL STATEMENTS AND ANNUAL REPORT 2012 67
9 iMPAiRMEnT On LOAns, COMMiTMEnTs AnD OTHER FinAnCiAL AssETs
EURm
2012
Individually assessed impair-
ment, gross
Collective impairment,
charges
Reversalsand
recoveriesRecognised
in profit or loss
On loans and advances to credit institutions - -
On loans and advances to customers 136.8 19.6 111.2 45.1
Guarantees and other off-balance sheet items 1.1 0.7 0.5
impairment on loans and advances and
on off-balance sheet items total 137.9 19.6 111.9 45.6
Shares and participations in Group companies
Shares and participations in associated companies
impairment losses on other financial assets total - - - -
Total 137.9 19.6 111.9 45.6
2011
On loans and advances to credit institutions - -
On loans and advances to customers 198.0 0.4 134.9 63.5
Guarantees and other off-balance sheet items -11.9 -11.9
impairment on loans and advances and
on off-balance sheet items total 186.1 0.4 134.9 51.6
Shares and participations in Group companies
Shares and participations in associated companies
impairment losses on other financial assets total - - - -
Total 186.1 0.4 134.9 51.6
Impairment charges are presented as net amounts at customer and branch level.

DANSKE BANK PLC / FINANCIAL STATEMENTS AND ANNUAL REPORT 2012 68
10 inFORMATiOn On BusinEss AREAsEURm2012
Banking Activities Markets Capital Other Total
Net interest income 321.3 52.9 0.0 -7.0 367.1
Other income, net 140.0 8.7 17.4 40.7 206.9
Total income 461.3 61.6 17.4 33.7 574.0
Total operating expenses -345.3 -21.3 -12.8 -10.4 -389.9
Impairment charges -45.6 - - - -45.6
Profit before taxes 70.3 40.3 4.6 23.3 138.5
Total assets 40 420.8 5 945.1 11.5 -14 562.9 31 814.6
of which loans and advances to credit institutions and customers 32 766.5 9 179.7 0.2 -16 814.7 25 131.7
Total liabilities 40 420.8 5 945.1 11.5 -14 562.9 31 814.6
of wich liabilities to credit institutions and customers 34 226.8 2 067.0 2.2 -17 916.8 18 379.2
Average staff number 2 133 66 49 486 2 734
2011
Net interest income 312.8 32.9 -0.9 1.0 345.7
Other income, net 256.1 18.8 22.0 32.5 329.4
Total income 568.9 51.6 21.1 33.5 675.1
Total operating expenses -360.4 -22.2 -13.5 -7.4 -403.4
Impairment charges -58.0 6.4 0.0 0.0 -51.6
Profit before taxes 150.5 35.8 7.6 26.1 220.1
Total assets 39 618.5 4 978.9 12.0 -17 190.8 27 418.6
of which loans and advances to credit institutions and customers 37 862.8 9 431.5 124.1 -23 211.0 24 207.3
Total liabilities 39 618.5 4 978.9 12.0 -17 190.8 27 418.6
of wich liabilities to credit institutions and customers 38 706.0 1 638.5 0.0 -23 579.0 16 765.5
Average staff number 2 348 68 54 537 3 007

DANSKE BANK PLC / FINANCIAL STATEMENTS AND ANNUAL REPORT 2012 69
11 LOAns AnD ADvAnCEs TO CREDiT insTiTuTiOnsEURm2012 Total
Repeyable on demand Other
Domestic credit institutions 992.5 0.3 992.1
Foreign credit institutions 3 834.9 410.3 3 424.6
Total 4 827.3 410.6 4 416.7
2011
Domestic credit institutions 1 124.9 31.4 1 093.6
Foreign credit institutions 2 607.0 417.4 2 189.5
Total 3 731.9 448.8 3 283.1
12 LOAns AnD ADvAnCEs TO CusTOMERsEURm 2012 2011
Corporates and housing companies 5 340.0 5 766.7
Financial and insurance institutions 219.6 209.4
Public sector entities 387.1 364.7
Households 13 998.8 13 705.7
Non-profit institutions serving households 209.5 215.1
Foreign 149.3 213.9
Total 20 304.4 20 475.5
Impairment charges
At January 1 329.6 311.6
+ New and increased impairment charges 106.6 129.2
– Reversals of impairment charges -21.1 -53.4
– Write-offs debited to allowance account -69.8 -57.7
– Exchange rate differences and other items 1.3 -
At December 31 346.6 329.6
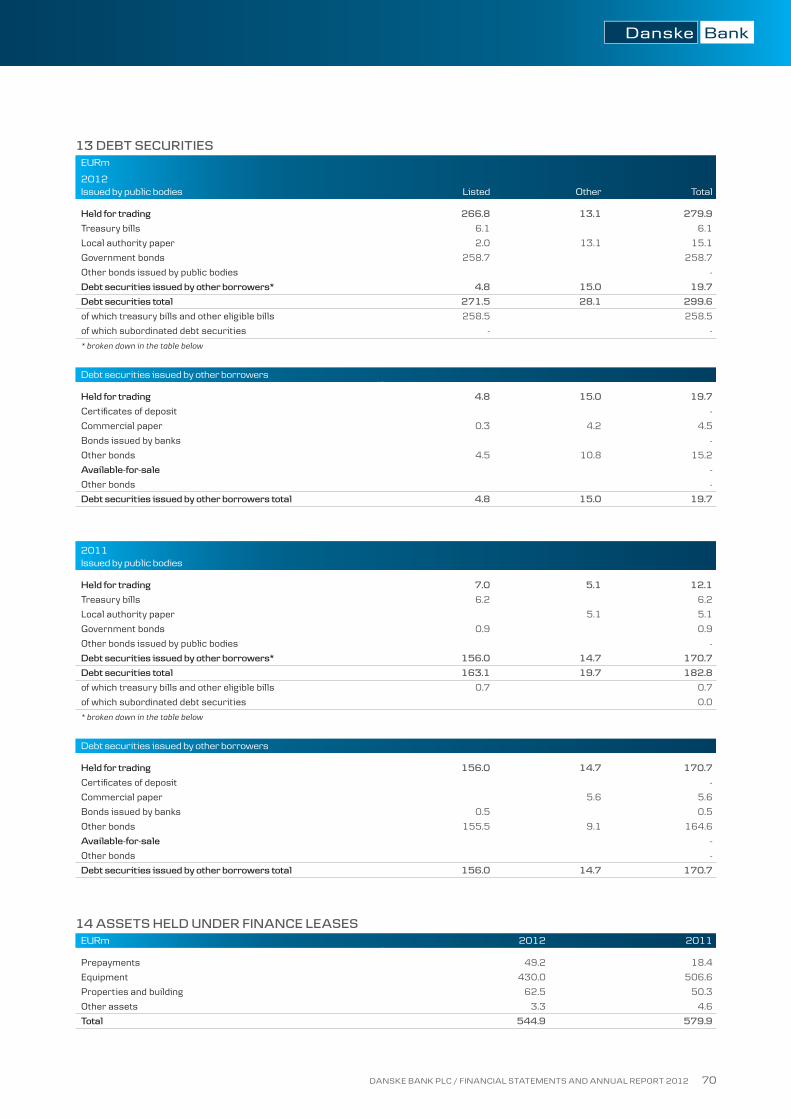
DANSKE BANK PLC / FINANCIAL STATEMENTS AND ANNUAL REPORT 2012 70
13 DEBT sECuRiTiEsEURm
2012Issued by public bodies Listed Other Total
Held for trading 266.8 13.1 279.9
Treasury bills 6.1 6.1
Local authority paper 2.0 13.1 15.1
Government bonds 258.7 258.7
Other bonds issued by public bodies -
Debt securities issued by other borrowers* 4.8 15.0 19.7
Debt securities total 271.5 28.1 299.6
of which treasury bills and other eligible bills 258.5 258.5
of which subordinated debt securities - -
* broken down in the table below
Debt securities issued by other borrowers
Held for trading 4.8 15.0 19.7
Certificates of deposit -
Commercial paper 0.3 4.2 4.5
Bonds issued by banks -
Other bonds 4.5 10.8 15.2
Available-for-sale -
Other bonds -
Debt securities issued by other borrowers total 4.8 15.0 19.7
2011Issued by public bodies
Held for trading 7.0 5.1 12.1
Treasury bills 6.2 6.2
Local authority paper 5.1 5.1
Government bonds 0.9 0.9
Other bonds issued by public bodies -
Debt securities issued by other borrowers* 156.0 14.7 170.7
Debt securities total 163.1 19.7 182.8
of which treasury bills and other eligible bills 0.7 0.7
of which subordinated debt securities 0.0
* broken down in the table below
Debt securities issued by other borrowers
Held for trading 156.0 14.7 170.7
Certificates of deposit -
Commercial paper 5.6 5.6
Bonds issued by banks 0.5 0.5
Other bonds 155.5 9.1 164.6
Available-for-sale -
Other bonds -
Debt securities issued by other borrowers total 156.0 14.7 170.7
14 AssETs HELD unDER FinAnCE LEAsEsEURm 2012 2011
Prepayments 49.2 18.4
Equipment 430.0 506.6
Properties and building 62.5 50.3
Other assets 3.3 4.6
Total 544.9 579.9

DANSKE BANK PLC / FINANCIAL STATEMENTS AND ANNUAL REPORT 2012 71
15 sHAREs AnD PARTiCiPATiOns EURm 2012 Listed Others Total
of which in credit institutions
shares and participations 40.2 15.9 56.1 -
Held for trading 40.2 15.9 56.1 -
shares and participations in group companies - 6.3 6.3 -
shares and participations in associated companies - 5.1 5.1 -
Total 67.5 0.0
2011
shares and participations 16.7 2.2 18.9 0.6
Held for trading 16.7 2.2 18.9 0.6
shares and participations in group companies - 6.3 6.3 -
shares and participations in associated companies - 5.1 5.1 -
Total 30.3 0.6
16 DERivATivE FinAnCiAL insTRuMEnTsEURm2012
Nominal value of the underlying instrument Remaining maturity Fair value
For hedging purposes Less than 1 year 1–5 years Over 5 years Positive Negative
interest rate derivatives 17.5 3 261.7 4 459.2 748.8 186.1
Interest rate swaps 17.5 3 261.7 4 459.2 748.8 186.1
Exchange rate contracts 295.0 173.5 27.8 1.6 14.0
Options
Purchased
Written
Interest rate and cross currency swaps 295.0 173.5 27.8 1.6 14.0
Equity contracts 0.0 0.0 0.0 0.0 0.0
Options
Purchased
Written
Futures and forward rate agreements
For other purposes
interest rate contracts 18 765.9 32 024.9 14 989.0 809.0 1 154.5
Futures and forward rate agreements 301.1 - - 0.1 0.1
Options
Purchased 1 463.0 1 302.1 745.8 39.1 1.7
Written 1 452.3 1 302.2 745.8 1.7 45.0
Interest rate swaps 15 549.5 29 420.6 13 497.4 768.1 1 107.7
Exchange rate contracts 29 373.4 7 599.0 923.1 779.7 770.7
Futures and forward exchange 25 078.7 341.5 12.8 337.8 343.6
Options
Purchased 1 117.1 - - 8.9 -
Written 1 133.5 - - - 9.1
Interest rate and cross currency swaps 2 044.1 7 257.5 910.3 433.0 418.0
Equity contracts 912.6 345.4 0.0 8.5 8.9
Options
Purchased 448.1 127.1 - 8.5 -
Written 464.5 218.3 - - 8.9
Futures and forward exchange
Other derivatives 426.9 470.6 62.4 76.4 68.8
Contracts with Group companies 25 036.1 21 855.7 15 474.6 1 126.5 1 030.6

DANSKE BANK PLC / FINANCIAL STATEMENTS AND ANNUAL REPORT 2012 72
EURm2011
Nominal value of the underlying instrument Remaining maturity Fair value
For hedging purposes Less than 1 year 1–5 years Over 5 years Positive Negative
interest rate derivatives 156.1 1 310.4 4 097.7 271.4 219.3
Interest rate swaps 156.1 1 310.4 4 097.7 271.4 219.3
Exchange rate contracts 35.3 19.2 41.0 0.5 12.3
Options
Purchased
Written
Interest rate and cross currency swaps 35.3 19.2 41.0 0.5 12.3
Equity contracts 0.0 0.0 0.0 0.0 0.0
Options
Purchased
Written
Futures and forward rate agreements
For other purposes
interest rate contracts 6 714.3 19 124.2 14 206.2 555.3 497.8
Futures and forward rate agreements 879.8 - - 1.1 1.5
Options
Purchased 395.5 1 620.1 460.7 34.0 1.2
Written 417.9 1 632.6 460.7 1.3 36.2
Interest rate swaps 5 021.1 15 871.5 13 284.8 518.9 458.9
Exchange rate contracts 21 502.5 4 121.6 791.2 513.8 501.9
Futures and forward exchange 18 241.8 893.0 13.0 316.8 321.2
Options
Purchased 924.0 - - 12.6 0.1
Written 945.9 - - - 12.9
Interest rate and cross currency swaps 1 390.8 3 228.6 778.2 184.4 167.7
Equity contracts 406.0 3 977.0 19.6 16.2 14.4
Options
Purchased 152.8 1 948.1 - 16.1 -
Written 253.2 2 028.9 19.6 0.1 14.4
Futures and forward exchange
Other derivatives 552.3 319.2 42.7 86.6 66.5
Contracts with Group companies 13 396.2 12 913.7 14 986.9 655.7 782.9

DANSKE BANK PLC / FINANCIAL STATEMENTS AND ANNUAL REPORT 2012 73
17 MOvEMEnTs in PROPERTY, PLAnT AnD EQuiPMEnTEURm Tangible assets
2012At 1 January
Investment property and shares in property
companies
Other property and shares in property
companies Equipment
Opening net carrying amount 6.7 1.4 19.0
Additions 6.3
Disposals -2.7 -4.3
Transfers to and from items
Impairment losses
Reversals of impairment charges
Depreciations -0.1 -6.3
Closing net carrying amount 4.0 1.4 14.7
At 31 December
Cost at the end of the year 4.0 3.5 123.3
Accumulated depreciation - -1.8 -108.7
Accumulated impairment losses - -0.4 -
net carrying amount 4.0 1.4 14.7
2011At 1 January
Opening net carrying amount 11.2 1.5 20.4
Additions 0.4 6.7
Disposals -4.9 -2.1
Transfers to and from items
Impairment losses
Reversals of impairment charges
Depreciations -0.1 -6.0
Closing net carrying amount 6.7 1.4 19.0
At 31 December
Cost at the end of the year 6.7 3.5 118.9
Accumulated depreciation - -1.7 -99.9
Accumulated impairment losses - -0.4 -
net carrying amount 6.7 1.4 19.0
18 OTHER AssETsEURm 2012 2011
Items in transit 0.5 0.4
Margin accounts related to derivatives - 7.4
Other 210.4 59.6
Total 211.0 67.4
Item Other include i.a. collaterals 153.5 EURm, sales and fee receivables
about 17.7 EURm and employee pension insurance receivables 1.5 EURm.
20 DEFERRED TAx EURm 2012 2011
Deferred tax assets -29.0 -18.1
Timing differences -29.0 -18.1
Confirmed losses - -
Deferred tax liabilities - 11.6
Timing differences - 11.6
Deferred tax assets (-)/ liabilities (+), net -29.0 -6.5
Comparative figures have been changed to reflect 2012 presentation.
19 PREPAYMEnTs AnD ACCRuED inCOMEEURm 2012 2011
Accrued interest 41.0 48.7
Other 10.9 10.7
Total 51.9 59.4

DANSKE BANK PLC / FINANCIAL STATEMENTS AND ANNUAL REPORT 2012 74
22 OTHER LiABiLiTiEsEURm 2012 2011
Items in transit 534.9 580.2
Obligatory provision 1.7 2.8
Other 309.5 145.5
Total 846.2 728.5
Comparative figures have been changed to reflect 2012 presentation.
Item Other includes i.a. collateral liabilities 153,5 EURm.
23 ACCRuALs AnD DEFERRED inCOMEEURm 2012 2011
Deferred interest 69.2 73.5
Other 62.4 53.6
Total 131.6 127.2
21 DEBT sECuRiTiEs in issuEEURm 2012 2011
Carrying amount Nominal amount Carrying amount Nominal amount
Certificates of Deposits 1 231.6 1 235.3 1 697.0 1 701.6
Bonds and notes 6 288.2 6 027.8 4 157.8 4 058.5
Total 7 519.8 7 263.0 5 854.8 5 760.1
24 suBORDinATED LiABiLiTiEsEURm 2012 2011
Subordinated liabilities with a carrying amount more than 10% of the total
amount of such liabilities 356.8 356.7
Other subordinated liabilities - -
Total 356.8 356.7
of which perpetuals 356.8 356.7
Due to Group companies - -
Due to associated companies - -
IssuerCarrying amount
in EURmNominal amount
in EURm Currency Interest % Due date
Danske Bank Plc 1) 131.3 125.0 EUR 5.407 perpetual
Danske Bank Plc 2) 101.9 125.0 EUR 2.410/variable perpetual
Danske Bank Plc 3) 123.6 100.0 EUR 1.783/variable perpetual
Total 356.8 350.0
1) Repayable on interest payment date in March 2014 and thereafter on every interest payment date. In capital adequacy calculation the capital securities are
included in their entirety in Tier 1 capital.
2) Repayable on interest payment date in March 2013 and thereafter on every interest payment date. In capital adequacy calculation the capital securities are
included in their entirety in Tier 1 capital.
3) Repayable on interest payment date in October 2014 and thereafter on every interest payment date. In capital adequacy calculation the capital securities are
included in their entirety in Tier 1 capital.
EURm 2012
Capital securities at 31 December 2012 350.0
Danske Bank Plc had on 31 December 2012 three capital securities in issue.
The main terms of these loans are disclosed in IFRS consolidated financial
statements/Note 24 Debt Securities in Issue.
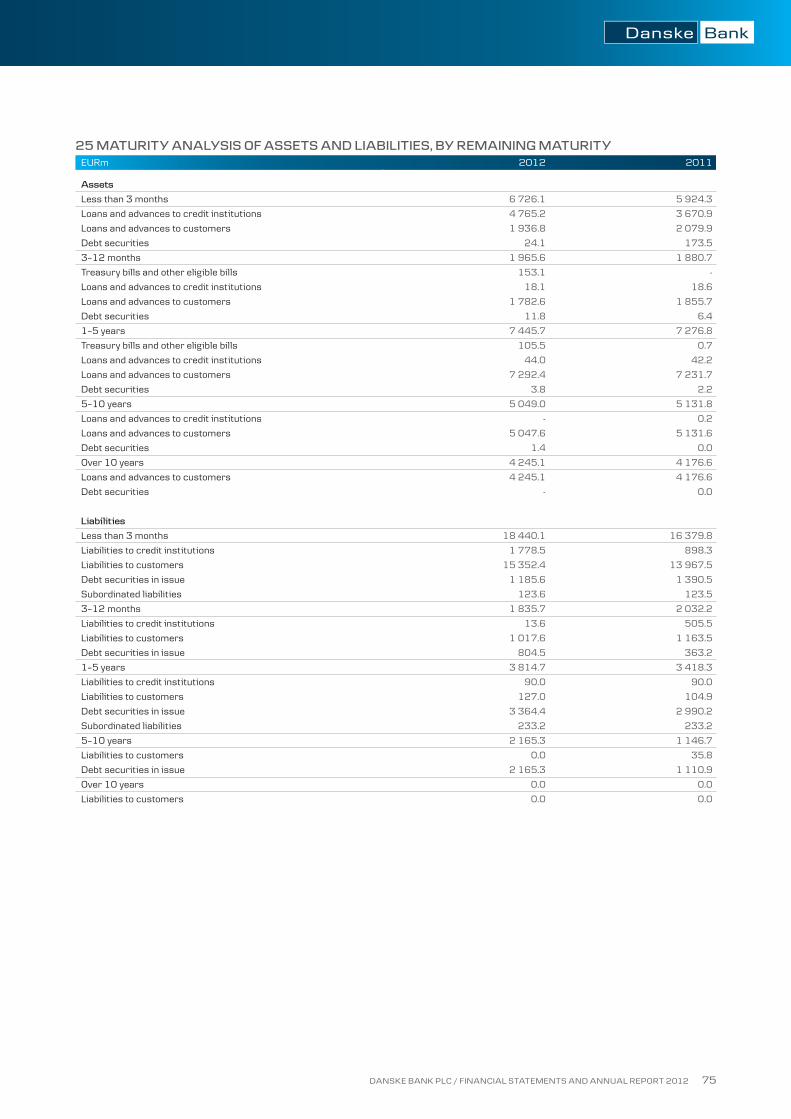
DANSKE BANK PLC / FINANCIAL STATEMENTS AND ANNUAL REPORT 2012 75
25 MATuRiTY AnALYsis OF AssETs AnD LiABiLiTiEs, BY REMAining MATuRiTYEURm 2012 2011
Assets
Less than 3 months 6 726.1 5 924.3
Loans and advances to credit institutions 4 765.2 3 670.9
Loans and advances to customers 1 936.8 2 079.9
Debt securities 24.1 173.5
3–12 months 1 965.6 1 880.7
Treasury bills and other eligible bills 153.1 -
Loans and advances to credit institutions 18.1 18.6
Loans and advances to customers 1 782.6 1 855.7
Debt securities 11.8 6.4
1–5 years 7 445.7 7 276.8
Treasury bills and other eligible bills 105.5 0.7
Loans and advances to credit institutions 44.0 42.2
Loans and advances to customers 7 292.4 7 231.7
Debt securities 3.8 2.2
5–10 years 5 049.0 5 131.8
Loans and advances to credit institutions - 0.2
Loans and advances to customers 5 047.6 5 131.6
Debt securities 1.4 0.0
Over 10 years 4 245.1 4 176.6
Loans and advances to customers 4 245.1 4 176.6
Debt securities - 0.0
Liabilities
Less than 3 months 18 440.1 16 379.8
Liabilities to credit institutions 1 778.5 898.3
Liabilities to customers 15 352.4 13 967.5
Debt securities in issue 1 185.6 1 390.5
Subordinated liabilities 123.6 123.5
3–12 months 1 835.7 2 032.2
Liabilities to credit institutions 13.6 505.5
Liabilities to customers 1 017.6 1 163.5
Debt securities in issue 804.5 363.2
1–5 years 3 814.7 3 418.3
Liabilities to credit institutions 90.0 90.0
Liabilities to customers 127.0 104.9
Debt securities in issue 3 364.4 2 990.2
Subordinated liabilities 233.2 233.2
5–10 years 2 165.3 1 146.7
Liabilities to customers 0.0 35.8
Debt securities in issue 2 165.3 1 110.9
Over 10 years 0.0 0.0
Liabilities to customers 0.0 0.0

DANSKE BANK PLC / FINANCIAL STATEMENTS AND ANNUAL REPORT 2012 76
26 AssETs AnD LiABiLiTiEs DEnOMinATED in DOMEsTiC CuRREnCY (EuRO) AnD in FOREign CuRREnCiEs (OTHER CuRREnCiEs)
EURm 2012Assets EURm
Other currencies Total
To or from Group
companies
Loans and advances to credit institutions 4 099.4 728.0 4 827.3 4535.3
Loans and advances to customers 19 776.7 527.7 20 304.4 96.4
Debt securities 293.6 6.1 299.6 -
Derivative financial assets 2 423.9 - 2 423.9 105.7
Other assets 3 953.4 5.9 3 959.3 0.6
Total 30 547.0 1 267.6 31 814.6 4 738.0
Liabilities
Liabilities to credit institutions 979.8 902.3 1 882.1 1669.0
Liabilities to customers 16 043.5 453.5 16 497.1 34.8
Debt securities in issue 7 494.3 25.5 7 519.8 -
Derivative financial liabilities and other liabilities held for trading 2 203.1 - 2 203.1 -
Other liabilities 1 336.5 18.0 1354.5 0.3
Total 28 057.2 1 399.4 29 456.6 1 704.1
2011Assets
Loans and advances to credit institutions 3 117.5 614.4 3 731.9 3504.2
Loans and advances to customers 19 918.9 556.6 20 475.5 12.4
Debt securities 176.6 6.2 182.8 0.0
Derivative financial assets 1 443.8 0.0 1 443.8 -103.1
Other assets 1 577.4 7.2 1 584.6 -
Total 26 234.2 1 184.4 27 418.6 3 413.6
Liabilities
Liabilities to credit institutions 835.6 658.2 1 493.8 1323.9
Liabilities to customers 14 964.4 307.3 15 271.7 34.5
Debt securities in issue 5 830.3 24.5 5 854.8 -
Derivative financial liabilities and other liabilities held for trading 1 312.4 - 1 312.4 -
Other liabilities 1 120.6 91.8 1212.4 -
Total 24 063.3 1 081.8 25 145.1 1 358.4

DANSKE BANK PLC / FINANCIAL STATEMENTS AND ANNUAL REPORT 2012 77
27 FAiR vALuEs AnD CARRYing AMOunTs OF FinAnCiAL AssETs AnD LiABiLiTiEs EURm 2012 2011
Financial assets Carrying amount Fair value Carrying amount Fair value
Cash in hand 3 034.9 3 034.9 814.1 814.1
Treasury bills and other eligible bills 258.5 258.5 0.7 0.7
Loans and advances to credit institutions 4 827.3 4 827.3 3 731.9 3 731.9
Loans and advances to customers (1 20 849.3 21 319.4 21 055.3 21 094.8
Debt securities 41.1 41.1 182.1 182.1
Shares and participations 56.1 56.1 18.9 18.9
Shares and participations in associated companies 5.1 5.1 5.1 5.1
Derivative financial instruments 2 423.9 2 423.9 1 443.8 1 443.8
Financial liabilities
Liabilities to credit institutions 1 882.1 1 882.1 1 493.8 1 493.8
Liabilities to customers 16 497.1 16 497.3 15 271.7 15 251.7
Debt securities in issue 7 519.8 7 531.2 5 854.8 5 720.5
Derivative financial liabilities and other liabilities held for trading 2 203.1 2 203.1 1 312.4 1 312.4
Subordinated liabilities 356.8 297.7 356.7 230.1
1) Includes lease assets
Financial instruments are carried on the balance sheet at fair value or amortised cost. In IFRS consolidated financial statements, chapter Summary of significant
account policies describes classification of financial assets and liabilities by valuation type and detailed measurement bases of financial assets and liabilities.
IFRS note 13 Fair value information discloses additional information for used valuation and estimation techniques.
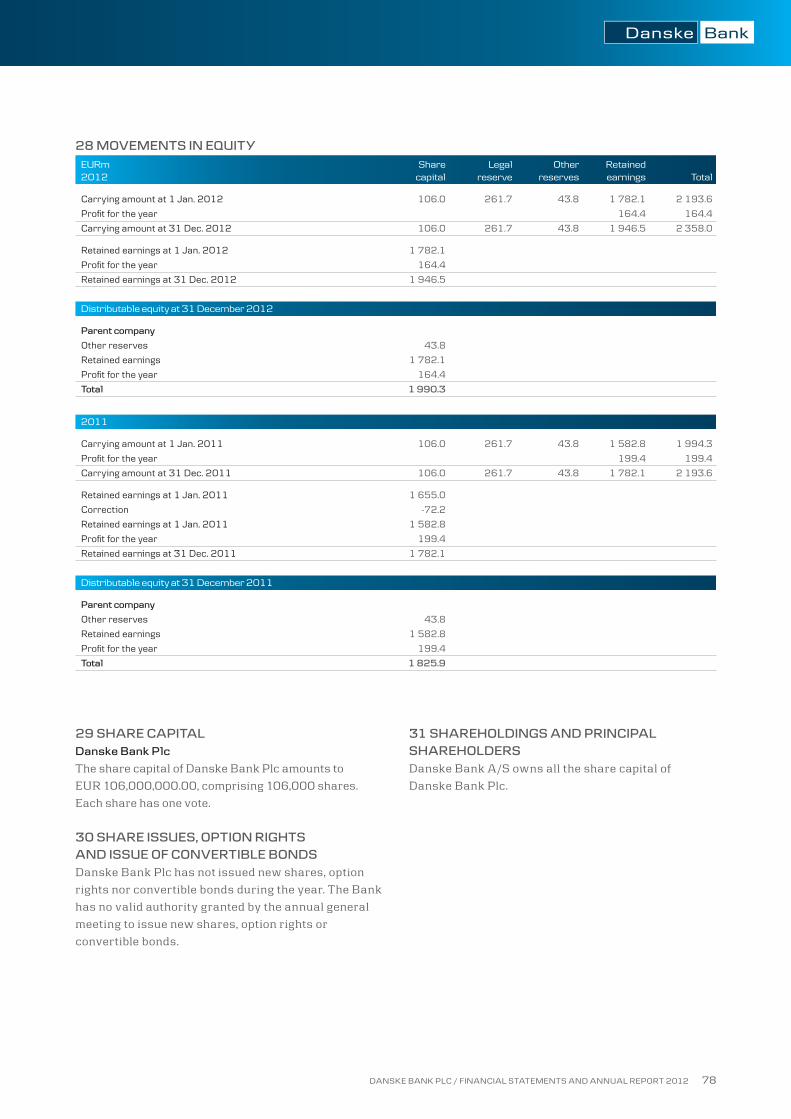
DANSKE BANK PLC / FINANCIAL STATEMENTS AND ANNUAL REPORT 2012 78
28 MOvEMEnTs in EQuiTY EURm2012
Share capital
Legal reserve
Other reserves
Retained earnings Total
Carrying amount at 1 Jan. 2012 106.0 261.7 43.8 1 782.1 2 193.6
Profit for the year 164.4 164.4
Carrying amount at 31 Dec. 2012 106.0 261.7 43.8 1 946.5 2 358.0
Retained earnings at 1 Jan. 2012 1 782.1
Profit for the year 164.4
Retained earnings at 31 Dec. 2012 1 946.5
Distributable equity at 31 December 2012
Parent company
Other reserves 43.8
Retained earnings 1 782.1
Profit for the year 164.4
Total 1 990.3
2011
Carrying amount at 1 Jan. 2011 106.0 261.7 43.8 1 582.8 1 994.3
Profit for the year 199.4 199.4
Carrying amount at 31 Dec. 2011 106.0 261.7 43.8 1 782.1 2 193.6
Retained earnings at 1 Jan. 2011 1 655.0
Correction -72.2
Retained earnings at 1 Jan. 2011 1 582.8
Profit for the year 199.4
Retained earnings at 31 Dec. 2011 1 782.1
Distributable equity at 31 December 2011
Parent company
Other reserves 43.8
Retained earnings 1 582.8
Profit for the year 199.4
Total 1 825.9
29 sHARE CAPiTAL Danske Bank Plc
the share capital of Danske Bank Plc amounts to
eur 106,000,000.00, comprising 106,000 shares.
each share has one vote.
30 sHARE issuEs, OPTiOn RigHTs AnD issuE OF COnvERTiBLE BOnDsDanske Bank Plc has not issued new shares, option
rights nor convertible bonds during the year. the Bank
has no valid authority granted by the annual general
meeting to issue new shares, option rights or
convertible bonds.
31 sHAREHOLDings AnD PRinCiPAL sHAREHOLDERsDanske Bank a/s owns all the share capital of
Danske Bank Plc.
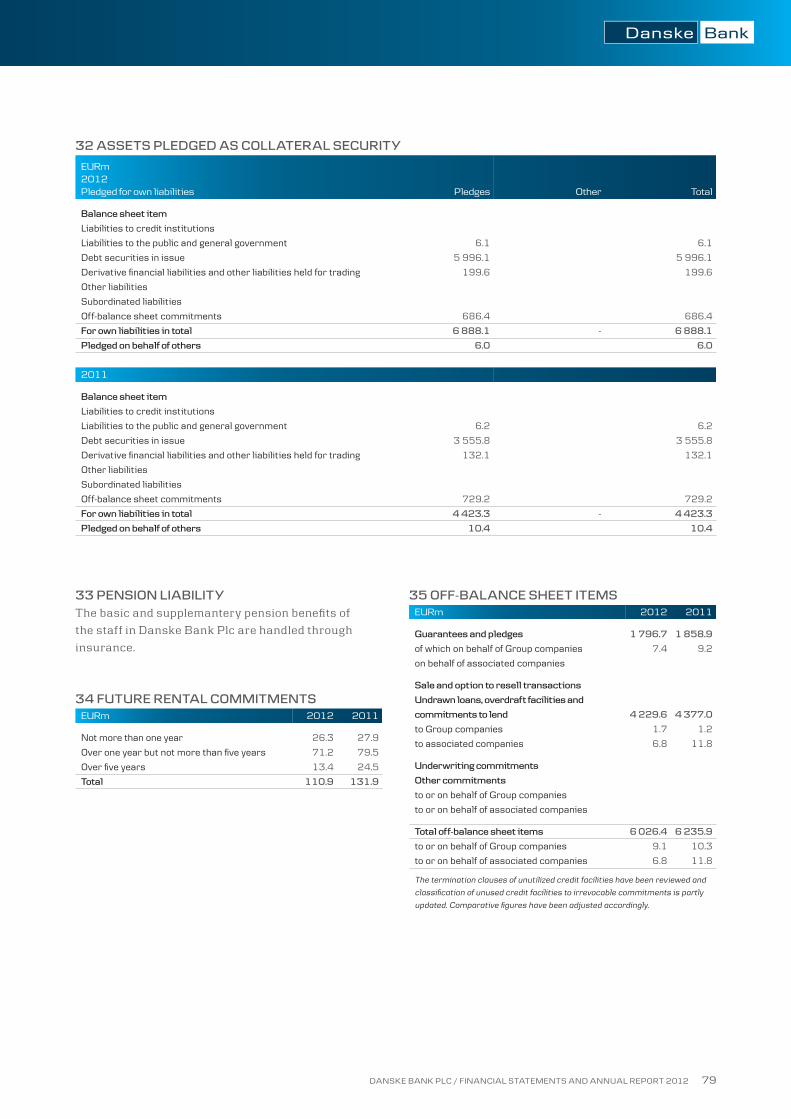
DANSKE BANK PLC / FINANCIAL STATEMENTS AND ANNUAL REPORT 2012 79
32 AssETs PLEDgED As COLLATERAL sECuRiTY
EURm2012Pledged for own liabilities Pledges Other Total
Balance sheet item
Liabilities to credit institutions
Liabilities to the public and general government 6.1 6.1
Debt securities in issue 5 996.1 5 996.1
Derivative financial liabilities and other liabilities held for trading 199.6 199.6
Other liabilities
Subordinated liabilities
Off-balance sheet commitments 686.4 686.4
For own liabilities in total 6 888.1 - 6 888.1
Pledged on behalf of others 6.0 6.0
2011
Balance sheet item
Liabilities to credit institutions
Liabilities to the public and general government 6.2 6.2
Debt securities in issue 3 555.8 3 555.8
Derivative financial liabilities and other liabilities held for trading 132.1 132.1
Other liabilities
Subordinated liabilities
Off-balance sheet commitments 729.2 729.2
For own liabilities in total 4 423.3 - 4 423.3
Pledged on behalf of others 10.4 10.4
33 PEnsiOn LiABiLiTYthe basic and supplemantery pension benefits of
the staff in Danske Bank Plc are handled through
insurance.
34 FuTuRE REnTAL COMMiTMEnTsEURm 2012 2011
Not more than one year 26.3 27.9
Over one year but not more than five years 71.2 79.5
Over five years 13.4 24.5
Total 110.9 131.9
35 OFF-BALAnCE sHEET iTEMsEURm 2012 2011
guarantees and pledges 1 796.7 1 858.9
of which on behalf of Group companies 7.4 9.2
on behalf of associated companies
sale and option to resell transactions
undrawn loans, overdraft facilities and
commitments to lend 4 229.6 4 377.0
to Group companies 1.7 1.2
to associated companies 6.8 11.8
underwriting commitments
Other commitments
to or on behalf of Group companies
to or on behalf of associated companies
Total off-balance sheet items 6 026.4 6 235.9
to or on behalf of Group companies 9.1 10.3
to or on behalf of associated companies 6.8 11.8
The termination clauses of unutilized credit facilities have been reviewed and
classification of unused credit facilities to irrevocable commitments is partly
updated. Comparative figures have been adjusted accordingly.
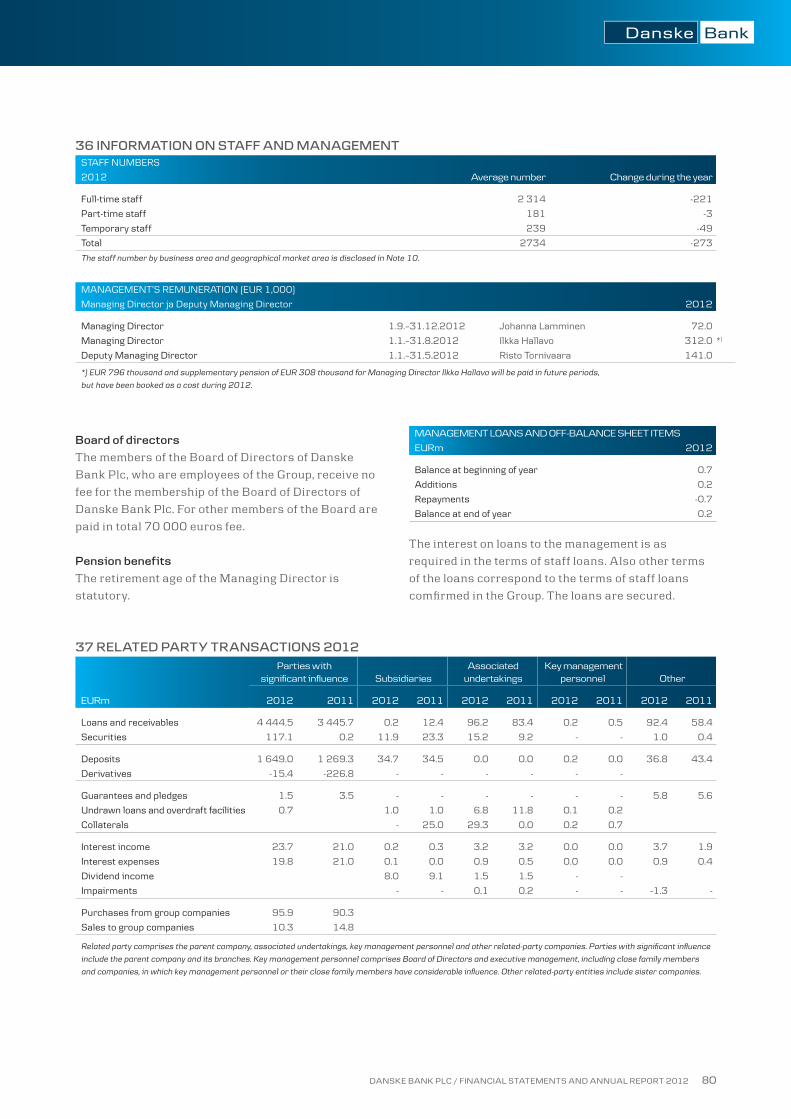
DANSKE BANK PLC / FINANCIAL STATEMENTS AND ANNUAL REPORT 2012 80
36 inFORMATiOn On sTAFF AnD MAnAgEMEnTSTAFF NUMBERS
2012 Average number Change during the year
Full-time staff 2 314 -221
Part-time staff 181 -3
Temporary staff 239 -49
Total 2734 -273
The staff number by business area and geographical market area is disclosed in Note 10.
MANAGEMENT’S REMUNERATION (EUR 1,000)
Managing Director ja Deputy Managing Director 2012
Managing Director 1.9.–31.12.2012 Johanna Lamminen 72.0
Managing Director 1.1.–31.8.2012 Ilkka Hallavo 312.0 *)
Deputy Managing Director 1.1.–31.5.2012 Risto Tornivaara 141.0
*) EUR 796 thousand and supplementary pension of EUR 308 thousand for Managing Director Ilkka Hallavo will be paid in future periods,
but have been booked as a cost during 2012.
Board of directors
the members of the Board of Directors of Danske
Bank Plc, who are employees of the Group, receive no
fee for the membership of the Board of Directors of
Danske Bank Plc. for other members of the Board are
paid in total 70 000 euros fee.
Pension benefits
the retirement age of the managing Director is
statutory.
MANAGEMENT LOANS AND OFF-BALANCE SHEET ITEMS
EURm 2012
Balance at beginning of year 0.7
Additions 0.2
Repayments -0.7
Balance at end of year 0.2
the interest on loans to the management is as
required in the terms of staff loans. also other terms
of the loans correspond to the terms of staff loans
comfirmed in the Group. the loans are secured.
37 RELATED PARTY TRAnsACTiOns 2012
EURm
Parties with significant influence Subsidiaries
Associated undertakings
Key management personnel Other
2012 2011 2012 2011 2012 2011 2012 2011 2012 2011
Loans and receivables 4 444.5 3 445.7 0.2 12.4 96.2 83.4 0.2 0.5 92.4 58.4
Securities 117.1 0.2 11.9 23.3 15.2 9.2 - - 1.0 0.4
Deposits 1 649.0 1 269.3 34.7 34.5 0.0 0.0 0.2 0.0 36.8 43.4
Derivatives -15.4 -226.8 - - - - - -
Guarantees and pledges 1.5 3.5 - - - - - - 5.8 5.6
Undrawn loans and overdraft facilities 0.7 1.0 1.0 6.8 11.8 0.1 0.2
Collaterals - 25.0 29.3 0.0 0.2 0.7
Interest income 23.7 21.0 0.2 0.3 3.2 3.2 0.0 0.0 3.7 1.9
Interest expenses 19.8 21.0 0.1 0.0 0.9 0.5 0.0 0.0 0.9 0.4
Dividend income 8.0 9.1 1.5 1.5 - -
Impairments - - 0.1 0.2 - - -1.3 -
Purchases from group companies 95.9 90.3
Sales to group companies 10.3 14.8
Related party comprises the parent company, associated undertakings, key management personnel and other related-party companies. Parties with significant influence
include the parent company and its branches. Key management personnel comprises Board of Directors and executive management, including close family members
and companies, in which key management personnel or their close family members have considerable influence. Other related-party entities include sister companies.

DANSKE BANK PLC / FINANCIAL STATEMENTS AND ANNUAL REPORT 2012 81
38 sHAREs HELD
Company name, registered office, nature of business Note
Percentage of equity
capital held %
Carrying amount of shares total EUR million
subsidiaries of Danske Bank Plc
MB Equity Partners Oy, Helsinki, mutual fund management 1 40.0 0.0
MB Mezzanine Fund II Ky, Helsinki, mezzanine financing 1 60.0 0.0
Realty World Ltd, Helsinki, estate agency 1 100.0 2.4
Danske Invest Fund Management Ltd, Helsinki, investment services 1 100.0 3.8
Aurinkopihan Palvelut Oy, Helsinki, letting of other real estate 1 100.0 0.1
Associates of Danske Bank Plc
Automatia Pankkiautomaatit Oy, Helsinki, electronic banking services 2 33.3 5.1
MB Equity Fund Ky, Helsinki, investment 2 20.9 0.0
Tapio Technologies Oy, Espoo, manufacturer of electrical equipments 2 20.0 0.0
As Oy Espoon Leppävaaran Aurinkopiha, Espoo, operation of dwellings
and residential real estate 2 28.2 4.0
1 Consolidated in full
2 Accounted by the equity method
39 AssET MAnAgEMEnT AnD CusTOMER AssETs HELDDanske Bank Plc provides asset management
services self and through subsidiaries.
Assets under management EURm
Discretionary mandates 9 062.5
Consultative mandates 2 074.4
Total assets under management 11 136.9
40 AuDiTing FEEsEURm
Auditor fees 2012 2011
KPMg Ltd. (2012), Ernst & Young Ltd. (2011)
Auditing 0.1 0.2
Assignments acc. to auditing law - -
Tax consulting 0.0 0.0
Other services 0.4 0.0
Auditor fees, total 0.5 0.3
41 inFORMATiOn On A CREDiT insTiTuTiOn WHiCH is A gROuP COMPAnYin 2012, Danske Bank Plc belonged to Danske Bank
Group, whose parent company is Danske Bank a/s.
Danske Bank a/s annual report 2012 is available at
www.danskebank.com.
the registered office of Danske Bank Plc is helsinki
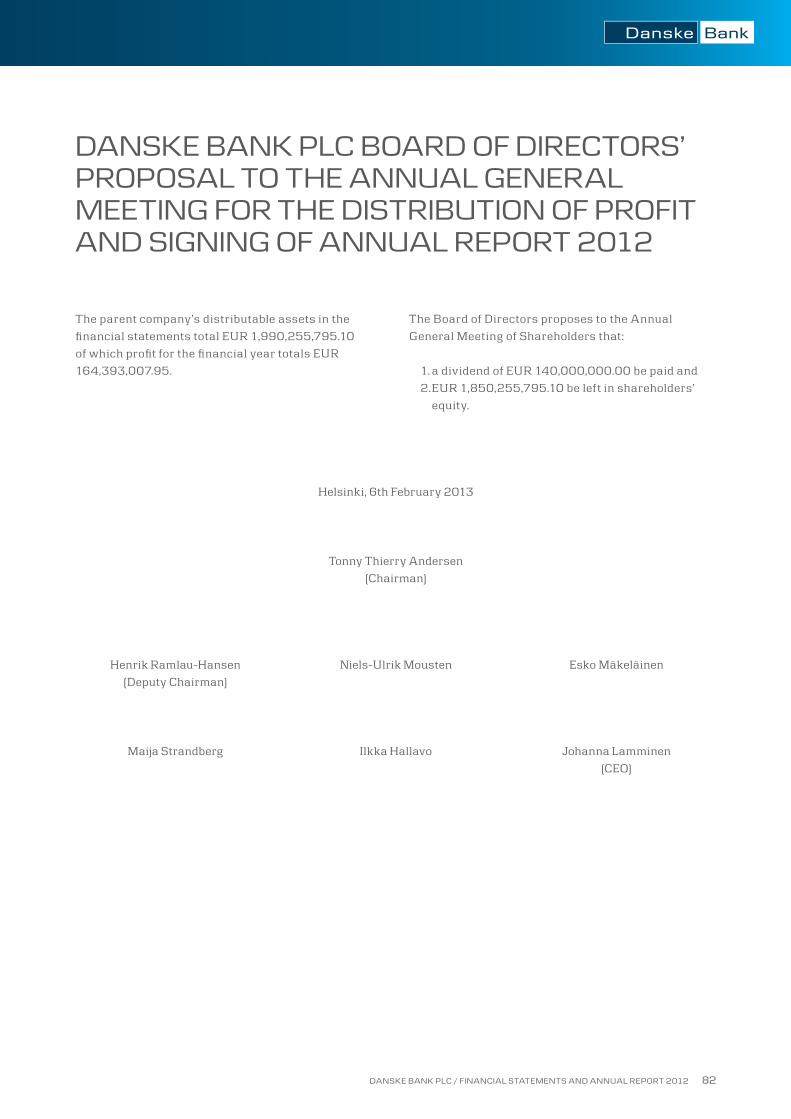
DANSKE BANK PLC / FINANCIAL STATEMENTS AND ANNUAL REPORT 2012 82
DANSKE BANK PLC BOARD OF DIRECTORS’ PROPOSAL TO THE ANNUAL GENERAL MEETING FOR THE DISTRIBUTION OF PROFIT AND SIGNING OF ANNUAL REPORT 2012
the parent company’s distributable assets in the
financial statements total eur 1,990,255,795.10
of which profit for the financial year totals eur
164,393,007.95.
henrik ramlau-hansen
(Deputy chairman)
maija strandberg
helsinki, 6th february 2013
niels-ulrik mousten
ilkka hallavo
tonny thierry andersen
(chairman)
esko mäkeläinen
Johanna lamminen
(ceo)
the Board of Directors proposes to the annual
General meeting of shareholders that:
1. a dividend of eur 140,000,000.00 be paid and
2. eur 1,850,255,795.10 be left in shareholders’
equity.


