
Anton TopurovIT Department – DB Group
Database Performance Tuning with EM12c

Database Performance TuningEnterprise Manager 11Enterprise Manager 12Conclusions
Agenda
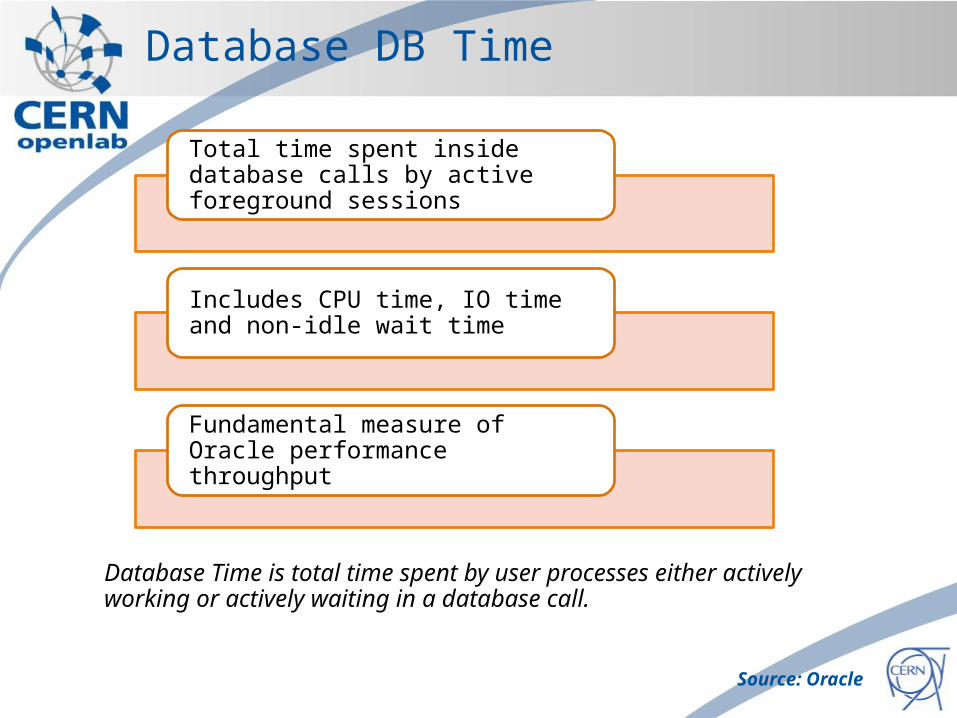
Database Time is total time spent by user processes either actively working or actively waiting in a database call.
Total time spent inside database calls by active foreground sessions
Includes CPU time, IO time and non-idle wait time
Fundamental measure of Oracle performance throughput
Source: Oracle
Database DB Time
Active Sessions
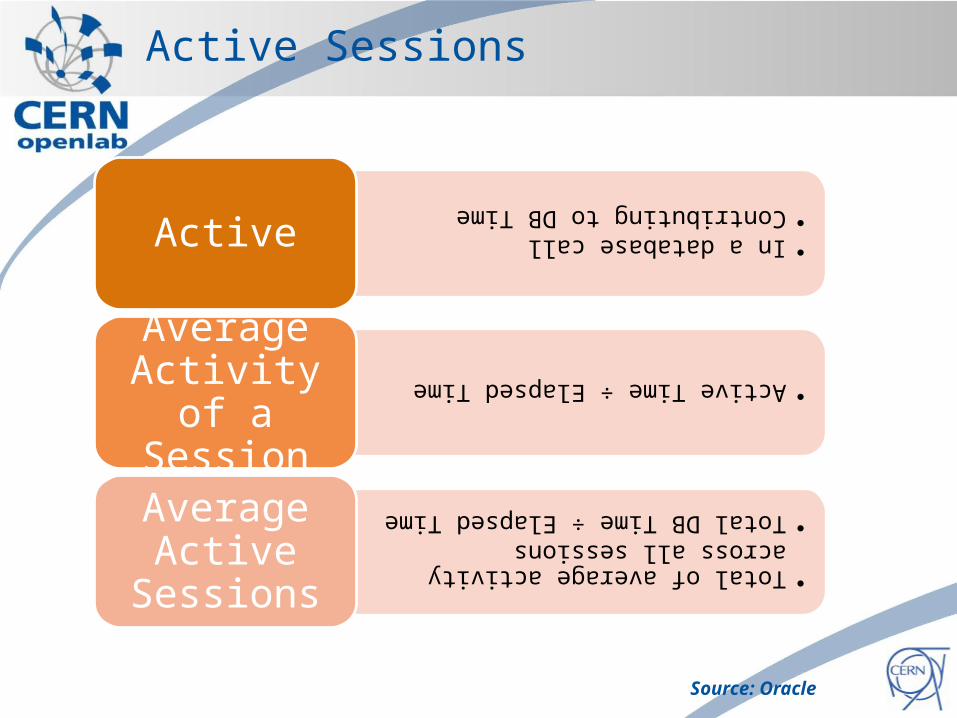
•In a database call
•Contributing to DB Time
Active•Acti
ve Time ÷ Elapsed Time
Average Activity of a
Session
•Total of average activity across all sessions
•Total DB Time ÷ Elapsed Time
Average Active
Sessions
Source: Oracle
Average Active Sessions
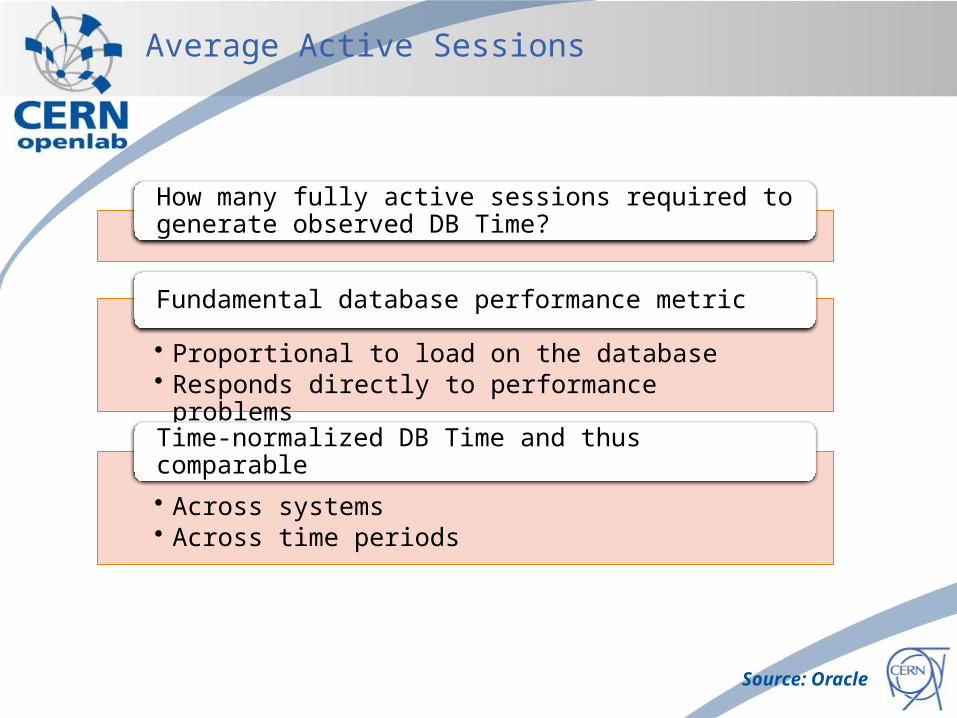
How many fully active sessions required to generate observed DB Time?
• Proportional to load on the database• Responds directly to performance problems
Fundamental database performance metric
• Across systems• Across time periods
Time-normalized DB Time and thus comparable
Source: Oracle
6
Performance Tuning in EM 11
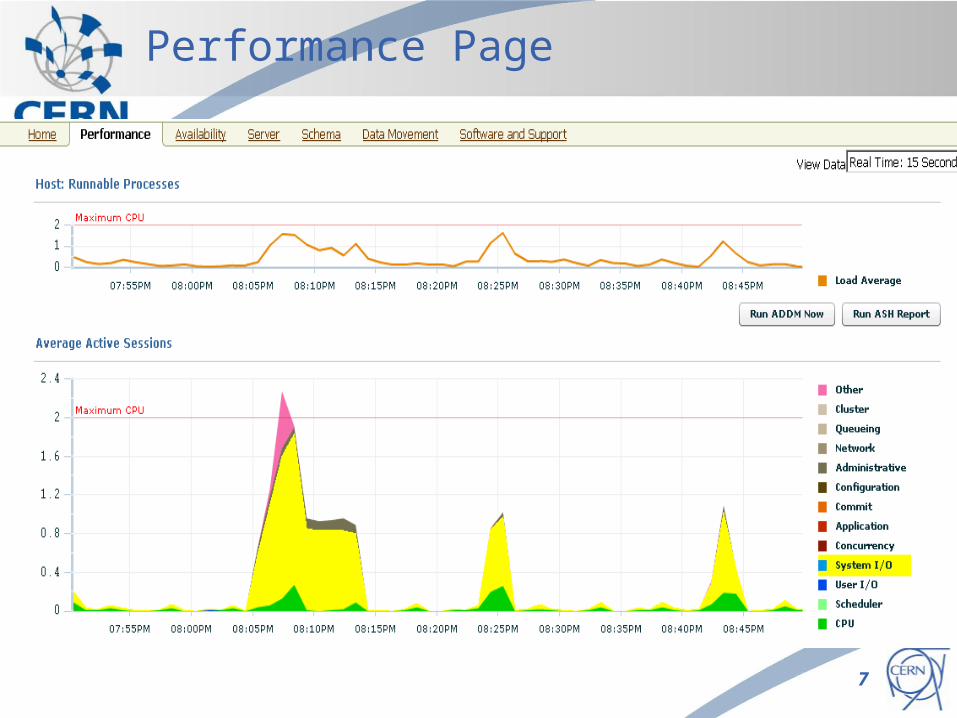
Performance Page
7
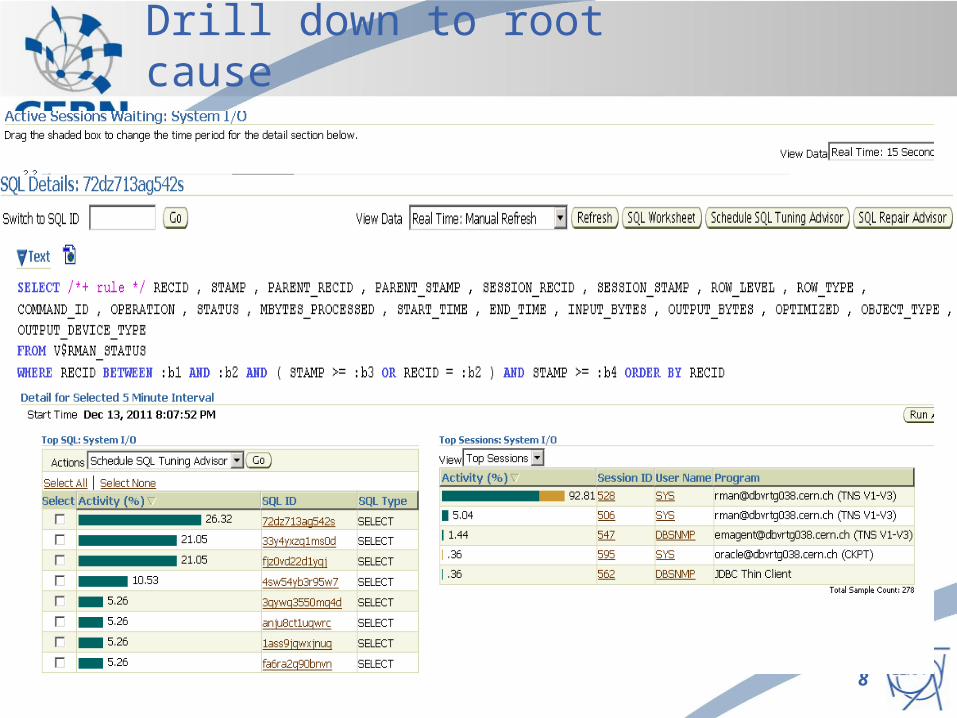
Drill down to root cause
8

9
Performance Tuning in EM 12
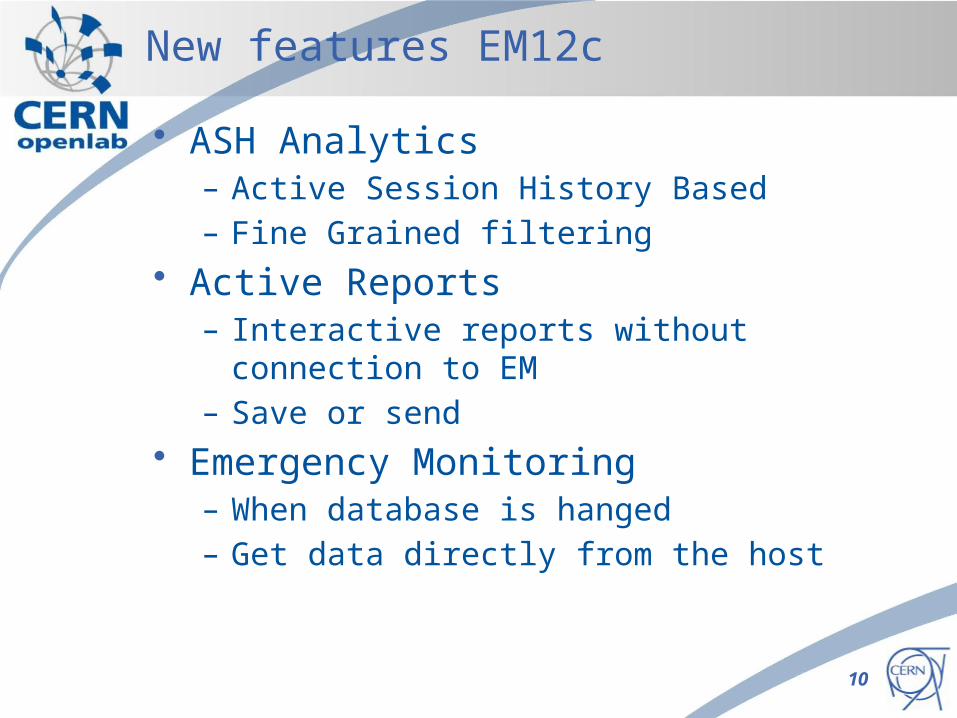
New features EM12c
• ASH Analytics– Active Session History Based– Fine Grained filtering
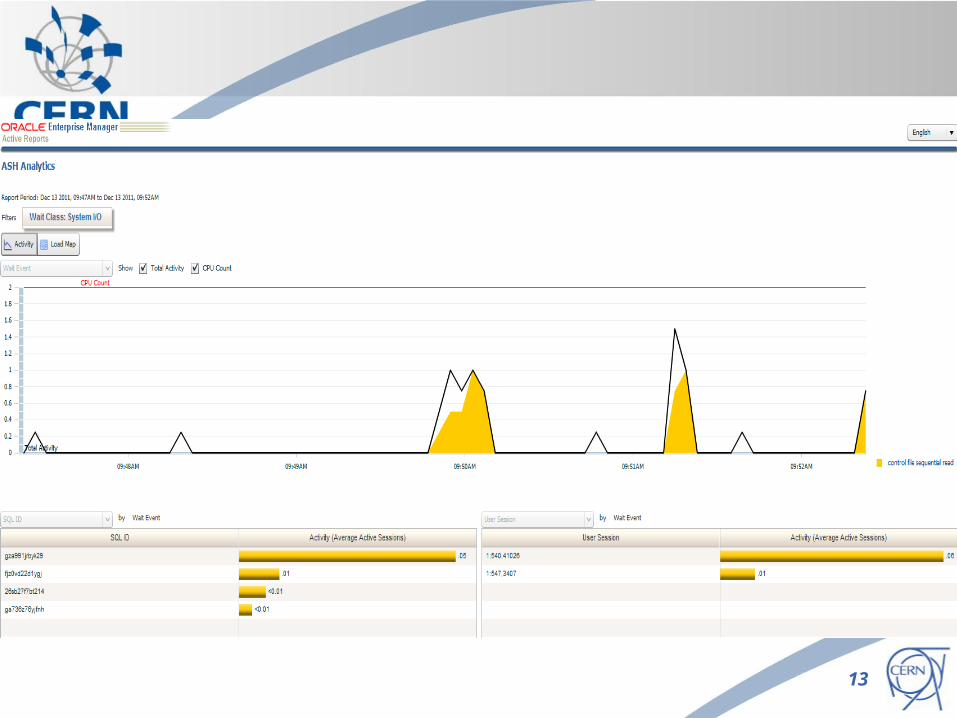
• Active Reports– Interactive reports without connection to EM– Save or send
• Emergency Monitoring– When database is hanged– Get data directly from the host
10
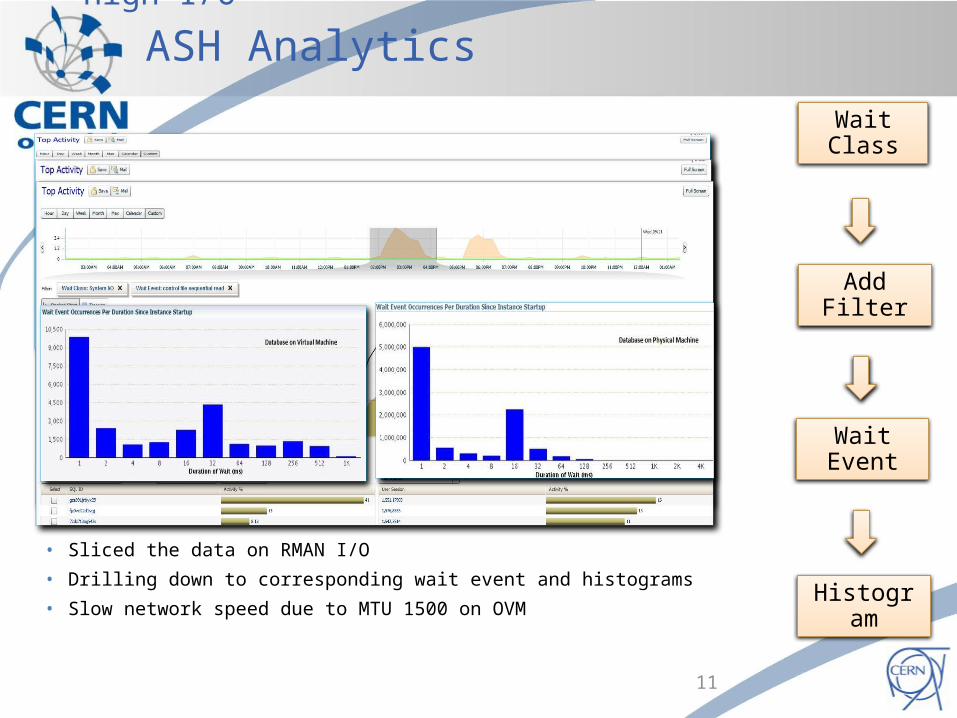
Case Study # 1: Slow response time due to high I/O
• Sliced the data on RMAN I/O
• Drilling down to corresponding wait event and histograms
• Slow network speed due to MTU 1500 on OVM
Wait Class
Add Filter
Histogram
Wait Event
11
ASH Analytics

12
13
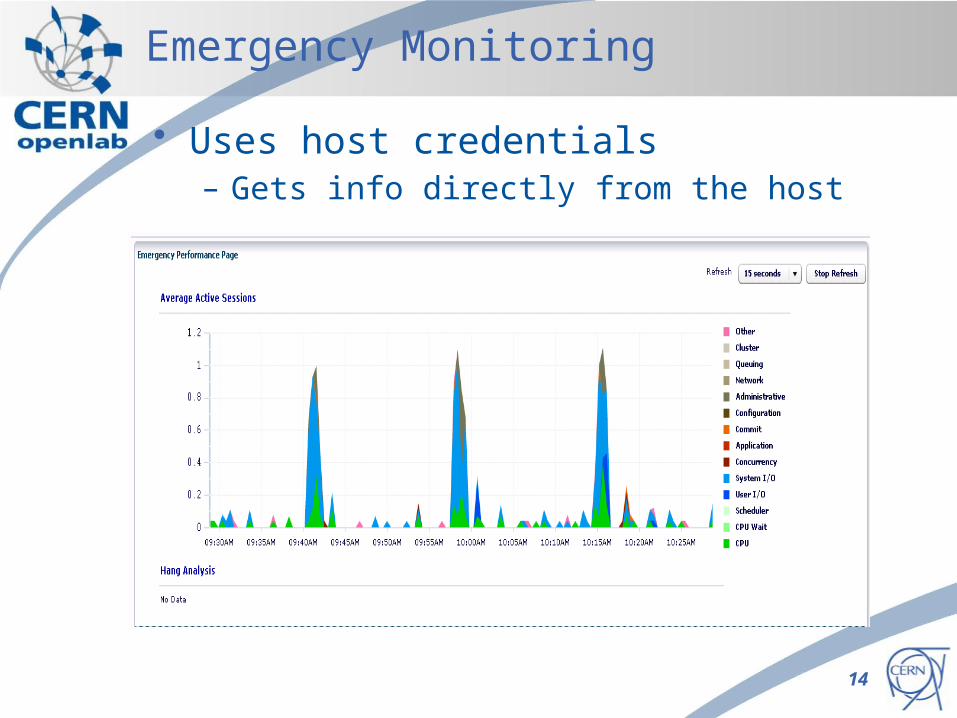
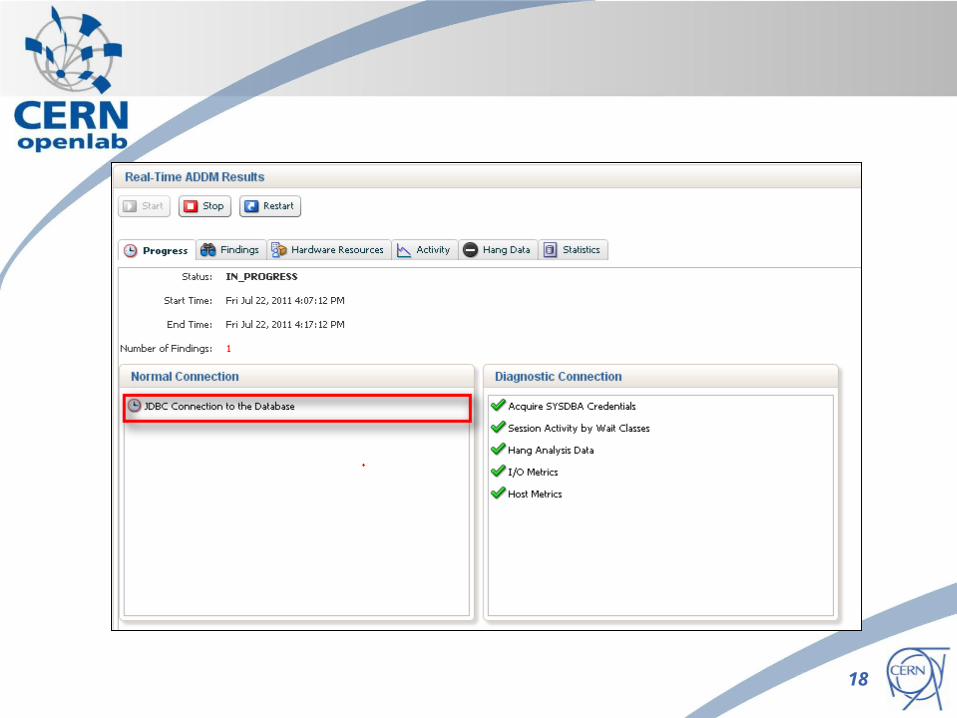
Emergency Monitoring
• Uses host credentials– Gets info directly from the host
14
Conclusions
• More performance features– Visualization on focus
• Greater level of flexibility– More filtering dimensions– Flexible duration timelines
• Emergency tools– Can be used when nothing else helps
• All user friendly
15
16
Questions?

17
Thank you!
18


![Oow Con9502 Upgrading Em12c Tips 1909479[1]](https://static.documents.pub/doc/80x56/55cf96df550346d0338e559b/oow-con9502-upgrading-em12c-tips-19094791.jpg)


