

Appendix C: Noise and Vibration Assessment
CAMP HALL RAIL PROJECT
Submitted to:
Palmetto Railways 540 East Bay Street
Charleston, South Carolina
25 July 2017

Page i
TABLE OF CONTENTS
PAGE
1.0 INTRODUCTION .............................................................................................................................. 1
1.1 Project Overview ................................................................................................................. 1 1.2 Noise and Vibration Overview ............................................................................................. 1 1.3 Regulatory Setting............................................................................................................... 2 1.4 Methodology ........................................................................................................................ 4 1.5 Project Traffic Description ................................................................................................... 5
2.0 INVENTORY OF SENSITIVE SITES ............................................................................................... 5
2.1 Study Area .......................................................................................................................... 5 2.2 Screening Areas .................................................................................................................. 6 2.3 Zoning Review .................................................................................................................... 7 2.4 Noise Evaluation Areas ....................................................................................................... 9 2.5 Noise Evaluation Criteria .................................................................................................. 15 2.6 Existing Noise Levels ........................................................................................................ 16 2.7 Vibration Evaluation Criteria ............................................................................................. 22
3.0 OPERATIONAL NOISE ................................................................................................................. 23
3.1 No Build Alternative........................................................................................................... 23 3.2 Project Alternative ............................................................................................................. 23
3.2.1 Estimated Noise Levels and Impact Assessment ................................................ 23 3.2.2 Impacts and Mitigations ....................................................................................... 29
4.0 OPERATIONAL VIBRATION ........................................................................................................ 29
4.1 Project Specific Criteria ..................................................................................................... 29 4.2 Estimated Vibration Levels and Impact Assessment ........................................................ 29
5.0 CONSTRUCTION ASSESSMENT ................................................................................................ 31
5.1 Introduction ....................................................................................................................... 31 5.2 Noise Assessment ............................................................................................................ 31 5.3 Vibration Assessment ....................................................................................................... 33
6.0 CLOSURE ...................................................................................................................................... 35
7.0 REFERENCES ............................................................................................................................... 36

Page ii
LIST OF TABLES Table 1-1: Regulations, Statutes and Guidelines for Noise and Vibration .................................................... 3 Table 1-2: General Assumptions for Project Traffic ...................................................................................... 5 Table 2-1: Receptors Identified During Screening ...................................................................................... 10 Table 3-1: Existing Noise Exposure Levels ................................................................................................ 17 Table 4-1: Ground Borne Vibrations (GBV) Impact and Ground-Borne Noise (GBN) Impact
Criteria for General Assessment ............................................................................................ 22 Table 3-2: General Noise Assessment ....................................................................................................... 24 Table 4-2: Project Specific GBV Impact and GBN Impact Criteria ............................................................. 29 Table 4-3: Project Specific GBV and GBN Impact Distances ..................................................................... 31 Table 5-1: Construction Noise General Assessment Criteria ..................................................................... 32 Table 5-2: Expected Equipment to be used During Construction (Noise Assessment) ............................. 32 Table 5-3: General Assessment of Construction Noise .............................................................................. 33 Table 5-3: Vibration Limits for Damage due to Construction Activities ....................................................... 34 Table 5-5: Expected Equipment to be used During Construction (Vibration Assessment) ........................ 34
LIST OF FIGURES Figure 1-1: Project Alignment ....................................................................................................................... 2 Figure 2-1: Study Area .................................................................................................................................. 6 Figure 2-2: Screening Distances ................................................................................................................... 7 Figure 2-3: Berkeley County (SC) Zoning Map ............................................................................................. 8 Figure 2-4: FTA Noise Impact Criteria ........................................................................................................ 16 Figure 4-1: Project Specific Generalized Ground Surface Vibrations ......................................................... 30 Figure 4-2: Project Specific Generalized Ground Bourne Noise ................................................................ 30
LIST OF APPENDICES
Appendix A: Figures

Page 1
1.0 INTRODUCTION
1.1 Project Overview
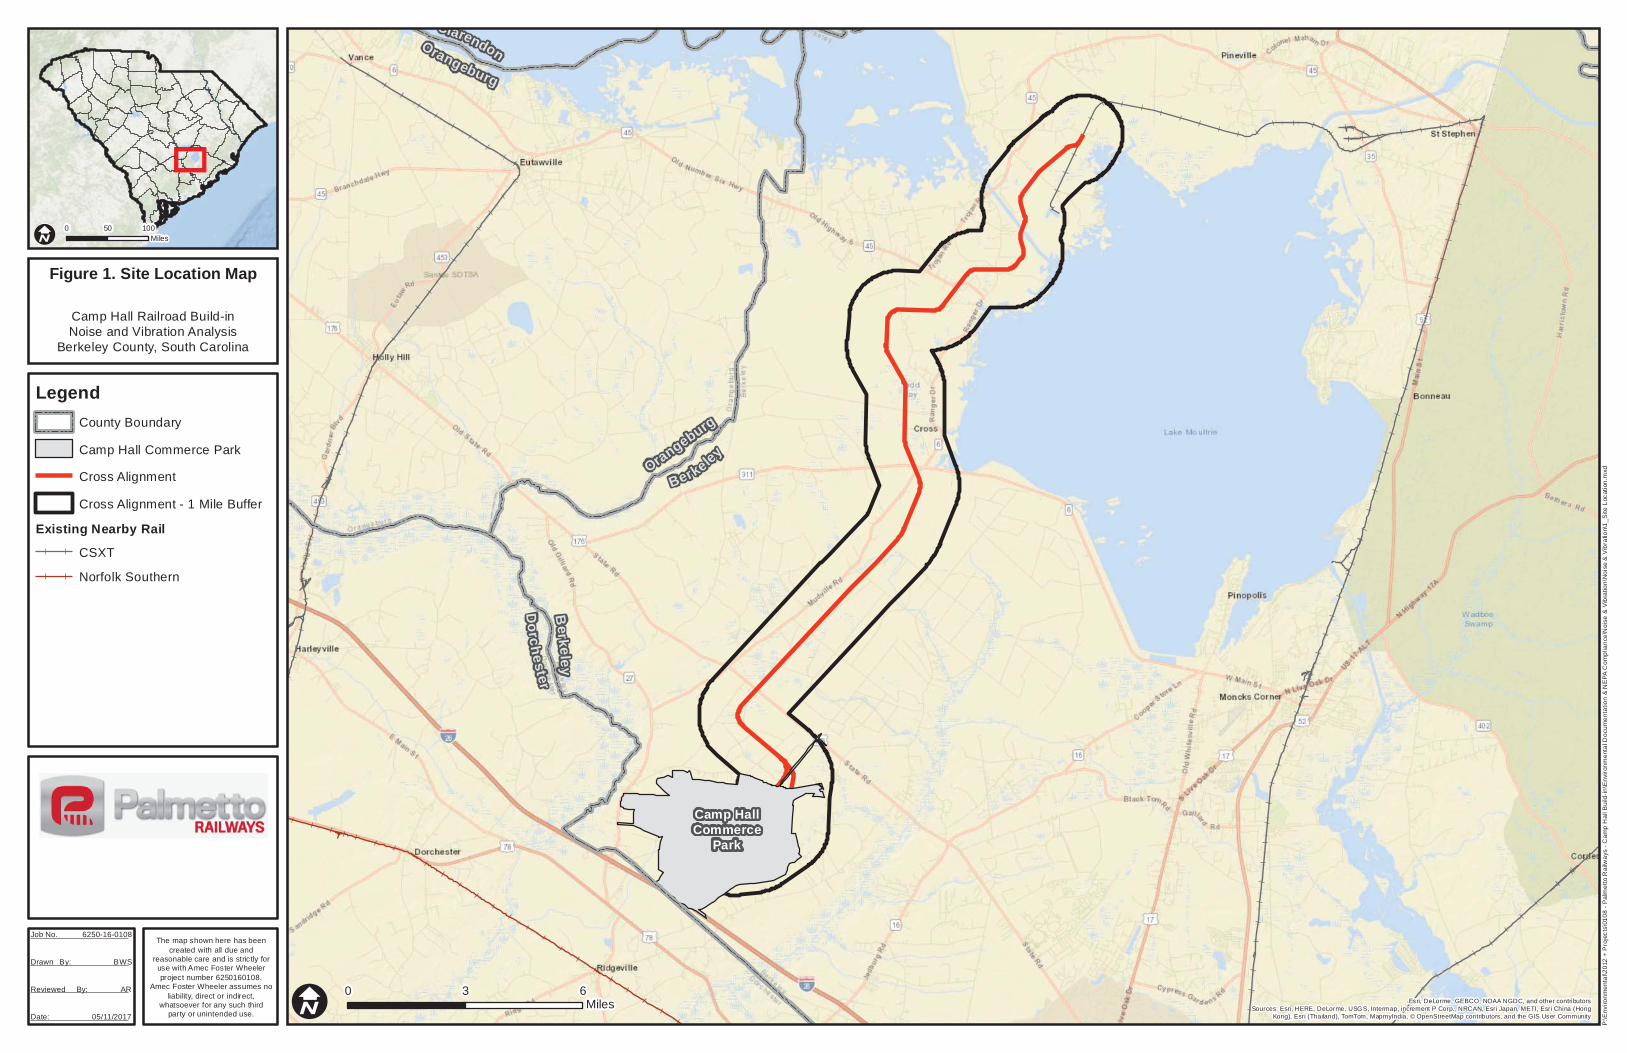
Palmetto Railways (PR) is planning for the development of an industrial rail line to serve the Camp Hall Commerce Park in Berkeley County, South Carolina. The new rail line will connect Camp Hall Commerce Park to existing railroad right-of-way, near the Santee Cooper Cross Generating Station in Berkeley County. The proposed rail corridor extends approximately 23 miles west to east between a point northeast out of Camp Hall Commerce Park to the existing railroad right-of-way near the Santee Cooper Cross Generating Station. 1.2 Noise and Vibration Overview
The purpose of this Report is to comply with NEPA requirements for the Proposed Action, on account of which PR proposes to operate 5 roundtrip freight trains per week from Camp Hall Commerce Park to existing railroad right-of-way, near the Santee Cooper Cross Generating Station in Berkeley County. Maximum operating speeds are projected to be 25 miles per hour (mph). Figure 1-1 shows the project area for this Proposed Action. Along the project area, there is one Build Alternative that will be evaluated. For this Proposed Action, construction impacts will be assessed.

Page 2
Figure 1-1: Project Alignment
Guidance has been developed by the Federal Transit Administration (FTA) published in “Transit Noise and Vibration Impact Assessment” [1] for conventional rail noise and vibration impact assessments, and FRA has developed complementary guidance for high-speed rail [2]. FTA transit noise and vibration impact assessment procedures are relied on by FRA in evaluating improvements to conventional passenger rail lines and stationary rail facilities and for assessments of horn noise. Since there are no existing federal guidance documents or methods specifically applicable for the evaluation of freight train traffic noise a supplemental freight rail analysis guideline was developed for the Chicago Rail Efficiency And Transportation Efficiency (CREATE) program [3] using the FTA procedures with certain modifications to allow for the evaluation of freight traffic. The Project team performed a Screening Noise Assessment using aspects of the General Noise Assessment and General Vibration Assessment in accordance with FTA guidelines as well the CREATE Program guidelines. Future anticipated rail traffic volumes were evaluated in order to assess the Project-related effects of airborne noise. 1.3 Regulatory Setting
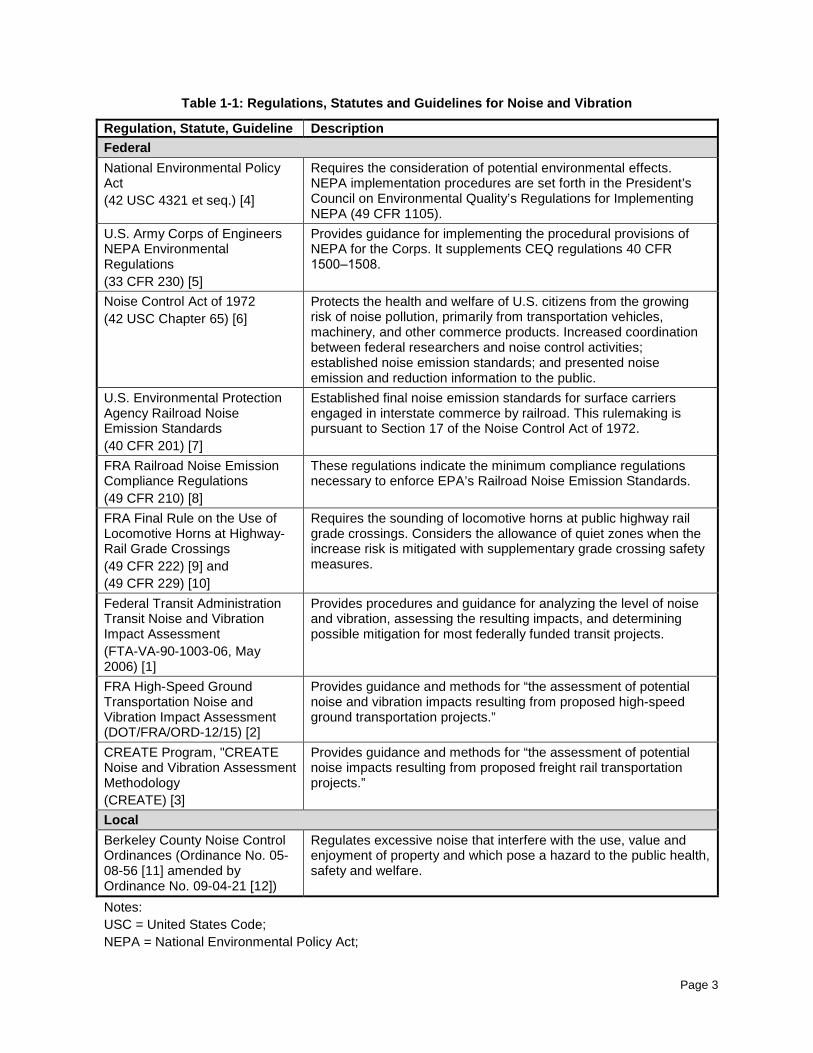
The jurisdictional authorities and corresponding regulations, statutes, and guidelines for determining potential impacts related to noise and vibration are summarized in Table 1-1.
Page 3
Table 1-1: Regulations, Statutes and Guidelines for Noise and Vibration
Regulation, Statute, Guideline Description Federal National Environmental Policy Act (42 USC 4321 et seq.) [4]
Requires the consideration of potential environmental effects. NEPA implementation procedures are set forth in the President’s Council on Environmental Quality’s Regulations for Implementing NEPA (49 CFR 1105).
U.S. Army Corps of Engineers NEPA Environmental Regulations (33 CFR 230) [5]
Provides guidance for implementing the procedural provisions of NEPA for the Corps. It supplements CEQ regulations 40 CFR 1500‒1508.
Noise Control Act of 1972 (42 USC Chapter 65) [6]
Protects the health and welfare of U.S. citizens from the growing risk of noise pollution, primarily from transportation vehicles, machinery, and other commerce products. Increased coordination between federal researchers and noise control activities; established noise emission standards; and presented noise emission and reduction information to the public.
U.S. Environmental Protection Agency Railroad Noise Emission Standards (40 CFR 201) [7]
Established final noise emission standards for surface carriers engaged in interstate commerce by railroad. This rulemaking is pursuant to Section 17 of the Noise Control Act of 1972.
FRA Railroad Noise Emission Compliance Regulations (49 CFR 210) [8]
These regulations indicate the minimum compliance regulations necessary to enforce EPA’s Railroad Noise Emission Standards.
FRA Final Rule on the Use of Locomotive Horns at Highway-Rail Grade Crossings (49 CFR 222) [9] and (49 CFR 229) [10]
Requires the sounding of locomotive horns at public highway rail grade crossings. Considers the allowance of quiet zones when the increase risk is mitigated with supplementary grade crossing safety measures.
Federal Transit Administration Transit Noise and Vibration Impact Assessment (FTA-VA-90-1003-06, May 2006) [1]
Provides procedures and guidance for analyzing the level of noise and vibration, assessing the resulting impacts, and determining possible mitigation for most federally funded transit projects.
FRA High-Speed Ground Transportation Noise and Vibration Impact Assessment (DOT/FRA/ORD-12/15) [2]
Provides guidance and methods for “the assessment of potential noise and vibration impacts resulting from proposed high-speed ground transportation projects.”
CREATE Program, "CREATE Noise and Vibration Assessment Methodology (CREATE) [3]
Provides guidance and methods for “the assessment of potential noise impacts resulting from proposed freight rail transportation projects.”
Local Berkeley County Noise Control Ordinances (Ordinance No. 05-08-56 [11] amended by Ordinance No. 09-04-21 [12])
Regulates excessive noise that interfere with the use, value and enjoyment of property and which pose a hazard to the public health, safety and welfare.
Notes: USC = United States Code; NEPA = National Environmental Policy Act;
Page 4
Regulation, Statute, Guideline Description CFR = Code of Federal Regulations; FTA = Federal Transit Administration; FRA = Federal Railroad Administration;
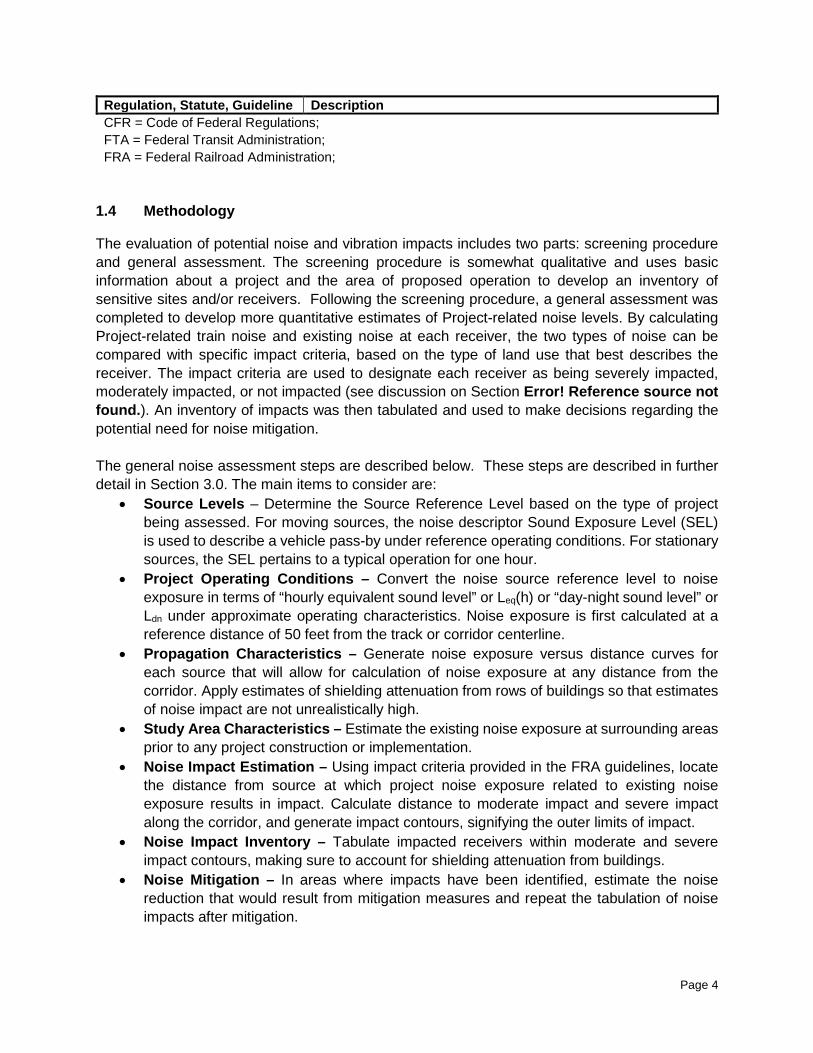
1.4 Methodology
The evaluation of potential noise and vibration impacts includes two parts: screening procedure and general assessment. The screening procedure is somewhat qualitative and uses basic information about a project and the area of proposed operation to develop an inventory of sensitive sites and/or receivers. Following the screening procedure, a general assessment was completed to develop more quantitative estimates of Project-related noise levels. By calculating Project-related train noise and existing noise at each receiver, the two types of noise can be compared with specific impact criteria, based on the type of land use that best describes the receiver. The impact criteria are used to designate each receiver as being severely impacted, moderately impacted, or not impacted (see discussion on Section Error! Reference source not found.). An inventory of impacts was then tabulated and used to make decisions regarding the potential need for noise mitigation. The general noise assessment steps are described below. These steps are described in further detail in Section 3.0. The main items to consider are:
• Source Levels – Determine the Source Reference Level based on the type of project being assessed. For moving sources, the noise descriptor Sound Exposure Level (SEL) is used to describe a vehicle pass-by under reference operating conditions. For stationary sources, the SEL pertains to a typical operation for one hour.
• Project Operating Conditions – Convert the noise source reference level to noise exposure in terms of “hourly equivalent sound level” or Leq(h) or “day-night sound level” or Ldn under approximate operating characteristics. Noise exposure is first calculated at a reference distance of 50 feet from the track or corridor centerline.
• Propagation Characteristics – Generate noise exposure versus distance curves for each source that will allow for calculation of noise exposure at any distance from the corridor. Apply estimates of shielding attenuation from rows of buildings so that estimates of noise impact are not unrealistically high.
• Study Area Characteristics – Estimate the existing noise exposure at surrounding areas prior to any project construction or implementation.
• Noise Impact Estimation – Using impact criteria provided in the FRA guidelines, locate the distance from source at which project noise exposure related to existing noise exposure results in impact. Calculate distance to moderate impact and severe impact along the corridor, and generate impact contours, signifying the outer limits of impact.
• Noise Impact Inventory – Tabulate impacted receivers within moderate and severe impact contours, making sure to account for shielding attenuation from buildings.
• Noise Mitigation – In areas where impacts have been identified, estimate the noise reduction that would result from mitigation measures and repeat the tabulation of noise impacts after mitigation.

Page 5
The FTA model has been adopted by the FRA, however the FTA model – which can be found on the FTA Noise Impact Assessment Spreadsheet (FTA Spreadsheet [13] 1), is directly applicable to conventional rail noise. A supplemental freight rail analysis spreadsheet (CREATE Spreadsheet [14] [15]2) tool was developed for the Chicago Rail Efficiency And Transportation Efficiency (CREATE) program using the FTA Manual model procedures [3]. This tool was used for the purposes of the general assessment undertaken for this project. 1.5 Project Traffic Description
The Proposed Project will be used solely for freight traffic. The current traffic scenario is identified in Table 1-2 which reflects the basic assumptions for the impact assessment.
Table 1-2: General Assumptions for Project Traffic
Line Assumption Value Notes
1 Total Traffic Per Day 5
7� (0.71)
Corresponds to a total of 5 trains per week
1.a Average Hourly Daytime Traffic (7AM – 10PM)
2.57� × 1
15� (0.024)
From Line 1, considered that half of the traffic will occur during day-time
1.b Average Hourly Nighttime Traffic (10PM – 7AM)
2.57� × 1
9� (0.040)
From Line 1, considered that half of the traffic will occur during night-time
2 Typical Train make-up 2.a Number of Locomotives 2 Per Train 2.b Number of Cars 30 Per Train 2.c Length of Car 76 ft - 2.d Speed 25 mph -
2.0 INVENTORY OF SENSITIVE SITES
2.1 Study Area
The study area for direct impacts is within 1 mile of the project centerline. Figure 2-1 illustrates the study area.
1 Federal Transit Administration Noise Impact Assessment Spreadsheet. https://www.transit.dot.gov/regulations-and-guidance/environmental-programs/noise-impact-assessment-spreadsheet 2 CREATE Freight Noise and Vibration Model Spreadsheet. https://www.fra.dot.gov/eLib/Details/L03727

Page 6
Figure 2-1: Study Area
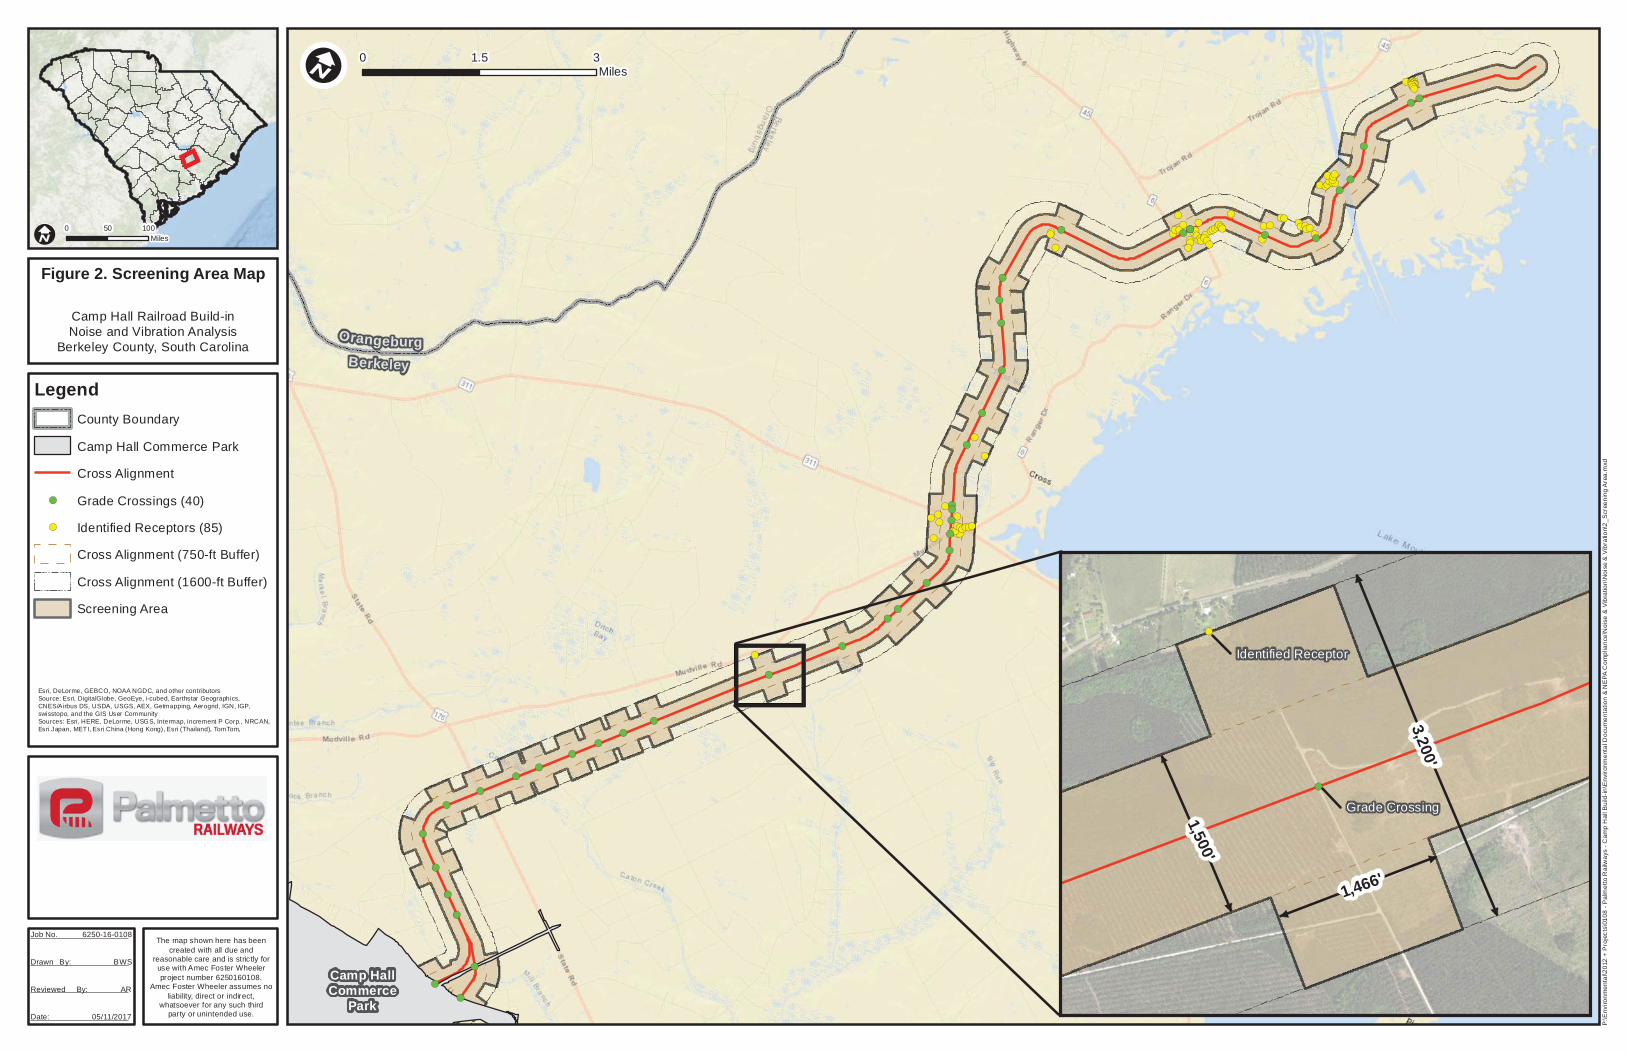
2.2 Screening Areas
Screening distances were developed to identify the potential limits of noise impact from freight and passenger activity. The screening distances were based on the FTA Manual3. It must be noted that the FTA Manual does not provide a direct recommendation for the screening distance for a project with similar traffic as the Project under assessment. As per FTA manual the screening distances are:
• For the project alignment: 750 ft • In proximity of a crossing where train mounted horns will be used: 1,600 ft
The definition of proximity to a crossing is found in the FRA regulations4. The locomotive horn shall begin to be sounded at least 15 seconds, but no more than 20 seconds, before the locomotive enters the crossing. With a project speed of 25 mph, this results in a distance of 733 ft from all public crossings. The screening distances is presented in Figure 2-2.
3 FTA Manual Table 4-1 and 4-2. 4 49 CFR 222, § 222.21 (2)

Page 7
Figure 2-2: Screening Distances
2.3 Zoning Review
A review of the Berkeley County and Municipal Zoning Classifications was completed. Figure 2-3 shows the Berkeley County Zoning Map5.
5 Berkeley County Zoning Map, updated on February 14, 2014, as retrieved from http://gis.berkeleycountysc.gov/PDF/ZONING_OVERALL.pdf

Page 8
Figure 2-3: Berkeley County (SC) Zoning Map
The Project alignment passes through an area mainly designated as FLEX1. As per the Code of Ordinances, Berkeley County, South Carolina (Berkeley County Code) [16], FLEX1 is an Agricultural District. One of the permitted used of this zone is for Residential Uses and therefore individual or clusters of residential buildings may be found. Near the intersection of the Project alignment and Highway 6, the alignment will cross a zoning classified as RNC. As per Berkeley
Page 9
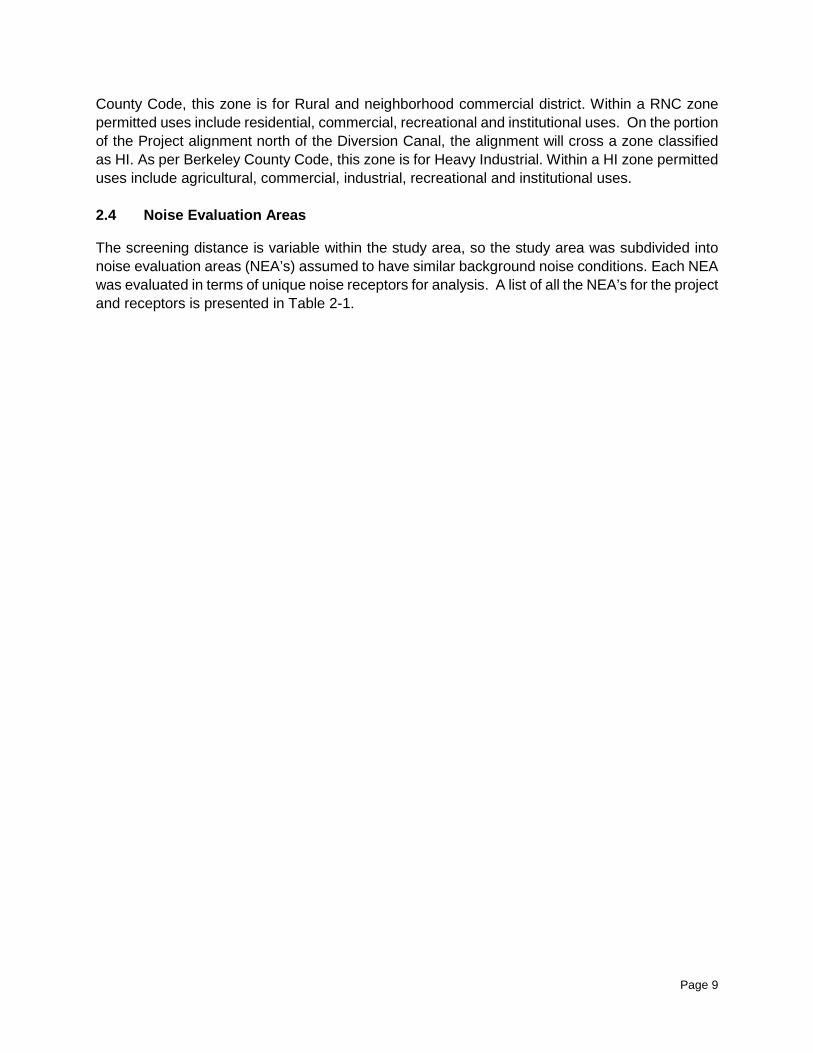
County Code, this zone is for Rural and neighborhood commercial district. Within a RNC zone permitted uses include residential, commercial, recreational and institutional uses. On the portion of the Project alignment north of the Diversion Canal, the alignment will cross a zone classified as HI. As per Berkeley County Code, this zone is for Heavy Industrial. Within a HI zone permitted uses include agricultural, commercial, industrial, recreational and institutional uses. 2.4 Noise Evaluation Areas
The screening distance is variable within the study area, so the study area was subdivided into noise evaluation areas (NEA’s) assumed to have similar background noise conditions. Each NEA was evaluated in terms of unique noise receptors for analysis. A list of all the NEA’s for the project and receptors is presented in Table 2-1.

Page 10
Table 2-1: Receptors Identified During Screening
(A) (B) (C) (D) (E) (F) (G) (H)
NEA Receptor Address Coordinates
Existing Land Use
Type of Structure
Distance to Alignment
[ft] Longitude Latitude
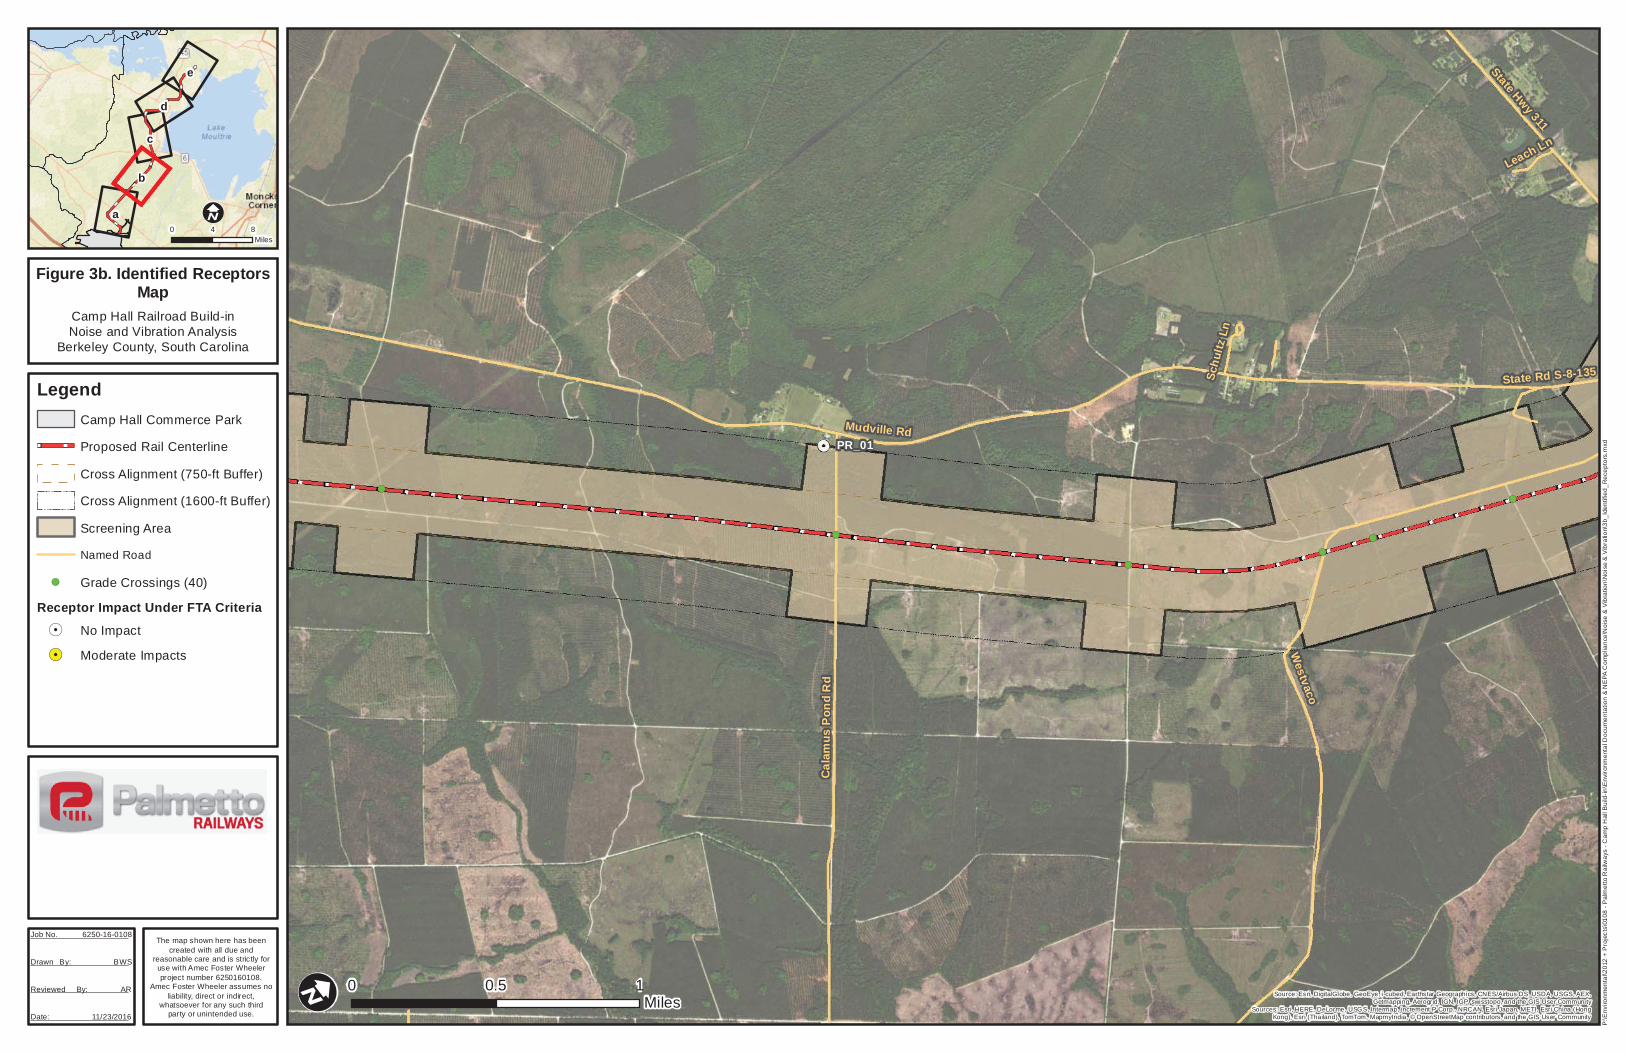
NEA_01 PR_01 2341 Mudville Road -80.20154756 33.24418234 FLEX1 Residential 1600
NEA_02 PR_02 2924 Mudville Road -80.17602582 33.27767545 FLEX1 Residential 1200
NEA_03 PR_03a 2991 Mudville Road -80.17219556 33.28018193 FLEX1 Residential 450
PR_03b n/a -80.17193846 33.28002533 FLEX1 Residential 660
NEA_04
PR_04a n/a -80.17286622 33.28034991 FLEX1 Residential 100
PR_04b 2982 Mudville Road -80.17286622 33.28034991 FLEX1 Residential 180
PR_04c n/a -80.17286622 33.28034991 FLEX1 Residential 310
NEA_05
PR_05a n/a -80.17203945 33.28165162 FLEX1 Residential 523
PR_05b n/a -80.17203945 33.28165162 FLEX1 Residential 690
PR_05c n/a -80.17203945 33.28165162 FLEX1 Residential 915
NEA_06
PR_06a 1030 Highway 311 -80.17038301 33.28232898 FLEX1 Residential 1000
PR_06b n/a -80.17038301 33.28232898 FLEX1 Residential 1215
PR_06c 1015 Ranger Drive -80.17038301 33.28232898 FLEX1 Residential 1415
NEA_07 PR_07 n/a -80.17240948 33.28309182 FLEX1 Residential 415
NEA_08
PR_08a Red Ash Lane -80.17657933 33.28122901 FLEX1 Residential 790
PR_08b 1119 Highway 311 -80.17657933 33.28122901 FLEX1 Residential 915
PR_08c J.L. Williams House -80.1777997 33.28113809 FLEX1 Historical 1390
NEA_09 PR_09 1126 Highway 311 -80.1769639 33.28415208 FLEX1 Residential 460
NEA_10 PR_10 276 George Wigfall Road -80.17321196 33.29620146 FLEX1 Residential 1450
NEA_11 PR_11 Dora Way -80.17697782 33.29772158 FLEX1 Residential 250
NEA_12 PR_12a n/a -80.1797322 33.33891432 FLEX1 Residential 430

Page 11
(A) (B) (C) (D) (E) (F) (G) (H)
NEA Receptor Address Coordinates
Existing Land Use
Type of Structure
Distance to Alignment
[ft] Longitude Latitude
PR_12b n/a -80.1797322 33.33891432 FLEX1 Residential 590
NEA_13 PR_13 n/a -80.17750646 33.33684509 FLEX1 Residential 1285
NEA_14
PR_14a n/a -80.15531755 33.34896562 FLEX1 Residential 260
PR_14b n/a -80.15531755 33.34896562 FLEX1 Residential 450
PR_14c n/a -80.15531755 33.34896562 RNC Residential 295
PR_14d n/a -80.15491699 33.34986539 FLEX1 Residential 485
NEA_15 PR_15 Abraham Lane -80.15585582 33.35062424 FLEX1 Residential 1220
NEA_16
PR_16a Cherokee Path Lane -80.15166305 33.34746302 FLEX1 Residential 630
PR_16b Cherokee Path Lane -80.15166305 33.34746302 FLEX1 Residential 800
PR_16c Cherokee Path Lane -80.15166305 33.34746302 FLEX1 Residential 1060
NEA_17
PR_17a n/a -80.15135013 33.34973389 FLEX1 Residential 310
PR_17b 1138 Old Highway 6 -80.15135013 33.34973389 RNC Residential 245
PR_17c n/a -80.15135013 33.34973389 FLEX1 Residential 605
NEA_18
PR_18a n/a -80.14971915 33.34898574 FLEX1 Residential 930
PR_18b n/a -80.14971915 33.34898574 FLEX1 Residential 867
PR_18c n/a -80.14971915 33.34898574 FLEX1 Residential 1045
NEA_19
PR_19a n/a -80.14853795 33.34930919 FLEX1 Residential 885
PR_19b 245 Harley Circle -80.14853795 33.34930919 FLEX1 Residential 845
PR_19c n/a -80.14853795 33.34930919 FLEX1 Residential 1015
PR_19d Jerusalem Church -80.14853795 33.34930919 FLEX1 Institutional 1240
PR_19e n/a -80.14853795 33.34930919 FLEX1 Residential 1550
NEA_20 PR_20 n/a -80.1517578 33.35206979 FLEX1 Residential 135
NEA_21 PR_21a n/a -80.1476464 33.35198334 FLEX1 Residential 745

Page 12
(A) (B) (C) (D) (E) (F) (G) (H)
NEA Receptor Address Coordinates
Existing Land Use
Type of Structure
Distance to Alignment
[ft] Longitude Latitude
PR_21b n/a -80.1476464 33.35198334 FLEX1 Residential 755
PR_21c n/a -80.1476464 33.35198334 FLEX1 Residential 735
PR_21d n/a -80.147611 33.35210629 FLEX1 Residential 625
PR_21e n/a -80.14750468 33.35210527 FLEX1 Residential 475
PR_21f n/a -80.14750468 33.35210527 FLEX1 Residential 640
PR_21g n/a -80.14683957 33.35251171 FLEX1 Residential 735
NEA_22 PR_22 n/a -80.14564716 33.35576468 FLEX1 Residential 388
NEA_23 PR_23a n/a -80.1384932 33.35667831 FLEX1 Residential 530
PR_23b n/a -80.13716901 33.3569272 FLEX1 Residential 725
NEA_24 PR_24a 2249 Ranger Drive -80.13711175 33.35401177 FLEX1 Residential 195
PR_24b 2243 Ranger Drive -80.13711175 33.35401177 FLEX1 Residential 360
NEA_25 PR_25a n/a -80.13554441 33.35889405 FLEX1 Residential 1507
PR_25b n/a -80.13554441 33.35889405 FLEX1 Residential 1570
NEA_26
PR_26a n/a -80.13058773 33.35935441 FLEX1 Residential 1404
PR_26b n/a -80.13058773 33.35935441 FLEX1 Residential 1130
PR_26c n/a -80.13058773 33.35935441 FLEX1 Residential 1055
PR_26d n/a -80.12868491 33.35913038 FLEX1 Residential 802
PR_26e n/a -80.12868491 33.35913038 FLEX1 Residential 790
PR_26f n/a -80.12669654 33.35881665 FLEX1 Residential 266
NEA_27
PR_27a n/a -80.12884593 33.36820866 FLEX1 Residential 1260
PR_27b n/a -80.12918121 33.36803004 FLEX1 Residential 905
PR_27c n/a -80.12922861 33.36863191 FLEX1 Residential 876
PR_27d n/a -80.12922861 33.36863191 FLEX1 Residential 915

Page 13
(A) (B) (C) (D) (E) (F) (G) (H)
NEA Receptor Address Coordinates
Existing Land Use
Type of Structure
Distance to Alignment
[ft] Longitude Latitude
PR_27e n/a -80.12859147 33.36933671 FLEX1 Residential 679
PR_27f n/a -80.12859147 33.36933671 FLEX1 Residential 561
PR_27g n/a -80.12859147 33.36933671 FLEX1 Residential 815
PR_27h n/a -80.12859147 33.36933671 FLEX1 Residential 1288
PR_27i n/a -80.12828963 33.37024506 FLEX1 Residential 950
PR_27j n/a -80.12828963 33.37024506 FLEX1 Residential 1028
NEA_28
PR_28a n/a -80.12118024 33.39158984 FLEX1 Residential 1454
PR_28b n/a -80.12146512 33.39216728 FLEX1 Residential 1234
PR_28c n/a -80.12146512 33.39216728 FLEX1 Residential 1260
PR_28d n/a -80.12146512 33.39216728 FLEX1 Residential 1260
PR_28e n/a -80.12146512 33.39216728 FLEX1 Residential 1170
PR_28f n/a -80.12133495 33.39206548 FLEX1 Residential 1130
PR_28g n/a -80.121268 33.39189461 FLEX1 Residential 1005
PR_28h n/a -80.121268 33.39189461 FLEX1 Residential 995
PR_28i n/a -80.121268 33.39189461 FLEX1 Residential 965
PR_28j n/a -80.121268 33.39189461 FLEX1 Residential 1050
PR_28k n/a -80.121268 33.39189461 FLEX1 Residential 900
PR_28l n/a -80.12082629 33.3914237 FLEX1 Residential 751 Table Notes:
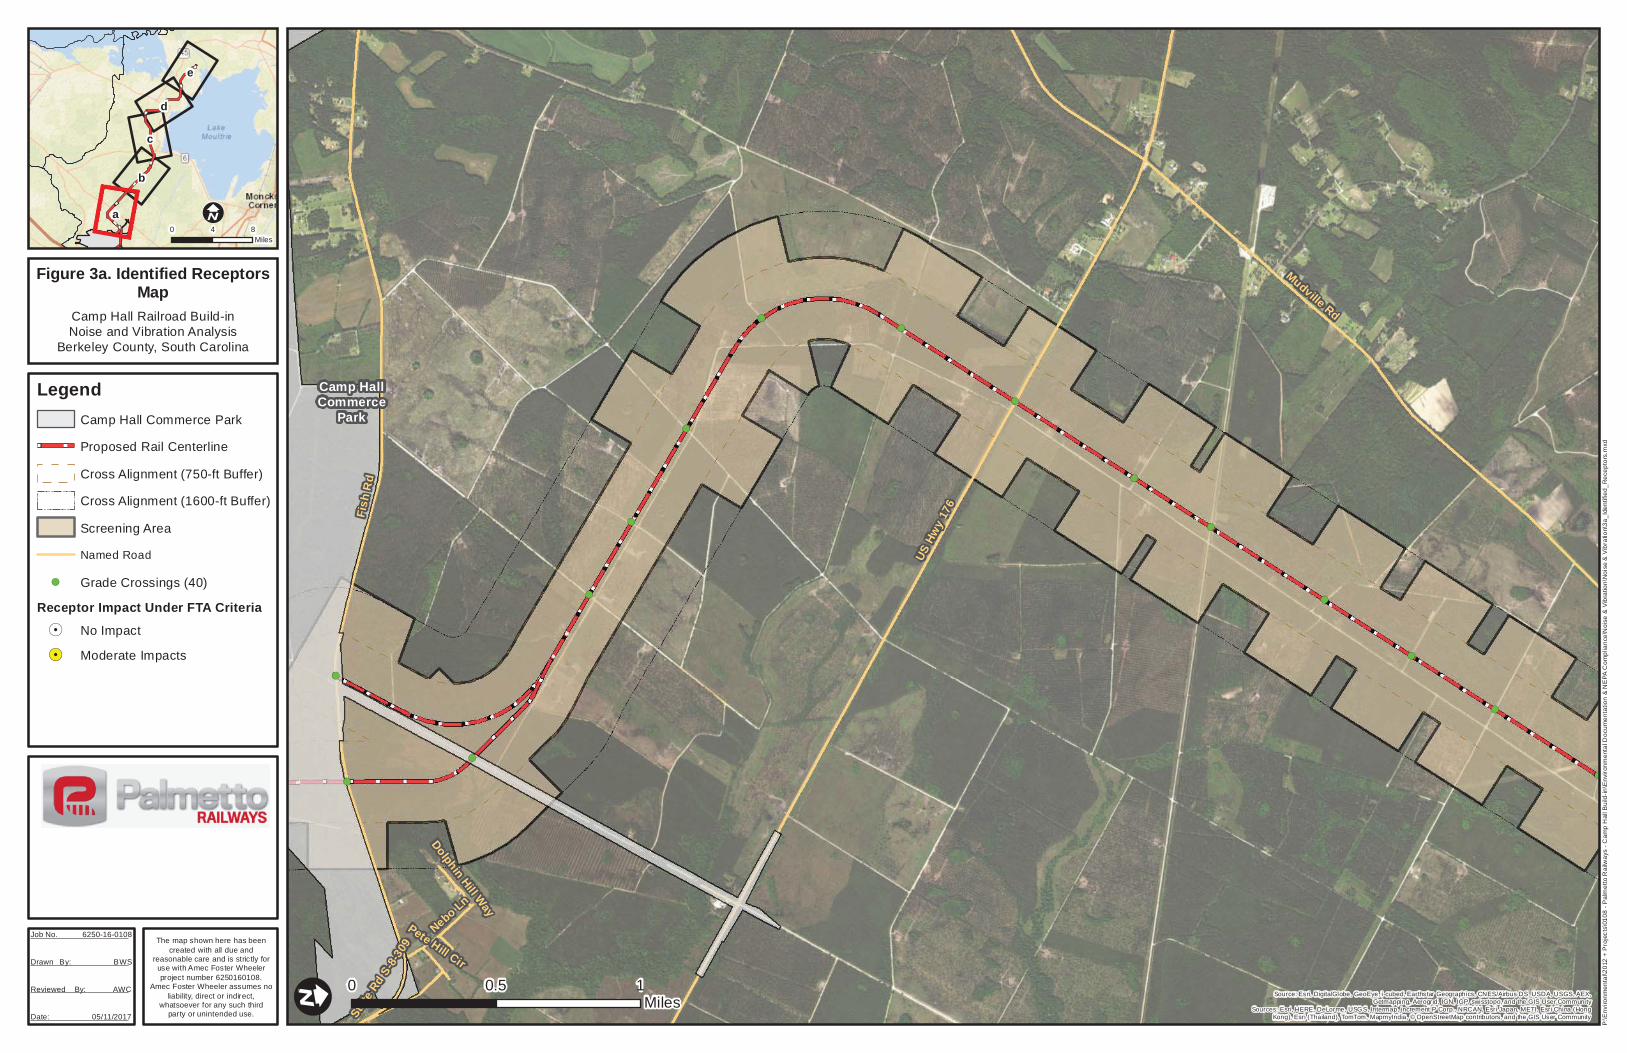
(A) NEA – Noise Evaluation Area (B) Receptor – Receptor labeling used in Figure 3a to 3e (C) Address – Receptor address (if available) (D) Longitude – Receptor longitude (E) Latitude – Receptor latitude (F) Existing Land Use – Land use as identified in Local Planning

Page 14
(G) Type of Structure – Type of structure identified as part of the sceening (H) Distance to Track Alignment [ft] – Measured distance from receptor location to track alignment.

Project No.: 6250-160-108 Page 15
MIS-COM-TMP-007 r1
2.5 Noise Evaluation Criteria
The FTA and FRA established similar procedures and guidelines for assessing train noise. Train noise is generally expressed in terms of A-weighted sound pressure level as a function of time. The time descriptor used in this train noise assessment is the day-night noise level (Ldn). The Ldn can be thought of as a 24-hour average noise level that penalizes noise events that happen at night (10pm to 07am) because most people are more annoyed by noise at nighttime than during the daytime. This noise assessment assessed Project-related noise at land uses where overnight sleep occurs (primarily residences); this is consistent with FRA guidance. Residences were identified by visual inspection of digital aerial photographs; no site surveys were performed. The impact assessment, discussed later in this document, uses the term receptors to refer to land uses where overnight sleep occurs; each noise impact identified later in this report represents a single receptor, or land use where overnight sleep occurs. The FTA noise impact criteria6 are defined by two curves, representing severe and moderate noise impacts, which are defined as:
• Severe Impact. A significant percentage of people are highly annoyed by noise in this range. Noise mitigation would normally be specified for severe impact areas unless it is not feasible or reasonable (unless there is no practical method of mitigating the impact).
• Moderate Impact. In this range, other project-specific factors are considered to determine the magnitude of the impact and the need for mitigation. Other factors include the predicted increase over existing noise levels, the types and number of noise-sensitive land uses affected, existing outdoor-indoor sound insulation, and the cost-effectiveness of mitigating noise to more acceptable levels.
Each of these curves are expressed for the three following land use categories defined in the FTA Manual7:
• Category 1: Tracts of land where quiet is an essential element for their intended purpose. This category includes tracts of land set aside for serenity and quiet and such land uses as outdoor concert pavilions, as well as National Historical Landmarks with significant outdoor use.
• Category 2: Residential – This category covers all residential land uses and any buildings where people sleep, such as hotels and hospitals.
• Category 3: Institutional – This category includes schools, parks, libraries, cemeteries, and churches where it is important to avoid interference with such activities as speech, meditation and concentration on reading.
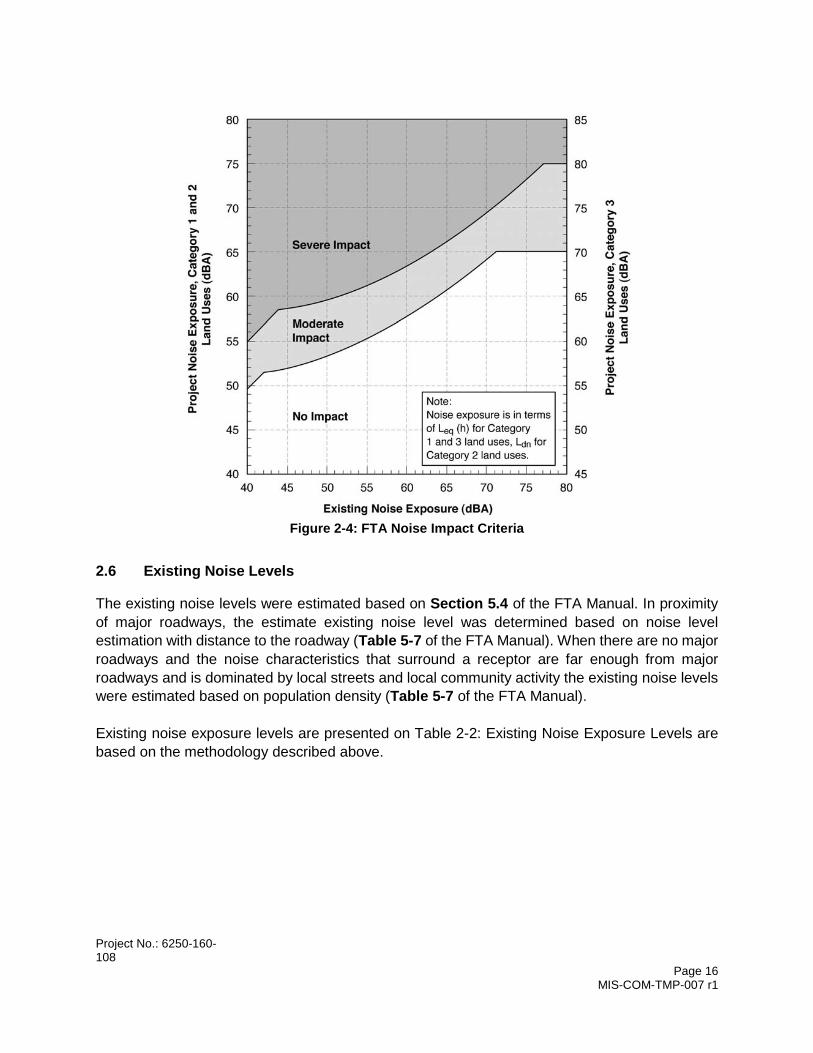
Figure 2-4 illustrates the FTA noise impact criteria, these are based on existing noise exposure and project-related noise exposure. FTA noise impact thresholds vary with existing noise levels and with the land time use.
6 Noise impact criteria is identified in Figure 3-1 from the FTA Manual 7 Land use categories are identified in Table 3-2 from the FTA Manual
Project No.: 6250-160-108 Page 16
MIS-COM-TMP-007 r1
Figure 2-4: FTA Noise Impact Criteria
2.6 Existing Noise Levels
The existing noise levels were estimated based on Section 5.4 of the FTA Manual. In proximity of major roadways, the estimate existing noise level was determined based on noise level estimation with distance to the roadway (Table 5-7 of the FTA Manual). When there are no major roadways and the noise characteristics that surround a receptor are far enough from major roadways and is dominated by local streets and local community activity the existing noise levels were estimated based on population density (Table 5-7 of the FTA Manual). Existing noise exposure levels are presented on Table 2-2: Existing Noise Exposure Levels are based on the methodology described above.

Project No.: 6250-160-108 Page 17 MIS-COM-TMP-007 r1
Table 2-2: Existing Noise Exposure Levels
(A) (B) (C) (D) (E) (F) (G) (H) (I) (J) (K)
Receptor Near Major
Roadway Roadway
Distance [ft]
Census Existing Noise Exposure (FTA Tbl 5-7)
County Population
Density [ppl/sq-mi]
Based on… Leq,D Leq,E Leq,N Ldn
PR_01 No n/a n/a Berkeley 122 Population Density 40 35 30 40
PR_02 No n/a n/a Berkeley 122 Other Roadway 55 50 45 55
PR_03a No n/a n/a Berkeley 122 Population Density 40 35 30 40
PR_03b No n/a n/a Berkeley 122 Population Density 40 35 30 40
PR_04a No n/a n/a Berkeley 122 Population Density 40 35 30 40
PR_04b Yes Old Hwy 6 535 Berkeley 122 Population Density 40 35 30 40
PR_04c Yes Old Hwy 6 215 Berkeley 122 Population Density 40 35 30 40
PR_05a Yes Old Hwy 6 190 Berkeley 122 Other Roadway 60 55 50 60
PR_05b Yes Old Hwy 6 215 Berkeley 122 Other Roadway 60 55 50 60
PR_05c Yes Old Hwy 6 750 Berkeley 122 Other Roadway 60 55 50 60
PR_06a Yes State Hwy 6 680 Berkeley 122 Other Roadway 60 55 50 60
PR_06b Yes State Hwy 6 770 Berkeley 122 Population Density 40 35 30 40
PR_06c No n/a n/a Berkeley 122 Other Roadway 55 50 45 55
PR_07 Yes State Hwy 6 95 Berkeley 122 Other Roadway 55 50 45 55
PR_08a Yes State Hwy 6 105 Berkeley 122 Other Roadway 50 45 40 50
PR_08b Yes State Hwy 6 160 Berkeley 122 Other Roadway 60 55 50 60
PR_08c Yes State Hwy 6 318 Berkeley 122 Other Roadway 50 45 40 50
PR_09 Yes State Hwy 6 140 Berkeley 122 Other Roadway 50 45 40 50
PR_10 Yes State Hwy 6 195 Berkeley 122 Population Density 40 35 30 40
PR_11 Yes State Hwy 6 145 Berkeley 122 Population Density 40 35 30 40

Project No.: 6250-160-108 Page 18 MIS-COM-TMP-007 r1
(A) (B) (C) (D) (E) (F) (G) (H) (I) (J) (K)
Receptor Near Major
Roadway Roadway
Distance [ft]
Census Existing Noise Exposure (FTA Tbl 5-7)
County Population
Density [ppl/sq-mi]
Based on… Leq,D Leq,E Leq,N Ldn
PR_12a Yes State Hwy 6 270 Berkeley 122 Population Density 40 35 30 40
PR_12b Yes State Hwy 6 100 Berkeley 122 Population Density 40 35 30 40
PR_13 Yes State Hwy 6 110 Berkeley 122 Population Density 40 35 30 40
PR_14a Yes State Hwy 6 215 Berkeley 122 Other Roadway 50 45 40 50
PR_14b Yes State Hwy 6 645 Berkeley 122 Other Roadway 55 50 45 55
PR_14c No n/a n/a Berkeley 122 Other Roadway 60 55 50 60
PR_14d No n/a n/a Berkeley 122 Other Roadway 55 50 45 55
PR_15 No n/a n/a Berkeley 122 Other Roadway 50 45 40 50
PR_16a No n/a n/a Berkeley 122 Other Roadway 50 45 40 50
PR_16b No n/a n/a Berkeley 122 Other Roadway 50 45 40 50
PR_16c No n/a n/a Berkeley 122 Population Density 40 35 30 40
PR_17a No n/a n/a Berkeley 122 Other Roadway 65 60 55 65
PR_17b No n/a n/a Berkeley 122 Other Roadway 60 55 50 60
PR_17c Yes n/a n/a Berkeley 122 Other Roadway 60 55 50 60
PR_18a Yes n/a n/a Berkeley 122 Other Roadway 55 50 45 55
PR_18b Yes n/a n/a Berkeley 122 Other Roadway 60 55 50 60
PR_18c Yes n/a n/a Berkeley 122 Other Roadway 60 55 50 60
PR_19a Yes n/a n/a Berkeley 122 Other Roadway 60 55 50 60
PR_19b Yes n/a n/a Berkeley 122 Other Roadway 55 50 45 55
PR_19c No n/a n/a Berkeley 122 Other Roadway 60 55 50 60
PR_19d No n/a n/a Berkeley 122 Other Roadway 60 55 50 60
PR_19e No n/a n/a Berkeley 122 Other Roadway 55 50 45 55

Project No.: 6250-160-108 Page 19 MIS-COM-TMP-007 r1
(A) (B) (C) (D) (E) (F) (G) (H) (I) (J) (K)
Receptor Near Major
Roadway Roadway
Distance [ft]
Census Existing Noise Exposure (FTA Tbl 5-7)
County Population
Density [ppl/sq-mi]
Based on… Leq,D Leq,E Leq,N Ldn
PR_20 No n/a n/a Berkeley 122 Other Roadway 50 45 40 50
PR_21a No n/a n/a Berkeley 122 Population Density 40 35 30 40
PR_21b No n/a n/a Berkeley 122 Population Density 40 35 30 40
PR_21c No n/a n/a Berkeley 122 Population Density 40 35 30 40
PR_21d No n/a n/a Berkeley 122 Population Density 40 35 30 40
PR_21e No n/a n/a Berkeley 122 Population Density 40 35 30 40
PR_21f No n/a n/a Berkeley 122 Population Density 40 35 30 40
PR_21g No n/a n/a Berkeley 122 Population Density 40 35 30 40
PR_22 No n/a n/a Berkeley 122 Population Density 40 35 30 40
PR_23a No n/a n/a Berkeley 122 Population Density 40 35 30 40
PR_23b No n/a n/a Berkeley 122 Population Density 40 35 30 40
PR_24a No n/a n/a Berkeley 122 Population Density 40 35 30 40
PR_24b No n/a n/a Berkeley 122 Population Density 40 35 30 40
PR_25a Yes State Rd S-8-708 155 Berkeley 122 Population Density 40 35 30 40
PR_25b Yes State Rd S-8-708 150 Berkeley 122 Population Density 40 35 30 40
PR_26a Yes State Rd S-8-708 250 Berkeley 122 Population Density 40 35 30 40
PR_26b Yes State Rd S-8-708 355 Berkeley 122 Population Density 40 35 30 40
PR_26c Yes State Rd S-8-708 405 Berkeley 122 Population Density 40 35 30 40
PR_26d Yes State Rd S-8-708 322 Berkeley 122 Population Density 40 35 30 40
PR_26e Yes State Rd S-8-708 373 Berkeley 122 Population Density 40 35 30 40
PR_26f Yes State Rd S-8-708 317 Berkeley 122 Population Density 40 35 30 40
PR_27a Yes State Rd S-8-708 320 Berkeley 122 Population Density 40 35 30 40

Project No.: 6250-160-108 Page 20 MIS-COM-TMP-007 r1
(A) (B) (C) (D) (E) (F) (G) (H) (I) (J) (K)
Receptor Near Major
Roadway Roadway
Distance [ft]
Census Existing Noise Exposure (FTA Tbl 5-7)
County Population
Density [ppl/sq-mi]
Based on… Leq,D Leq,E Leq,N Ldn
PR_27b Yes State Rd S-8-708 195 Berkeley 122 Population Density 40 35 30 40
PR_27c Yes State Rd S-8-708 140 Berkeley 122 Population Density 40 35 30 40
PR_27d Yes State Rd S-8-708 155 Berkeley 122 Population Density 40 35 30 40
PR_27e No n/a n/a Berkeley 122 Population Density 40 35 30 40
PR_27f No n/a n/a Berkeley 122 Population Density 40 35 30 40
PR_27g No n/a n/a Berkeley 122 Population Density 40 35 30 40
PR_27h No n/a n/a Berkeley 122 Population Density 40 35 30 40
PR_27i No n/a n/a Berkeley 122 Population Density 40 35 30 40
PR_27j Yes Old Hwy 6 535 Berkeley 122 Population Density 40 35 30 40
PR_28a Yes Old Hwy 6 215 Berkeley 122 Other Roadway 60 55 50 60
PR_28b Yes Old Hwy 6 190 Berkeley 122 Other Roadway 60 55 50 60
PR_28c Yes Old Hwy 6 215 Berkeley 122 Other Roadway 55 50 45 55
PR_28d Yes Old Hwy 6 750 Berkeley 122 Other Roadway 55 50 45 55
PR_28e Yes State Hwy 6 680 Berkeley 122 Other Roadway 50 45 40 50
PR_28f Yes State Hwy 6 770 Berkeley 122 Other Roadway 55 50 45 55
PR_28g No n/a n/a Berkeley 122 Other Roadway 55 50 45 55
PR_28h Yes State Hwy 6 95 Berkeley 122 Other Roadway 55 50 45 55
PR_28i Yes State Hwy 6 105 Berkeley 122 Other Roadway 55 50 45 55
PR_28j Yes State Hwy 6 160 Berkeley 122 Other Roadway 60 55 50 60
PR_28k Yes State Hwy 6 318 Berkeley 122 Other Roadway 60 55 50 60
PR_28l Yes State Hwy 6 140 Berkeley 122 Other Roadway 60 55 50 60 Table Notes:
(I) Receptor – Receptor labeling used in Figure 3a to 3e.
Project No.: 6250-160-108 Page 21 MIS-COM-TMP-007 r1
(J) Near Major Roadway – Identifies if the receptor is in proximity of a major roadway. (K) Raodway – Identifies the major roadway in proximity of the receptor (L) Distance [ft] – Measured distance from receptor location to major roadway. (M) County – County that the receptor is located within. (N) Population Density – County population density in number of people per square mile. (O) Existing Noise Exposure – Base on… – Defines the columns used for estimation of noise levels based on Table 5-7 from the FTA
Manual. (P) Leq,D – Day-time Leq. (Q) Leq,E – Evening Leq. (R) Leq,E – Night-Time Leq. (S) LDN – Day-Night sound pressure level.
Project No.: 6250-160-108 Page 22 MIS-COM-TMP-007 r1
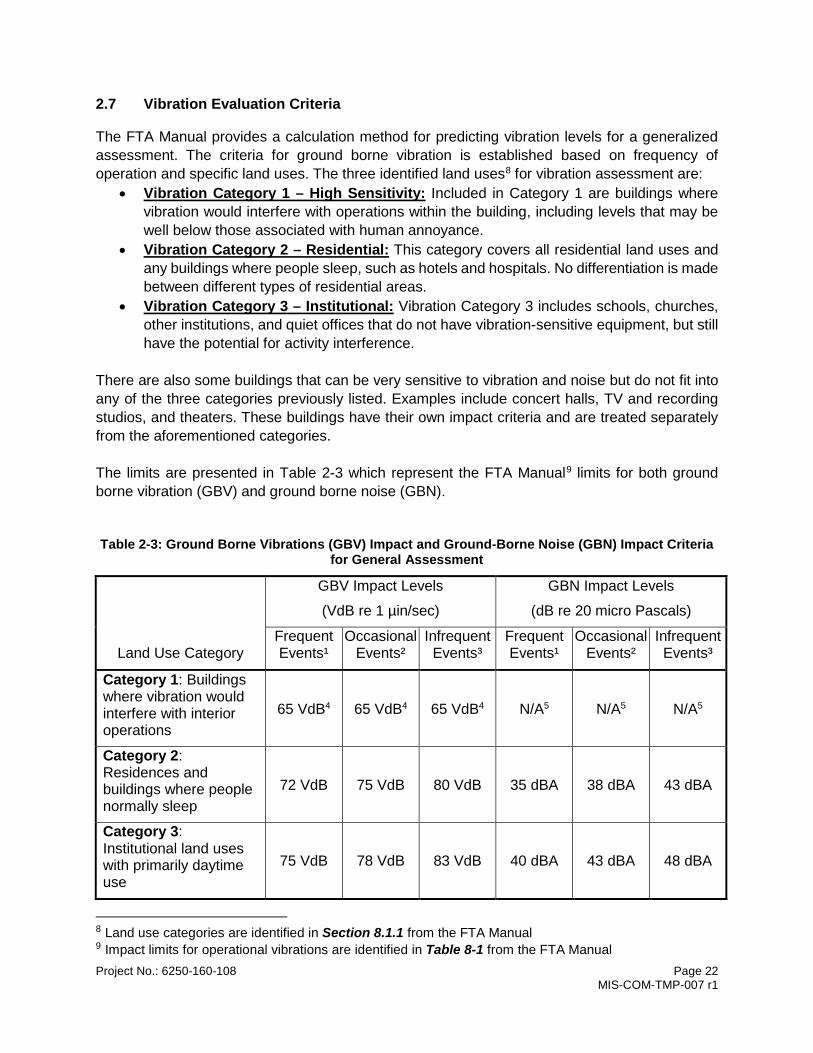
2.7 Vibration Evaluation Criteria
The FTA Manual provides a calculation method for predicting vibration levels for a generalized assessment. The criteria for ground borne vibration is established based on frequency of operation and specific land uses. The three identified land uses8 for vibration assessment are:
• Vibration Category 1 – High Sensitivity: Included in Category 1 are buildings where vibration would interfere with operations within the building, including levels that may be well below those associated with human annoyance.
• Vibration Category 2 – Residential: This category covers all residential land uses and any buildings where people sleep, such as hotels and hospitals. No differentiation is made between different types of residential areas.
• Vibration Category 3 – Institutional: Vibration Category 3 includes schools, churches, other institutions, and quiet offices that do not have vibration-sensitive equipment, but still have the potential for activity interference.
There are also some buildings that can be very sensitive to vibration and noise but do not fit into any of the three categories previously listed. Examples include concert halls, TV and recording studios, and theaters. These buildings have their own impact criteria and are treated separately from the aforementioned categories. The limits are presented in Table 2-3 which represent the FTA Manual9 limits for both ground borne vibration (GBV) and ground borne noise (GBN). Table 2-3: Ground Borne Vibrations (GBV) Impact and Ground-Borne Noise (GBN) Impact Criteria
for General Assessment
Land Use Category
GBV Impact Levels
(VdB re 1 µin/sec)
GBN Impact Levels
(dB re 20 micro Pascals)
Frequent Events¹
Occasional Events²
Infrequent Events³
Frequent Events¹
Occasional Events²
Infrequent Events³
Category 1: Buildings where vibration would interfere with interior operations
65 VdB4 65 VdB4 65 VdB4 N/A5 N/A5 N/A5
Category 2: Residences and buildings where people normally sleep
72 VdB 75 VdB 80 VdB 35 dBA 38 dBA 43 dBA
Category 3: Institutional land uses with primarily daytime use
75 VdB 78 VdB 83 VdB 40 dBA 43 dBA 48 dBA
8 Land use categories are identified in Section 8.1.1 from the FTA Manual 9 Impact limits for operational vibrations are identified in Table 8-1 from the FTA Manual

Project No.: 6250-160-108 Page 23 MIS-COM-TMP-007 r1
Land Use Category
GBV Impact Levels
(VdB re 1 µin/sec)
GBN Impact Levels
(dB re 20 micro Pascals)
Frequent Events¹
Occasional Events²
Infrequent Events³
Frequent Events¹
Occasional Events²
Infrequent Events³
Notes: 1. Frequent Events is defined as more than 70 vibration events of the same kind per day. 2. Occasional Events is defined as between 30 and 70 vibration events of the same kind per day. 3. Infrequent Events is defined as fewer than 30 vibration events of the same kind per day. 4. This criterion limit is based on levels that are acceptable for most moderately sensitive equipment
such as optical microscopes. Vibration-sensitive manufacturing or research will require detailed evaluation to define the acceptable vibration levels. Ensuring lower vibration levels in a building often requires special design of the HVAC systems and stiffened floors.
5. Vibration-sensitive equipment is not sensitive to ground-borne noise. 3.0 OPERATIONAL NOISE
3.1 No Build Alternative
Under the No-Build Alternative no freight train will be introduced and the noise levels at the receptors will remain unchanged. 3.2 Project Alternative
3.2.1 Estimated Noise Levels and Impact Assessment
The estimated noise levels from the Proposed Project were calculated based on two distinct models:
• For receptors in proximity of a public crossing the model used was the FRA Horn Model [17]. It should be noted that this model is provided by the FRA10 in a closed (secured) excel format. This model does not provide as an output specific exterior noise level, rather only the impact assessment based on distance between the receptor and the alignment and distance to crossing.
• For receptors not in proximity of a public crossing the CREATE model was used [18]. It should be noted that this model is provided by the FRA11 in a closed (secured) excel format. This model does provide an estimated exterior sound level based on the distance between the receptor and the alignment.
For each receptor identified in Section 2.4 an assessment of impact was conducted and the results presented in Table 3-1.
10 Horn Noise MS Excel spreadsheet model [15], in Excel spreadsheet format as provided by the FRA can be found at https://www.fra.dot.gov/eLib/Details/L04091 11 CREATE Freight Noise and Vibration Model MS Excel Spreadsheet Model [13], in Excel spreadsheet format as provided by the FRA can be found at https://www.fra.dot.gov/eLib/Details/L03727

Project No.: 6250-160-108 Page 24 MIS-COM-TMP-007 r1
Table 3-1: General Noise Assessment
(A) (B) (C) (D) (E) (F) (G) (H) (I) (J) (K)
Receptor
FTA Land Use / Noise Metric
Distance to Track
Alignment [ft]
Near Crossing / Longitudinal
distance to Crossing [ft]
Existing Land Use
Existing Noise Level [dBA]
Predicted Exterior Noise Levels [dBA]
Scenario Impacts Increase in
Overall Noise Exposure – Build over
Existing [dBA]
FTA Allowable Increase
[dBA]
Impact Under FTA Criteria
MI SI
PR_01 2 / Ldn 1600 Yes / 295 FLEX1 40 n/a n/a 10 15 No Impact
PR_02 2 / Ldn 1200 Yes / 160 FLEX1 55 n/a n/a 4 7 No Impact
PR_03a 2 / Ldn 450 Yes / 60 FLEX1 40 n/a n/a 10 15 Moderate Impact
PR_03b 2 / Ldn 660 Yes / 60 FLEX1 40 n/a n/a 10 15 No Impact
PR_04a 2 / Ldn 100 Yes / 113 FLEX1 40 n/a n/a 10 15 No Impact
PR_04b 2 / Ldn 180 Yes / 155 FLEX1 40 n/a n/a 10 15 No Impact
PR_04c 2 / Ldn 310 Yes / 135 FLEX1 40 n/a n/a 10 15 Moderate Impact
PR_05a 2 / Ldn 523 Yes / 397 FLEX1 60 n/a n/a 2 5 No Impact
PR_05b 2 / Ldn 690 Yes / 396 FLEX1 60 n/a n/a 2 5 No Impact
PR_05c 2 / Ldn 915 Yes / 300 FLEX1 60 n/a n/a 2 5 No Impact
PR_06a 2 / Ldn 1000 Yes / 419 FLEX1 60 n/a n/a 2 5 No Impact
PR_06b 2 / Ldn 1215 Yes / 410 FLEX1 40 n/a n/a 10 15 No Impact
PR_06c 2 / Ldn 1415 Yes / 330 FLEX1 55 n/a n/a 4 7 No Impact
PR_07 2 / Ldn 415 Yes / 253 FLEX1 55 n/a n/a 4 7 No Impact
PR_08a 2 / Ldn 790 Yes / 245 FLEX1 50 n/a n/a 5 10 No Impact
PR_08b 2 / Ldn 915 Yes / 264 FLEX1 60 n/a n/a 2 5 No Impact
PR_08c 1 / Leq(h) 1390 Yes / 0 FLEX1 50 n/a n/a 5 10 No Impact
PR_09 2 / Ldn 460 Yes / 111 FLEX1 50 n/a n/a 5 10 No Impact
PR_10 2 / Ldn 1450 Yes / 259 FLEX1 40 n/a n/a 10 15 No Impact

Project No.: 6250-160-108 Page 25 MIS-COM-TMP-007 r1
(A) (B) (C) (D) (E) (F) (G) (H) (I) (J) (K)
Receptor
FTA Land Use / Noise Metric
Distance to Track
Alignment [ft]
Near Crossing / Longitudinal
distance to Crossing [ft]
Existing Land Use
Existing Noise Level [dBA]
Predicted Exterior Noise Levels [dBA]
Scenario Impacts Increase in
Overall Noise Exposure – Build over
Existing [dBA]
FTA Allowable Increase
[dBA]
Impact Under FTA Criteria
MI SI PR_11 2 / Ldn 250 Yes / 569 FLEX1 40 n/a n/a 10 15 Moderate Impact
PR_12a 2 / Ldn 430 Yes / 558 FLEX1 40 n/a n/a 10 15 No Impact
PR_12b 2 / Ldn 590 Yes / 560 FLEX1 40 n/a n/a 10 15 No Impact
PR_13 2 / Ldn 1285 Yes / 140 FLEX1 40 n/a n/a 10 15 No Impact
PR_14a 2 / Ldn 260 Yes / 645 FLEX1 50 n/a n/a 5 10 Moderate Impact
PR_14b 2 / Ldn 450 Yes / 391 FLEX1 55 n/a n/a 4 7 No Impact
PR_14c 2 / Ldn 295 Yes / 166 RNC 60 n/a n/a 2 5 No Impact
PR_14d 2 / Ldn 485 Yes / 266 FLEX1 55 n/a n/a 4 7 No Impact
PR_15 2 / Ldn 1220 Yes / 191 FLEX1 50 n/a n/a 5 10 No Impact
PR_16a 2 / Ldn 630 Yes / 189 FLEX1 50 n/a n/a 5 10 No Impact
PR_16b 2 / Ldn 800 Yes / 177 FLEX1 50 n/a n/a 5 10 No Impact
PR_16c 2 / Ldn 1060 Yes / 104 FLEX1 40 n/a n/a 10 15 No Impact
PR_17a 2 / Ldn 310 Yes / 102 FLEX1 65 n/a n/a 1 4 No Impact
PR_17b 2 / Ldn 245 Yes / 288 RNC 60 n/a n/a 2 5 No Impact
PR_17c 2 / Ldn 605 Yes / 179 FLEX1 60 n/a n/a 2 5 No Impact
PR_18a 2 / Ldn 930 Yes / 145 FLEX1 55 n/a n/a 4 7 No Impact
PR_18b 2 / Ldn 867 Yes / 309 FLEX1 60 n/a n/a 2 5 No Impact
PR_18c 2 / Ldn 1045 Yes / 282 FLEX1 60 n/a n/a 2 5 No Impact
PR_19a 2 / Ldn 885 Yes / 597 FLEX1 60 n/a n/a 2 5 No Impact
PR_19b 2 / Ldn 845 Yes / 728 FLEX1 55 n/a n/a 4 7 No Impact
PR_19c 2 / Ldn 1015 Yes / 573 FLEX1 60 n/a n/a 2 5 No Impact

Project No.: 6250-160-108 Page 26 MIS-COM-TMP-007 r1
(A) (B) (C) (D) (E) (F) (G) (H) (I) (J) (K)
Receptor
FTA Land Use / Noise Metric
Distance to Track
Alignment [ft]
Near Crossing / Longitudinal
distance to Crossing [ft]
Existing Land Use
Existing Noise Level [dBA]
Predicted Exterior Noise Levels [dBA]
Scenario Impacts Increase in
Overall Noise Exposure – Build over
Existing [dBA]
FTA Allowable Increase
[dBA]
Impact Under FTA Criteria
MI SI PR_19d 3 / Leq(h) 1240 Yes / 635 FLEX1 60 n/a n/a 2 5 No Impact
PR_19e 2 / Ldn 1550 Yes / 675 FLEX1 55 n/a n/a 4 7 No Impact
PR_20 2 / Ldn 135 Yes / 684 FLEX1 50 n/a n/a 5 10 Moderate Impact
PR_21a 2 / Ldn 745 No / n/a FLEX1 40 46 7 10 15 No Impact
PR_21b 2 / Ldn 755 No / n/a FLEX1 40 46 7 10 15 No Impact
PR_21c 2 / Ldn 735 No / n/a FLEX1 40 46 7 10 15 No Impact
PR_21d 2 / Ldn 625 No / n/a FLEX1 40 47 8 10 15 No Impact
PR_21e 2 / Ldn 475 No / n/a FLEX1 40 49 10 10 15 No Impact
PR_21f 2 / Ldn 640 No / n/a FLEX1 40 47 8 10 15 No Impact
PR_21g 2 / Ldn 735 No / n/a FLEX1 40 46 7 10 15 No Impact
PR_22 2 / Ldn 388 No / n/a FLEX1 40 50 10 10 15 No Impact
PR_23a 2 / Ldn 530 Yes / 314 FLEX1 40 n/a n/a 10 15 No Impact
PR_23b 2 / Ldn 725 Yes / 33 FLEX1 40 n/a n/a 10 15 No Impact
PR_24a 2 / Ldn 195 Yes / 146 FLEX1 40 n/a n/a 10 15 No Impact
PR_24b 2 / Ldn 360 Yes / 69 FLEX1 40 n/a n/a 10 15 Moderate Impact
PR_25a 2 / Ldn 1507 Yes / 529 FLEX1 40 n/a n/a 10 15 No Impact
PR_25b 2 / Ldn 1570 Yes / 747 FLEX1 40 n/a n/a 10 15 No Impact
PR_26a 2 / Ldn 1404 Yes / 597 FLEX1 40 n/a n/a 10 15 No Impact
PR_26b 2 / Ldn 1130 Yes / 570 FLEX1 40 n/a n/a 10 15 No Impact
PR_26c 2 / Ldn 1055 Yes / 276 FLEX1 40 n/a n/a 10 15 No Impact
PR_26d 2 / Ldn 802 Yes / 317 FLEX1 40 n/a n/a 10 15 No Impact

Project No.: 6250-160-108 Page 27 MIS-COM-TMP-007 r1
(A) (B) (C) (D) (E) (F) (G) (H) (I) (J) (K)
Receptor
FTA Land Use / Noise Metric
Distance to Track
Alignment [ft]
Near Crossing / Longitudinal
distance to Crossing [ft]
Existing Land Use
Existing Noise Level [dBA]
Predicted Exterior Noise Levels [dBA]
Scenario Impacts Increase in
Overall Noise Exposure – Build over
Existing [dBA]
FTA Allowable Increase
[dBA]
Impact Under FTA Criteria
MI SI PR_26e 2 / Ldn 790 Yes / 82 FLEX1 40 n/a n/a 10 15 No Impact
PR_26f 2 / Ldn 266 Yes / 49 FLEX1 40 n/a n/a 10 15 No Impact
PR_27a 2 / Ldn 1260 Yes / 833 FLEX1 40 n/a n/a 10 15 No Impact
PR_27b 2 / Ldn 905 Yes / 595 FLEX1 40 n/a n/a 10 15 No Impact
PR_27c 2 / Ldn 876 Yes / 388 FLEX1 40 n/a n/a 10 15 No Impact
PR_27d 2 / Ldn 915 Yes / 157 FLEX1 40 n/a n/a 10 15 No Impact
PR_27e 2 / Ldn 679 Yes / 104 FLEX1 40 n/a n/a 10 15 No Impact
PR_27f 2 / Ldn 561 Yes / 49 FLEX1 40 n/a n/a 10 15 No Impact
PR_27g 2 / Ldn 815 Yes / 52 FLEX1 40 n/a n/a 10 15 No Impact
PR_27h 2 / Ldn 1288 Yes / 45 FLEX1 40 n/a n/a 10 15 No Impact
PR_27i 2 / Ldn 950 Yes / 220 FLEX1 40 n/a n/a 10 15 No Impact
PR_27j 2 / Ldn 1028 Yes / 370 FLEX1 40 n/a n/a 10 15 No Impact
PR_28a 2 / Ldn 1454 Yes / 225 FLEX1 60 n/a n/a 2 5 No Impact
PR_28b 2 / Ldn 1234 Yes / 37 FLEX1 60 n/a n/a 2 5 No Impact
PR_28c 2 / Ldn 1260 Yes / 147 FLEX1 55 n/a n/a 4 7 No Impact
PR_28d 2 / Ldn 1260 Yes / 228 FLEX1 55 n/a n/a 4 7 No Impact
PR_28e 2 / Ldn 1170 Yes / 275 FLEX1 50 n/a n/a 5 10 No Impact
PR_28f 2 / Ldn 1130 Yes / 188 FLEX1 55 n/a n/a 4 7 No Impact
PR_28g 2 / Ldn 1005 Yes / 232 FLEX1 55 n/a n/a 4 7 No Impact
PR_28h 2 / Ldn 995 Yes / 175 FLEX1 55 n/a n/a 4 7 No Impact
PR_28i 2 / Ldn 965 Yes / 30 FLEX1 55 n/a n/a 4 7 No Impact

Project No.: 6250-160-108 Page 28 MIS-COM-TMP-007 r1
(A) (B) (C) (D) (E) (F) (G) (H) (I) (J) (K)
Receptor
FTA Land Use / Noise Metric
Distance to Track
Alignment [ft]
Near Crossing / Longitudinal
distance to Crossing [ft]
Existing Land Use
Existing Noise Level [dBA]
Predicted Exterior Noise Levels [dBA]
Scenario Impacts Increase in
Overall Noise Exposure – Build over
Existing [dBA]
FTA Allowable Increase
[dBA]
Impact Under FTA Criteria
MI SI PR_28j 2 / Ldn 1050 Yes / 50 FLEX1 60 n/a n/a 2 5 No Impact
PR_28k 2 / Ldn 900 Yes / 40 FLEX1 60 n/a n/a 2 5 No Impact
PR_28l 2 / Ldn 751 Yes / 25 FLEX1 60 n/a n/a 2 5 No Impact Table Notes:
(A) Receptor – Receptor labeling used in Figure 3a to 3e. (B) FTA Land Use / Noise Metric – Type of land use for a receptor based on land use categories identified in Table 3-2 from the FTA
Manual. Metric used for assessment as per Table 3-2 from the FTA Manual. (C) Distance to Track Alignment [ft] – Measured distance from receptor location to track alignment. (D) Near Crossing / Longitudinal Distance to Crossing [ft] – Measured distance along track alignment to nearest public crossing. (E) Existing Land Use – Land use as identified in Local Planning. (F) Existing Noise Level – Existing noise level defined for the receptor. (G) Predicted Exterior Noise Levels – Predicted exterior noise levels. For receptors in proximity of a public crossing the model used was
the FRA Horn Model (Column D indicates “Yes”) [17] – this method does not provide a specific exterior noise level, rather only the impact assessment. For receptors not in proximity of a public crossing the CREATE model was used [14].
(H) Increase in Overall Noise Exposure – Build over Existing – Estimated Increase of noise levels from existing noise levels. (I) MI – Moderate Impact threshold based on existing noise levels and land use as per Table 3-1 from the FTA Manual. (J) SI – Severe Impact threshold based on existing noise levels and land use as per Table 3-1 from the FTA Manual. (K) Impact under FTA Criteria – This is based on the result from FRA Horn Model [17] for receptors in proximity of public crossings or
based on the result in Column H for all other receptors.
Project No.: 6250-160-108 Page 29 MIS-COM-TMP-007 r1
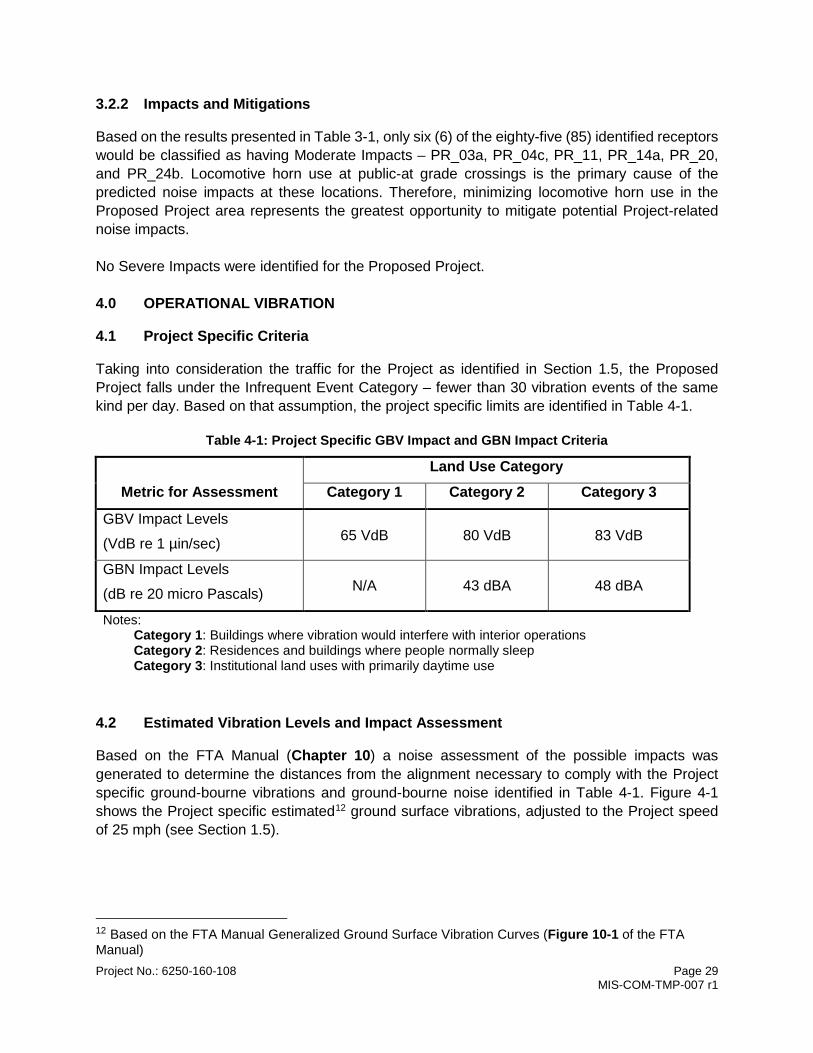
3.2.2 Impacts and Mitigations
Based on the results presented in Table 3-1, only six (6) of the eighty-five (85) identified receptors would be classified as having Moderate Impacts – PR_03a, PR_04c, PR_11, PR_14a, PR_20, and PR_24b. Locomotive horn use at public-at grade crossings is the primary cause of the predicted noise impacts at these locations. Therefore, minimizing locomotive horn use in the Proposed Project area represents the greatest opportunity to mitigate potential Project-related noise impacts. No Severe Impacts were identified for the Proposed Project. 4.0 OPERATIONAL VIBRATION
4.1 Project Specific Criteria
Taking into consideration the traffic for the Project as identified in Section 1.5, the Proposed Project falls under the Infrequent Event Category – fewer than 30 vibration events of the same kind per day. Based on that assumption, the project specific limits are identified in Table 4-1.
Table 4-1: Project Specific GBV Impact and GBN Impact Criteria
Metric for Assessment Land Use Category
Category 1 Category 2 Category 3
GBV Impact Levels
(VdB re 1 µin/sec) 65 VdB 80 VdB 83 VdB
GBN Impact Levels
(dB re 20 micro Pascals) N/A 43 dBA 48 dBA
Notes: Category 1: Buildings where vibration would interfere with interior operations Category 2: Residences and buildings where people normally sleep Category 3: Institutional land uses with primarily daytime use
4.2 Estimated Vibration Levels and Impact Assessment
Based on the FTA Manual (Chapter 10) a noise assessment of the possible impacts was generated to determine the distances from the alignment necessary to comply with the Project specific ground-bourne vibrations and ground-bourne noise identified in Table 4-1. Figure 4-1 shows the Project specific estimated12 ground surface vibrations, adjusted to the Project speed of 25 mph (see Section 1.5).
12 Based on the FTA Manual Generalized Ground Surface Vibration Curves (Figure 10-1 of the FTA Manual)

Project No.: 6250-160-108 Page 30 MIS-COM-TMP-007 r1
Based on the Receptor location review presented in Section 2.4, all receptors can be classified as Vibration Category 2 – Residential or Vibration Category 3 – Institutional. No Vibration Category 1 – High Sensitivity receptors were identified as part of the Screening.
Figure 4-1: Project Specific Generalized Ground Surface Vibrations
Figure 4-2: Project Specific Generalized Ground Bourne Noise
Based on Figure 4-1 and Figure 4-2 the following distances are identified for compliance with the limits:

Project No.: 6250-160-108 Page 31 MIS-COM-TMP-007 r1
Table 4-2: Project Specific GBV and GBN Impact Distances
Metric for Assessment
Land Use Category (Vibration) (A)
Category 2 Category 3 Limit Distance [ft] Limit Distance [ft]
GBV Impact Levels
(VdB re 1 µin/sec) 80 VdB 40 83 VdB 30
GBN Impact Levels
(dB re 20 micro Pascals) 43 dBA 60 48 dBA 30
Notes: (A) – No Vibration Category 1 land uses were identified in the Project Screening.
Based on the distance to the track centerline identified in Table 3-1, none of the identified receptors identified during the screening is within the impact distances identified in Table 4-2. Therefore, the projected vibration from the project is below the impact threshold. Significant vibration impacts are therefore not anticipated with this project. 5.0 CONSTRUCTION ASSESSMENT
5.1 Introduction
During project track construction, noise levels will be produced by the operation of heavy-duty equipment and various other construction activities. Noise levels generated by construction activities depend on a series of variables. Such variables include the number and type of pieces of equipment, their general condition of operation, the amount of time each piece operates per day, the presence of any noise attenuating features (e.g. walls, berms) and the location of the construction activities relative to the receptors. The majority of these variables are traditionally left to the discretion of the contractor which makes it difficult to accurately estimate levels of construction noise. As such for purposes of this assessment, a professional judgment of the likely means and methods that would be used by the contractor is used. Some construction activities and use of some equipment may result in perceptible vibrations levels, depending on the distance from the construction activity to the receptor. Activities such as pile driving, pavement breaking and the use of tracked vehicles (e.g., bulldozers) can generate higher ground-borne vibration levels. 5.2 Noise Assessment
The Berkeley County has an ordinance for noise control in unincorporated areas (Ordinance No. 05-08-56 [11] amended by Ordinance No. 09-04-21 [12]). These ordinances specify sound level limits for continuous operation of equipment in proximity of residential and non-residential areas. The amendment of the noise control ordinance (by Ordinance No. 09-04-21 [12]) stipulates on Sec. 38-1. §§c. an exception for “Noises from construction or demolition activities occurring between 6:00 a.m. and 10:00 p.m.”.

Project No.: 6250-160-108 Page 32 MIS-COM-TMP-007 r1
The FTA Guidelines13 define a two-step approach to assessment of noise impact from construction activities. The first step is a screening process based on the combined noise levels, from the two noisiest pieces of equipment, under the assumption that they operate at the same time and locations. The criteria for this screening assessment are identified in Table 5-1 which represent noise levels which are not to be exceeded.
Table 5-1: Construction Noise General Assessment Criteria
Land Use One-hour Leq [dBA]
Day Night Residential 90 80 Commercial 100 100
Industrial 100 100 The equipment anticipated to be part of the construction stage for this project is identified in Table 5-2. Two areas of project are identified as likely to have the largest impacts due to proximity to the construction zones. One area is composed of at-grade track construction and another is the bridge construction over the Diversion Canal. The noise characteristics for the different types of equipment’s anticipated to be used on site are identified in Table 5-2. The values presented are the same as the values presented in the FTA Manual or the FHWA Highway Construction Handbook [19].
Table 5-2: Expected Equipment to be used During Construction (Noise Assessment)
Equipment
Noise Emissions Characteristics Project Areas
E.L. [dBA] (A) U.F. (B) At-grade
Track Construction
Bridge Construction
Air Compressor 81 40% 77 77
Backhoe 80 40% 76 76
Crane, Mobile 83 16% 75 75
Dozer 85 40% 81 n.e.u. (C)
Generator 81 50% 78 78
Loader 85 40% 81 81
Dump Truck 84 40% 80 80
Pile-driver 95 20% n.e.u. (C) 88
Concrete Mixer 85 40% n.e.u. (C) 81
Concrete Pump 82 20% n.e.u. (C) 75
Roller 74 20% 67 n.e.u. (C)
13 See Section 12.1.3 of the FTA Manual.

Project No.: 6250-160-108 Page 33 MIS-COM-TMP-007 r1
Equipment
Noise Emissions Characteristics Project Areas
E.L. [dBA] (A) U.F. (B) At-grade
Track Construction
Bridge Construction
Spike Driver 77 2% 60 60
Tie Cutter 84 2% 67 67
Tie Handler 80 2% 63 63
Tie Inserter 85 2% 68 68
Truck 88 2% 71 71
Notes: (A) – E.L. is the noise emission level of the particular piece of equipment at the reference distance of 50 feet. (B) – U.F. is the usage factor that accounts for the fraction of time that the equipment is in use over the specified time period. (C) – n.e.u. indicates that the particular piece of equipment is not expected to be used for the identified Project Areas.
From the data presented in Table 3-1, the closest receptor to the at-grade construction area is PR_04a with a distance to the alignment of 100 ft. For the area of the bridge construction the closest receptor is PR_27f with a distance to the alignment of 561 ft. Both locations are residential, therefore will have the strictest noise criteria limits as identified in Table 5-1. An assessment was done for the 2 noisiest sound sources, and the results are presented in Table 5-3.
Table 5-3: General Assessment of Construction Noise
Reception Location
One-hour Leq [dBA] At-grade Track Construction
Bridge Construction
At 50 ft distance 84 89 PR-04a (100 ft) 78 n/a PR-27f (561 ft) n/a 68
The values presented in Table 5-3 are below the limits identified in in Table 5-1 for residential locations located within the project screening area. Therefore based on this assessment no additional study or consideration of mitigation is considered necessary. 5.3 Vibration Assessment
During construction activities vibrations from construction equipment are expected. These vibrations may be perceptible at some receptor locations. However since perceptible vibrations from construction are typically short-term and reversible the focus of assessment is typically constrained to potential damage, resulting from vibration levels which are greater than the limits
Project No.: 6250-160-108 Page 34 MIS-COM-TMP-007 r1
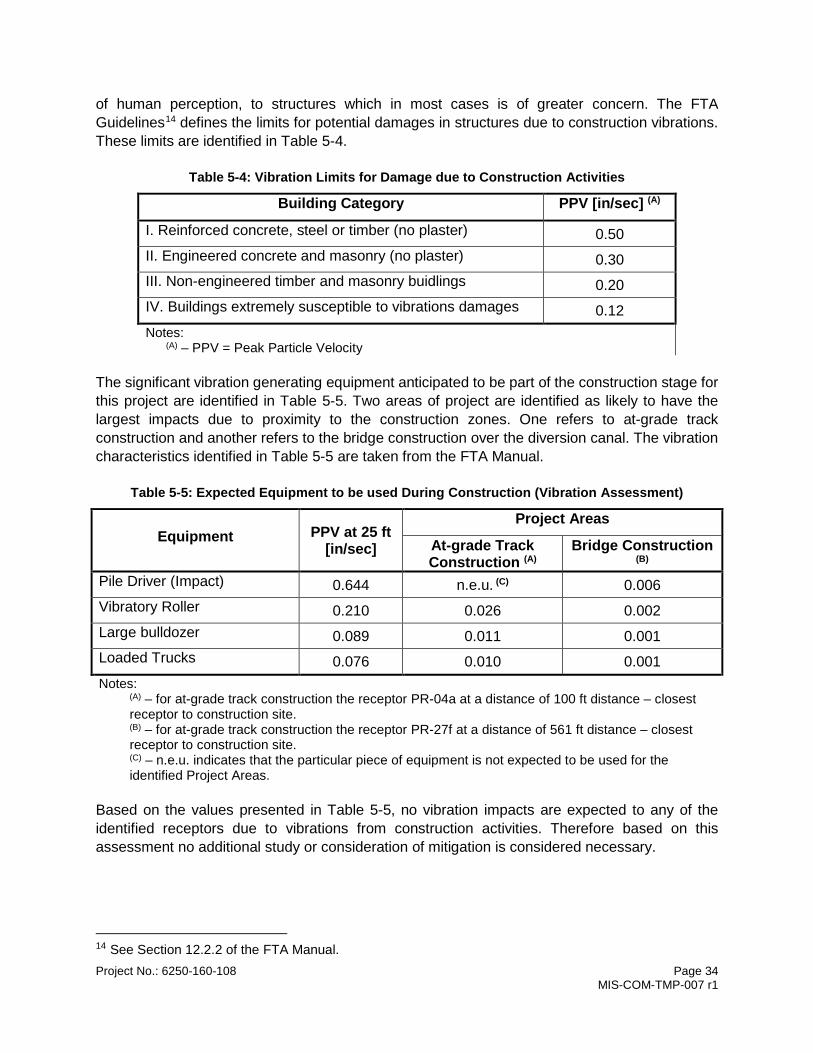
of human perception, to structures which in most cases is of greater concern. The FTA Guidelines14 defines the limits for potential damages in structures due to construction vibrations. These limits are identified in Table 5-4.
Table 5-4: Vibration Limits for Damage due to Construction Activities
Building Category PPV [in/sec] (A)
I. Reinforced concrete, steel or timber (no plaster) 0.50 II. Engineered concrete and masonry (no plaster) 0.30 III. Non-engineered timber and masonry buidlings 0.20 IV. Buildings extremely susceptible to vibrations damages 0.12 Notes:
(A) – PPV = Peak Particle Velocity The significant vibration generating equipment anticipated to be part of the construction stage for this project are identified in Table 5-5. Two areas of project are identified as likely to have the largest impacts due to proximity to the construction zones. One refers to at-grade track construction and another refers to the bridge construction over the diversion canal. The vibration characteristics identified in Table 5-5 are taken from the FTA Manual.
Table 5-5: Expected Equipment to be used During Construction (Vibration Assessment)
Equipment PPV at 25 ft [in/sec]
Project Areas
At-grade Track Construction (A)
Bridge Construction (B)
Pile Driver (Impact) 0.644 n.e.u. (C) 0.006 Vibratory Roller 0.210 0.026 0.002 Large bulldozer 0.089 0.011 0.001 Loaded Trucks 0.076 0.010 0.001 Notes:
(A) – for at-grade track construction the receptor PR-04a at a distance of 100 ft distance – closest receptor to construction site. (B) – for at-grade track construction the receptor PR-27f at a distance of 561 ft distance – closest receptor to construction site. (C) – n.e.u. indicates that the particular piece of equipment is not expected to be used for the identified Project Areas.
Based on the values presented in Table 5-5, no vibration impacts are expected to any of the identified receptors due to vibrations from construction activities. Therefore based on this assessment no additional study or consideration of mitigation is considered necessary.
14 See Section 12.2.2 of the FTA Manual.

Project No.: 6250-160-108 Page 35 MIS-COM-TMP-007 r1
6.0 CLOSURE
Yours truly, Amec Foster Wheeler Environment & Infrastructure a Division of Amec Foster Wheeler Americas Limited Written by: Alfredo Rodrigues, EngSci
Senior Building Acoustics Specialist
Signature: Date: July 25, 2017
Reviewed by: Buddy Ledger, M.A.Sc., P.Eng., INCE Acoustics Group Leader / Senior Acoustic Engineer
Signature: Date: July 25, 2017
C:\Users\Alfredo.Rodrigues\Box Sync\AFW Share To Private\6250-160-108.04_AFW Columbiasc_23Mile Rail Spur Camp Hall\01_Deliverables\01 Noise And Vibration Report\6250160108_Camphall_N&V_Report_V00_Blar.Docx
Project No.: 6250-160-108 Page 36 MIS-COM-TMP-007 r1
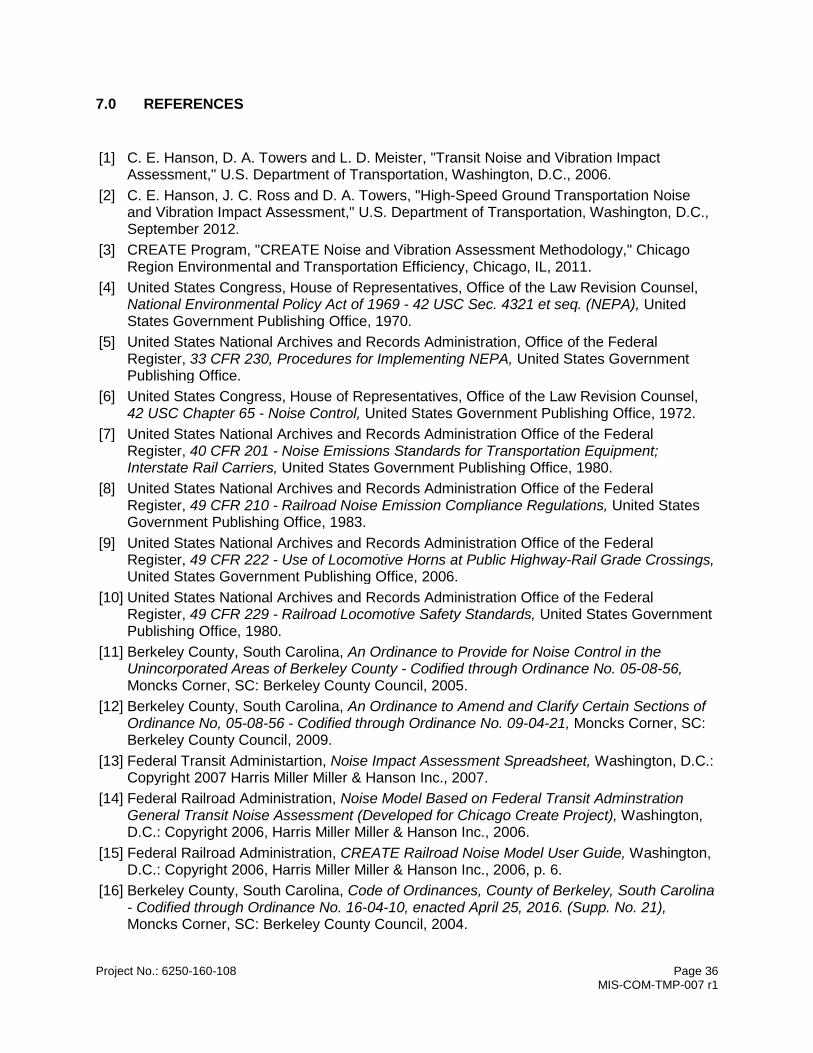
7.0 REFERENCES
[1] C. E. Hanson, D. A. Towers and L. D. Meister, "Transit Noise and Vibration Impact Assessment," U.S. Department of Transportation, Washington, D.C., 2006.
[2] C. E. Hanson, J. C. Ross and D. A. Towers, "High-Speed Ground Transportation Noise and Vibration Impact Assessment," U.S. Department of Transportation, Washington, D.C., September 2012.
[3] CREATE Program, "CREATE Noise and Vibration Assessment Methodology," Chicago Region Environmental and Transportation Efficiency, Chicago, IL, 2011.
[4] United States Congress, House of Representatives, Office of the Law Revision Counsel, National Environmental Policy Act of 1969 - 42 USC Sec. 4321 et seq. (NEPA), United States Government Publishing Office, 1970.
[5] United States National Archives and Records Administration, Office of the Federal Register, 33 CFR 230, Procedures for Implementing NEPA, United States Government Publishing Office.
[6] United States Congress, House of Representatives, Office of the Law Revision Counsel, 42 USC Chapter 65 - Noise Control, United States Government Publishing Office, 1972.
[7] United States National Archives and Records Administration Office of the Federal Register, 40 CFR 201 - Noise Emissions Standards for Transportation Equipment; Interstate Rail Carriers, United States Government Publishing Office, 1980.
[8] United States National Archives and Records Administration Office of the Federal Register, 49 CFR 210 - Railroad Noise Emission Compliance Regulations, United States Government Publishing Office, 1983.
[9] United States National Archives and Records Administration Office of the Federal Register, 49 CFR 222 - Use of Locomotive Horns at Public Highway-Rail Grade Crossings, United States Government Publishing Office, 2006.
[10] United States National Archives and Records Administration Office of the Federal Register, 49 CFR 229 - Railroad Locomotive Safety Standards, United States Government Publishing Office, 1980.
[11] Berkeley County, South Carolina, An Ordinance to Provide for Noise Control in the Unincorporated Areas of Berkeley County - Codified through Ordinance No. 05-08-56, Moncks Corner, SC: Berkeley County Council, 2005.
[12] Berkeley County, South Carolina, An Ordinance to Amend and Clarify Certain Sections of Ordinance No, 05-08-56 - Codified through Ordinance No. 09-04-21, Moncks Corner, SC: Berkeley County Council, 2009.
[13] Federal Transit Administartion, Noise Impact Assessment Spreadsheet, Washington, D.C.: Copyright 2007 Harris Miller Miller & Hanson Inc., 2007.
[14] Federal Railroad Administration, Noise Model Based on Federal Transit Adminstration General Transit Noise Assessment (Developed for Chicago Create Project), Washington, D.C.: Copyright 2006, Harris Miller Miller & Hanson Inc., 2006.
[15] Federal Railroad Administration, CREATE Railroad Noise Model User Guide, Washington, D.C.: Copyright 2006, Harris Miller Miller & Hanson Inc., 2006, p. 6.
[16] Berkeley County, South Carolina, Code of Ordinances, County of Berkeley, South Carolina - Codified through Ordinance No. 16-04-10, enacted April 25, 2016. (Supp. No. 21), Moncks Corner, SC: Berkeley County Council, 2004.
Project No.: 6250-160-108 Page 37 MIS-COM-TMP-007 r1
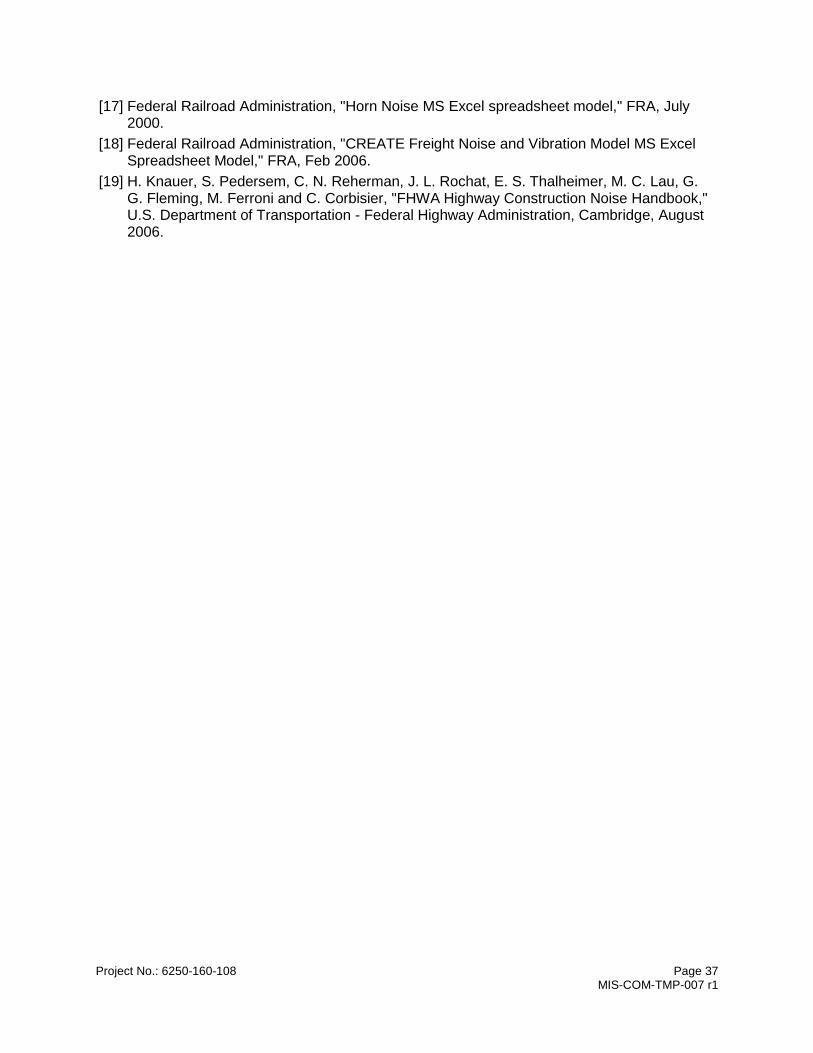
[17] Federal Railroad Administration, "Horn Noise MS Excel spreadsheet model," FRA, July 2000.
[18] Federal Railroad Administration, "CREATE Freight Noise and Vibration Model MS Excel Spreadsheet Model," FRA, Feb 2006.
[19] H. Knauer, S. Pedersem, C. N. Reherman, J. L. Rochat, E. S. Thalheimer, M. C. Lau, G. G. Fleming, M. Ferroni and C. Corbisier, "FHWA Highway Construction Noise Handbook," U.S. Department of Transportation - Federal Highway Administration, Cambridge, August 2006.

APPENDIX A
FIGURES
ClarendonOrangeburg
Orangeburg
Berkeley
Berk eley
Dorchester
Camp HallCommerce
Park
I0 63
Miles
LegendCounty Boundary
Camp Hall Commerce Park
Cross Alignment
Cross Alignment - 1 Mile Buffer
Existing Nearby Rail
CSXT
Norfolk Southern
I0 10050
Miles
P:\E
nviro
nmen
tal\2
012
+ P
roje
cts\
0108
- P
alm
etto
Rai
lway
s - C
amp
Hal
l Bui
ld-in
\Env
ironm
enta
l Doc
umen
tatio
n &
NE
PA C
ompl
ianc
e\N
oise
& V
ibra
tion\
Noi
se &
Vib
ratio
n\1_
Site
Loc
atio
n.m
xd
Esri, DeLorme, GEBCO, NOAA NGDC, and other contributorsSources: Esri, HERE, DeLorme, USGS, Intermap, increment P Corp., NRCAN, Esri Japan, METI, Esri China (Hong
Kong), Esri (Thailand), TomTom, MapmyIndia, © OpenStreetMap contributors, and the GIS User Community
Camp Hall Railroad Build-inNoise and Vibration Analysis
Berkeley County, South Carolina
Job No. 6250-16-0108
Drawn By: BWS
Reviewed By: AR
Date: 05/11/2017
The map shown here has beencreated with all due and
reasonable care and is strictly foruse with Amec Foster Wheelerproject number 6250160108.
Amec Foster Wheeler assumes noliability, direct or indirect,
whatsoever for any such thirdparty or unintended use.
Figure 1. Site Location Map
!(
!( !(!(!(!(!(!(!(!(!(!(!(!(
!(!(!(
!(
!(
!(
!(!(
!(
!(!(!(!(!(
!(!(!(
!(!(!(!(!(!(!(!(!(!(!(
!(!(!(!(!(!(!(!(
!(
!(!(
!(!(
!(!( !(!(!(!(!(!(
!(!(!(!(!(!(!(!(!(!(
!(!(!(!(!(!(!(!(!(!(!(!(
!(
!(
!(
!(
!(
!(
!(
!(
!(
!(!(
!(
!(
!(
!(
!(
!(
!(
!(
!(
!(
!(
!(
!(
!(
!(
!(
!(
!(
!(
!(
!(
!(
!(
!(
!(
!(
!(
!(
!(
!(!(
OrangeburgBerkeley
Camp HallCommerce
Park
I 0 31.5Miles
LegendCounty Boundary
Camp Hall Commerce Park
Cross Alignment
!( Grade Crossings (40)
!( Identified Receptors (85)
Cross Alignment (750-ft Buffer)
Cross Alignment (1600-ft Buffer)
Screening Area
I0 10050
Miles
P:\E
nviro
nmen
tal\2
012
+ P
roje
cts\
0108
- P
alm
etto
Rai
lway
s - C
amp
Hal
l Bui
ld-in
\Env
ironm
enta
l Doc
umen
tatio
n &
NE
PA C
ompl
ianc
e\N
oise
& V
ibra
tion\
Noi
se &
Vib
ratio
n\2_
Scr
eeni
ng A
rea.
mxd
Esri, DeLorme, GEBCO, NOAA NGDC, and other contributorsSource: Esri, DigitalGlobe, GeoEye, i-cubed, Earthstar Geographics,CNES/Airbus DS, USDA, USGS, AEX, Getmapping, Aerogrid, IGN, IGP,swisstopo, and the GIS User CommunitySources: Esri, HERE, DeLorme, USGS, Intermap, increment P Corp., NRCAN,Esri Japan, METI, Esri China (Hong Kong), Esri (Thailand), TomTom,
Camp Hall Railroad Build-inNoise and Vibration Analysis
Berkeley County, South Carolina
Job No. 6250-16-0108
Drawn By: BWS
Reviewed By: AR
Date: 05/11/2017
The map shown here has beencreated with all due and
reasonable care and is strictly foruse with Amec Foster Wheelerproject number 6250160108.
Amec Foster Wheeler assumes noliability, direct or indirect,
whatsoever for any such thirdparty or unintended use.
Figure 2. Screening Area Map
!(
!(
1,466'
1,500'
3,200'
Identified Receptor
Grade Crossing
!(
!(
!(
!(
!(
!(
!(
!(
!(
!(
!(
!(
!(
!(
!(
Pete Hill Cir
Dolphin Hill Way
Nebo Ln
Stat
e Rd
S-8-3
09
Mudville Rd
Fish
Rd
US H
wy
176
Camp HallCommerce
Park
a
e
c
b
d
I 0 10.5Miles
LegendCamp Hall Commerce Park
Proposed Rail Centerline
Cross Alignment (750-ft Buffer)
Cross Alignment (1600-ft Buffer)
Screening Area
Named Road
!( Grade Crossings (40)
Receptor Impact Under FTA Criteria
!. No Impact
!. Moderate Impacts
I0 84
Miles
P:\E
nviro
nmen
tal\2
012
+ P
roje
cts\
0108
- P
alm
etto
Rai
lway
s - C
amp
Hal
l Bui
ld-in
\Env
ironm
enta
l Doc
umen
tatio
n &
NE
PA C
ompl
ianc
e\N
oise
& V
ibra
tion\
Noi
se &
Vib
ratio
n\3a
_Ide
ntifi
ed_R
ecep
tors
.mxd
Source: Esri, DigitalGlobe, GeoEye, i-cubed, Earthstar Geographics, CNES/Airbus DS, USDA, USGS, AEX,Getmapping, Aerogrid, IGN, IGP, swisstopo, and the GIS User Community
Sources: Esri, HERE, DeLorme, USGS, Intermap, increment P Corp., NRCAN, Esri Japan, METI, Esri China (HongKong), Esri (Thailand), TomTom, MapmyIndia, © OpenStreetMap contributors, and the GIS User Community
Job No. 6250-16-0108
Drawn By: BWS
Reviewed By: AWC
Date: 05/11/2017
The map shown here has beencreated with all due and
reasonable care and is strictly foruse with Amec Foster Wheelerproject number 6250160108.
Amec Foster Wheeler assumes noliability, direct or indirect,
whatsoever for any such thirdparty or unintended use.
Figure 3a. Identified ReceptorsMap
Camp Hall Railroad Build-inNoise and Vibration Analysis
Berkeley County, South Carolina
!(
!(
!(
!(!(
!(
Schu
ltz L
n
Leach Ln
State Rd S-8-135
State Hwy 311
Cal
amus
Pon
d R
d
Westvaco
Mudville RdPR_01
a
e
c
b
d
I 0 10.5Miles
I0 84
Miles
P:\E
nviro
nmen
tal\2
012
+ P
roje
cts\
0108
- P
alm
etto
Rai
lway
s - C
amp
Hal
l Bui
ld-in
\Env
ironm
enta
l Doc
umen
tatio
n &
NE
PA C
ompl
ianc
e\N
oise
& V
ibra
tion\
Noi
se &
Vib
ratio
n\3b
_Ide
ntifi
ed_R
ecep
tors
.mxd
Source: Esri, DigitalGlobe, GeoEye, i-cubed, Earthstar Geographics, CNES/Airbus DS, USDA, USGS, AEX,Getmapping, Aerogrid, IGN, IGP, swisstopo, and the GIS User Community
Sources: Esri, HERE, DeLorme, USGS, Intermap, increment P Corp., NRCAN, Esri Japan, METI, Esri China (HongKong), Esri (Thailand), TomTom, MapmyIndia, © OpenStreetMap contributors, and the GIS User Community
Job No. 6250-16-0108
Drawn By: BWS
Reviewed By: AR
Date: 11/23/2016
The map shown here has beencreated with all due and
reasonable care and is strictly foruse with Amec Foster Wheelerproject number 6250160108.
Amec Foster Wheeler assumes noliability, direct or indirect,
whatsoever for any such thirdparty or unintended use.
Figure 3b. Identified ReceptorsMap
Camp Hall Railroad Build-inNoise and Vibration Analysis
Berkeley County, South Carolina
LegendCamp Hall Commerce Park
Proposed Rail Centerline
Cross Alignment (750-ft Buffer)
Cross Alignment (1600-ft Buffer)
Screening Area
Named Road
!( Grade Crossings (40)
Receptor Impact Under FTA Criteria
!. No Impact
!. Moderate Impacts

!(
!(!(
!( !(
!(
!(
!(
!(
!(
!(
!(
PR_11
Bolt Dr
Grady Ln
Tam Ln
Willa D
r
Belk C
ir
Hoppy Ln
Red Ash Ln
Dora Way
Cros
s B
ay L
n
Hazel Ln Buffalo Ln
Silv
erfis
h R
d
Leach Ln
Maes Pl
Country Pond Ln
Aussie Way
Dave
s Ln
Chocolate Lab LnB
oat Landing Way
Dogw
ood Ln
Mt Olivet Dr
Mudville Rd
Bolt
Dr
Westvaco
Short Cut Rd
Stat
e H
wy
311
George Wigfall Rd
Ranger Dr
State Hwy 6
PR_10
Jungle Ln
Tam Ln
Silv
erfis
h R
d
Mudville Rd
Dogw
ood Ln
Mudville Rd
Bolt Dr
Westvaco
Short Cut Rd
Stat
e H
wy
311
Geo
rge
Wig
fall
Rd
Ranger DrState Hwy 6
a
e
c
b
d
I
0 10.5Miles
I0 84
Miles
P:\E
nviro
nmen
tal\2
012
+ P
roje
cts\
0108
- P
alm
etto
Rai
lway
s - C
amp
Hal
l Bui
ld-in
\Env
ironm
enta
l Doc
umen
tatio
n &
NE
PA C
ompl
ianc
e\N
oise
& V
ibra
tion\
Noi
se &
Vib
ratio
n\3c
_Ide
ntifi
ed_R
ecep
tors
.mxd
Source: Esri, DigitalGlobe, GeoEye, i-cubed, Earthstar Geographics, CNES/Airbus DS, USDA, USGS, AEX,Getmapping, Aerogrid, IGN, IGP, swisstopo, and the GIS User Community
Sources: Esri, HERE, DeLorme, USGS, Intermap, increment P Corp., NRCAN, Esri Japan, METI, Esri China (HongKong), Esri (Thailand), TomTom, MapmyIndia, © OpenStreetMap contributors, and the GIS User Community
Job No. 6250-16-0108
Drawn By: BWS
Reviewed By: AR
Date: 05/11/2017
The map shown here has beencreated with all due and
reasonable care and is strictly foruse with Amec Foster Wheelerproject number 6250160108.
Amec Foster Wheeler assumes noliability, direct or indirect,
whatsoever for any such thirdparty or unintended use.
Figure 3c. Identified ReceptorsMap
Camp Hall Railroad Build-inNoise and Vibration Analysis
Berkeley County, South Carolina
!(
!(
!(
!(
!(
PR_09
PR_07
PR_02
PR_08c
PR_08b
PR_08a
PR_06c
PR_06b
PR_06aPR_05c
PR_05bPR_05a
PR_04b
PR_03a
PR_04a
PR_03b
PR_04c
Stat
e Hw
y 31
1
Westvaco
State Rd S-8-135
Ranger Dr
LegendCamp Hall Commerce Park
Proposed Rail Centerline
Cross Alignment (750-ft Buffer)
Cross Alignment (1600-ft Buffer)
Screening Area
Named Road
!( Grade Crossings (40)
Receptor Impact Under FTA Criteria
!. No Impact
!. Moderate Impacts

!(
!(
!(
!(
!(
!(
!(!(
Bolt Dr
Rod C
ir
Trojan Rd
Destiny Ln
Tam Ln
Jiminy Ln
Levine Ln
Wiley Ln
Cross Bay L
Hazel Ln
Buffa
lo L
n
Abraham
Ln
Prince Ln
Silverfish Rd
Thirteen Way
Fryes LnEsau Ln
Anaconda Trl
Yeahaw Ln
Destiny Ln
Brooklyn Way
Cubby L
n
Nelson Ave
Abraham Ln
Ced
ar G
rove
Ln
Lizzie Ave
Cou
ntry
Pon
d Ln
Summ
er Hill Ln
Tripette Ln
Aussie Way
Sweatman Deer Trl
Capersfield Ln
Daves Ln
Sandy Oaks LnWeekhaven Ln
Boo Chaw Farm Rd
Lovers Ln
Collins Rd
Smithfield Rd
Dogwood Ln
Holy Ave
Royaleblaze Trl
Colt D
r
AirbourneWay
Bolt Dr St
ate
Rd S
-8-9
71
Anna Ln
Murphy Bay Dr
Gar
dene
rs W
alk
Har
ley
Cir
Eadie Ln
Royalegates Ct
Sprin
g Pl
ains
Rd
Stat
e Rd
S-8
-717
Olympic Dr
State Hwy 45
Blacks Camp Rd
Saint Julian Dr
Trojan Rd
Ranger DrOld Hwy 6
Range
r Dr
State Hwy 45
Shor
t Cut
Rd
State Hwy 6
PR_25a
PR_25b
PR_12aPR_12b
PR_13PR_23a PR_23b
PR_24aPR_24b
PR_26a
PR_26b PR_26c
PR_26d PR_26e
PR_26f
Rod Cir
Bolt Dr
Raj Ln
Felita Ct
Hazel Ln
Fire Ln
Reve
rend
Ln
Buffa
lo L
n
Cubby L
n
Aussie Way
English
RdRustys Way
Smithfield Rd
Hickory Oaks Ln
Colt Dr
Bolt Dr
Anna Ln
Gardeners W
alk
Harley Cir
Eadie Ln
Murphy Bay Dr
Olympic Dr
State Hwy 45
Blacks Camp Rd
Saint Julian Dr
Ranger Dr
Trojan Rd
Range
r Dr
State Hwy 45
Old Hwy 6
Short Cut R
d
State Hwy 6
a
e
c
b
d
I 0 10.5Miles
I0 84
Miles
P:\E
nviro
nmen
tal\2
012
+ P
roje
cts\
0108
- P
alm
etto
Rai
lway
s - C
amp
Hal
l Bui
ld-in
\Env
ironm
enta
l Doc
umen
tatio
n &
NE
PA C
ompl
ianc
e\N
oise
& V
ibra
tion\
Noi
se &
Vib
ratio
n\3d
_Ide
ntifi
ed_R
ecep
tors
.mxd
Source: Esri, DigitalGlobe, GeoEye, i-cubed, Earthstar Geographics, CNES/Airbus DS, USDA, USGS, AEX,Getmapping, Aerogrid, IGN, IGP, swisstopo, and the GIS User Community
Sources: Esri, HERE, DeLorme, USGS, Intermap, increment P Corp., NRCAN, Esri Japan, METI, Esri China (HongKong), Esri (Thailand), TomTom, MapmyIndia, © OpenStreetMap contributors, and the GIS User Community
Job No. 6250-16-0108
Drawn By: BWS
Reviewed By: AR
Date: 05/11/2017
The map shown here has beencreated with all due and
reasonable care and is strictly foruse with Amec Foster Wheelerproject number 6250160108.
Amec Foster Wheeler assumes noliability, direct or indirect,
whatsoever for any such thirdparty or unintended use.
Figure 3d. Identified ReceptorsMap
Camp Hall Railroad Build-inNoise and Vibration Analysis
Berkeley County, South Carolina
!(
!(!(
PR_20
PR_15
PR_21g
PR_21e
PR_21b
PR_19e
PR_19d
PR_19b
PR_18a
PR_17c
PR_17b
PR_16c
PR_16b
PR_14d
PR_14c
PR_22
PR_21f
PR_21dPR_21c
PR_21a
PR_19cPR_19a
PR_18C
PR_18b
PR_17a
PR_16a
PR_14b
PR_14a
Old H
wy 6
State Hwy 6
Harle
y Ci
rRoya
lega
tes
Ct
Abraham
Ln
!(
PR_27j
PR_27i
PR_27h
PR_27g
PR_27fPR_27c
PR_27b
PR_27a
PR_27e
PR_27d
Hickory Oaks Ln
Sandy Oaks Ln
Weekhaven Ln
I 0 0.20.1Miles
I 0 0.50.25Miles
LegendCamp Hall Commerce Park
Proposed Rail Centerline
Cross Alignment (750-ft Buffer)
Cross Alignment (1600-ft Buffer)
Screening Area
Named Road
!( Grade Crossings (40)
Receptor Impact Under FTA Criteria
!. No Impact
!. Moderate Impacts
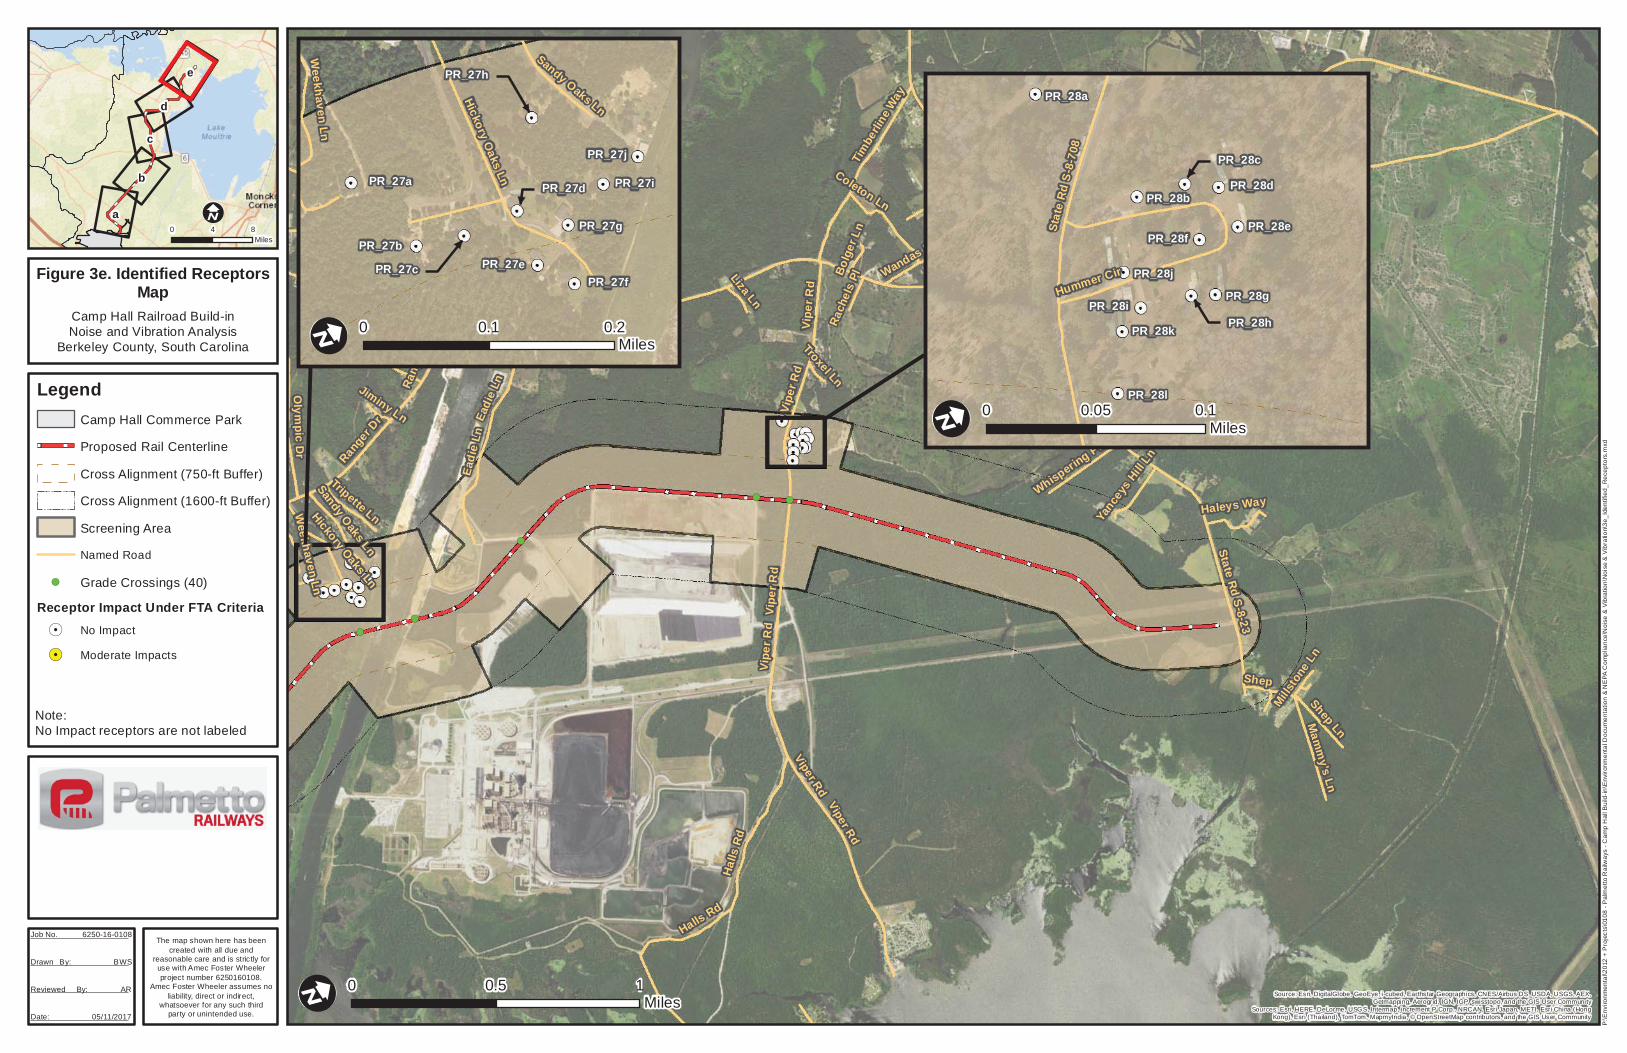
!(
!(
!(
!(
!(
Cros
s St
Rod Cir
Troxel Ln
Shep
Jiminy Ln
Levine Ln
Millst
one
Ln
Bolg
er L
n
Liza Ln
Prin
cess
Ln
Rach
els
Pl
Coleton Ln
Fire
Ln
Ort
ho R
d Sundoe Ln
Caroline Dr
Yanc
eys
Hill L
n
Tripette Ln
Wandas Rd
Haleys Way
Felita Ct
Rustys Way
Sandy Oaks Ln
Whispering Pine Ln
Shep Ln
Mam
my's Ln
Smithfield Rd
Frasier Ln
Murphy Bay Dr
Anna Ln
Vipe
r Rd
Vipe
r Rd
Trojan Rd
Tim
berli
ne W
ay
Oak
land
Dr Thom
as Walters Rd
Rang
er D
r
Eadi
e Ln
Viper Rd
Halls Rd
Springwood R
d
Sand
hill
Rd
State Rd S-8-23
State Hwy 4
5
Duck in Rd
Weekhaven Ln
Hickory Oaks Ln
Olym
pic Dr
Vipe
r Rd
Vipe
r Rd
Trojan Rd
Oakland D
r
Eadi
e Ln
Range
r Dr
Viper Rd
Halls
Rd
Sand
hill
Rd
State Rd S-8-23
State Hwy 45
a
e
c
b
d
I 0 10.5Miles
I0 84
Miles
P:\E
nviro
nmen
tal\2
012
+ P
roje
cts\
0108
- P
alm
etto
Rai
lway
s - C
amp
Hal
l Bui
ld-in
\Env
ironm
enta
l Doc
umen
tatio
n &
NE
PA C
ompl
ianc
e\N
oise
& V
ibra
tion\
Noi
se &
Vib
ratio
n\3e
_Ide
ntifi
ed_R
ecep
tors
.mxd
Source: Esri, DigitalGlobe, GeoEye, i-cubed, Earthstar Geographics, CNES/Airbus DS, USDA, USGS, AEX,Getmapping, Aerogrid, IGN, IGP, swisstopo, and the GIS User Community
Sources: Esri, HERE, DeLorme, USGS, Intermap, increment P Corp., NRCAN, Esri Japan, METI, Esri China (HongKong), Esri (Thailand), TomTom, MapmyIndia, © OpenStreetMap contributors, and the GIS User Community
Job No. 6250-16-0108
Drawn By: BWS
Reviewed By: AR
Date: 05/11/2017
The map shown here has beencreated with all due and
reasonable care and is strictly foruse with Amec Foster Wheelerproject number 6250160108.
Amec Foster Wheeler assumes noliability, direct or indirect,
whatsoever for any such thirdparty or unintended use.
Figure 3e. Identified ReceptorsMap
Camp Hall Railroad Build-inNoise and Vibration Analysis
Berkeley County, South Carolina
Note:No Impact receptors are not labeled
PR_27j
PR_27i
PR_27h
PR_27g
PR_27fPR_27c
PR_27b
PR_27a
PR_27e
PR_27d
Hickory Oaks Ln
Weekhaven Ln
Sandy Oaks Ln
I 0 0.20.1Miles
PR_28l
PR_28k
PR_28j
PR_28h
PR_28f
PR_28dPR_28b
PR_28a
PR_28iPR_28g
PR_28e
PR_28c
Stat
e R
d S
-8-7
08
Hummer Cir
I 0 0.10.05Miles
LegendCamp Hall Commerce Park
Proposed Rail Centerline
Cross Alignment (750-ft Buffer)
Cross Alignment (1600-ft Buffer)
Screening Area
Named Road
!( Grade Crossings (40)
Receptor Impact Under FTA Criteria
!. No Impact
!. Moderate Impacts


