

Application of Argonne's Glass Furnace Modelto Longhorn Glass Corporation Oxy-Fuel Furnace for the Production of Amber Glass
ANL-06/37
Energy Systems Division

Availability of This ReportThis report is available, at no cost, at http://www.osti.gov/bridge. It is also available on paper to the U.S. Department of Energy and its contractors, for a processing fee, from:
U.S. Department of Energy
OfficeofScientificandTechnicalInformation
P.O. Box 62
Oak Ridge, TN 37831-0062
phone (865) 576-8401
fax (865) 576-5728
Disclaimer
This report was prepared as an account of work sponsored by an agency of the United States Government. Neither the United States
Governmentnoranyagencythereof,norTheUniversityofChicago,noranyoftheiremployeesorofficers,makesanywarranty,express
or implied, or assumes any legal liability or responsibility for the accuracy, completeness, or usefulness of any information, apparatus,
product,orprocessdisclosed,orrepresentsthatitsusewouldnotinfringeprivatelyownedrights.Referencehereintoanyspecific
commercial product, process, or service by trade name, trademark, manufacturer, or otherwise, does not necessarily constitute or imply
its endorsement, recommendation, or favoring by the United States Government or any agency thereof. The views and opinions of
documentauthorsexpressedhereindonotnecessarilystateorreflectthoseoftheUnitedStatesGovernmentoranyagencythereof,
Argonne National Laboratory, or The University of Chicago.
About Argonne National Laboratory Argonne is a U.S. Department of Energy laboratory managed by The University of Chicago under contract W-31-109-Eng-38. The Laboratory’s main facility is outside Chicago, at 9700 South Cass Avenue, Argonne, Illinois 60439. For information about Argonne, see www.anl.gov.
Application of Argonne's Glass Furnace Modelto Longhorn Glass Corporation Oxy-Fuel Furnacefor the Production of Amber Glass
ANL-06/37
by B. Golchert, Energy Systems Division, Argonne National LaboratoryJ. Shell, Shell Glass ConsultingS. Jones, Anheuser-Busch Packaging Group
February 2005
work sponsored by U.S. Department of EnergyOffice of Energy Efficiency and Renewable Energy

Application of Argonne’s Glass Furnace Model to Longhorn Glass Corporation Oxy-Fuel Furnace for the Production of Amber Glass
Brian Golchert, Argonne National Laboratory*
Jim Shell, Shell Glass Consulting Susan Jones, Anheuser-Busch Packaging Group
*currently with Fluent, Inc.
ABSTRACT:
The objective of this project is to apply the Argonne National Laboratory’s Glass Furnace
Model (GFM) to the Longhorn oxy-fuel furnace to improve energy efficiency and to investigate
the transport of gases released from the batch/melt into the exhaust. The model will make
preliminary estimates of the local concentrations of water, carbon dioxide, elemental oxygen,
and other subspecies in the entire combustion space as well as the concentration of these species
in the furnace exhaust gas. This information, along with the computed temperature distribution
in the combustion space may give indications on possible locations of crown corrosion. An
investigation into the optimization of the furnace will be performed by varying several key
parameters such as the burner firing pattern, exhaust number/size, and the boost usage (amount
and distribution). Results from these parametric studies will be analyzed to determine more
efficient methods of operating the furnace that reduce crown corrosion. Finally, computed
results from the GFM will be qualitatively correlated to measured values, thus augmenting the
validation of the GFM.
BACKGROUND
One of the limiting parameters to the lifetime of a glass furnace is the integrity of the
refractory material. Caustic species present in the combustion space atmosphere may deposit on
2

the interior walls of the refractory. Once deposited on the wall, the rate of corrosion of the
refractory is relatively high since the furnace is operating at extremely high temperatures.
Recent research has shown that those species that can form OH radicals (primarily potassium and
sodium products) are the most likely agents responsible for crown corrosion. These products are
released from the batch/foam as a result of reactions or melting into the combustion space
atmosphere. Once in the atmosphere, they can react with the combustion products (at high
temperatures) to form OH radicals. Fortunately, the combustion process itself is an unlikely
source of these radicals. However crown corrosion does occur so these radicals must emanate
from the melting process. This work will investigate and evaluate a computational fluid
dynamics model of the Longhorn furnace that accounts for the effect of gases released from the
melting process on the combustion environment in an engineering manner. For the remainder of
this report, these OH generating products will be called the corrosive species. For the Longhorn
glass formulation, it is the sodium species that will contribute to crown corrosion but the general
term ‘corrosive species’ will be used instead.
The concept of ‘coupling’ a combustion space CFD simulation to a code that models the
molten glass flow is not a new idea. However, this concept has been mostly limited to an energy
coupling; the heat flux calculated in the combustion space model is used to drive the glass melt
while the calculated surface temperature is used in the radiative heat transport calculation in the
combustion space computation. In reality, there is significant mass (mostly gas) transport from
the batch/molten glass into the combustion space. For a typical oxy-fuel furnace, the amount of
gas released from the melting process is about 1/3 the total mass flow rate of the incoming
combustion gases.
3

This is an important phenomenon to be modeled since these gases, particulates and volatiles
will be removed from the combustion chamber and hence raise environmental considerations as
well as corrosion consideration. In addition, these released gases have a distinct influence on the
flow field in the combustion space. Argonne’s Glass Furnace Model has been used to model the
effects of the release of gases from the batch and the melt into the combustion space. This work
presents the results using the model to assess the effect of these gases on the combustion space
and on crown corrosion. Additionally, several computational trials have been performed to
determine methods to improve the energy efficiency of the furnace.
INTRODUCTION
The glass industry has recognized that computational fluid dynamics (CFD) simulation can
be an important tool to help improve the performance of glass furnaces. CFD simulations are
being used as a tool to analyze flow characteristics of a glass furnace and find ways to improve
the energy efficiency and reduce pollutant emissions. It has long been recognized that one needs
two separate models in order to build a complete simulation of an industrial glass furnace: one
for the combustion space and one for the molten glass. CFD codes have been used to model the
combustion space [May and Kremer, 1999, Chang, et al., 2000] and the glass-melt flow
[Viskanta, 1994, Kawachi and Iwatsubo, 1999] of a glass furnace, respectively. The early studies
found that the flow fields of the combustion space and glass melt region strongly interact with
each other. The radiation heat transfer from the combustion space drives the glass melt flow
through the melting of the batch and the heating of the liquid glass. Experimentally, it was found
that a significant portion of the spectra of the radiation can penetrate into the glass flow [Vogel,
1994]. Therefore, the coupling of the combustion space and glass melt flows is essential for a
4

realistic modeling of a glass furnace. Preliminary coupled glass furnace simulations have been
attempted [Schnepper, et.al. 1997, Hoke and Marchiando 1998]. These attempts included weak
coupling of the interface with heat balance but they did not include the transfer of gases released
from the melt/batch into the combustion space.
A consortium of glass companies, universities, and Argonne National Laboratory was
formed to develop a rigorous, coupled glass furnace simulation [Golchert et.al. 1999]. The
simulation will include important coupling issues such as batch melting, foam coverage, and
radiation penetration both in the melt and in the combustion space. Argonne’s coupled
simulation also includes a comprehensive treatment of radiation heat transfer and a pollutant
emission model. As the work progressed on this project, it became apparent that there needs to
be a mass (gas) coupling between the melt models and the combustion space model. The first
indication of this need occurred during the preliminary validation of the combustion space
model. Comparisons between the measured gas temperatures and the computed gas
temperatures over the batch region (where a significant portion of gases are released from
melting and chemical reaction) showed that the computed temperatures were significantly higher
at points (over batch logs) when compared to the in-furnace measurements (see Figure 1). This
prompted the investigation of including gas exchange between the two regimes.
5
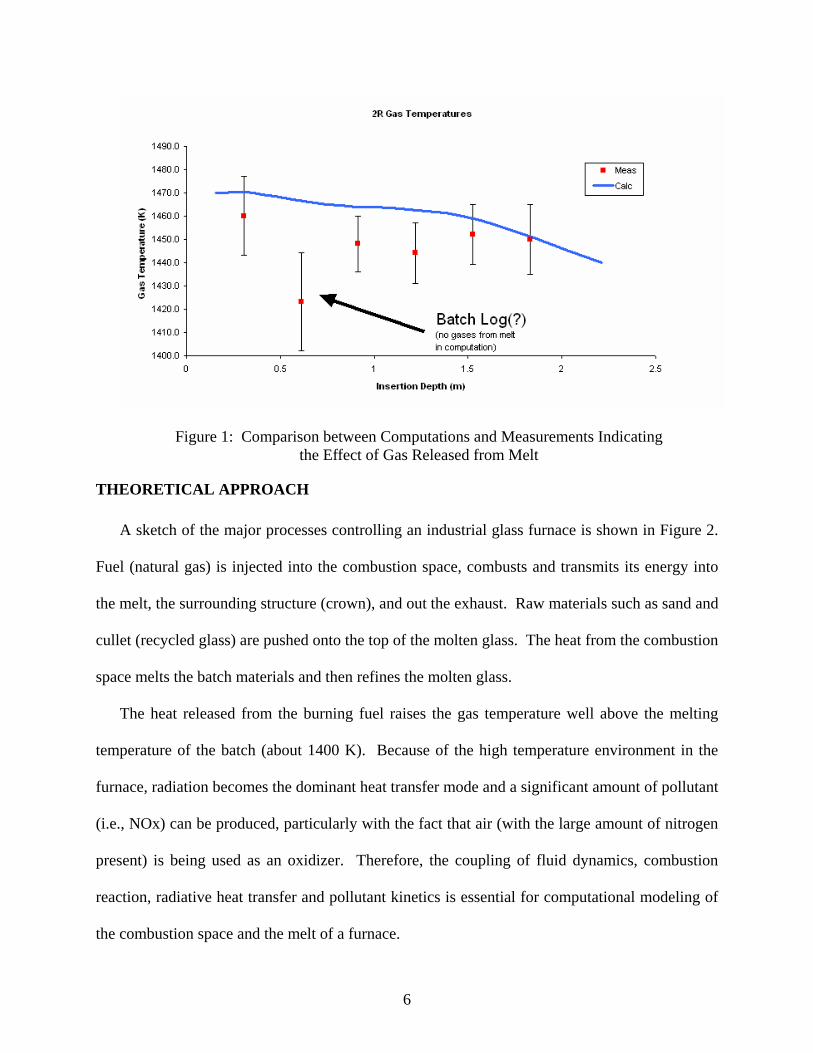
Figure 1: Comparison between Computations and Measurements Indicating the Effect of Gas Released from Melt
THEORETICAL APPROACH
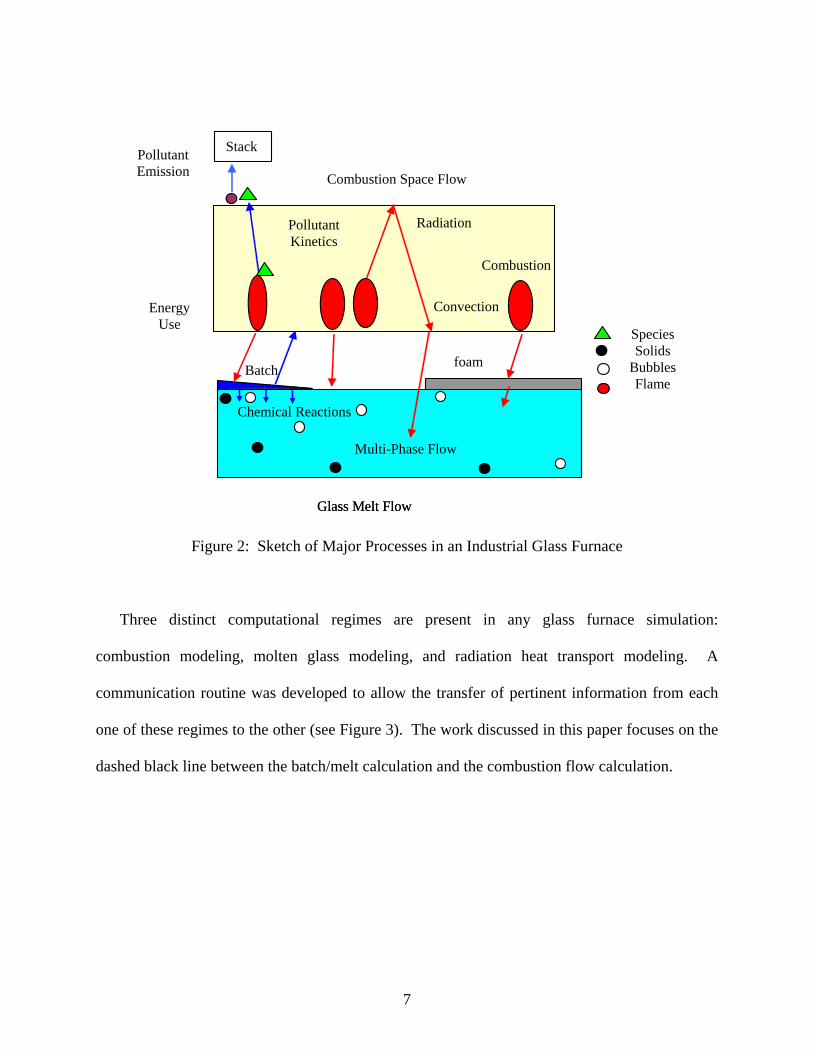
A sketch of the major processes controlling an industrial glass furnace is shown in Figure 2.
Fuel (natural gas) is injected into the combustion space, combusts and transmits its energy into
the melt, the surrounding structure (crown), and out the exhaust. Raw materials such as sand and
cullet (recycled glass) are pushed onto the top of the molten glass. The heat from the combustion
space melts the batch materials and then refines the molten glass.
The heat released from the burning fuel raises the gas temperature well above the melting
temperature of the batch (about 1400 K). Because of the high temperature environment in the
furnace, radiation becomes the dominant heat transfer mode and a significant amount of pollutant
(i.e., NOx) can be produced, particularly with the fact that air (with the large amount of nitrogen
present) is being used as an oxidizer. Therefore, the coupling of fluid dynamics, combustion
reaction, radiative heat transfer and pollutant kinetics is essential for computational modeling of
the combustion space and the melt of a furnace.
6
Species Solids
Bubbles Flame
Glass Melt FlowGlass Melt Flow
Batch foam
Multi-Phase Flow
Chemical Reactions
Combustion Space Flow
Combustion
Pollutant Kinetics
Radiation
Convection
Stack
Energy Use
Pollutant Emission
Figure 2: Sketch of Major Processes in an Industrial Glass Furnace
Three distinct computational regimes are present in any glass furnace simulation:
combustion modeling, molten glass modeling, and radiation heat transport modeling. A
communication routine was developed to allow the transfer of pertinent information from each
one of these regimes to the other (see Figure 3). The work discussed in this paper focuses on the
dashed black line between the batch/melt calculation and the combustion flow calculation.
7

Combustion Flow Calculation
Batch/Glass Melt Flow Calculation
Radiation Heat Flux Calculation
temperature, pressure, species concentrations
net radiation heat loss
interfacial temperature
interfacial heat flux
Gas released from melting/chemical reactions
Figure 3 Iteration Routine for a Furnace Computation
The combustion space is modeled in the GFM using an Argonne developed CFD code,
ICOMFLO, which was created especially to simulate combustion [Chang et.al. 1997]. The code
has been modified specifically for glass furnace combustion. Combustion flow simulation is
very complicated and often plagued by numerical instability problems. ICOMFLO uses a three
step partially de-coupled computational scheme and divides the combustion species into two
groups: major species and subspecies. The three step scheme includes the computations of (1)
combustion hydrodynamics, (2) formation and transport of pollutants, and (3) radiation heat
transfer (absorption). The three computational steps are linked together through an iteration
routine as shown in Figure 3.
Initially, the code computes the major flow properties of the combustion flow in the furnace
by assuming only radiation emission in the chamber. In this step, pressure, temperature, density,
velocity, and species concentrations are locally computed. A combustion model of the major
8

species is needed in this step to establish an initial temperature field. Next, a kinetic model of
the subspecies is used to calculate the formation and transport of the subspecies based on the
semi-converged major flow properties computed in the first step. Then, a radiation heat transfer
model is used to calculate local net radiation heat flux (the balance of emission and absorption)
based on the temperature and pressure calculated in the first step and the species concentrations
calculated in the second step. The radiation participating media in a glass furnace include carbon
dioxide, water vapor, and soot in the combustion space and glass in the glass melt flow. Since
radiative emission and absorption of these media depend strongly on wavelength of the radiation,
a spectral radiation heat transfer model is used. In the flow field calculations, the emission of
radiation is determined each iteration. Absorption is only calculated infrequently since this
computational process is very time consuming and the computational results do not change very
much once the flow field settles down. Calculation of convective heat transfer to boundaries in
the combustion is part of flow calculation and is also done in every iteration.
Gas Release Approximation
As was mentioned previously, the existing ‘coupled’ models do not take into account the
gases released from the chemical reactions in the melt/batch on the flow field inside the
combustion space. Since there is a presently an incomplete set of chemical data available to
explicitly model the gas release, several approximations were used. In order to test out the effect
of the transport of gas from the melt to the combustion space, a simplified model was developed.
To determine the total amount of gases leaving the melt/batch and entering the combustion
space, the difference between the charging rate (the amount of sand and cullet inserted into the
furnace) and the pull rate (the amount of liquid glass leaving the furnace) was approximated
from industrial estimates [Jian, 2002]. In general, this difference is around 10-15% of the pull
9
rate. Thus, a significant amount of mass (gas) is leaving the melt and entering the combustion
space. For some furnace types, this exchanged gas can amount up to 35% of the flow rate of fuel
and oxidizer.
The above approximation helps quantify the amount of gas released but it does not define
where the gas leaves the melt space and enters the combustion space. This transport of gas can
occur from the batch to the combustion space and from the melt (through bursting of bubbles) to
the combustion space. The fraction of the total gas released from the batch into the combustion
space is not known. For this work, it is assumed that half of the gas released will come off over
the batch and the other half will come off over the melt. These gases will enter the combustion
space at different temperatures. The gases released over the batch will enter the combustion
space at approximately the melting temperature of the batch. The gases released through the
bursting of the bubbles will come out at the molten glass temperature. This value will be fixed
for this work. Again, in reality, the temperature can be computed since the local glass
temperature is known.
Once the location of the gas released has been set, the GFM code can track these gases
throughout the combustion space. From the work done at Sandia/Penn State, it was found that
crown corrosion depends on the corrosive species concentration as well as the local refractory
wall temperature. By assuming the gases released from the melt contain a uniform mass fraction
of these corrosive species, one can model the transport of these species throughout the
combustion space. To the first order, the concentration of these species will give indications as
to the locations of higher probability of crown corrosion. Since the GFM is an engineering code
and does not model the details of the individual refractory bricks, one can only qualitatively use
the species concentrations as an indicator of crown corrosion. Instead, one can see how different
10
operating conditions will affect the flow patterns inside the combustion space and thus affect the
corrosive species concentrations. Indirectly, one can then see the effect of operating conditions
on crown corrosion. In reality, most of the corrosive radicals come from reaction of the
corrosive species with the products of combustion. A small amount of corrosive radicals may
enter the furnace with the natural gas and oxidizer.
DESCRIPTION OF BASE CASE STUDIED
To make the model more tractable, several other assumptions were made. It was assumed
that all of the fraction of the gas released over the batch would be released uniformly in that
region as would the gases released over the foam region. Further, this gas will be released into
the combustion space at the melting temperature of the batch or at a preset value of the molten
glass. Finally, an assumed batch shape and foam coverage was used. This batch shape and foam
distribution was determined from melt calculations and from reported observations in the
furnace. In addition, it is assumed that the species concentration will be the dominating variable
in crown corrosion so the effect of crown temperature will be neglected. It is fully realized that
crown corrosion DOES depend on crown temperature but given the workscope of this project,
the main focus is on the effect of the concentration of the corrosive species.
The exact furnace dimensions and operating conditions are not presented to protect
proprietary interests. There are seven burners on one side of the furnace and six on the other.
Most of these burners are staggered so that they do not oppose each other (See Figure 4). Each
burner is a staged burner with a tube-in-tube burner with natural gas entering on the inner tube
and relatively pure oxygen entering on the outer tube above a slot that has relatively pure oxygen
entering below. The tube-in-tube portion of the burners are designed to run fuel rich in order to
11
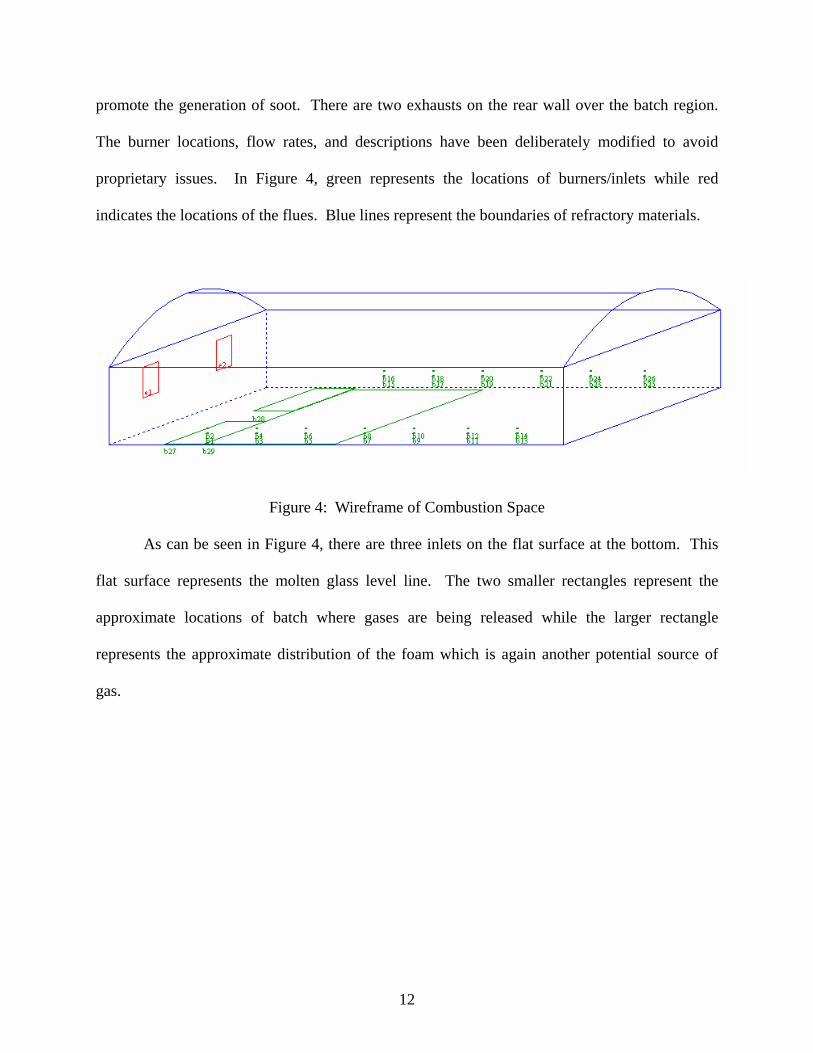
promote the generation of soot. There are two exhausts on the rear wall over the batch region.
The burner locations, flow rates, and descriptions have been deliberately modified to avoid
proprietary issues. In Figure 4, green represents the locations of burners/inlets while red
indicates the locations of the flues. Blue lines represent the boundaries of refractory materials.
Figure 4: Wireframe of Combustion Space
As can be seen in Figure 4, there are three inlets on the flat surface at the bottom. This
flat surface represents the molten glass level line. The two smaller rectangles represent the
approximate locations of batch where gases are being released while the larger rectangle
represents the approximate distribution of the foam which is again another potential source of
gas.
12
RESULTS AND DISCUSSION
Results are presented primarily in the form of color density plots over two dimensional
cuts through the furnace for variables of interest, such as temperature or species concentration.
The plots were generated using the postprocessor in the GFM software.
A base case result, Figure 5, shows the results of the temperature for the case where there
is no gas release from the batch/foam areas. For all of the following figures, the scales have been
normalized to prevent disclosure of proprietary information. All of the scales for similar
parameters (temperature, velocity, etc.) have been normalized by the same factor so one can
compare figures to determine trends and differences. In figure 5 (and all other figures), one is
looking at the computed gas temperatures in the furnace along three cutaways. The lower left
cutaway (the largest one) is looking ‘down’ on the furnace in the plane of the burners. Above
that image is the cutaway if one were looking at the side of the furnace while the cutaway on the
right is what one were looking at the furnace from an end. The position of the cut planes may
vary depending on the features of the flow that are relevant for the discussion, often, the cut
through the plane of the burners. The cut plane positions are shown on each axis with a tic mark
that extends to the rectangle of the plot. In Figure 5, one sees distinct flame regions. The area
over the batch (the front end of the furnace on the left of the figure) is warmer since the flow
field carries the heat from the flames towards the exhaust.
A comparison of the calculated temperatures with measurements from the Longhorn
furnace indicates that the calculated temperatures are about 200o K higher than measurements.
This is due to the fact that the gases released from the batch reactions are at a much cooler
temperature than the combustion gases. The addition of this large mass of cooler gas has the
13
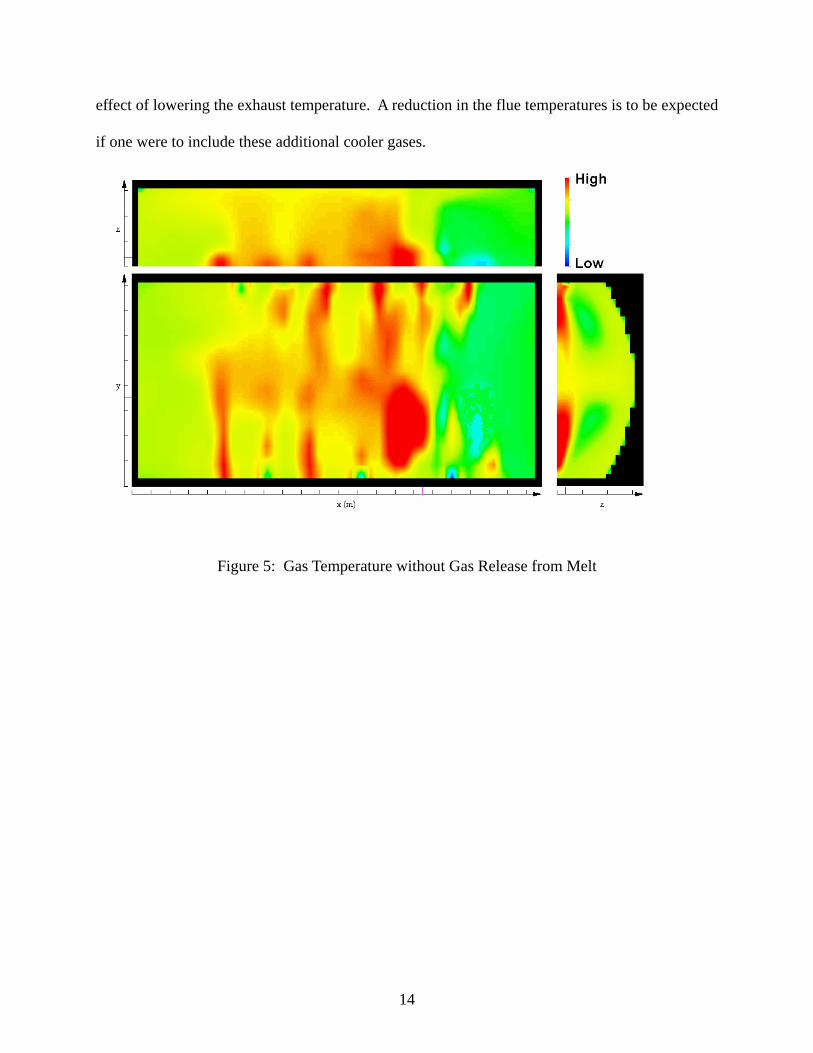
effect of lowering the exhaust temperature. A reduction in the flue temperatures is to be expected
if one were to include these additional cooler gases.
Figure 5: Gas Temperature without Gas Release from Melt
14
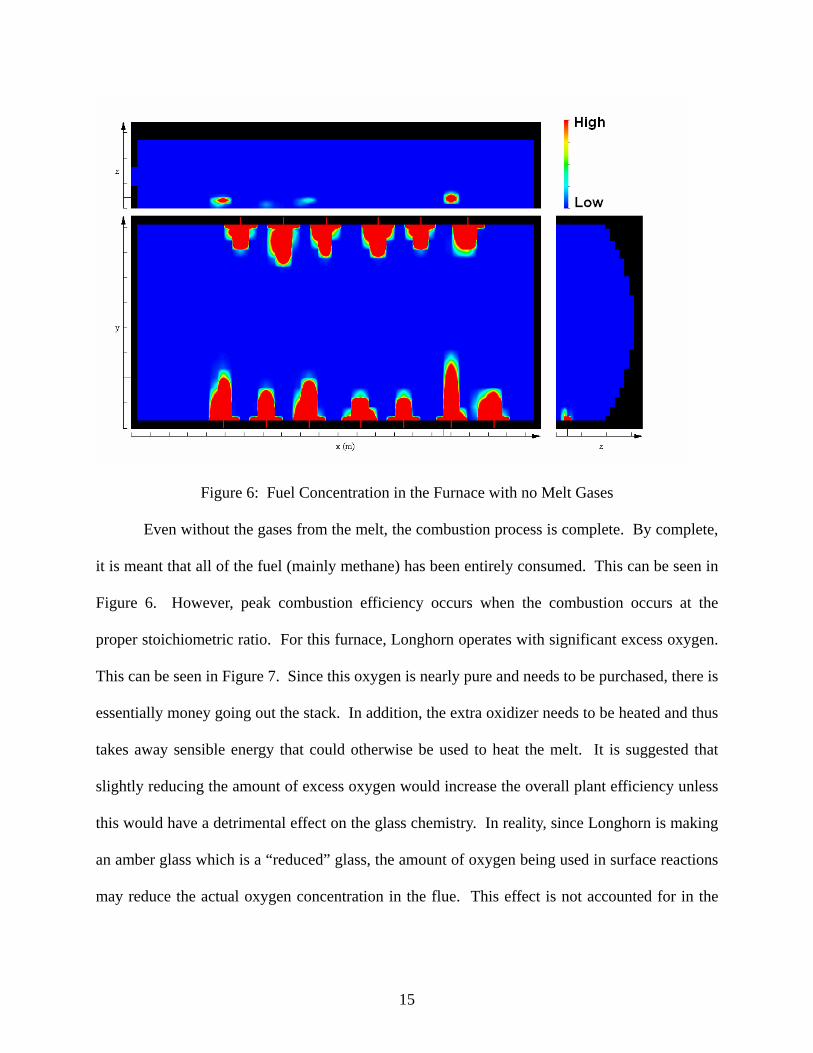
Figure 6: Fuel Concentration in the Furnace with no Melt Gases
Even without the gases from the melt, the combustion process is complete. By complete,
it is meant that all of the fuel (mainly methane) has been entirely consumed. This can be seen in
Figure 6. However, peak combustion efficiency occurs when the combustion occurs at the
proper stoichiometric ratio. For this furnace, Longhorn operates with significant excess oxygen.
This can be seen in Figure 7. Since this oxygen is nearly pure and needs to be purchased, there is
essentially money going out the stack. In addition, the extra oxidizer needs to be heated and thus
takes away sensible energy that could otherwise be used to heat the melt. It is suggested that
slightly reducing the amount of excess oxygen would increase the overall plant efficiency unless
this would have a detrimental effect on the glass chemistry. In reality, since Longhorn is making
an amber glass which is a “reduced” glass, the amount of oxygen being used in surface reactions
may reduce the actual oxygen concentration in the flue. This effect is not accounted for in the
15
GFM.
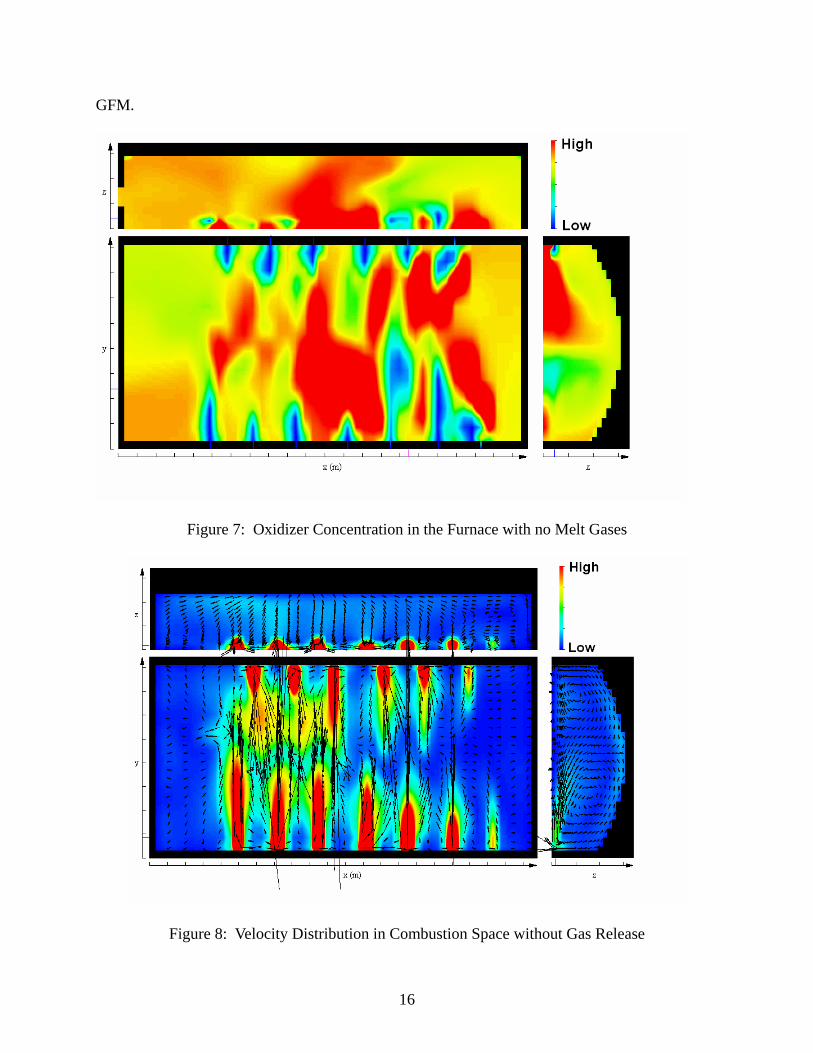
Figure 7: Oxidizer Concentration in the Furnace with no Melt Gases
Figure 8: Velocity Distribution in Combustion Space without Gas Release
16

As will be seen later, the velocity distribution inside the furnace essentially controls the
transport of the species. In particular, this vector field will dictate where the corrosive radicals
released from either combustion or from batch gases will go inside the furnace and will thus
determine, in part, the location of crown corrosion.
Figure 9: Corrosive Species Distribution in Combustion Space without Gas Release
Figure 9 shows that there is very little corrosive species inside the furnace.. This implies
that there is little crown corrosion caused by the corrosive radicals created from the combustion
process. Once the corrosive radicals are produced, they are quickly dispersed throughout the
combustion volume thus further reducing the corrosion effects.
As was mentioned earlier, the initial exhaust temperature calculated was too high when
compared to the furnace measurements. A series of cases were simulated in order to determine
what gas release temperature and location would be necessary to reduce this flue temperature to
17

near normal values. Initially, it was assumed that all of the batch gas was released over the batch
at approximately the batch melting temperature. This assumption reduced the flue temperature
far too much. Then it was assumed that half of the batch gases were released over the batch and
that the other half was released at the approximate foam locations. This improved the results but
the calculated flue temperatures were still too low. Then, it was realized that the batch gas
entrained in the molten glass (as bubbles) would quickly achieve local thermal equilibrium with
the molten glass. This led to the final assumptions that half of the gas was released over the
batch areas at the batch melting temperature while the other half is released over the foam
regions at the approximate temperature of the local molten glass. These assumptions resulted in
calculated flue temperatures that were within a couple percent of measured flue temperatures.
The computed temperature distribution is shown in Figure 10.
Figure 10: Gas Temperature Distribution with Gas Release
18

Figure 11: Fuel Concentration with Gas Release
As can be seen in Figure 11, the inclusion of the batch gases does not have an appreciable
effect on the total consumption of the fuel. Effectively, all of the fuel is consumed in the region
of the burners due to the high concentrations of oxidizer. This was to be expected. However,
Figure 12 shows that there has been a change in the oxidizer distribution when one incorporates
the gases from the batch. There is a smaller concentration of oxidizer in the flue regions. This is
due to the fact that the inclusion of the batch gases in this region dilutes the total mass
concentration of the oxidizer. In addition, these batch gases change the flow field inside the
combustion space so that there is a strong recirculation zone that keeps much of this excess
oxygen in the burner regions. Figure 13 shows the strong recirculation zone in the middle region
of the burners. This zone is less pronounced in the simulation that does not include the batch.
The effect of this recirculation zone is that the oxygen is kept to the ‘left’ of the furnace.
19

Figure 12: Oxidizer Concentration inside the Combustion Space including Gas Release
Figure 13: Velocity Field Magnitude and Direction including Batch Gases
20

Figure 14: Corrosive species distribution inside the furnace
Figure 14 shows the computed transport of the corrosive species released from the
batch/foam. These species are concentrated over the batch region due to the velocity field
generated in this furnace. This would imply that there is a higher likelihood that there will be
crown corrosion in the first quarter of the furnace, particularly over the foam regions. .
According to the literature, high radical concentrations coupled with higher crown temperature
lead to more corrosion. Figure 15 is a replotting of Figure 14 except that the velocity field is
superimposed onto the corrosive species concentration. This figure makes it quite clear that the
flow of combustion gases inside the furnace essentially controls the transport of corrosive
species and thus controls the effect of crown corrosion.
21
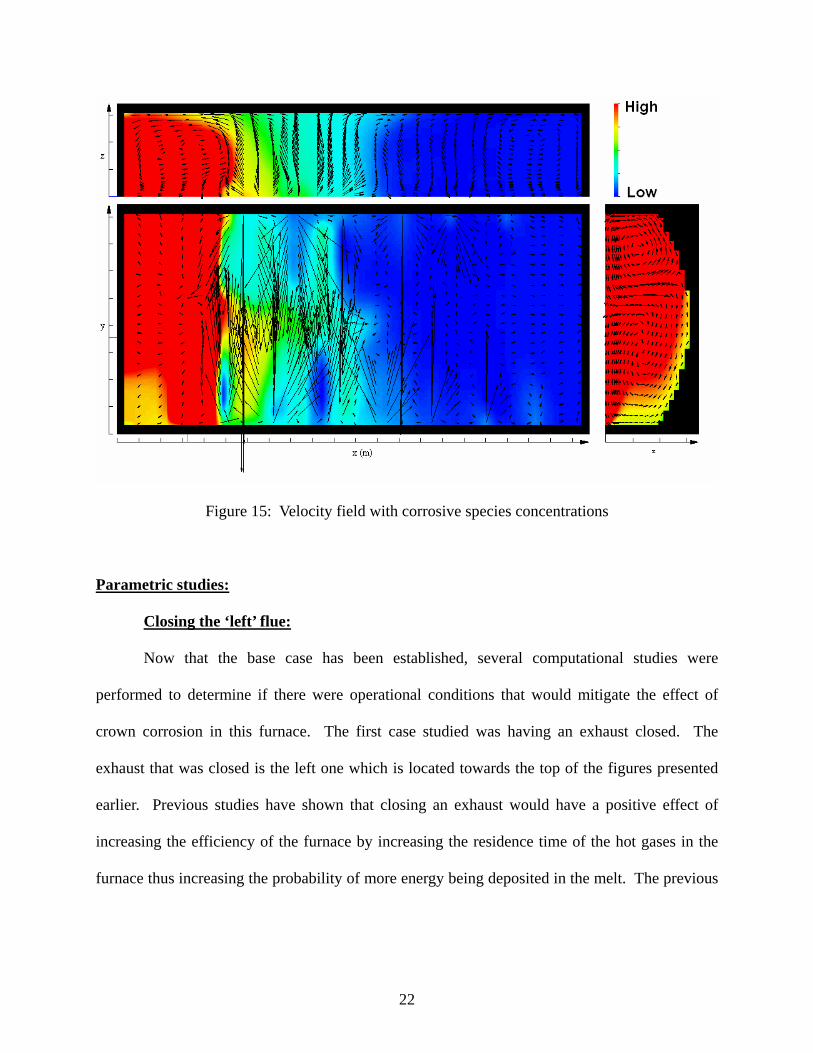
Figure 15: Velocity field with corrosive species concentrations
Parametric studies:
Closing the ‘left’ flue:
Now that the base case has been established, several computational studies were
performed to determine if there were operational conditions that would mitigate the effect of
crown corrosion in this furnace. The first case studied was having an exhaust closed. The
exhaust that was closed is the left one which is located towards the top of the figures presented
earlier. Previous studies have shown that closing an exhaust would have a positive effect of
increasing the efficiency of the furnace by increasing the residence time of the hot gases in the
furnace thus increasing the probability of more energy being deposited in the melt. The previous
22

case studied involved the exhausts being located on the same walls as the burners which is not
the case here.
Figure 16: Fuel concentration with the lower exhaust closed.
As was seen in the earlier plots, Figure 16 shows that all of the fuel is consumed inside the
furnace. However, with the closing of this exhaust, one sees that there is further penetration of
the fuel into the furnace by those burners closest to the exhaust. The reason for this is that
closing one of the exhausts changes the flow field inside the furnace thus allowing for further
penetration of the fuel.
23

Figure 17: Oxidizer Concentration with one exhaust closed
Again, as was seen previously, the oxygen concentration is diluted over the batch regions and
concentrated towards the ‘left’ of the furnace. This is an end result of the changed flow field
from the addition of the batch gases and the closing of one exhaust. Figure 18 shows the flow
field inside the furnace. With the closing of the exhaust, there is a smaller area for the same
amount of gases to escape from the furnace so the corresponding velocities are higher. This can
be seen in Figure 18 by the generally brighter colors (indicating higher velocities) as opposed to
the slightly darker colors in Figure 13.
24

Figure 18: Gas Velocities in the Furnace with an Exhaust Closed.
Figure 19: Corrosive species concentration in Furnace with One Exhaust Closed
25

One of the positive effects of closing this exhaust is that it concentrates the corrosive species
over the batch area because the flow field needs to adjust to account for the closing of the upper
exhaust. This has the effect of increasing the velocity and directing the flow of the velocity over
the batch and out the flue. Since this is occurring at lower temperatures than in the central
portion of the furnace, it can be expected that there will be less crown corrosion than in previous
cases. However, there might be additional corrosion in the flue itself. Figure 20 shows how the
velocity field ‘drags’ the corrosive species released over the batch out the bottom flue.
Figure 20: Corrosive species concentration with the velocity vector field with the top exhaust
closed
Figure 21 shows the gas temperature distribution inside the furnace. By comparing this
temperature field with the base case temperature field, one notices that these temperatures tend to
be a little higher since the gases need to spend a longer time inside the furnace. These higher
26

temperatures will increase the radiative heat transfer to the melt and should increase the total
efficiency of the furnace.
Figure 21: Gas temperature with the top flue closed
Making the exhausts smaller
The next case studied was to drop the height of the flue for both flues. This has the effect
of reducing the total flow area for the same gas mass flow so it is expected that the
corresponding velocities in the furnace will be slightly higher. The height from the glass line to
the bottom of the furnace is kept the same as in previous cases, just the height was lowered. This
was done since previous studies have shown that lowering the flues will increase the efficiency
of a furnace. This is due to the fact that hot gas rises so a lower flue will remove cooler gases.
Figure 22 shows the flow field inside the furnace. Gas velocities are higher in furnaces with
smaller exhaust ports.
27

Figure 22: Flow field inside furnace with smaller exhausts
For this case, Figure 23 shows that corrosive species concentration inside the furnace actually
decreases, in general. This is caused by the increased velocities in the regions near the flues and
this helps pull those radicals out of the furnace before they have a chance to cause corrosion.
Looking closely at the top of Figure 23, one can see that the concentration near the crown is
significantly reduced. Because of this reduction, one can expect even further reduction in crown
corrosion with the smaller flue sizes. Figure 24 shows that the average temperature in the
furnace has decreased slightly and this will also help reduce the effect of corrosion.
28

Figure 23: Corrosive species concentration inside the furnace with closed exhausts
Figure 24: Temperature field inside furnace with closed exhausts
29

Flipping first and last set of burners:
The initial operating conditions prescribed the first burner on each side to have a
relatively high fuel/oxidizer loading while the last burner on each side had a much lower flow
rate. This trial flipped the flow rates for these burners so that the first burner will have a much
more reduced flow while the last burner on each side would have a much higher flow rate. All of
the fuel is again consumed in this firing pattern, mainly due to the amount of excess oxygen
present in the furnace. Figure 25 shows the local fuel concentration and by inspection, one can
see the increased amount of fuel at the right of the figure. A brighter red indicates higher fuel
concentrations.
Figure 25: Fuel concentration with flipped burners
30
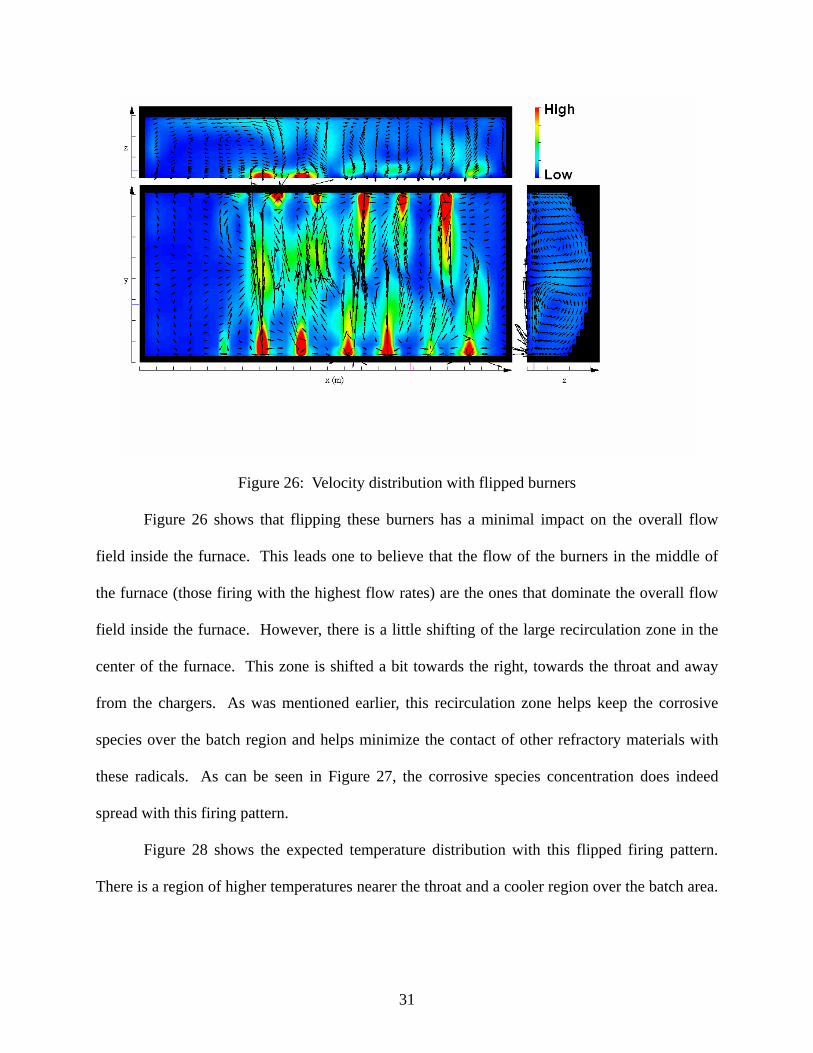
Figure 26: Velocity distribution with flipped burners
Figure 26 shows that flipping these burners has a minimal impact on the overall flow
field inside the furnace. This leads one to believe that the flow of the burners in the middle of
the furnace (those firing with the highest flow rates) are the ones that dominate the overall flow
field inside the furnace. However, there is a little shifting of the large recirculation zone in the
center of the furnace. This zone is shifted a bit towards the right, towards the throat and away
from the chargers. As was mentioned earlier, this recirculation zone helps keep the corrosive
species over the batch region and helps minimize the contact of other refractory materials with
these radicals. As can be seen in Figure 27, the corrosive species concentration does indeed
spread with this firing pattern.
Figure 28 shows the expected temperature distribution with this flipped firing pattern.
There is a region of higher temperatures nearer the throat and a cooler region over the batch area.
31
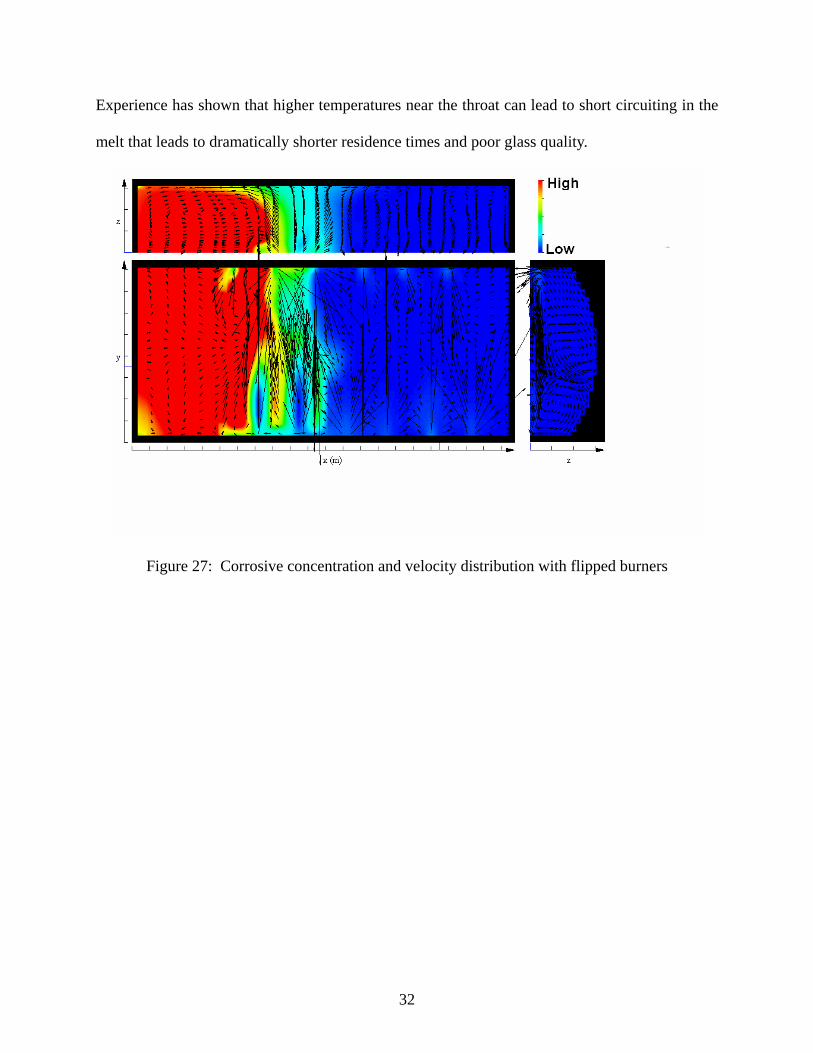
Experience has shown that higher temperatures near the throat can lead to short circuiting in the
melt that leads to dramatically shorter residence times and poor glass quality.
Figure 27: Corrosive concentration and velocity distribution with flipped burners
32
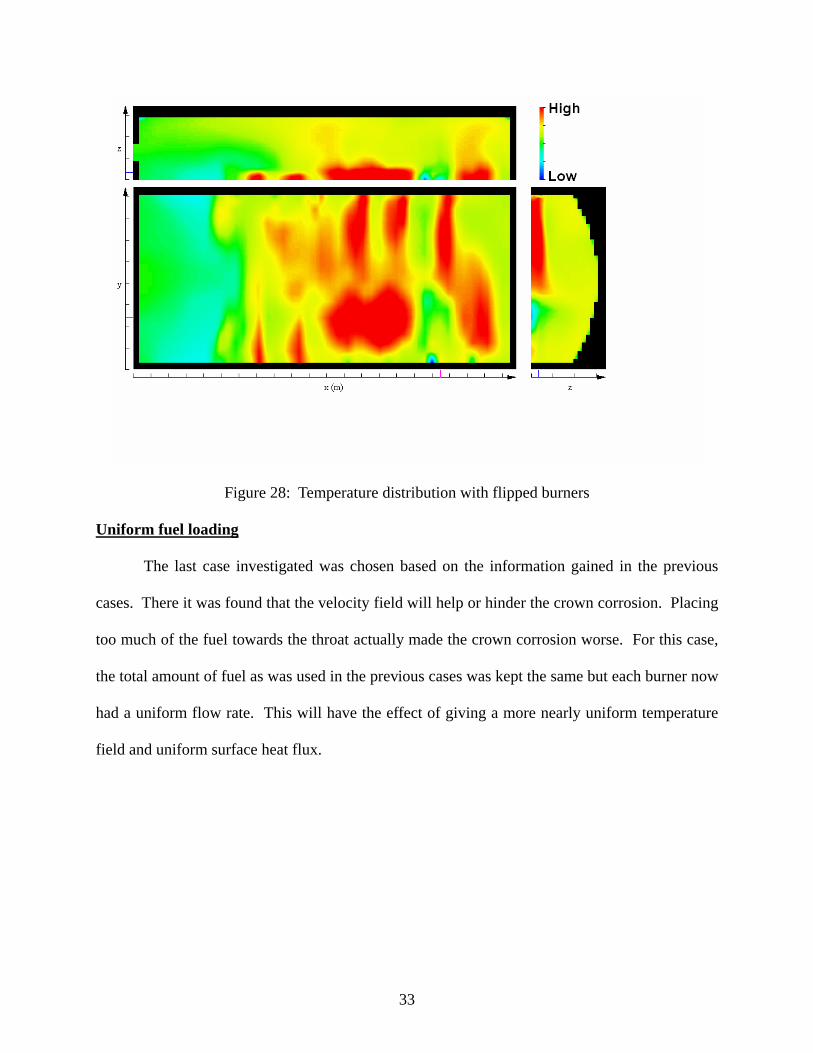
Figure 28: Temperature distribution with flipped burners
Uniform fuel loading
The last case investigated was chosen based on the information gained in the previous
cases. There it was found that the velocity field will help or hinder the crown corrosion. Placing
too much of the fuel towards the throat actually made the crown corrosion worse. For this case,
the total amount of fuel as was used in the previous cases was kept the same but each burner now
had a uniform flow rate. This will have the effect of giving a more nearly uniform temperature
field and uniform surface heat flux.
33

Figure 29: Velocity field for uniform fuel loading
One can see the near uniform velocity field (around the burners) for this case. However, closer
inspection shows that the burners penetrate the combustion space differently and that there is still
a recirculation zone around the second or third burner. For this case, the recirculation zone is
less pronounced than in the previous cases due to the fuel/oxidizer loading.
34
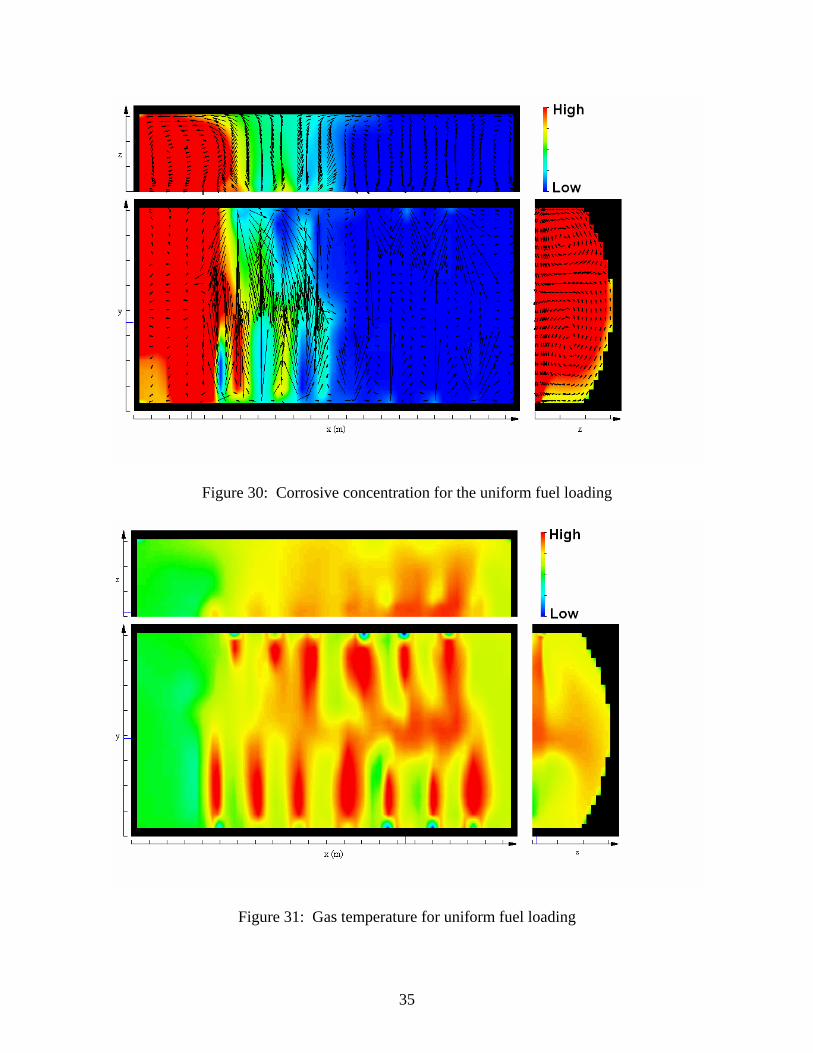
Figure 30: Corrosive concentration for the uniform fuel loading
Figure 31: Gas temperature for uniform fuel loading
35
Figure 30 shows that this fuel loading does reduce some of the corrosive species concentration in
a manner similar to that of the closed exhaust. If one couples this information with the
temperature distribution (shown in Figure 31), one can see that the lower temperatures
correspond to lower corrosion rates. One may conclude that this operational condition would
reduce the possibility of crown corrosion in most regions in the furnace. The higher
concentrations of corrosive species around the batch areas still suggest that this is the most likely
location for corrosion to occur.
Sample melt calculation
Due to the limited funding for this work, the major emphasis was on the analysis of the
combustion space. If time and support were available, one could investigate the effects of these
operating conditions on the melt flow field. In fact, preliminary sensitivity studies were
performed to look at the effect of varying the electric boost on the melt flow field.
Unfortunately, the total changes in energy for these distributions were too small to be noticed on
the relatively coarse grid used for this project.
However, for completeness the base case melt was modeled. This was done to ensure
that there was a proper energy balance and to get some idea of the batch shape. Energy balance
was assured when the throat temperatures in the melt were within 1% of the measured throat
temperatures in the Longhorn furnace. Figure 32 shows the melt temperature distribution in the
furnace while Figure 32 shows the velocity field. As expected, the highest temperatures were
near the surface while the highest velocities were in the throat region. Incidentally, one can
correlate molten glass velocities with refractory wear below the metal line.
36

Figure 32: Melt temperature field for the base case
Figure 33: Melt velocity field
37
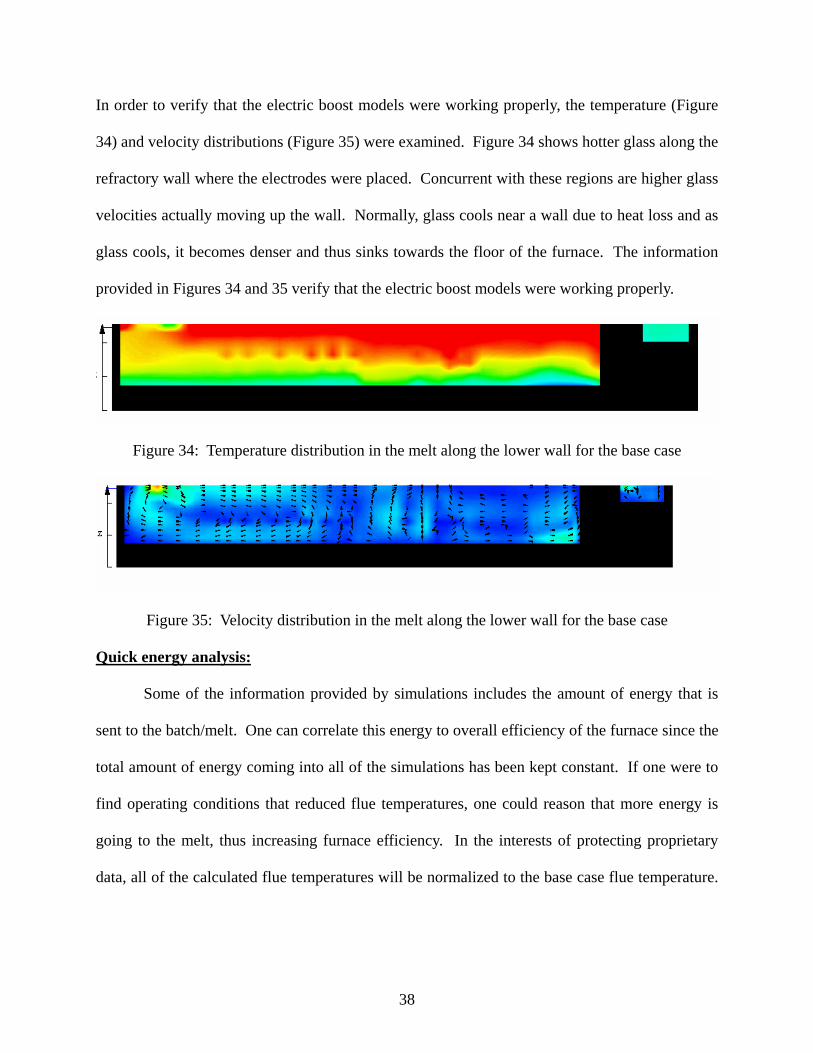
In order to verify that the electric boost models were working properly, the temperature (Figure
34) and velocity distributions (Figure 35) were examined. Figure 34 shows hotter glass along the
refractory wall where the electrodes were placed. Concurrent with these regions are higher glass
velocities actually moving up the wall. Normally, glass cools near a wall due to heat loss and as
glass cools, it becomes denser and thus sinks towards the floor of the furnace. The information
provided in Figures 34 and 35 verify that the electric boost models were working properly.
Figure 34: Temperature distribution in the melt along the lower wall for the base case
Figure 35: Velocity distribution in the melt along the lower wall for the base case
Quick energy analysis:
Some of the information provided by simulations includes the amount of energy that is
sent to the batch/melt. One can correlate this energy to overall efficiency of the furnace since the
total amount of energy coming into all of the simulations has been kept constant. If one were to
find operating conditions that reduced flue temperatures, one could reason that more energy is
going to the melt, thus increasing furnace efficiency. In the interests of protecting proprietary
data, all of the calculated flue temperatures will be normalized to the base case flue temperature.
38

Table 1 shows the normalized flue temperature for all of the cases analyzed. Note that only the
lower flue temperatures are being compared since one case has the upper flue closed.
Case Normalized temperature
Base 1.00 No batch gas 1.11
Top exhaust closed 1.03 Smaller exhausts 1.02 Burners flipped 0.98
Uniform fuel loading 0.99 Table 1: Normalized Flue Temperatures for All Cases
Table 1 indicates that the cases with the uniform loading and with the flipped burners will be
more efficient since the amount of energy going out of the flue is less than in the base case.
However, one needs to couple the fact that the flipped burner case actually increases the
probability of crown corrosion. This means that the uniform loading case, of all of the cases
considered, would improve furnace operations from a fuel efficiency/crown corrosion
perspective. However, a fully coupled analysis including the melt space needs to be performed
for all of these cases before a final determination can be made.
CONCLUSION
It was shown in this work that the gases released from the batch materials have a significant
impact on the combustion space flow field. These gases cool down the combustion gases in
those areas in which they are released and they alter the flow field inside the chamber. To create
a complete simulation of an industrial glass furnace, this effect must be accounted for in detail.
The current work demonstrates, in a very simplistic manner, the need for this interchange. Once
this release has been determined, one can model the transport of the corrosive species that affect
crown corrosion. This work has shown that, in addition to the temperature and corrosive species
39

concentrations, the combustion space velocity field may have a strong impact on the crown
corrosion.
ACKNOWLEDGMENTS
This work was supported by DOE Office of Energy Efficiency and Renewable Energy, the
Industrial Technologies Program. The authors would also like to acknowledge the help and
assistance from the personnel at Longhorn Glass Corporation.
40

REFERENCES:
Chang, S.L., S.A. Lottes, and M. Petrick, 1997, Multiphase Integral Reacting Flow Computer Code (ICOMFLO): User's Guide, Argonne/MHD-97/01, Nov.
May, F., and H. Kremer, “Mathematical Modeling of Glass Melting Furnace Design with Regard to NOx Formation,” Glastech. Ber. Glass Sci. Technol. 72, No.1 (1999).
Chang, S.L., B. Golchert, and M. Petrick, “Numerical Analysis of CFD-Coupled Radiation Heat Transfer in A Glass Furnace,” No. 12084, Proceedings of the 34th National Heat Transfer Conference, Pittsburgh, Penn. (August 20-22, 2000).
Viskanta, R., “Review of Three-Dimensional Mathematical Modeling of Glass Melting,” Journal of Non-Crystalline Solids, 177:347-362 (1994).
Kawachi, Shinji, and Yoshio Iwatsubo, “Diagnosis and Treatment of Bubbles in Glass Production Using a Numerical Simulator,” Glastech. Ber. Glass Sci. Technology, Vol. 72, No. 7, 207-213 (1999).
Vogel, Werner, Glass Chemistry, 2nd Edition, Springer-Verlag, Berlin, 1994 Schnepper, Carol, Benjamin Jurcik, Christel Champinot, and Jean-Francois Simon, “ Coupled
Combustion Space-Glass Bath Modeling of a Float Glass Melting Tank Using Full Oxy- Combustion,” Proceedings of the Fifth International Conference on the Advances in Fusion and Processing of Glass, Toronto, Canada (July 27-31, 1997).
Hoke, Bryan C., and Robert D. Marchiando, “Using Computational Fluid Dynamics Models to Assess Melter Capacity Changes when Converting to Oxy-Fuel,” Proceedings of 18th International Congress on Glass, San Francisco, Cal. (July 1998).
Golchert, B., S.L. Chang and M. Petrick, “A Consortium Approach to Glass Furnace Modeling,” ICAST 99 Proceedings, the 15th International Conference on Advanced Science and Technology at Argonne National Laboratory, 3 April 1999, pp. 152-162.
Golchert, B., S.L. Chang, C.Q. Zhou, and M. Petrick, “Validation of the Combustion Space Simulation of a Glass Furnace Simulator,” IMECE 2001, Nov. 11-16, 2001, New York, NY.
Chang, S.L., and S.A. Lottes, Numerical Heat Transfer Part A, 24(1):25-43 (1993) Kennedy, I., “Models of Soot Formation and Oxidation,” Prog. Energy Combust. Sci., 23:95-132
(1997). Fairweather, M., W.P. Jones, and R.P. Lindstedt, “Predictions of Radiative Transfer from a
Turbulent Reacting Jet in a Cross-Wind,” Combustion and Flame, 89:45-63 (1992). Nicol, D.G., P.C. Malte, A.J. Hamer, R.J. Roby, and R.C. Steele, “Development of a Five-Step
Global Methane Oxidation-NO Formation Mechanism for Lean-Premixed Gas Turbine Combustion,” International Gas Turbine & Aeroengine Congress & exhibition, 98-GT-185, Stockholm, Sweden (June 2-June 5, 1998).
Chang, S.L., B. Golchert, C.Q. Zhou, and M. Petrick, “An Investigation of the Effects of Firing Patterns on Heat Transfer and NOx Formation in a Glass Furnace,”National Heat Transfer Conference, Anaheim, CA, June (2001)
Chang, S.L., and K.T, Rhee, “A Useful Integral Function and Its Application in Thermal Radiation Calculations,” International Communications in Heat and Mass Transfer, 10:329-333 (1983).
Balakrishnan, A., and D.K. Edwards, “Radiative Flame Cooling for Reduction of Nitric Oxide Emission,” ASME Trans., J. of Heat Transfer, 96:37-42 (1974).
Stanek, S., “Electric Melting of Glasses”, Elsevier Scientific Publing Company, New York (1977)
41

Chang, S.L., C.Q. Zhou and B. Golchert, “A Simulation Approach for Bubble Flow in a Glass Melter,” ASME IMECE, Nov. 17-22, New Orleans (2002)
Christopher Jian, Owens-Corning, Personnel Com. [2002] Patankar, S.V., “Numerical Heat Transfer and Fluid Flow”, Hemisphere, Washington, D.C.
(1980).
42

A U.S. Department of Energy laboratory managed by The University of Chicago
Energy Systems DivisionArgonne National Laboratory9700 South Cass Avenue, Bldg. 362 Argonne, IL 60439-4815
www.anl.gov


