

APPLIED ECONOMICS
1. Descriptive Statistics by using SPSS, EVIEWS and
Microsoft Excel
2. Instructor : Mr. Manzoor Ahmad
3. Lecturer, Department of Economics, University of Swabi,
Pakistan

WHAT IS DESCRIPTIVE STATISTIC Those Methods which are used to collect
data, to present them in the form of tables, diagrams etc. and describe their characteristics.
Mean, Median, Mode, Variance, Standard Deviation, Range etc.

EXAMPLE: Following are data regarding ages of
eleven students in Department of Economics:
Name Age
Waqas 23
Shahzad 36
Mareena 23
Aroosa 31
Fatima 25
Arsalan 23
Kamran 25
Marwan 21
Shah Fahad 23
Jaseem 27
Junaid 32

DESCRIPTIVE STATISTIC IN SPSS
Step 1:Fist we open SPSS program: It appears in Blank Sheet…..

DESCRIPTIVE STATISTIC IN SPSS Step 2: Create a variable in “Variable
View” option.
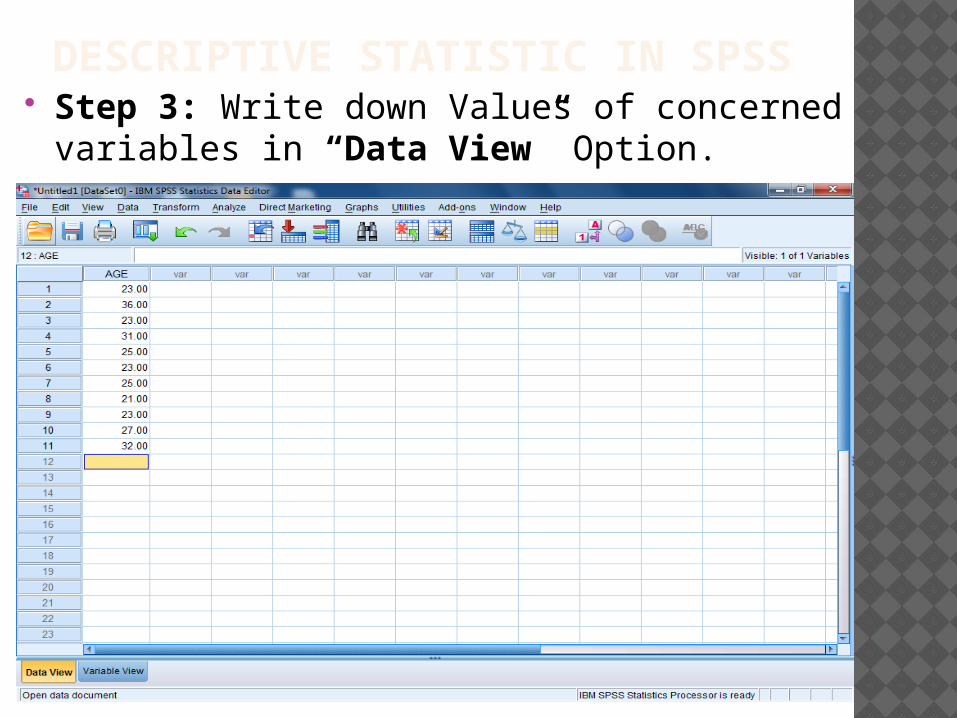
DESCRIPTIVE STATISTIC IN SPSS Step 3: Write down Values of concerned
variables in “Data View” Option.

DESCRIPTIVE STATISTIC IN SPSS
Step 4: Click on Analyze > Descriptive Statistics >Descriptive and then press OK.

DESCRIPTIVE STATISTIC IN SPSS
Interpretation:1. The Maximum age of the student in
Department of Economics is 36years.2. The Minimum Age of the student in DOE is
21 years.3. The Mean age of the students in DOP is 26
years.

DESCRIPTIVE STATISTIC IN EVIEWS: Step 1: Open data set with EVIEWS:

DESCRIPTIVE STATISTIC IN EVIEWS: Step 2: Click on Quick>Group
Statistic>Descriptive Statistics>Common Sample. And write variables in Series List

DESCRIPTIVE STATISTIC IN EVIEWS: Result:

DESCRIPTIVE STATISTIC IN MICROSOFT EXCEL:
Step 1: Create data set

DESCRIPTIVE STATISTIC IN MICROSOFT EXCEL:
Step 2: Data>Data Analysis>Descriptive Statistics: press ok.

DESCRIPTIVE STATISTIC IN MICROSOFT EXCEL:
Result:


