

1
www.cebm.net!
Appraising Diagnostic Studies CEBM Course April 2013
Matthew Thompson Reader, Dept Primary Care Health Sciences
Director, Oxford Centre for Monitoring and Diagnosis Deputy Director, Centre for Evidence Based Medicine
! 2/3 malpractice claims against GPs in UK
! 40,000-80,000 US hospital deaths from misdiagnosis per year
! Diagnosis uses <5% of
hospital costs, but influences 60% of decision making

2
On the menu this morning
! Tests have multiple roles in health care
! Basic anatomy of diagnostic accuracy studies
! Biases in diagnostic studies
! Tests don’t in themselves make people better
! Evaluating new tests
! Making sense of the numbers …..! (sensitivity, specificity etc)
! Not just accuracy – other outcomes of diagnostic tests
! Systematic reviews of diagnostic tests
! Useful books and articles
“Diagnosis” means lots of things - tests can have many roles

3
Roles of diagnostic tests in health care
Role Description Examples Confirming or excluding a diagnosis
Used to confirm (“rule in”) or exclude (“rule out”) particular diagnoses. Most tests will be better at one than the other. May vary between different clinical settings / different spectrum of disease
Normal blood pressure measurement to exclude hypertension. Raised cardiac troponins to confirm cardiac ischaemia
Triage An initial test in a c linical pathway, which usually directs the need (or not) for further (usually more invasive) testing. Ideal triage test is usually fairly rapid, and should not miss any patients (i.e. minimise false negatives)
Blood pressure and heart rate in initial triage of patients with multiple trauma to identify those with possible shock. D-dimer to screen for presence of pulmonary embolism in patients who have shortness of breath
Monitoring Tests that are repeated at periodic intervals in patients with chronic conditions, or in those receiving certain treatments, in order to assess efficacy of interventions, disease progression, or need for changes in treatment
Haemoglobin A1c to monitor glucose control in patients with diabetes. Anticoagulation tests for patients taking oral anticoagulants (warfarin). HIV viral load and CD4 count
Prognosis Provides information on disease course or progression, and individual response to treatment
CT scanning in patients with known ovarian cancer to determine the stage
Screening Detecting conditions or risk factors for conditions in people who are apparently asymptomatic.
Mammography screening for breast cancer. Cholesterol testing to detect persons at greater risk of cardiovascular disease.
Roles of a new test
! Replacement – new replaces old ! E.g., CT colonography for barium enema
! Triage – new determines need for old ! E.g., B-natriuretic peptide for echocardiography
! Add-on – new combined with old ! ECG and myocardial perfusion scan
Bossuyt et al BMJ 2006;332:1089–92
4
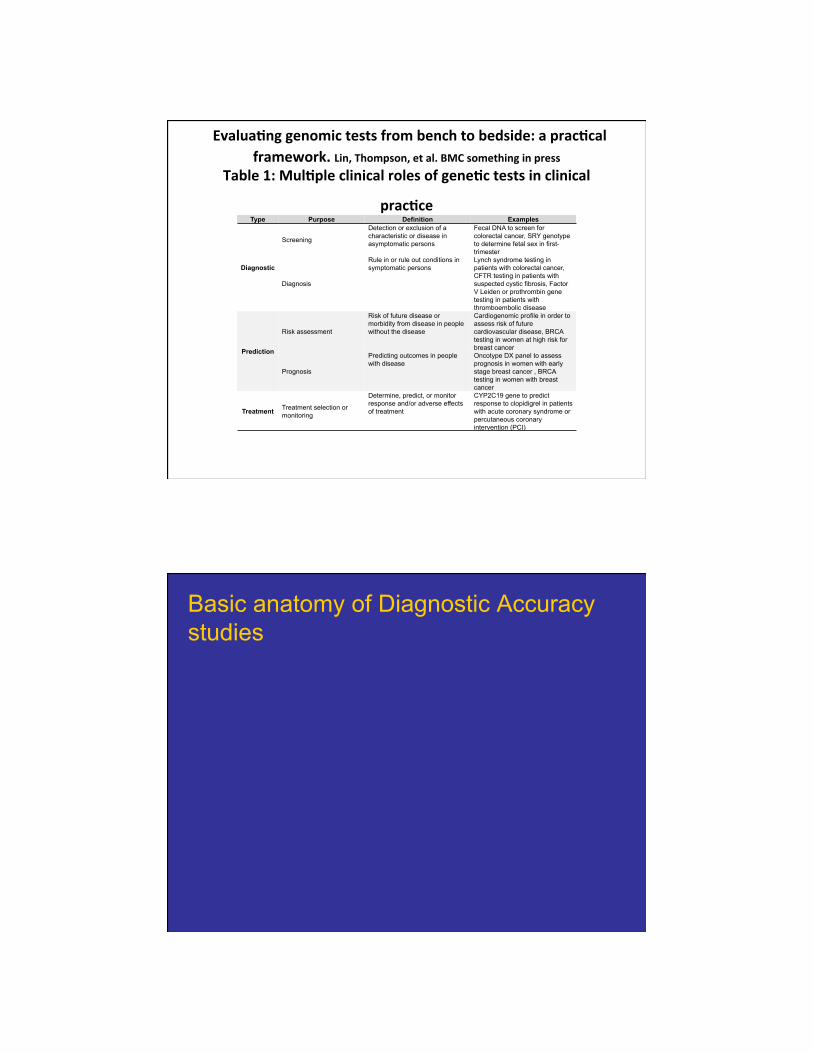
!!Evalua'ng!genomic!tests!from!bench!to!bedside:!a!prac'cal!
framework.!Lin,!Thompson,!et!al.!BMC!something!in!press!Table!1:!Mul'ple!clinical!roles!of!gene'c!tests!in!clinical!
prac'ce!!
Type Purpose Definition Examples
Diagnostic
Screening Detection or exclusion of a characteristic or disease in asymptomatic persons
Fecal DNA to screen for colorectal cancer, SRY genotype to determine fetal sex in first-trimester
Diagnosis
Rule in or rule out conditions in symptomatic persons
Lynch syndrome testing in patients with colorectal cancer, CFTR testing in patients with suspected cystic fibrosis, Factor V Leiden or prothrombin gene testing in patients with thromboembolic disease
Prediction
Risk assessment
Risk of future disease or morbidity from disease in people without the disease
Cardiogenomic profile in order to assess risk of future cardiovascular disease, BRCA testing in women at high risk for breast cancer
Prognosis
Predicting outcomes in people with disease
Oncotype DX panel to assess prognosis in women with early stage breast cancer , BRCA testing in women with breast cancer
Treatment Treatment selection or monitoring
Determine, predict, or monitor response and/or adverse effects of treatment
CYP2C19 gene to predict response to clopidigrel in patients with acute coronary syndrome or percutaneous coronary intervention (PCI)
Basic anatomy of Diagnostic Accuracy studies

5
Defining the clinical question: PICO or PIRT
! Patient/Problem ! How would I describe a group of patients similar to
mine? ! Index test
! Which test am I considering? ! Comparator… or …Reference Standard
! What is the best reference (gold) standard to diagnose the target condition?
! Outcome….or….Target condition ! Which condition do I want to rule in or rule out?
Series of patients
Index test
Reference (“gold”) standard
Compare the results of the index test with the reference
standard, blinded
6
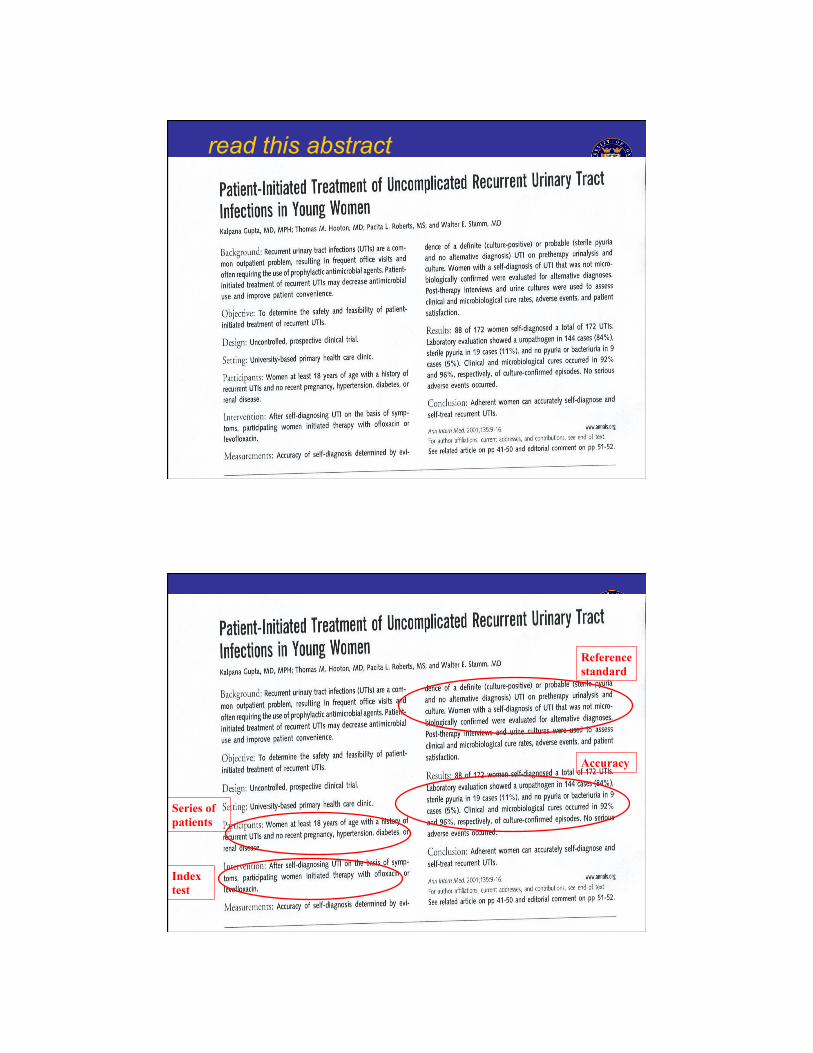
read this abstract
! Scan in UTI abstract
! Scan in UTI abstract
Index test
Series of patients
Reference standard
Accuracy

7
Series of patients
Index test
Reference (“gold”) standard
Compare the results of the index test with the reference
standard, blinded
More than just diagnostic accuracy - other outcomes are important

8
Other outcomes of tests
Effects of testing
What this means Effects on health
Emotional Test causes harmful or beneficial changes in anxiety levels, mood, depression, stress, psychological well being.
Increased anxiety and stress occur after a positive test on screening that has not been confirmed with a reference standard. Reassurance and improved overall well-being after negative test.
Social Effects of testing on social roles, social functions, sexual relationships, social relationship.
Social isolation and stigmatisation after a positive test. Problems with employment or insurance coverage. Genetic testing results may cause guilt about passing on a genetic predisposition.
Cognitive Patients’ beliefs, perceptions and understanding about the test result and the condition.
May understand disease better – what causes it, how long it lasts etc., or affect adherence to therapy.
Behavioural The combinations of emotional, social and cognitive effects can affect patient behaviour. Positive and negative tests can prompt change in behaviour.
Adherence to clinical intervention may be increased or decreased. Greater or less engagement with other health related behaviours, e.g. increased exercise after having cholesterol measured. Perceptions of risks from screening and repeated screening.
Example
Psychosocial outcomes of 3 triage methods for the management of borderline abnormal cervical smears: an open randomised trial. McCaffery BMJ 2010

9
Fig 1 Randomised trial design and psychosocial assessment.
McCaffery K J et al. BMJ 2010;340:bmj.b4491
©2010 by British Medical Journal Publishing Group
Results
! At 12 months, distress about the abnormal cervical smear was lowest in women allocated to HPV testing compared with those allocated to repeat smear testing
! Satisfaction with care highest in women allocated to HPV testing

10
Explaining bias in diagnostic studies with pictures
Assessing bias – what is most important for diagnostic studies?
• Appropriate spectrum of patients selected?
• Was the index test performed on all patients?
• Is the same reference test performed on all patients, regardless of the result of the index test? How objective is the reference test?
• Were the index and reference tests compared in independent, blind ?
11
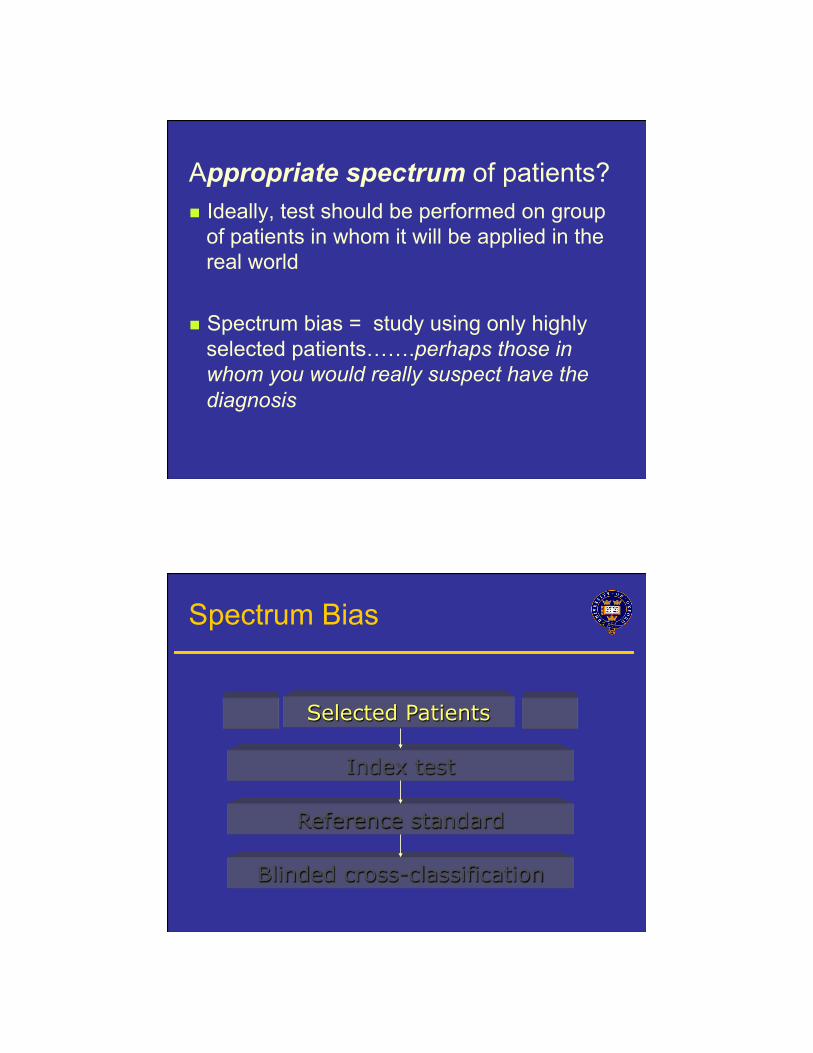
Appropriate spectrum of patients? ! Ideally, test should be performed on group
of patients in whom it will be applied in the real world
! Spectrum bias = study using only highly
selected patients…….perhaps those in whom you would really suspect have the diagnosis
Selected Patients
Index test
Reference standard
Blinded cross-classification
Spectrum Bias

12
2. Do ALL patients get the gold standard test? ! Ideally all patients get the reference (“gold”)
standard test ! Verification/work-up bias = only some
patients get the gold standard…..(probably the ones in whom you really suspect have the disease)
Series of patients
Index test
Reference standard
Blinded cross-classification
Verification (work-up) bias

13
! Ideally, the gold standard is independent, blind and objective
! Observer bias = test is very subjective, or
done by person who knows something about the patient
3. Independent, blind or objective comparison with the gold standard?
Series of patients
Index test
Reference standard
Unblinded cross-classification
Observer/test review Bias

14
Series of patients
Index test
Reference standard….. includes parts of Index test
Unblinded cross-classification
Incorporation Bias
Series of patients
Index test
Blinded cross-classification
Ref. Std A Ref. Std. B
Differential reference bias
15
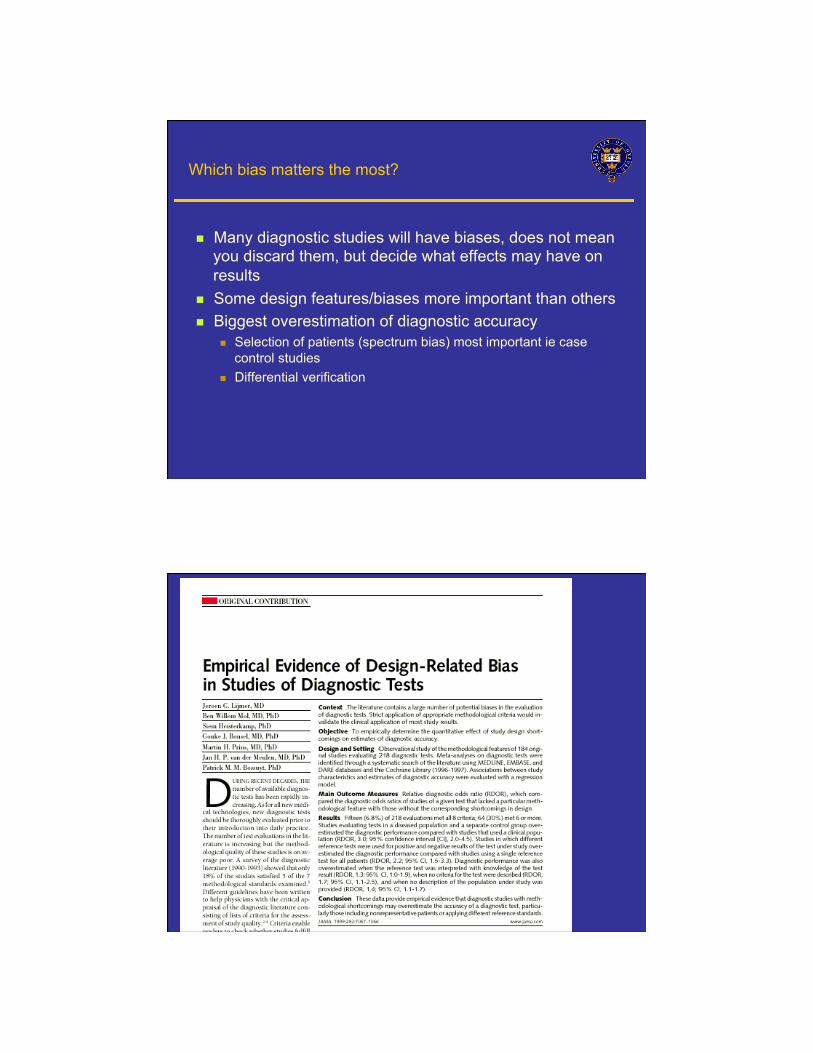
Which bias matters the most?
! Many diagnostic studies will have biases, does not mean you discard them, but decide what effects may have on results
! Some design features/biases more important than others ! Biggest overestimation of diagnostic accuracy
! Selection of patients (spectrum bias) most important ie case control studies
! Differential verification

16
How to explain results of diagnostic accuracy

17
What’s the problem?
! Pairs of numbers usually ! The 2 numbers depend on each other ! The consequences of false positive and
false negative results are different ! Most people don’t understand what the
numbers actually mean
2 by 2 table Reference test
Index Test
+ -+
-

18
2 by 2 table Reference test
Test
+ -+
-
True positive
False positive
False negative
True negative
IF only a test had perfect discrimination…
Reference test
Test
+ -+
-
True positive
True negative

19
Sensitivity Disease
Test
+ -+
- c
a b
d
Sensitivity = a / a + c
Proportion of people with the disease who have a positive test.
Specificity Disease
Test
+ -+
- c
a b
d
Specificity = d / b + d
Proportion of people without the disease who have a negative test.

20
Tip….. ! Sensitivity is useful to me
! ‘The new chlamydia test was positive in 47 out of 56 women with chlamydia (sensitivity =83.9%)’
! Specificity seems a bit confusing ! ‘The new chlamydia test was negative in 600 of the
607 women who did not have chlamydia (specificity = 98.8%)’
! So…false positive rate is sometimes easier
! False positive rate = 1 – specificity ! So a specificity of 98.8% means that the new test is
wrong (or falsely positive) in 1.2% of women
Maybe forget sensitivity and specificity?..
! True positive rate ( = Sensitivity)
! False positive rate ( = 1 – Specificity)

21
How about this? SnNOUT Disease
Test
+ -+
- c
a b
d
Sensitivity = a / a + c
Highly sensitive tests = good for screening
or
SnNOUT
Highly sensitive test, negative result rules out.
SpPIN Disease
Test
+ -+
- c
a b
d
Specificity = d / b + d
Highly specific tests = good for ruling in
or
SpPIN
Highly specific test, positive result rules in.

22
Using natural frequencies to explain results of diagnostic accuracy
Using natural frequencies
You return home from the CEBM course. Your father telephones you and tells you that he went to his doctor and was told that his test for a disease was positive. He is really worried, and asks you for help!!
! After doing some reading, you find that for men
of his age: ! The prevalence of the disease is 30% ! The test has a sensitivity of 50% and specificity of 90%
! “Son, tell me what’s the chance I have this disease?”

23
! 100% likely
! 50% maybe
! 0% unlikely
A disease with a prevalence of 30% must
be diagnosed.
The test has a sensitivity of 50% and a
specificity of 90%.
Given a positive test, what’s the chance he
has the disease?
Prevalence of 30% Sensitivity of 50% Specificity of 90%
30
70
15
7 100
22 people test positive……….
of whom 15 have the disease
About 70%
Disease +ve
Disease -ve
Testing +ve

24
! A disease with a prevalence of 4% must be
diagnosed. ! It has a sensitivity of 50% and a specificity
of 90%. ! If the patient tests positive, what is the
chance they have the disease?
Try it again
Prevalence of 4% Sensitivity of 50% Specificity of 90%
4
96
2
9.6
100
11.6 people test positive…
of whom 2 have the disease
About 17%
Disease +ve
Disease -ve
Testing +ve

25
Doctors with an average of 14 yrs experience Answers ranged from 1% to 99% ….half of them estimated the probability as 50% Gigerenzer G BMJ 2003;327:741-744
What about positive and negative predictive values?

26
positive predictive value (PPV) Disease
Test
+ -+
- c
a b
d
PPV = a / a + b
Proportion of people with a positive test who have the disease
negative predictive value (NPV) Disease
Test
+ -+
- c
a b
d NPV = d / c + d
Proportion of people with a negative test who do not have the disease
27
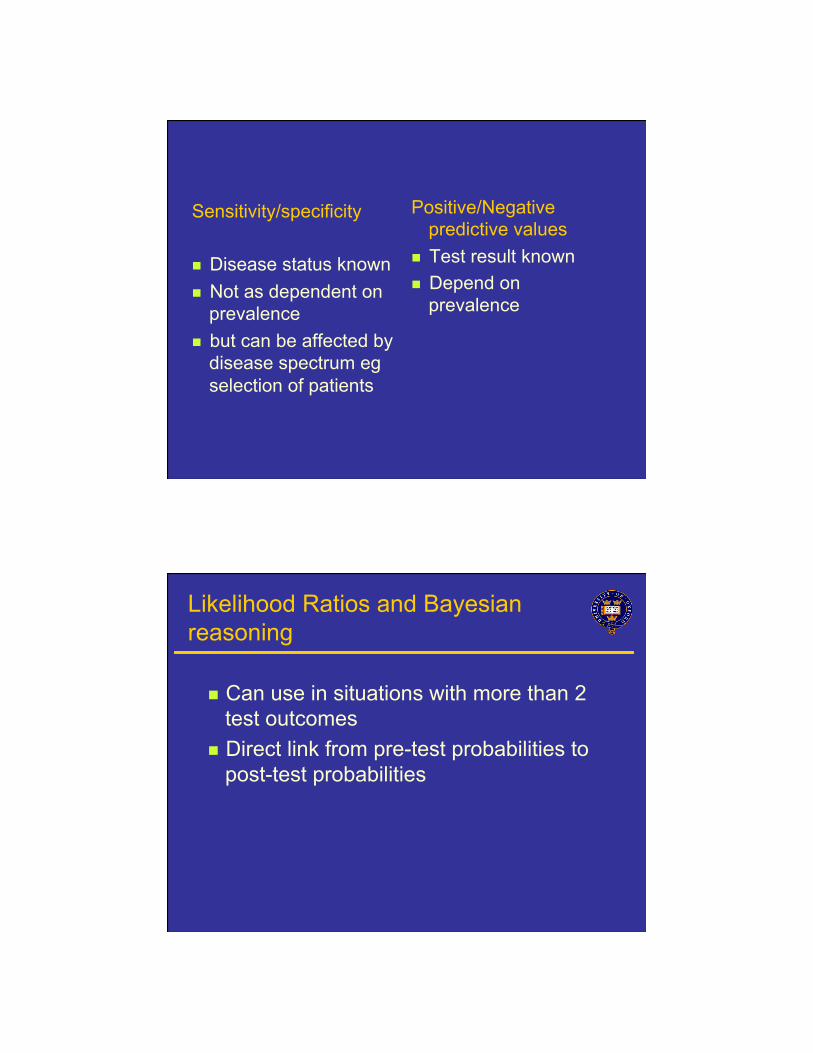
Sensitivity/specificity ! Disease status known ! Not as dependent on
prevalence ! but can be affected by
disease spectrum eg selection of patients
Positive/Negative predictive values
! Test result known ! Depend on
prevalence
Likelihood Ratios and Bayesian reasoning
! Can use in situations with more than 2 test outcomes
! Direct link from pre-test probabilities to post-test probabilities

28
Positive and negative likelihood ratios
LR+ = a/a+c / b/b+d
Or
LR+ = sens/(1-spec)
LR+ How much more often a positive test occurs in people with compared to those without the disease
LR- = c/a+c / d/b+d
Or
LR- = (1-sens)/(spec)
LR- How less likely a negative test result is in people with the disease compared to those without the disease
LR>10 …. strong positive test result
LR<0.1…. strong negative test result
LR=1
No diagnostic value

29
McGee: Evidence based Physical Diagnosis (Saunders Elsevier)
Bayesian reasoning
Post-test odds = Pre-test odds x Likelihood ratio • Post-test odds for disease after one test become pre-
test odds for next test etc

30
Post test 20%
? Appendicitis:
McBurney tenderness LR+ = 3.4
Pre test 5%
%
%
Bayesian reasoning using Fagan Nomogram
ROC curves (Receiver Operating Characteristic curves) – What are they and what aren’t they?

31
ROC curves – provide accuracy results over a range of thresholds
Sensi'vity
1,Specificity!or!false!posi've!rate
A test with 30% sensitivity and 90% specificity (10% false positive rate) at one cut-point is plotted in the lower left corner.
ROC curves
Sensi'vity
1,Specificity
It has another cut-point with a sensitivity of 60% and specificity of 80%

32
Sensi'vity
1,Specificity
Perfect test = upper left hand corner
Diagonal = no discrimination
Area under the curve (AUC) 0.5 = useless 1.0 = perfect
Fig 2 ROC plot of test accuracy at different thresholds.
Mallett S et al. BMJ 2012;345:bmj.e3999
©2012 by British Medical Journal Publishing Group

33
Area Under the Curve
.749
.644
Test Result Variable(s)CRP (mg/L)Neutrophil count 10(9)/L
Area
The test result variable(s): CRP (mg/L) has at least onetie between the positive actual state group and thenegative actual state group. Statistics may be biased.
(False positive rate)
Fig 3 Use of ROC AUC to compare two tests: CA 19-9 and CA 125.
Mallett S et al. BMJ 2012;345:bmj.e3999
©2012 by British Medical Journal Publishing Group

34
Mallett S et al. BMJ 2012;345:bmj.e3999
©2012 by British Medical Journal Publishing Group
Mallett S et al. BMJ 2012;345:bmj.e3999
©2012 by British Medical Journal Publishing Group

35
Steps in evaluating new tests
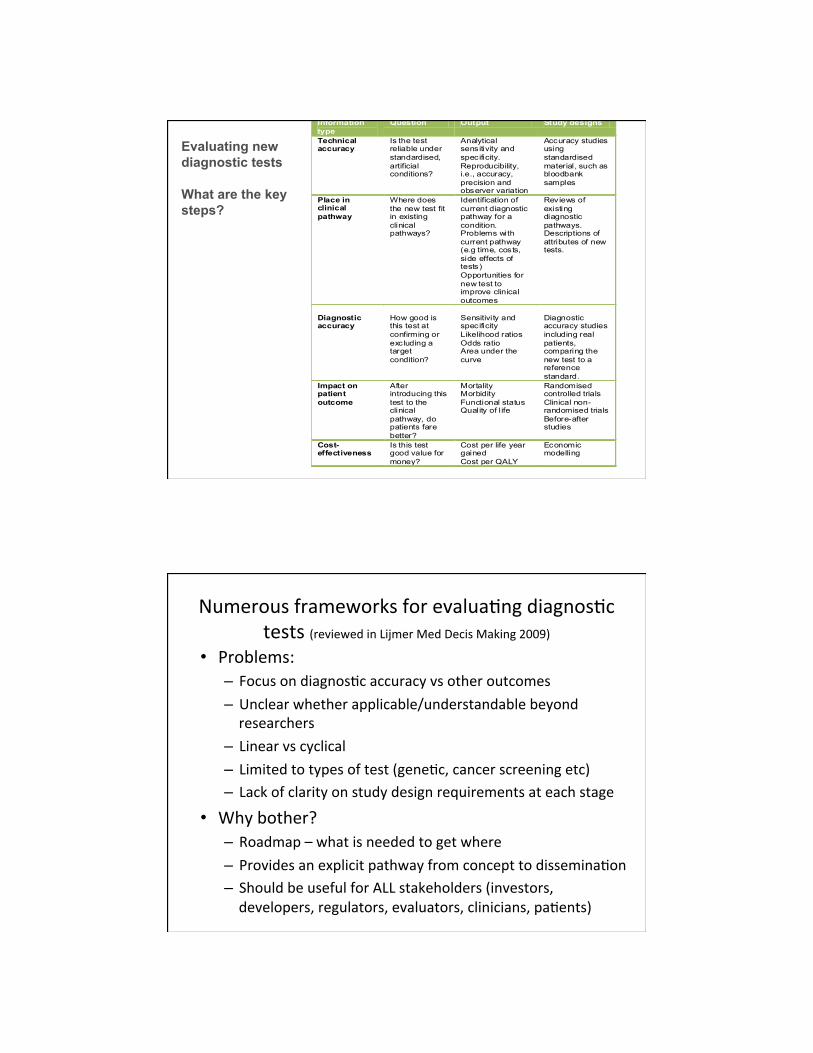
Evaluating new diagnostic tests What are the key steps?
1. Technical accuracy “Can it work?”
2. Place in the clinical pathway
“Where does the test fit in the existing clinical pathway?”
3. Ability of the test to diagnose or exclude the target
condition “Does it work in patients?”
4. The effect of the test on patient outcomes
“Are patients better off?” 5. Cost-effectiveness
“Is it worth the cost”?
Frameworks for evaluating diagnostic tests (reviewed in Lijmer Med Decis Making 2009)
36
Information type
Question Output Study designs
Technical accuracy
Is the test reliable under standardised, artificial conditions?
Analytical sensitivity and specificity. Reproducibility, i.e., accuracy, precision and observer variation
Accuracy studies using standardised material, such as bloodbank samples
Place in clinical pathway
Where does the new test fit in existing clinical pathways?
Identification of current diagnostic pathway for a condition. Problems with current pathway (e.g time, costs, side effects of tests) Opportunities for new test to improve clinical outcomes
Reviews of existing diagnostic pathways. Descriptions of attributes of new tests.
Diagnostic accuracy
How good is this test at confirming or excluding a target condition?
Sensitivity and specificity Likelihood ratios Odds ratio Area under the curve
Diagnostic accuracy studies including real patients, comparing the new test to a reference standard.
Impact on patient outcome
After introducing this test to the clinical pathway, do patients fare better?
Mortality Morbidity Functional status Quality of l ife
Randomised controlled trials Clinical non-randomised trials Before-after studies
Cost-effectiveness
Is this test good value for money?
Cost per life year gained Cost per QALY
Economic modelling
Evaluating new diagnostic tests What are the key steps?
Numerous!frameworks!for!evalua'ng!diagnos'c!tests!(reviewed!in!Lijmer!Med!Decis!Making!2009)!
• Problems:!– Focus!on!diagnos'c!accuracy!vs!other!outcomes!– Unclear!whether!applicable/understandable!beyond!researchers!
– Linear!vs!cyclical!– Limited!to!types!of!test!(gene'c,!cancer!screening!etc)!– Lack!of!clarity!on!study!design!requirements!at!each!stage!
• Why!bother?!– Roadmap!–!what!is!needed!to!get!where!– Provides!an!explicit!pathway!from!concept!to!dissemina'on!– Should!be!useful!for!ALL!stakeholders!(investors,!developers,!regulators,!evaluators,!clinicians,!pa'ents)!

37
Diagnostic tests don’t make patients better!
Pathway from test to outcome
Ferrante di Ruffano. BMJ 2012
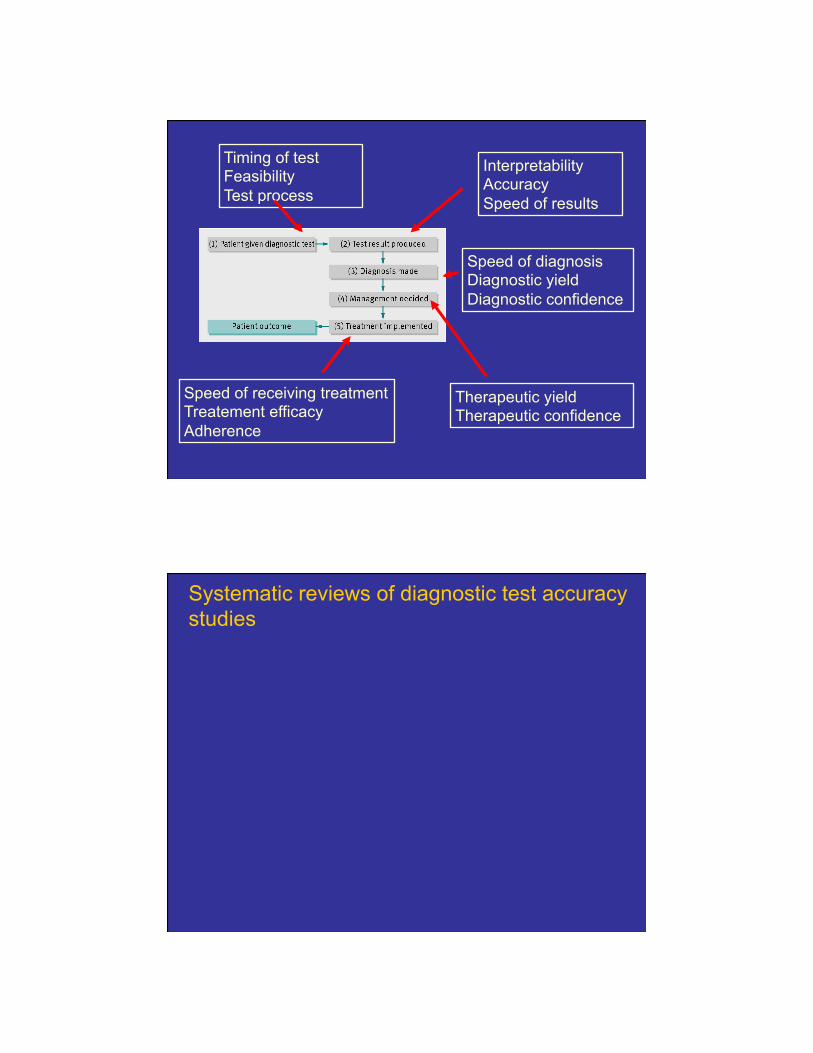
38
Interpretability Accuracy Speed of results
Timing of test Feasibility Test process
Therapeutic yield Therapeutic confidence
Speed of receiving treatment Treatement efficacy Adherence
Speed of diagnosis Diagnostic yield Diagnostic confidence
Systematic reviews of diagnostic test accuracy studies

39
Systematic reviews of diagnostic test accuracy studies: How to rapidly appraise?
! Well formatted question ! Find all the studies ! Appraise (use QUADAS-2 tool) ! Summarise ! Sometimes meta-analysis
Table of Study Characteristics is always the most important table ! design features (e.g. prospective/retrospective), ! Recruitment (e.g. consecutive/case-control) ! setting (e.g. country, health care setting) ! participants (e.g. inclusion & exclusion criteria, age) ! details of the index test (e.g. how was it done, cut-offs
used) ! details of the reference standard (e.g. may vary between
studies) ! target condition (e.g. prevalence, severity)

40
Presenting results: “Forest plot” (but it is not really!)
Presenting results in ROC space - each point is a different study
41
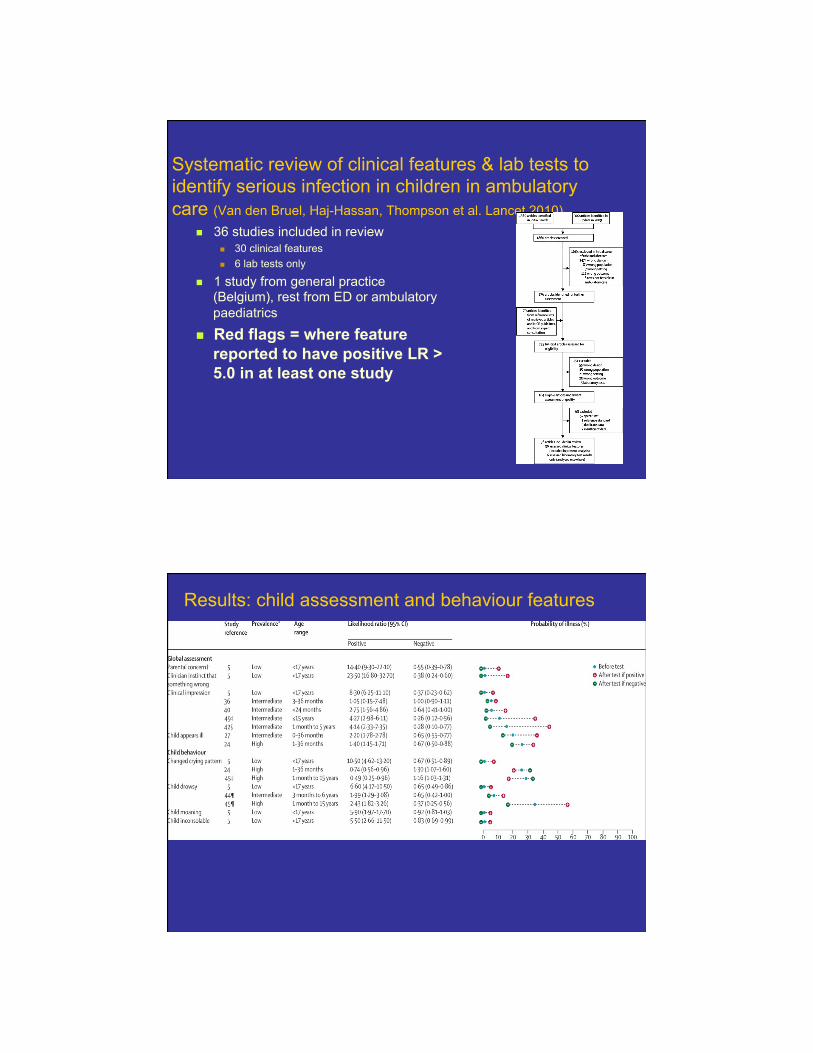
Systematic review of clinical features & lab tests to identify serious infection in children in ambulatory care (Van den Bruel, Haj-Hassan, Thompson et al. Lancet 2010)
! 36 studies included in review ! 30 clinical features ! 6 lab tests only
! 1 study from general practice (Belgium), rest from ED or ambulatory paediatrics
! Red flags = where feature reported to have positive LR > 5.0 in at least one study
Results: child assessment and behaviour features

42
Presenting results: Dumbbell plots
Study Setting Cut-off used
Likelihood ratios Probability of illness
LR+ LR- Before test After test if + After test if -
Index test 1
Study a Int prolonged 2.05 (1.01-4.19) 0.87 (0.72-1.04)
Study b Int ≥1.18 13.1 (1.23-38.8) 0.92 (0.82-1.04)
Index test 2
Study b Int ≥1.2 13.1 (5.88-29.0) 0.44 (0.27-0.70)
Index test 3
(1000/mm³)
Study b Int ≤150 3.20 (1.36-7.53) 0.81 (0.64-1.03)
0 10 20 30 40 50 60 70 80 90 100
Metaanalysis- simple pooling?
! Simply pooling together sensitivity or specificity gives an estimate of this “average” effect.
! But too simplistic - ignores some details of diagnostic accuracy studies eg different thresholds, heterogeneity between studies, correlation between sensitivity and specificity
! For example in a meta-analysis of 3 studies which had different values of sensitivity and specificity; ! Study 1: 10% & 90%, ! Study 2: 80% and 80%, and ! Study 3: 90% and 10%.
! Simply averaging these, gives sensitivity of 60% and specificity of 60% - which does not really tell us anything useful about these data!
43
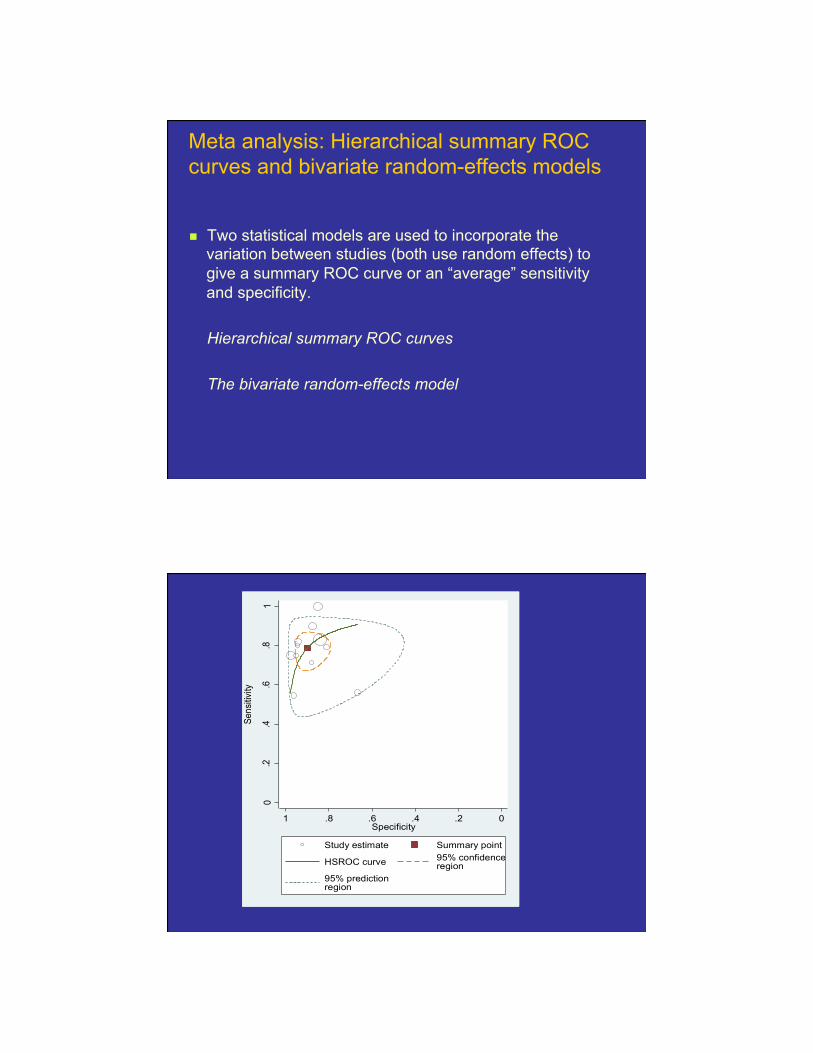
Meta analysis: Hierarchical summary ROC curves and bivariate random-effects models
! Two statistical models are used to incorporate the variation between studies (both use random effects) to give a summary ROC curve or an “average” sensitivity and specificity.
Hierarchical summary ROC curves
The bivariate random-effects model
0.2
.4.6
.81
Sens
itivity
0.2.4.6.81Specificity
Study estimate Summary point
HSROC curve 95% confidenceregion
95% predictionregion

44
Diagnostic reasoning
! Clinicians use many different methods to make diagnostic decisions
! Too much emphasis on 2x2 tables and numbers can seem irrelevant
Diagnostic strategies
Diagnostic strategies used in primary care. Heneghan et al BMJ 2009
! Aim: identify types and frequency of diagnostic strategies used in primary care ! 6 GPs collected and recorded strategies used on 300
patients. ! Identified and refined diagnostic strategies
45
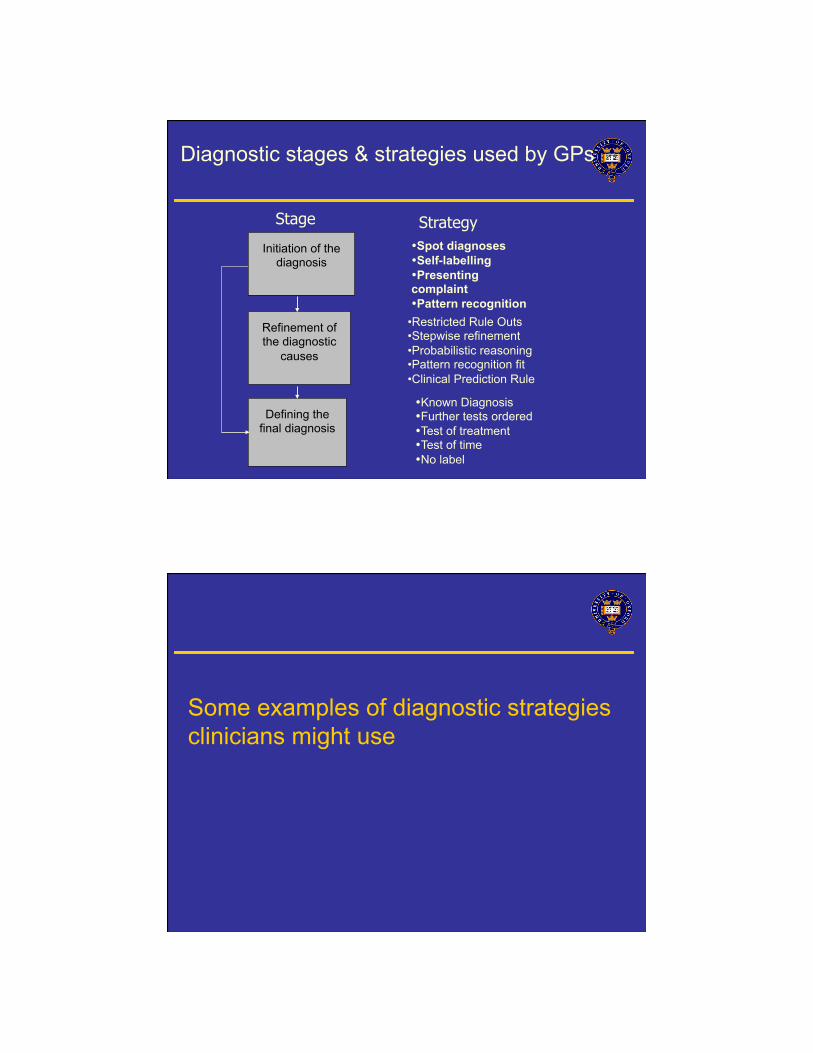
Refinement of the diagnostic
causes
• Restricted Rule Outs • Stepwise refinement • Probabilistic reasoning • Pattern recognition fit • Clinical Prediction Rule
• Spot diagnoses • Self-labelling • Presenting complaint • Pattern recognition
Initiation of the diagnosis
Defining the final diagnosis
• Known Diagnosis • Further tests ordered • Test of treatment • Test of time • No label
Diagnostic stages & strategies used by GPs
Stage Strategy
Some examples of diagnostic strategies clinicians might use

46
! Unconscious recognition of non-verbal pattern, e.g.: - visual (skin condition) - auditory (barking cough with croup)
! Fairly instantaneous, no further history needed.
*Brooks LR. Role of specific similarity in a medical diagnostic task. J Exp Psychol Gen 1991;220:278-87
Spot diagnosis
47
Useful books ! Diagnostic Tests Toolkit. Thompson & Van den
Bruel. Wiley-Blackwell. ! Evidence base of Clinical Diagnosis. Knottnerus
& Buntinx. Wiley-Blackwell ! Evidence-based Diagnosis. Newman & Cohn.
Cambridge Univ Press ! The Diagnostic Process. John Balla. Cambridge
Univ Press ! Evidence based Physical Diagnosis. Steven
McGee. Saunders
Useful journal articles on diagnostics ! Bossuyt. Additional patient outcomes and pathways in evaluations
of testing. Med Decis Making 2009 ! Heneghan et al. Diagnostic strategies used in primary care. BMJ
2009 ! Ferrante di Ruffano. Assessing the value of diagnostic tests: a
framework for designing and evaluating trials. BMJ 2012 ! Mallett et al. Interpreting diagnostic accuracy studies for patient
care. BMJ 2012 ! Bossuyt et al. STARD initiative. Ann Int Med 2003 ! Lord et al. Using priniciples of RCT design to guide test evaluation.
Med Decis Making 2009 ! Rutjes et al. Evidence of bias and variation in diagnostic accuracy
studies. CMAJ 2006 ! Lijmer et al. Proposals for phased evaluation of medical tests. Med
Decis Making 2009 ! Whiting et al. QUADAS-2: revised tool for quality assessment of
diagnostic accuracy studies. Ann Int Med 2011

48
Thanks!
Centre for Monitoring and Diagnosis www.madox.org
Centre for Evidence Based Medicine www.cebm.net [email protected]
Clinical prediction rules

49
Clinical prediction rules
! Incorporates information from diagnostic studies into clinical practice.
! A formal way of bringing together combinations of predictor variables, which may include clinical features, examination findings, results of laboratory or imaging investigations.
! Why have them? ! Simplify/streamline the diagnostic process, by
identifying the clinical features which are the most useful (or predictive) of a particular outcome
! teaching aid to help clincians learn which clinical features are most important
!
Clinical prediction rules
Clinical prediction rules most useful: ! The clinical decision is particularly complex ! Clinical outcome of interest is rare and/or very serious ! To guide the need (or not) for more invasive/
expensive further diagnostic investigations ! As screening tests, ! Determine prognosis

50
Selecting Clinical prediction rules
! How valid is it? ! Consider how the rule was derived and the level of validation
(see above) ! How sensible is it?
! Predictors should be those that are routinely collected, can be measured in the same way
! Some rules exclude predictors that clinicians are used to using. A rule that does not include these are not likely to be used /believed by clinicians.
! What is its possible impact? ! Change patient outcomes? ! How easy will it be to use it? ! How often is the rule likely to be overruled in clinical practice?


