

Army Landfill Gas to Electricity Feasibility Study
Mary Matthews Hains, PEAMEC Environment and
Infrastructure

Learning Objectives
• Understand the criteria that can be applied to identify strong landfill candidates for production of methane gas for electricity
• Understand the technical and economic factors that prove the feasibility of landfill gas to electricity projects
10-3-12 Net Zero through Emerging Technologies 2

Purpose of Study
• Identify renewable energy potential from landfill gases at all Army installations in CONUS• 121 sites considered
10-3-12 Net Zero through Emerging Technologies 3

Process
• Develop evaluation criteria; score database
• Identify strongest candidates through questionnaires, modeling, and on-site records review with stakeholders
• Identify equipment specs and preliminary cost to calculate potential feasibility
• Conduct charrette of feasible options; prepare programming documents
3-4-12 4Net Zero through Emerging Technologies

Evaluation Criteria
3-4-12 5Net Zero through Emerging Technologies
Waste Compo-sition
Local Electric Rates
Size (Waste in
Place)Landfill
Age
Gas Collection
SystemNet Zero
Installation
Excellent
MSW reported
>10 ¢/kWh
>1.5M Tons
Active or Closed <5 yrs. ago Yes Yes
Good/ Marginal NA
>7.5 ¢/kWh
>0.75M Tons
Closed >5 and <10 yrs. ago NA NA
Poor NA<7.5
¢/kWh<0.75
M Tons
Closed >10 yrs.
ago NA NA
Most important Least important

Initial Screening
• Southern DoD Landfill Database– Desktop analysis; uses broad assumptions
• Unknown waste composition? Assume some MSW
– Supplemented with other databases• DoD Solid Waste Annual Reporting
– Shows remaining waste volume, projected closure date, and gas collection system type
• EPA’s Landfill Methane Outreach Program – Defines candidates as active or closed <5 years, with >1M
tons of waste, and no planned/operational LFG project
3-4-12 6Net Zero through Emerging Technologies
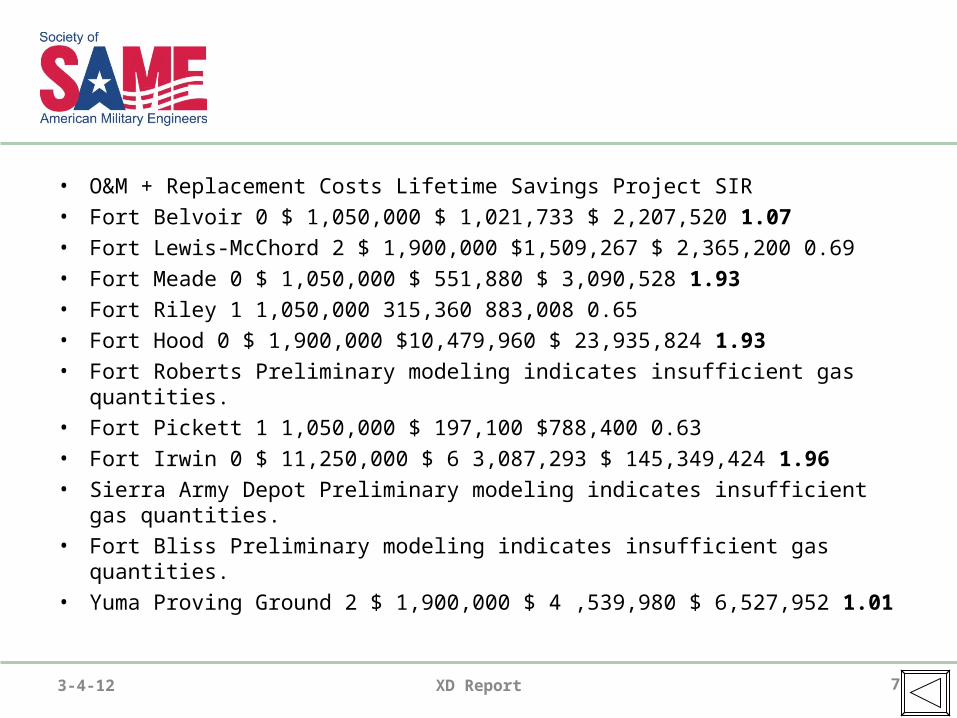
• O&M + Replacement Costs Lifetime Savings Project SIR
• Fort Belvoir 0 $ 1,050,000 $ 1,021,733 $ 2,207,520 1.07
• Fort Lewis-McChord 2 $ 1,900,000 $1,509,267 $ 2,365,200 0.69
• Fort Meade 0 $ 1,050,000 $ 551,880 $ 3,090,528 1.93
• Fort Riley 1 1,050,000 315,360 883,008 0.65
• Fort Hood 0 $ 1,900,000 $10,479,960 $ 23,935,824 1.93
• Fort Roberts Preliminary modeling indicates insufficient gas quantities.
• Fort Pickett 1 1,050,000 $ 197,100 $788,400 0.63
• Fort Irwin 0 $ 11,250,000 $ 6 3,087,293 $ 145,349,424 1.96
• Sierra Army Depot Preliminary modeling indicates insufficient gas quantities.
• Fort Bliss Preliminary modeling indicates insufficient gas quantities.
• Yuma Proving Ground 2 $ 1,900,000 $ 4 ,539,980 $ 6,527,952 1.01
3-4-12 XD Report 7

Results of Initial Screening
• 32 landfills of 121 in the database were recommended for further consideration– Produced red-yellow–green measles chart
• To refine the data, questionnaires were sent to 32 locations; 28 responded
• Scored to reflect completeness of the data received, the year closed, landfill size, % MSW, type of gas management system, and electricity rates
3-4-12 8Net Zero through Emerging Technologies

Scoring and Refining
3-4-12 9
Score = (A + (B + C) x D + E) x F; where:
A = Completeness of data set (values = 0, 1, or 2)Not Submitted – 0; Partially Complete – 1; Substantially Complete – 2
B = Closure date (values = 0, 1, 2, 3, or 4)Unknown – 0; Prior to 2001 – 1; 2001-2006 – 2; 2006-2011 – 3; Active – 4
C = Landfill Size (values = 0, 1, 2, or 3)>1.5 m tons (large) – 3; >0.75 m tons (mid) – 2; <0.75 m tons (small) – 1; Unknown – 0
D = Percent Municipal Solid Waste (values = 0, 1, 2, 3, 4, or 5)None – 0; Unknown – 1; <25% - 2; 25-50% - 3; 50-75% - 4; >75% - 5
E = Gas Management System (values = 0, 1, or 2)None – 0; Passive – 1; Active – 2
F = Local electric rate (values in cents/kWh)
Net Zero through Emerging Technologies

Top 11 Candidates after Questionnaire/Scoring
3-4-12 10Net Zero through Emerging Technologies
• Fort Irwin, CA
• Fort Hood, TX*
• Fort Bliss, TX*
• Yuma Proving Ground, AZ
• Fort George G Meade, MD
• Fort Riley, KS
• Fort Belvoir, VA
• Camp Roberts, CA
• Fort Lewis-McChord, WA*
• Sierra Army Depot, CA*
• Fort Pickett, VA*Net Zero Base

Scored better than Fort Pickett but discarded...
3-4-12 11Net Zero through Emerging Technologies
• White Sands Missile Range, CA*• Fort Hunter Liggett, CA*• Fort Sill, OK**• Fort Jackson, SC**
* Lack of a gas collection system, low precipitation levels, and methane monitoring reports showing only a few ppm methane
** Low % MSW, low ($0.06-$0.08/kwh) electric rates

Preliminary Modeling
• Used EPA’s LandGEM software to model potential methane output
• Model estimates savings-to-investment ratio for proposed plant (>1.0 = feasible)– Using data, scoring, modeling results and
discussions with client, further investigation through records review was proposed
– Pickett, Belvoir, Meade, Hood, Yuma, Bliss, Lewis-McChord chosen
3-4-12 12Net Zero through Emerging Technologies

Ex: Fort Meade: Methane Produced vs. Captured, Cells 1 and 2
3-4-12 13Net Zero through Emerging Technologies

Fort Meade:Methane Production by Cell
3-4-12 14Net Zero through Emerging Technologies

Fort Meade: Energy Density
3-4-12 Net Zero through Emerging Technologies 15

Refinements from On-site Records Review
• Some electric rates were incorrectly reported, skewing results
• Trade-offs are challenging to evaluate:– Some cultural barriers exist in defending the
“closed landfill” status– Non-attainment areas biased against
installation of new plant equipment
• If you are going to wander around landfills, you need to watch out for ticks
3-4-12 16Net Zero through Emerging Technologies

3-4-12 Net Zero through Emerging Technologies 17
Location Waste in Place
Closure Year Electric Rates
Annual Precipi-tation
% MSW Gas Collection System
Methane Present?
Fort Meade 0.51m tons Pre-2001 $0.14/kWh 41 in. 83% Passive Yes
Small Bad Good Good Good
Fort Pickett 0.51m tons Pre-2001 $0.10/kWh 43 in. 100% Passive Yes
Small Bad Good Good Good
Fort Hood 3.14m tons Active* $0.053/kWh 32 in. 95% None Yes
Large Good Bad Good Good
Fort Bliss 2.16m tons 2013 $0.08/kWh 9 in. 82% Passive Yes
Large Good OK Bad Good
JB Lewis- McChord
1.20m tons 2004 $0.038/kWh 41 in. 79% Passive Yes
Mid OK Bad Good Good
Results of Records Review, Second Screening
State why Yuma and Belvoir are gone

Design Considerations
• LFG plants have an estimated installed cost of $5000/kW
• The potential plant output from this study group ranges between 250 - 848 kW– Small compared to total base demand– $1.2M - $4.2 M capital investment
• Meade, Hood and Bliss will likely prove to have a reasonable payback period and sites with SIRs> 1.0
3-4-12 18Net Zero through Emerging Technologies


