

Infrared Microscpectroscopybeamline
Art and Cultural Heritage
applications
Ljiljana Puskar
9th September 2010
OVERVIEW
• Introduction to IR spectroscopy and instrumentation
• The advantages of synchrotron-based Fourier-transform infrared
microspectroscopy and IR beamline at the Australian Synchrotron
• Methods for measuring IR spectra, sample preparation and data
analysis
• Cultural heritage applications at the IR microspectroscopy beamline
at the AS
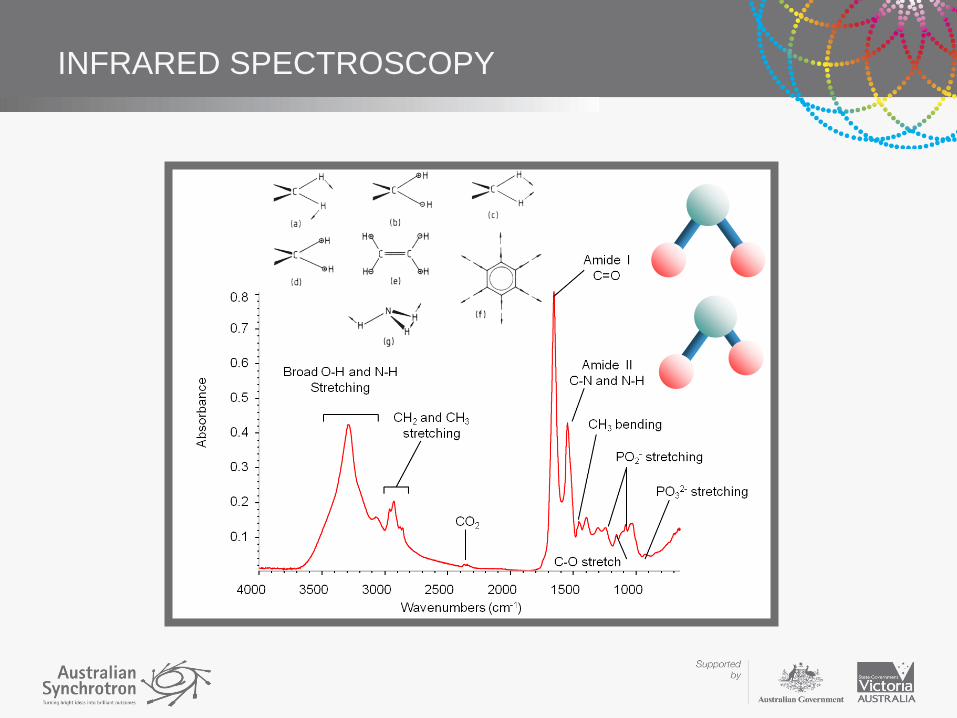
INFRARED SPECTROSCOPY
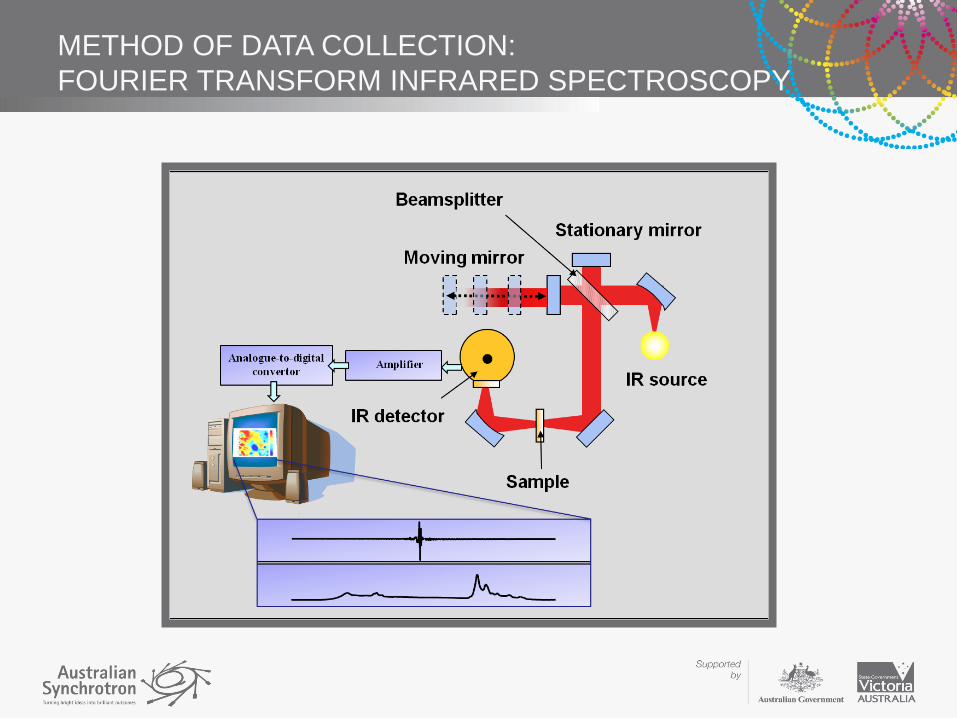
METHOD OF DATA COLLECTION:
FOURIER TRANSFORM INFRARED SPECTROSCOPY
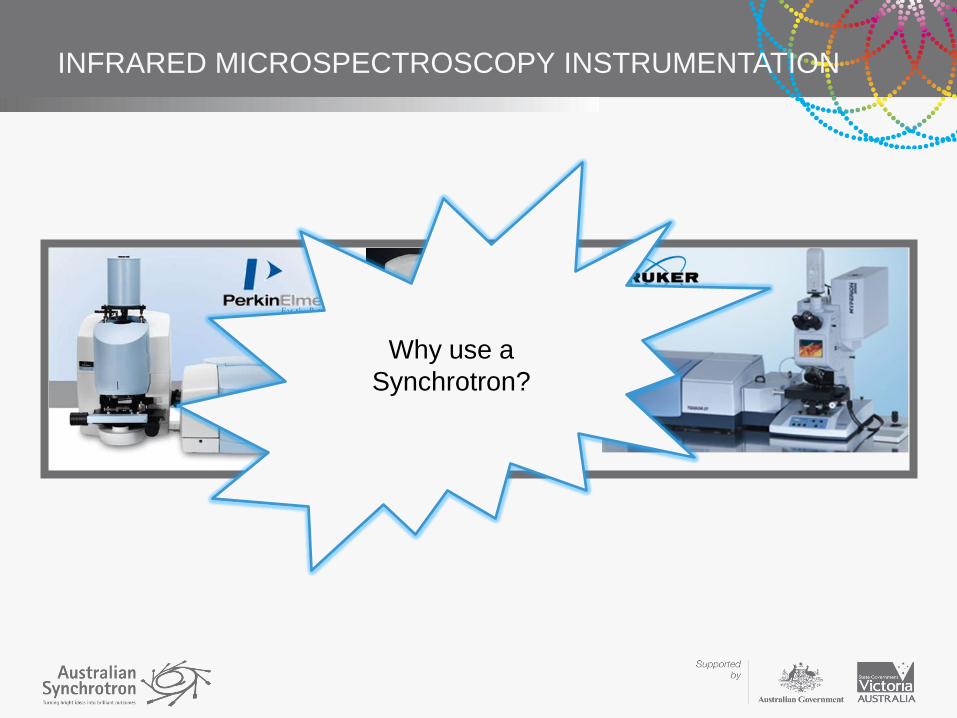
INFRARED MICROSPECTROSCOPY INSTRUMENTATION
Why use a
Synchrotron?
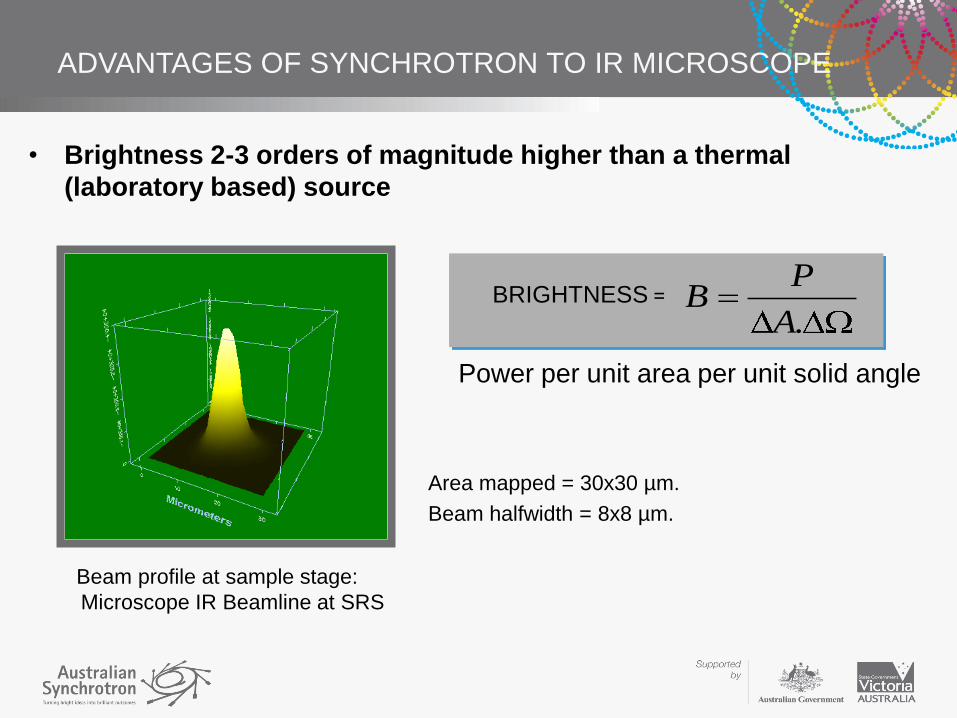
ADVANTAGES OF SYNCHROTRON TO IR MICROSCOPE
• Brightness 2-3 orders of magnitude higher than a thermal
(laboratory based) source
Beam profile at sample stage:
Microscope IR Beamline at SRS
BRIGHTNESS =
.A
PB
Power per unit area per unit solid angle
Area mapped = 30x30 µm.
Beam halfwidth = 8x8 µm.
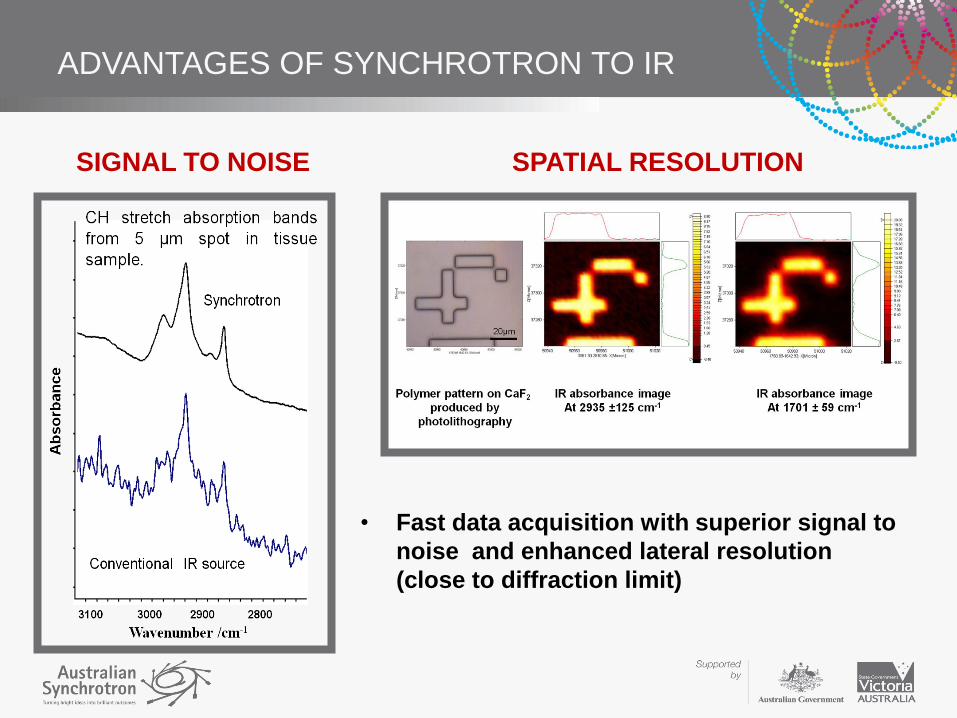
ADVANTAGES OF SYNCHROTRON TO IR
SIGNAL TO NOISE SPATIAL RESOLUTION
• Fast data acquisition with superior signal to
noise and enhanced lateral resolution
(close to diffraction limit)

INFRARED MICROSCOPE BEAMLINE
• Bruker HYPERION microscope
• Resolution down to a few microns in Mid-IR
Infrared objective
Sample
• Computer controlled motorised sample stage
• Bruker OPUS software for data collection and
analysis

TYPES OF MEASUREMENTS USING IR MICROSCOPE
• Transmission
• Reflectance
• ‘Transreflectance’
• Grazing angle Reflectance measurements
• Attenuated Total Reflectance
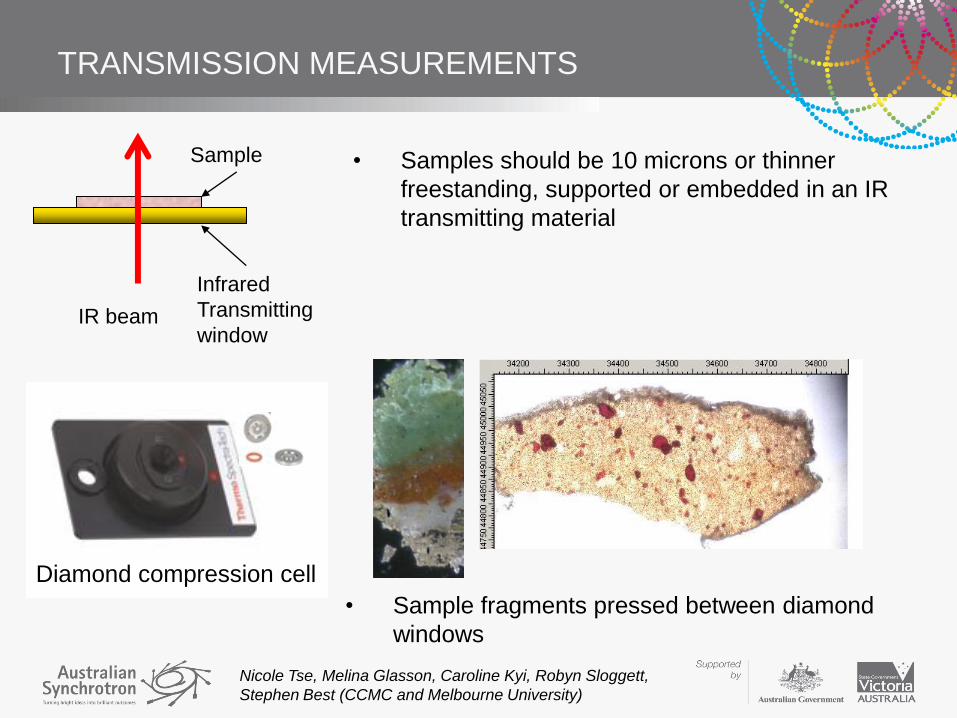
TRANSMISSION MEASUREMENTS
Infrared
Transmitting
window
Sample
IR beam
• Samples should be 10 microns or thinner
freestanding, supported or embedded in an IR
transmitting material
Diamond compression cell
• Sample fragments pressed between diamond
windows
Nicole Tse, Melina Glasson, Caroline Kyi, Robyn Sloggett,
Stephen Best (CCMC and Melbourne University)

DEGRADATION 19TH CENTURY PARCHEMET SUPPORTS
DUE TO COROSIVE NATURE OF IRON GALL INK
FTIR transmission spectra for a parchment cross-section.
Degradation followed by the changes in Amide bands
(information on protein structure) from the collagen present
in parchment.
Areas of 19th century indenture
parchment document
showing iron gall ink corrosion
and loss.
Amide I
1635cm-1
Amide II
1525cm-1
Alana Treasure, Dudley Creagh (Australian War Memorial)
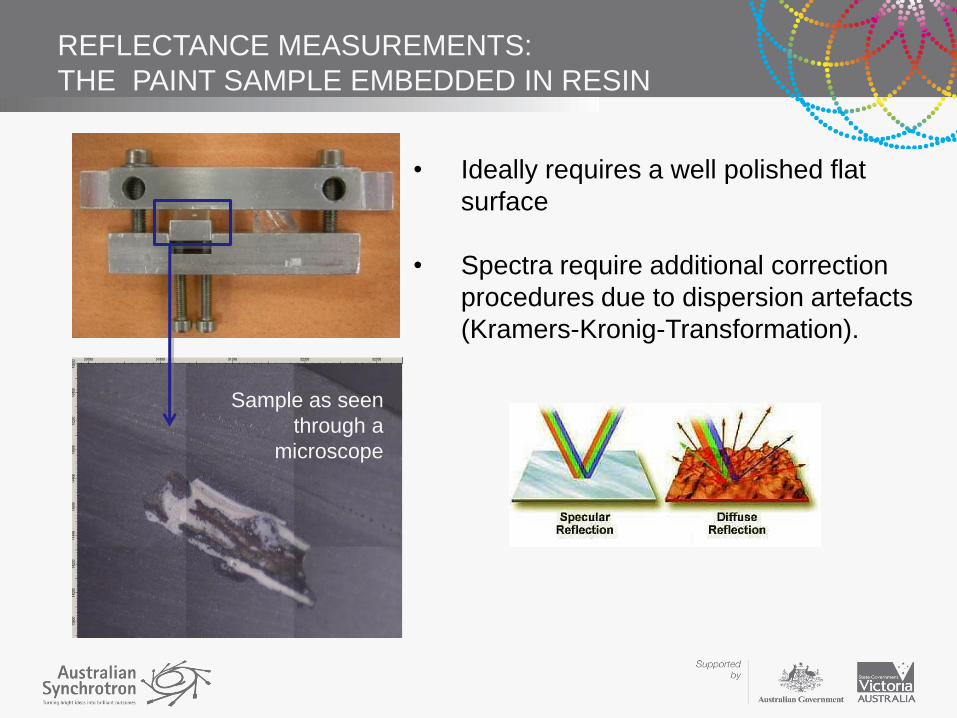
REFLECTANCE MEASUREMENTS:
THE PAINT SAMPLE EMBEDDED IN RESIN
Sample as seen
through a
microscope
• Ideally requires a well polished flat
surface
• Spectra require additional correction
procedures due to dispersion artefacts
(Kramers-Kronig-Transformation).
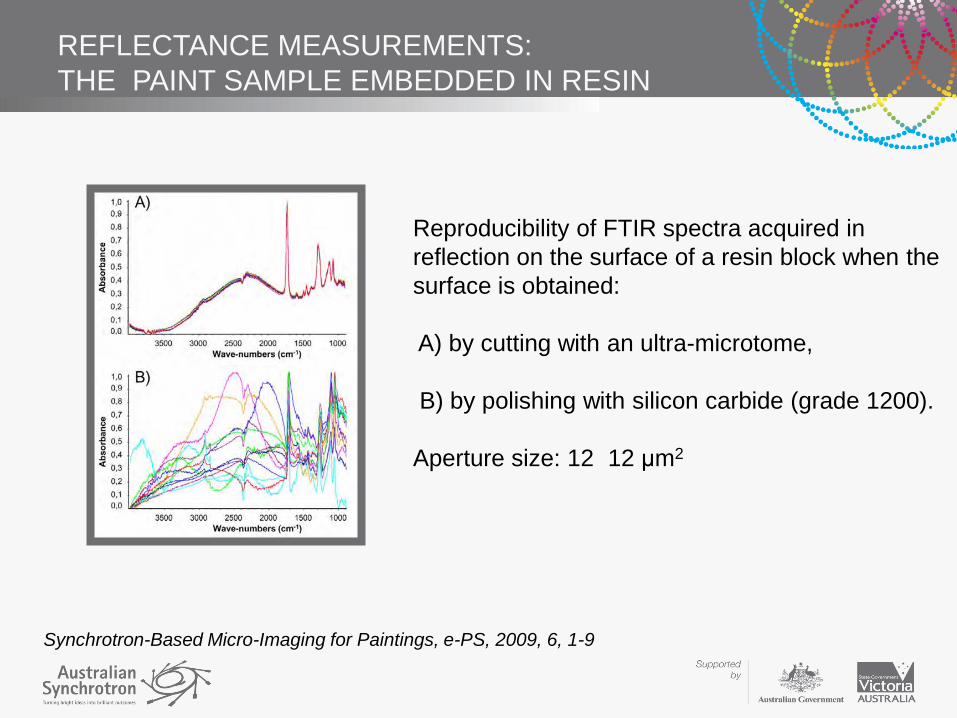
REFLECTANCE MEASUREMENTS:
THE PAINT SAMPLE EMBEDDED IN RESIN
Reproducibility of FTIR spectra acquired in
reflection on the surface of a resin block when the
surface is obtained:
A) by cutting with an ultra-microtome,
B) by polishing with silicon carbide (grade 1200).
Aperture size: 12 12 μm2
Synchrotron-Based Micro-Imaging for Paintings, e-PS, 2009, 6, 1-9
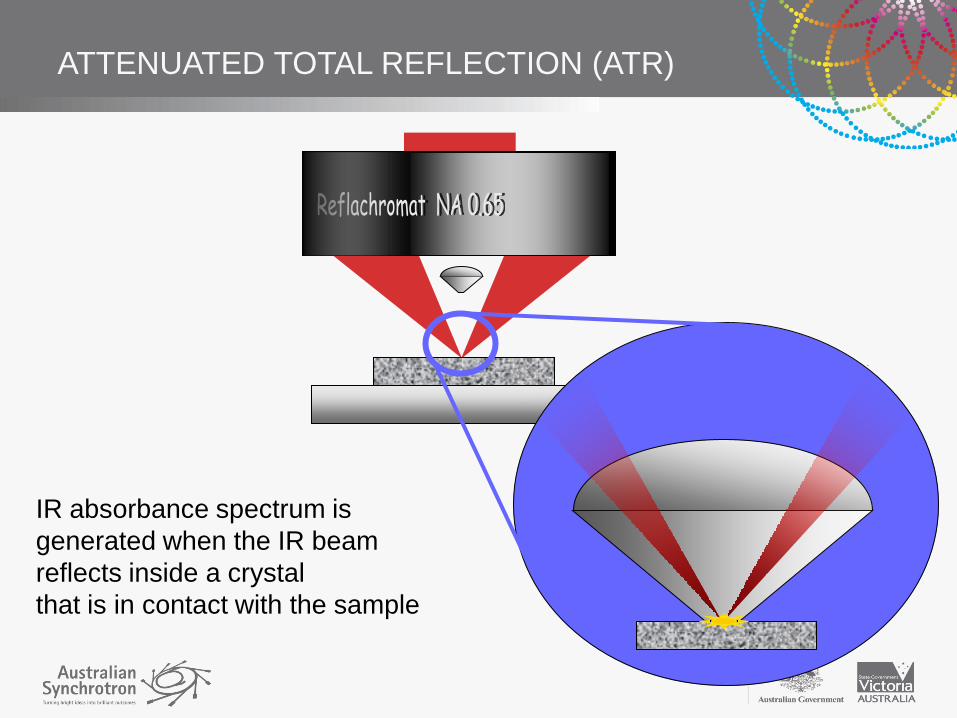
ATTENUATED TOTAL REFLECTION (ATR)
IR absorbance spectrum is
generated when the IR beam
reflects inside a crystal
that is in contact with the sample
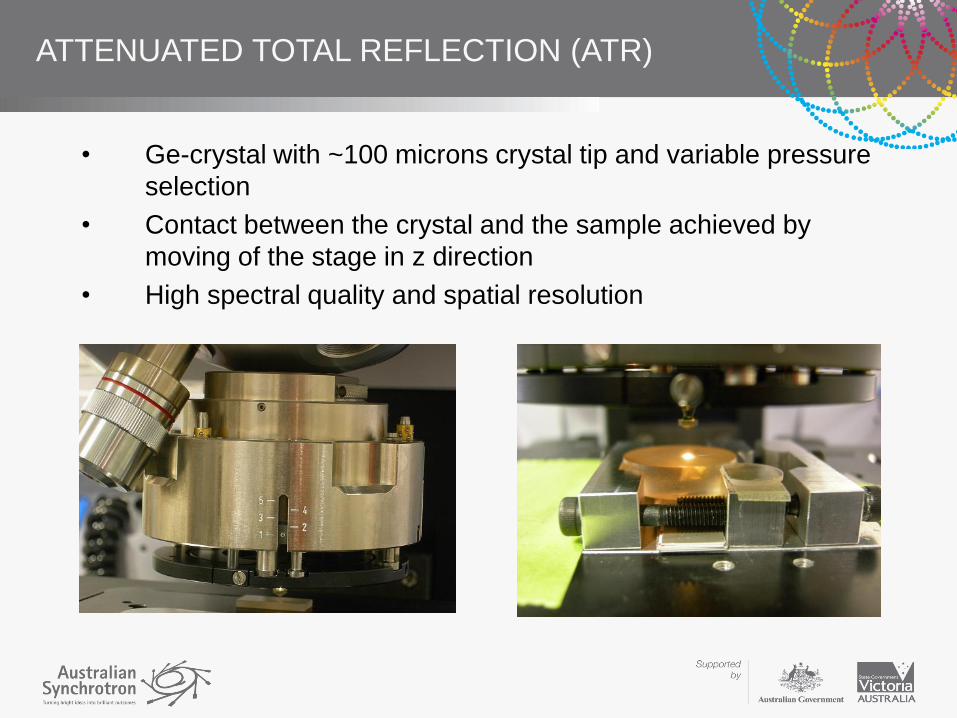
ATTENUATED TOTAL REFLECTION (ATR)
• Ge-crystal with ~100 microns crystal tip and variable pressure
selection
• Contact between the crystal and the sample achieved by
moving of the stage in z direction
• High spectral quality and spatial resolution
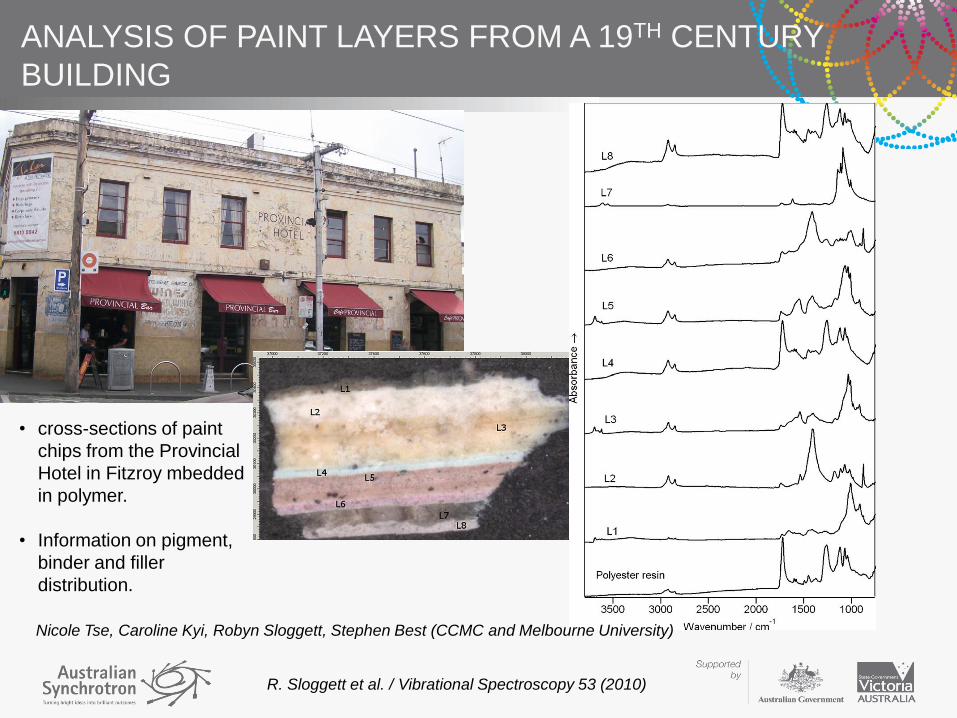
ANALYSIS OF PAINT LAYERS FROM A 19TH CENTURY
BUILDING
• cross-sections of paint
chips from the Provincial
Hotel in Fitzroy mbedded
in polymer.
• Information on pigment,
binder and filler
distribution.
R. Sloggett et al. / Vibrational Spectroscopy 53 (2010)
Nicole Tse, Caroline Kyi, Robyn Sloggett, Stephen Best (CCMC and Melbourne University)
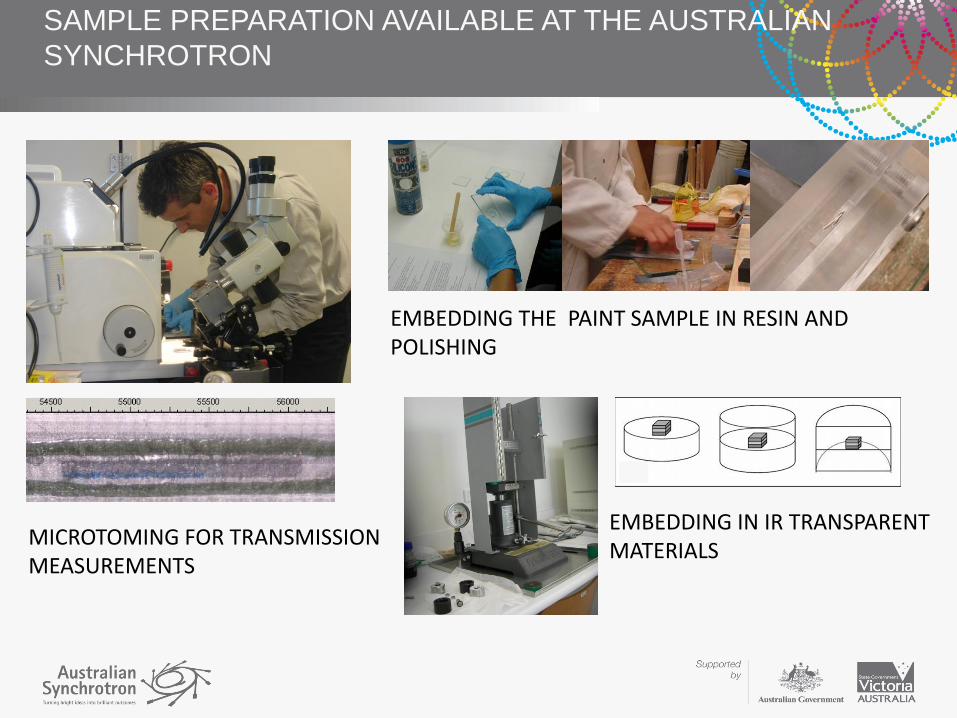
SAMPLE PREPARATION AVAILABLE AT THE AUSTRALIAN
SYNCHROTRON
MICROTOMING FOR TRANSMISSION MEASUREMENTS
EMBEDDING THE PAINT SAMPLE IN RESIN AND POLISHING
EMBEDDING IN IR TRANSPARENT MATERIALS

DATA ANALYSIS
• Mapping cross sections embedded in resin
For analysis of large data sets can use statistical methods:
• Principal component analysis• Cluster analysis
A
A
B
B
FTIR images showing the distribution of the integrated absorbance between certain wavenumbers
CONCLUSIONS
• Very useful tool for a range of materials and artefacts of cultural heritage interest.
• The Synchrotron brightness provides improved data quality and spatial resolution.
• Information on both organic and inorganic components (binders, varnishes, pigments and fillers) in a single analysis.
• Complementary to other techniques such as Raman spectroscopy, XRD and X-ray fluorescence.
• Sample preparation is still critical to obtaining the best results.

ACKNOWLEDGEMENTS
• Australian Synchrotron:
– Mark Tobin, Danielle Martin
– Mechanical workshop group particularly Alan Easdon and Trent Smith
• Centre for Cultural Materials Conservation, Melbourne University:
– Robyn Sloggett, Caroline Kyi, Nicole Tse, Petronella Nel, Melina Glasson
• Melbourne University:
– Stephen Best
• Australian War Memorial and Canberra University:
– Alana Treasure, Dudley Creagh
• Queensland University of Technology, Brisbane :
– Rosemary Goodall

CONTACT DETAILS
Ljiljana PuskarTel: (03) 8540 4183
Email: [email protected] Synchrotron
800 Blackburn RoadClayton 3168 VIC
AUSTRALIA


