
Annual Status of Education Report (Rural) 2006Provisional
January 5, 2007
ASER2006 - Rural
Annual Status of Education Report (Rural)Date of publication: January 5, 2007
Cover: ‘Mother and child in Kamrup’, a member of the ASER team took this picture in Assam.Back cover: ‘Logging into education’, a member of the ASER team took this picture in Himachal Pradesh.Other photos: All photos taken by volunteers as they visited villages.
Also available on CD.
For more information: [email protected]
Price:
Students: Rs. 100Other individuals: Rs. 200Institutions: Rs. 500Outside India: USD 50.00/GBP 25.00
Layout by: Trimiti Services, Mumbai
Printed by:
Published by:
Pratham Resource CenterMumbai office:Ground Floor, YB Chavan Center,Gen. J. Bhosale Marg, Nariman Point,Mumbai, 400 021.Phone: 91-22-22886975, 91-22-23851405
New Delhi office:A1/7, Safdarjung Enclave,New Delhi, 110 029.Phone: 91-11-26716083/84

Provisional
January 5, 2007
Annual Status of Education Report (Rural) 2006

INDIA RURAL
Districtwise distribution of% out-of-school children aged 6-14
% out of school childrenaged 6-14
Maps may not be accurate or to scale. These are mere representations.
ii ASER 2006

INDIA RURAL
Districtwise distribution of % Std I and II childrenwho can read letters or more
% Std I and II children whocan read letters or more
Maps may not be accurate or to scale. These are mere representations.
ASER 2006 iii

They reached the remotest villages of India
Sr. No. Andaman & Nicobar Islands
1 Nehru Yuva Kendra Sangathan (NYK)
2 Prayas
Andhra Pradesh
3 Loksatta
Arunachal Pradesh
4 Action Aid Society for Arunachal
5 National Sevice Scheme (NSS)
6 Rupa Town Club
Assam
7 Assam Mahila Samata Society
8 Barluit Foundation
9 National Service Scheme (NSS)
10 SEWA (Social and Economic Welfare Association)
11 The East
Bihar
12 Abhlkaram
13 Adarsh Mahila KalyanKendra
14 Adithi
15 Akhil Bhartiya Sikshit Berojgar Yuva Kalyan Sansthan
16 Angika Mahila Vikas Sangathan
17 Bihar Bahumukhi Jan Kalyan Samiti
18 Centre Direct
19 Chatra Chaya
20 Cresent Education Welfare Trust
21 DEEP
22 Disha Vihar
23 Gram Vikash Manch
24 Gramin Manav Seva Mandir
25 Gramin Sansadhan Vikash Parishad
26 Gyan Vigyan Samiti
27 Harizan Aadiwasi Sikshan Parsikshan Kalyan Sansthan
28 Harizan Kalyan Seva Vikas Sansthan
29 HORAD
30 Jan Shikshan Kendra
31 Jawahar Jyoti Bal Vikash Kendra
32 Jeewan Jyoti Kendra
33 Jila Saksharta Samiti
34 Jyoti Mahila Samakhya
35 Kartayva Welfare Oraganisation
36 Koshis
37 Preeti Jagriti
38 Rastriya Vikas & Samaj Kalyan Parisad
39 Samagra Manav Seva Samiti
40 Saran Zila Samagra Vikash Sansthan
41 Shanti Silp Kala Kendra
42 Shyam Samaj Kalyan Aadars Sansthan
43 St. Paul Foundation
44 Tagore Sanskritik & Kalatamak Vikas Sah Pariwar
Niyojan Sanstahan
45 Vikas Bharti Gramin Sodh Sansthan
46 Vindyachal Samaj Uthan Samiti
Chhattisgarh
47 CG Gramin Seva Samiti, Mahasamund
48 CG Janjati Vikas Parishad, Ambikapur
49 Integrated Child Development Services, Urban Project,
Raipur
50 Lokshakti, Raigarh
51 Raigarh Ambikapur health association, Jashpur
52 Sandhan Sansthan, Durg
53 Sankalp Sanskriti Samiti, Raipur & Dhantri
54 Vardarshan, Kabirdham
55 Social Revival Groups, Korba
56 Srijaan Kendra JC
57 Vasudha Mahila Manch, Bilaspur
58 Voluntary Association for Nature and Local Awarness,
Dantewada
Dadra Nagar Haveli
59 Asha Guest House
60 Godawari Parvlekar College, Talasari District, Thane
61 Khanvel Marathi Prathamik School Khanvel
62 Shashkiya Kanya Vasti Gruha Khanvel
63 Vanvasi Kalyan Ashram Khanvel
Delhi
64 Agaz
65 CISH-TECH (Computer Institute of Software
and Hardware Technology)
66 IGNOU
67 Jamia Milia Islamia
68 Nai Umang
69 Protsahan
Goa
70 D.M.H. College
71 Saraswat College
72 Nav Nirman College, Dodamarg
73 Dodamarg Junior College
74 Ratnagiri Yuwak Yuvati Mahila Mandal
Gujarat
75 Abhiyan
76 Anarde Foundation
77 Anmol Rural Devlopment Foundation
78 Arrvalli Gram Vikas Sansthan
79 Bajrang Gram Vikas Trust
80 Bhavnagar Mahila Sangh
81 Chuval Gram Vikas Trust
82 Dalit Yuva Sangathan
83 Development Support Team
84 Friends Sports Club
85 Gram Lakshmi Trust
86 Gram Vikas Sangthan
87 Gram Vikas Seva Trust
88 Gujrati Bhasha Sahitya Bhawan, Bhavnagar University
89 ISWA
90 Jankalyan Seva Samiti
91 Jyoti Trust
92 Kanooni Sahay Kendra
93 Kantha Vistaar Satatyapurna Vikas Samita
94 Mahila Samaj
95 Marag
96 Municipal Arts and Science College
97 Navjagruti
98 Navjyot Foundation
99 NSS Unit, M S University, Vadodara
100 Prayosha Pratisthan
101 Rural Development Foundation
102 Sahyog Trust
103 Sargam Youth Club
104 Sarvani Charitable Trust
105 Saushtra Dalit Yuva Sangthan
106 Shantigram Nirman Mandal
107 Shikshan and Samaj Kalyan Kendra
108 Shramik Vikas Sansathan
109 SSP
110 Swami Vivekanand Institute for Nature
Development
111 Swami Vivekanand Yuva Mandal
112 Udgam
113 Ujjval Education Charitable trust
114 Vishwamangal
115 WASMO
116 Young Citizens of India
117 Youth Action Force
118 Yuva - the real social service
Haryana
119 CDS
120 ESDI
121 Government Polytechnique
122 I T I
123 Nehru Yuva Kendra
124 SANKALP
125 SARD
126 SARTA
127 SEWA
128 Social Work Department, KU
129 Vikas Gram Uday Mandal
130 Gramin Vikas Mandal, Nihalgash
131 Dronacharya Govt. College, Gurgaon
132 Govt. Post Graducate College, Gurgaon
133 Pt. J. L. Nehru Govt. (PG) College, Faridabad
Himachal Pradesh
134 District Project Office, Solan
135 Govt. Degree College, Kullu
136 Govt. P. G. College, Shimla-6
137 Govt. P. G. College, Rampur
138 Himachal Jan Vikas Sahyog Sansthan
139 IICE
140 Navjagriti
141 Nehru Yuva Kendra
142 Regional Employment Office, Mandi
143 SEVA
144 SEWA Himalayas
145 Uthaan
146 Govt. P. G. College, Bilaspur
Jammu & Kashmir
147 Animal Husbandary Department
148 Jammu University
149 Kargil Development Project
150 Kashmir University
151 Faculty of Education, Kashmir University
152 Students of Journalism, Bharti Vidya Bhavan, Jammu
153 DIET Kishtwar, Doda
Jharkhand
154 Samajik Parivartan Sansthan
155 Lokprerna Kendra
156 Nav Bharat Jagriti Kendra
157 Sahyogini
158 Jharkhand Gramin Vikash Trust
159 Gramin Navodya Kendra
160 Lohardagga Gram Swarya Sansthan
161 Gramin Foundation
162 Jansahbhagi Kendra
163 Vikash Bharti Foundation
164 SETU
165 Abhiyan
166 Lohiya Viklang Sewa Samiti
167 Lok Chirag Sewa Sansthan
168 Community Development Centre
169 Youth Unity for Volunteery Action
170 Lok Hit Sansthan
171 Rastriya Vikash Evam Samaj Kalyan Parishad
Karnataka
172 Akshara Foundation
173 Azim Premji Foundation and World Vision of India
174 Azim Premji Foundation, Hampi Kannada
University Students & Jindal South West Foundation
175 Basaveshwar Vidyavardhak Sangh
176 Department of Education, University of Mysore
177 Embark
178 Gogate Institute for Engineering & BIRDS
179 Govt. First Grade College
180 Help
181 Initiatives for Development Foundation (IDF)
182 Janahitha
183 Jnana Vikas Trust
184 MAHE (Manipal Academy for Higher Education) -
with a partner
185 Malenadu Education Society
186 Navodaya Education Trust
187 POWER
188 Sadhana
189 Sammeelan
190 Sarvodaya (Integrated Rural Development and
Technical Education Society)
191 Savodaya Koppal
192 Vikasana
Kerala
193 Kudumbasree, Thiruvanthapuram
194 Kudumbasree, Kollam
195 Kudumbasree, Pathanamthitta
196 Kudumbasree, Alapuzha
197 Kudumbasree, Ernakulam
198 Kudumbasree, Idukki
199 Kudumbasree, Kannur
200 Kudumbasree, Kasargod
201 Kudumbasree, Kottayam
202 Kudumbasree, Kozhikode
203 Kudumbasree, Malappuram
204 Kudumbasree, Palaghat
205 Kudumbasree, Trissur
206 Kudumbasree, Wayanad
Madhya Pradesh
207 Abhar Mahila Samiti, Chhatarpur
208 Alok Sansthan, Satna
209 Assistant Collector, Betul
210 Astha, Sehore
211 Dristi Yuvak Kalyan Samjik Utthan Samiti, Shahdol
212 Gram Sanchar Shiksa Samiti, Sehore
213 Gramin Janjagruti Mahila Mandal, Datia & Damoh
214 Gramudyog Sansthan, Mandla
215 ISECT Computer Center, Sagar
216 Kameshawari Shiksha
217 MV Foundation, Hoshangabad & Tikamgarh
218 Nehru Yuva Kendra
219 Prayas Samajsevi Santhan, Balaghat
220 Samaj Kalyan Samiti
221 Saman Santhan, Panna
222 Samritan Education Society, Satna
223 Shobha Edu. & Samaj Kalyan Samiti, Satna
224 Social Group of Satya Patakheda, Sehore
225 Swarar Gramoshan Jankallan Yuva Vikas Samiti, Sidhi
226 ZSK, Ratlam & Vidisha
Maharashtra
227 Adiwasi Ekta Parishad
228 Anurag Addhyapak Vidyalaya, Bhandara
229 Arts & Commerce College
230 Arvind Babu Deshmukh Mahavidyalaya Bharsingi
231 Astha Kendra, Islampur
232 Avishkar Sanstha
233 Beleshwar Sevabhavi Sanstha
iv ASER 2006
234 Dhyanganga Samajik Shikshnik Sanstha
235 Ekta Mitra Mandal
236 Ganesh Organisation
237 Gramonti Bahuddeshiya Sanstha
238 Indira Gandhi Mahavidyalaya, Kalmeshwar
239 J P Walvi Kala Mahavidyalaya
240 J.M. Patel College, Bhanadara
241 Janseva Prathishtan
242 Jijamata College, Buldhana
243 Kranti Shakari Sakhar Karkahna, Kundal
244 Krantijyot Samajik Sanstha
245 Kumbhalkar Social Work College
246 Lamdev Patil Mahavidyalaya Mandal, Tal. Kuhi
247 Lions Club
248 Lokhitwadi Sevabhavi Sanstha
249 Lokmanya Tilak College
250 Lokseva Janvikas Mandal
251 Mother Teresa Mahavidyalaya, Katul
252 Mahatma Phule Samajkarya Mahavidyalaya
253 Mahatma Jotiba Phule College of Social Work, Buldhana
254 Manvi Hakka Abhiyan,Tuljapur
255 Mansi Mahila Mandal
256 MAVIM, Sangali
257 MSW College
258 Muknayak Sanstha, Miraj
259 Nabira Mahavidyalaya, Patol
260 Nikki Mitra Mandal
261 Nutan Maharashtra Vidya Vikas Mandal, Bhandara
262 Pradnya Mahavidyalaya
263 Pragati Krushi Gramin Vikas Sanstha, Jat
264 Pragati Mahila Vikas Mandal, Thane
265 Pragati Mahila Vikas Mandal
266 Prahar Samajik Kalyankari Sanstha
267 Prerana Swaymrojgar Sanstha
268 Rachnatmak Saghrsh Sanstha
269 Raigad Military School
270 Rajarambapu Dyanprabodhani, Islampur
271 Rajashri Chh. Shahu Jan Pratishtan, Charan
272 S.S.N.G Mahavidalaya
273 Saksham Training Center, Yelwat
274 Samata Bhau Soc, Amravati
275 Samta Pratisthan
276 Sankalp Bhau Prakalp Ralegaon
277 Sankalpa Bahuddeshiya Prakalp
278 Sankalpa Sevabhavi Sanstha
279 Sankalp Foundation, Latur
280 Sath Samajik Sanstha
281 Shivaji Collage, Killari
282 Shwas Bahuddeshya Prakalpa
283 Siddhi Santha Devrukh, Ratnagiri
284 Swapnabhumi
285 Toshniwal College
286 Vanchit Vikas Sanstha, Chalburga
287 Vidya Vikas Vidyalaya
288 Vinayakrao Patil Collage
289 Vanchit Vikas Sanstha
290 Yuva Sanghatan Khedra
291 VOICE Org., Satara
292 Lokpanchayat
Manipur
293 National Service Scheme (NSS)
294 People Resource Development Association
Meghalaya
295 Rilum Foundation
296 United NGOs Forum for Social Justice
297 North East Hill University (NEHU), Tura Branch
Mizoram
298 Young Mizo Association (YMA)
Nagaland
299 Youth Action For Resource Development (YARD)
300 Walo Organisation
301 Hills Club
302 Chakesang Students’ Union
303 Lotha Students’ Union
304 Yingli Multipurpose Society
305 People’s Agency For Development
306 Eastern Nagaland Students’ Union
Orissa
307 Anchalika College, Banta
308 B.N College, Jaiapur
309 Baragarh Panchyat College, Baragarh
310 Bhabani Patna College, Bhabani Patna
311 Bikramdev College, Koraput
312 Debagada Govt. College, Debagada
313 G.M. College, Sambalpur
314 G.P College, Subarhapur
315 Gadibrambha College, Delanga
316 Govt. College, Phulbani
317 Harishpur Baladev College, Jagatringha pur
318 Jiral College, Jiral
319 Keshpur College, Khalikote
320 Khaira College, Khaira
321 M.P.C Junior College, Mayurbhanj
322 Maharshi Dayananda College, Sundergarh
323 Mahima College, Jharsuguda
324 Malkanagiri College, Malkanagiri
325 Marshaghai College, Kendrapara
326 Nabarangapur College, Nabarangapur
327 National College, Nuaparha
328 Nayagarh College, Nayagarh
329 Panchyat College, Bauda
330 Prana Nath College, Khordha
331 Rajendra Autonomus College, Balangir
332 Ranipentha College, Paralakhemundi
333 Rayagada College, Rayagada
334 S.M.R. College, Kendujhar
335 Yubashakti Club, Angul
Pondicherry
336 ADECOM Network
337 Pondicherry Science Forum
Punjab
338 Community Development Society
339 Desh Bhagat Youth Club
340 District Youth Service Department
341 DM College of Education
342 Ekta Youth Club
343 Guru Gobind Singh Sports Club
344 Kheti Virasat Mission
345 Lok Kalyan Samiti
346 Mata Gujri College
347 Mohali Govt. College
348 PAHAL
349 Param Vaibhaw Institute of Paramedical
350 Punjabi University
351 SN College
352 Young Citizen Council
Rajasthan
353 Aravali Seva Samiti
354 ASSEFA
355 Consumer Legal Help Society (with the
help of NSS volunteers)
356 Consumer Unity & Trust Society (CUTS)
357 Dushyant Adarsh Vidhya Mandir Vikas Samiti
358 Educational & Rural Development Society
359 Grameen Envam Samaj Vikas Sansthan
360 Human Employment Ability Development
361 Institute of Rural Management, Jodhpur
362 Marvar Seva Sansthan
363 Moon Light Society
364 My India (BITS Pilani Chapter)
365 Nasha Mukti Sansthan
366 Nehru Yuva Mandal
367 NSS volunteers
368 Parivartansheel Sansthan
369 Patel Sansthan
370 Rajasthan Adivasi Sangh
371 Sahayogi Sewa Sansthan
372 Saraswati Vidhalaya Shikshan Sansthan
373 Sarv Hitkarani Sansthan
374 Shiv Shiksha Samiti
375 Society for Sustainable Development
Tamil Nadu
376 Adaiyaalam
377 Aid India
378 Annai Kasthurbai Mahalir Mandram
379 Aram Foundation
380 Grassroots Foundation
381 Human Mirror Trust
382 Jeeva Anbalayam
383 Kalvi Network
384 Kings Trust
385 Rural Welfare Organisation
386 Sakthi Trust
387 Sinam
388 Siragu
389 Suyam Charitable Trust
390 Tamil Nadu Green Movement
391 Tamil Nadu Science Forum
392 Vidyarambam
393 Zenith Public Charitable Trust
Tripura
394 Tripura University, Centre For Rural Studies
Uttar Pradesh
395 Akhand Prabandh Evam Shodh Sansthan
396 Anuragini - NYK Volunteers
397 Arsee Gramodyog Sansthan
398 Asha Gramothan Sansthan
399 Avriti Welfare Society
400 Bartiya Manav Samaj Kalyan Seva Sansthan
401 Bhartiya Jan Kalyan Seva Sansthan
402 Dept of Social Work, Chatrapati Sahuji
Maharaj Vishwavidyalaya
403 DAV College
404 Dept. of Sociology, PPN Degree College
405 Christ Church
406 DISA
407 G.B. Pant Social Science Institute, Allahabad
408 Galaxy Development Society
409 Gramin Aarthik Evam Krishi Vikas Sansthan
410 Gramin Vikas Awam Punarnirman Sansthan
411 Gramopyogi Lok Vikas Parishad
412 Dept. of Social Work, Lucknow University
413 Jan Kalyan Sansthan
414 Janata Seva Samiti
415 Kamala Shikshan Seva Sansthan
416 Kashi Vidyapeeth, Dept. of Social Work
417 Khadi Gramodyog Seva Sansthan
418 Lok Mitra
419 Mahila Samakhya
420 Manav Seva Kendra
421 Manav Vikas Parishad
422 NSS
423 PAMCO
424 Parivartan Samiti
425 PGSS
426 Rural Youth Cultural Development Society
427 Sadbhawana Gramin Vikas sansthan
428 Sah-Shakti
429 Sai Gramodyog Sansthan
430 Samiksha
431 Sanchit Vikas Sansthan
432 Sarva Hitkari Shiksha Prasar Samiti
433 Sarvangin Gramin Vikas Evam Prashikshan Samiti
434 Shah Bal Kalyan Avam Mahila Kalyan Samiti
435 Shivpujan Shukla Smarak Samiti
436 Shiya Welfare Society
437 Social Welfare Organisation
438 Students of Meerut University
439 Swabhiman Samiti
440 Tarai Environment awareness Samittee
441 Volunteer of K.K. Degree College
442 Volunteers of Aligarh Muslim University
443 Volunteers of Hindustan Scouts &Guide
444 Volunteers of Jan Morcha Press
445 Yuvak Vikas Samiti - Ved Mantra
Uttaranchal
446 Jandesh
447 KAGAAS
448 Maha Devi Kanya Pathshala
449 Parvtiya Vikash Sanshthan
450 REEDS
451 Sanyojak Van Gram Bhumi Adhi Manch
452 Sudha
453 U.J.J.S. Khari
454 Yuvak Mangal Dal
West Bengal
455 CSRA
456 Department of Rural Development, Kalyani
University (INSPARC)
457 Dinajpur Centre For Social Change and
Economic Development
458 Foundation for Science and Environment
459 Fuleswar Rabindra Seba Sadan
460 Inspiration (COB KRS)
461 IRSA (Institute for Research and Social Action)
462 ISHARA
463 Pankhatuli Bhumika
464 Rotary Club of Contai
465 Sister Nivedita Kalyan Samiti
466 St. Joseph’s North Point
467 Trinita Society
468 Rotary Club of Medinipur
ASER 2006 v
vi ASER 2006
Many many people across the country have helped to make ASER this year
better than it was last year. We are grateful to all of you for your time, your
ideas and your belief in ASER.
Sharada Jain, R. Ramanujan, Sridhar Rajagopal, Ravi Subramanian for their
comments and inputs in the process of generating the ASER 2006 tools. In
each state, we would like to thank all those who were consulted and who
provided valuable comments for strengthening ASER 2006 tools.
Bharat Ramaswamy and Alok Kar for their inputs on sampling issues.
Prof Amitabh Mattoo, Shireen Miller, Prof Wahid, Rajendra Kumar, Prof Andre
Betteille, Keshav Desiraju, Amit Kaushik and Vimala Ramachandran for
introducing us to potential ASER partners in different parts of the country.
Vrinda Sarup and Dhir Jhingran for sharing thoughts on the overall design.
C. P. John and Dr. M. G. Sasi Bhooshan for coordinating the survey in Kerala.
Shamlu Dudeja and Nandini Mahtab for support to the team in West Bengal.
Alaka of Mohor for creating the original design of the report and Poonam
Bevli of Facet for helping the new look.
Acknowledgements
Index
Contents
❑ Map of India: Districtwise % out-of-school children aged 6-14 ................................ ii
❑ Map of India: Districtwise % Std I and II children who can read letters or more ....... iii
❑ List of partners ................................................................................................ iv
❑ Acknowledgements ........................................................................................... vi
1. A reversal of roles Madhav Chavan .................................................... 1
2. Being under six years in rural India! Vimala Ramachandran ....................................... 2
3. So, just what does this mean? Amit Kaushik ...................................................... 4
4. About the survey
❑ Choosing Villages: Sampling Strategy ................................................................. 8
❑ What to do in the village? .................................................................................. 9
❑ Tests and testing .............................................................................................11
5. ASER2006 Rural: Findings
❑ Enrollment .....................................................................................................20
❑ Learning.........................................................................................................24
❑ Mothers .........................................................................................................28
❑ Young children ................................................................................................29
6. The National picture ...............................................................................................32
7. Jammu and Kashmir, Himachal Pradesh, Uttaranchal, Punjab, Haryana .........................38
8. Rajasthan, Bihar, West Bengal, Jharkhand, Andaman and Nicobar, Uttar Pradesh ...........60
9. Gujarat, Daman and Diu, Dadra and Nagar Haveli, Madhya Pradesh,Chhattisgarh,Orissa 86
10. Maharashtra, Andhra Pradesh, Goa, Karnataka, Kerala, Tamil Nadu, Pondicherry.. ........ 112
11. Mizoram, Assam, Meghalaya, Manipur, Nagaland, Arunachal Pradesh, Tripura .............. 142
Annexures
❑ Sample ........................................................................................................ 168
❑ Sample Design of Rural ASER 2006 ................................................................. 169
❑ Survey form ................................................................................................. 172
❑ Support in cash and in kind ............................................................................ 174

Madhav Chavan
A reversal of roles
Someone very supportive of ASER remarked recently that the mobilization of over 20,000 volunteersacross the country - in every state, in 549 districts - is a great example of people’s participation. Is it?
ASER is a people’s initiative. It is independent of the government and of people who have powers ofvarious kinds but it is not without power of its own. It is constructive and not interested in pointingfingers. It is the growing Abhiyan outside the Sarva Shiksha Abhiyan.
ASER2006, the second milestone since this people’s initiative began, records some simple facts. 1.The proportion of out of school children has not diminished. 2. Children are entering formal schoolingone year too early. 3. Older children are in lower classes in large numbers. 4. Learning levels showsome improvement but more needs to be done on a nationwide scale. 5. Mother’s education is highlycorrelated with the child’s and nearly half the mothers cannot read.
It is important to record here, that although the picture may not appear to have changed a whole lotin one year, there is a lot of governmental effort in many states and at the center to improve thesituation, mainly on the part of the administrators at the top. So, what is missing?
Much can be written about the fundamental right that has fallen by the wayside, the need to providefunds, to improve monitoring, to build schools, to appoint and train teachers of this kind or that.There is nothing new to be said except, “Just do it!”, like the younger generation says these days.
But, beyond all this, especially where improvement in the quality of education is concerned, focusedand purposeful efforts are still missing. Where these efforts have been made, change is visible.
Among the states where purposeful efforts were made, Madhya Pradesh results are nothing short ofunbelievable. This success underscores two important points. One is that the very teachers andofficers who are maligned and blamed, can perform given the right focus, the responsibility, andleadership. Saying, “You can do it” is more effective than saying, “You better do it”. Secondly, there isgood progress when efforts in schools are supported at home by mothers, volunteers, and thepanchayat. Giving them tools and activities to help the children learn daily is important. Just meetingsare not effective. Finally, planned state-wide initiatives not broken up into small “innovative” pro-grams are needed.
ASER is nothing if it does not lead to action. Three critical interventions arise out of ASER2006.
First, in states where large numbers of children do not recognize alphabets or numbers in Std 1 and2, reading and arithmetic ability in later years is poor. Correcting this is easy as many states haveshown this year. But it is important to add that children should be able to read simple texts and knownumbers with place value by the end of Std 2.0
Second, children who can read fluently can comprehend. A ‘reading period’ in every classroom andgood graded reading material in each school library is all that is really needed to improve fluency inreading. Just provision of textbooks is not enough. Children need good reading material.
Third, mothers’ education affects enrollment, learning, dropping out, and gender bias. Involvingmothers, even if they are illiterate is important. In fact helping mothers learn with their children willgo a long way in not only children’s learning, but also preventing dropping out of school and removinggender bias. There is a need to integrate the listless adult literacy programs with improvement ofquality in schools.
The Read India campaign being launched today is a constructive satyagraha to make an impact alongthe above three lines. It is a people’s initiative that will work with skill, determination, openness, andhumility so that the youth of India and the mothers of children can change the status of education inthe villages with the help of teachers. It will appeal to various levels of governments to participate andask for cooperation in a reversal of roles.
Education and democracy are interlinked. ASER and Read India are about enhancing both in action.
ASER 2006 1

Vimala Ramchandran1
1 Educational Resource Unit, New Delhi.2 NFHS 3 Fact-sheets (www.nfhsindia.org/factsheet.html ), Employment and underemployment – the situation among social groups in India 2003-04, GOI October2006 and Focus On Children Under Six – abridged report December 2006.3 National pages in this report, see page 32.
Three important sets of data and reports became available to the public in the last quarter of 2006.First came the state-wise fact-sheets from NFHS-3, then the NSS 61st round data and FOCUS reporton the situation of children under six in India. All three converge to tell a simple story - mothers arefrail and anaemic, 585 out of 1000 rural women are not literate, only 199 have studied up to primaryand 113 up to middle school and as many as 500 out of 1000 households do not have a single literateadult female. Not only do close to one-third of new-born babies weigh less than 2.5 kg, their nutri-tional status worsens during the first two years. 46 per cent of children under six are undernourished,more than half of our children are not immunised fully, a fifth of the children suffer from frequentbouts of diarrhoea and almost one-tenth of our children never reach age five2!
Though much of this has been known for some time, we are not planning for the education and careof our children nor doing much by way of pre-school education as young children wander into primaryschool before they turn six! True, there are wide state-wise variations with some regions of thecountry performing badly on almost all fronts while others seem to be coping with greater ease. Yetit is difficult to deny that the nutrition, health, early childhood care and education of the under-six hasfailed to receive the attention it merits. Interestingly 2005 was also the year when Government ofIndia decided to conclusively transfer all services for children below 6 years of age to the Departmentof Women and Child Development.
ASER 2006 enriches our information base on under-six children. The highlight of the survey is that asmany as 46.6 per cent of five year olds are enrolled in primary schools, the situation varying widelybetween states. While only 6.2 and 5.4 per cent five-year-olds are in school in Goa and Maharashtra,the proportion goes up to 74.0 per cent in Orissa and 70.8 percent in Rajasthan! Only 68.6 percent offour-year olds and 59.9 percent of three-year-olds attend anganwadis / balwadis. As the Nationaltables in this report show,3 by the time children reach 6 years 90.3 per cent of them are enrolled inprimary school. One implication is that the proportion of under-age children in class one is highresulting in a highly uneven group of children in class one; some of it spilling over into class 2.However, as we move from the educationally disadvantaged to the more advanced states the corre-spondence between age and class becomes much more balanced after classes 1 and 2.
Reinforcing one of the main highlights of FOCUS, ASER 2006 too underlines the need to sit up andplan for pre-school education. But why do so many five-year-olds enrol in primary school. Is it thatthe ICDS programme does little other than feed children (of course, some states are exceptions) andits pre-school component remains weak? Equally, given the growing demand for pre-school educa-tion, parents have little option but to enrol them in primary schools.
The other big story from ASER 2006 has to do with the relationship between the education of mothersand the children. While it is well-known that children of educated mothers get support at home - theinformation collected from mothers in the surveyed households helps us get a better understandingof this relationship. Many more children of mothers with no schooling are not enrolled or have droppedout and more importantly the gender gap in families where the mother never went to school is wider.Equally significant - even when mothers are not literate - intensive reading / learning support tochildren in the school helps narrow the gap between children with literate and non-literate mothers.A well-functioning school, regular teaching, availability of libraries and intensive / time-bound readingprogrammes make a big difference. Here is a big role for panchayats, local youth groups and othercivil society organisations. Creating a learning environment through libraries, local education fairs /melas, learning to read programmes can turn the tide in favour of a learning school.
Being under six years in rural India!
2 ASER 2006
To break the apathy that has enveloped institutions of education and learning, it is important toenergise people and get them to start taking greater interest in the education of children. Even simpleefforts like encouraging parents (mothers and fathers) to ask their children what they have learnt inschool every day, whether they have any homework or tests and check on what they have done wouldbe a great help.
Another puzzle that has emerged from ASER 2006 is to do with adult learning4. It is not surprisingthat the percentage of mothers who never went to school seems more-or-less to correspond withthose who could not read level 1 text. Thus while there are some state-wise variations, it may beimportant to enquire about the status of the adult literacy programmes and also whether there is aliteracy component in the self-help group movement in many parts of the country. While it is morelikely that mothers who had at least completed primary level education continue to read and write,those who went to school for fewer years did not show the same degree of facility with reading. Again,this reinforces the well accepted axiom that at least five years of school is necessary for a person toretain and use the literacy and numeracy skills - especially if they live in an environment where theydo not have access to reading material.
The above findings need to be read in conjunction with that of the 61st round of NSS which revealsthat close to 50 per cent of households in rural areas have no literate female and 26 per cent do nothave any literate member aged 15 and above5. State-wise differences are wide - 70 per cent ruralhouseholds in Rajasthan have no literate female adult and 33 per cent no literate adult; 66 per centin Jharkhand have no literate female and 36 percent no literate adult and in Bihar 65 per centhouseholds have no literate female adult and 38 percent no literate adult.
The implications of these findings are indeed serious. First, children from households with no literateparent are in the greatest need of pre-school education. Simple pre-school education material in thehands of a dedicated pre-school teacher would make a big difference to retention and learning inschool. Equally, focused reading programmes, libraries and other activities that energise the learningenvironment will make a big difference to first-generation school goers and may well change theoverall educational environment in the village.
It is important to view the life-cycle of children as a continuum - starting from when they are con-ceived till they complete elementary school and acknowledge the continuous and cumulative natureof the positive impact of healthy mothers, proper care during infancy, nutrition, care and stimulationduring early childhood, pre-school education and primary schooling. Deprivation at one level invari-ably compounds the disadvantages faced by children in the next stage, ultimately leading to poorhealth and nutrition status and early withdrawal from school. Both the positives and the negatives areadded on and compounded at the next level of a child's growth.
It may be too late to start worrying about the learning levels of children at class five or eight orworrying about why children studying in higher classes are not able to tackle even grade 1 or 2 levelreading or arithmetic. ASER 2006 rightly turns the spotlight on two critical elements in the learningcontinuum - education status of mothers (and fathers) and pre-school education opportunities forchildren. It is time that the government reconsiders the policy of keeping all under-six out of theeducation sphere and introduce a pre-school / nursery section in all primary schools with a full timeteacher and mid-day meal.
4 Tables about mothers’ education and ability to read are included in the National pages and each state page.5 Table 3.10.1, 61
st
Round NSS Survey Report Number 516, October 2006.
ASER 2006 3
So, just what does this mean?
Amit Kaushik1
1 Amit Kaushik was Director Elementary Education at the Ministry of Human Resources Development, New Delhi between 2001 and 2006.2 Strong Foundations: Early Childhood Care and Education—EFA Global Monitoring Report, UNESCO Paris, 2006.3 Ibid.4 Early Childhood Care and Education—An Overview, Ministry of HRD, Government of India, 2003.5 Process and Outcome Documentation of ECD in Urban Disadvantaged Areas, Mina Swaminathan, National Institute of Urban Affairs 1998, Mimeo.
As with any other exercise carried out on a large scale, the assumptions and results of ASER 2006 will
be questioned by many - what was the methodology used, why one type of measurement and not any
other, the competence of participants to actually measure learning, how does one account for non-
cognitive development, and so on. However, the indisputable fact that remains at the end of the day
is that ASER has the potential to become a strong citizen's initiative involving people and non-
governmental organisations of many differing philosophies and hues. Any process that creates
excitement among ordinary citizens and helps them to feel like a part of the process of educating their
children deserves all the support that it can get. Most of us have long agreed that any significant
improvement to the educational system will be brought about only when we all get involved; in what
may be a unique example of the power of civil society in independent India, ASER could take on the
role of being the catalyst that we - and the education system - so desperately need.
That said, like its predecessor in 2005, ASER 2006 throws up several interesting facts. To start with,
enrolments in schools have remained nearly steady - at the national level, nearly 93.2% of children in
the 6-14 year age group in rural India attend school, as compared to 93.4% reported by ASER 2005.
Looked at the other way around, only 6% of 6-year olds are not in school, which would certainly seem
to be cause for celebration - these are certainly figures that compare well internationally, and even
with developed countries. As one would expect though, this aggregated figure conceals several vital
facts like regional variations or age - inappropriate enrolments. Many of the children who are in
school do not actually belong there - far too many are younger than they should be, and far too many
have not completed school at the right time.
As you will read elsewhere in this report, the high numbers of children enrolled in school before the
age of six years imply that we need to start focusing on this age group too - there is clearly a need to
provide facilities that meet the learning needs of younger children, and to do so quickly. UNESCO's
Global Monitoring Report (GMR) 2007, which was around the theme of early childhood care and
education, acknowledges that this process has begun in India, noting that the government has recently
renewed its commitment to universalising the Integrated Child Development Services (ICDS) Scheme
in view of "…its positive, if uneven, impact on children's survival, growth and development"2. Referring
to studies in Tamil Nadu and Andhra Pradesh, the GMR reiterates the impact of early childhood education
by pointing out that even an undernourished ICDS child attains higher developmental scores than a
well-nourished non-ICDS one3.
In 2003, the Government of India noted that nationally ICDS covered about 20% of the eligible
population of 3-6 year olds4. The National Institute of Urban Affairs5 estimated that even though no
less than 20 percent of the total urban population lived in slums (with up to 40% in the case of
metros), only 8% of ICDS projects were located in urban areas, and not always in the slums or most
needy areas. Although these figures have changed in the intervening years, universalising ICDS will
necessitate significant up-scaling to cover more 3-6 year olds and children in urban areas. Even their
most ardent supporters will admit that both ICDS and Sarva Shiksha Abhiyan suffer from an
overwhelmingly rural bias - their structures and processes are designed to suit rural situations and are
often not relevant to the needs of the urban poor - so this may be an opportunity to ensure that urban
areas receive the attention that is their due.
4 ASER 2006

At the other end of the scale, as many as 21% children are no longer in school by the age of 15-16
years, while those who are may actually be trying to complete the lower grades. At first glance, this
figure may not appear comparable with the drop out rates reported by Government for the elementary
stage. Yet when one looks at the figures of children out of school from age 11 onwards, they re-
emphasise the fact that more than half the children who enrol in Grade 1 drop out before completing
Grade 8. Notwithstanding the very great efforts that have been made in recent years then, the
process of retaining the child once she comes to school has not improved significantly.
Since ASER 2006 shows that the process of entry to school actually begins before the official school
going age of six years (with nearly 85% 5-year olds are enrolled in Balwadis, Anganwadis, government
or private schools), it would be hard to believe that public interest in sending children to school has
not been stimulated adequately; the reasons why children do not stay in school are what should be
engaging our attention now. Greater attention will have to be paid to those factors that result in
pushing children out-inadequate infrastructure, insensitive teachers, and uninteresting (or irrelevant)
curricula. Perhaps the time has come for the focus of our abhiyan to shift.
Researchers have long known that educated mothers are more likely to send their children to school
and to have healthier and better educated children. UNICEF's State of the World's Children Report
2007, released recently, also highlights the correlation between educated mothers and their children.
ASER 2006 confirms that children of mothers who have not been to school are five times as likely to
be out of school. The survey notes the impact of mothers' schooling on the learning of children also,
pointing out that 6-8 year olds of mothers who have not been to school are three times as likely not
to be able to read the alphabet than children of mothers who have at least completed Grade 5.
These would seem to be powerful arguments in favour of increasing the coverage and quality of adult
literacy programmes (instead of closing them down as has been suggested in some quarters), and
targeting their efforts on women, particularly young mothers, in recognition of the fact that an educated
mother serves as a multiplier when it comes to educating her children. As we take steps to improve
the quality of education in the schoolroom, educating the mothers of enrolled (and out of school)
children could lead to surprisingly valuable results in terms of the enrolment and learning of our
children.
When one looks at the numbers of children who cannot either read/comprehend simple passages or
complete simple divisions at the upper end of the primary cycle, it is clear that we need to be seriously
concerned about reaching these children. For them, as well as for those who have completely missed
the chance to go to school, it may be time for us to consider second chances - perhaps an accelerated
learning programme that allows them to complete the elementary cycle in four years instead of the
usual eight, with an emphasis on reading, comprehension and simple arithmetic. Or maybe just a
short two-year programme that enables acquisition of upper primary competencies for children in the
12-16 year age group. Whatever the strategy, planning for these children is imperative before it
becomes too late.
In recent years, there has been much discussion about the age profile of the Indian population, with
great emphasis on its youth. But while this significant proportion of young people represents an
emerging market for business, it is frightening to think of many of them reaching maturity without
acquiring the basic skills of literacy and numeracy. We owe it to our children to make sure that this
never happens.
ASER 2006 5
About the survey

The purpose of the ASER 2006 rapid assessment survey in rural areas is twofold: (i) to get reliable
estimates of the status of children’s schooling and basic learning (reading, writing and math ability) at
the district level; and (ii) to measure the change in these basic learning and school statistics from last
year. In addition to the basic learning tools that we introduced last year, we have added some higher
level tools to the questionnaire this year that tests the comprehension skills of the children. It is also
well known that the mother’s education level has an important effect on the child’s educational status
as well as learning levels. Therefore, in ASER 2006 we will also have questions on mother’s educa-
tional levels and also actually test the mother for basic reading.
The sampling strategy used helps to generate a representative picture of each district. The aim is to
survey all rural districts. The estimates obtained will then be aggregated (using appropriate weights)
to the state and all-India levels.
Last year, using standard sampling techniques, a sample size of 400 households was derived for each
district. This year the sample size is enlarged to 600 households to get an even more accurate account
of how the children in each class are faring. Hence, in ASER 2006 Rural, the sample size is 30 villages
per district and 20 households per village.
The villages were randomly selected using the village directory of the 2001 census. The sampling was
done using the PPS (Probability Proportional to Size Sampling) technique. The PPS is a widely used
standard sampling technique and is the appropriate technique to use when the sampling units are of
different sizes. In our case, the sampling units are the villages. This method allows villages with larger
populations to have a higher chance of being selected in the sample.
In ASER 2006, we kept the 20 villages we had in ASER 2005 and added 10 more villages from the
census village directory. The 10 new villages are also chosen using PPS. The 20 old villages and the
10 new villages will give us a “panel” of villages, which generates more precise estimates of changes.
Since one of the objectives of ASER 2006 is to measure the change in learning since 2005, creating a
panel is a more appropriate sampling strategy. Each district received a village list with appropriate
block information along with the data from the 2001 census on total number of households and total
population.
Like ASER 2005, the village list is final and cannot be replaced. This is to maintain randomness of the
sample to obtain reliable estimates.
The ASER 2006 team has consulted with national level sampling experts including those at NSSO and
ISI.
For more information, please contact [email protected].
Dr. Wilima Wadhwa
Choosing Villages: Sampling Strategy
8 ASER 2006
What to do in the village?
TASK 1: HOW TO MAKE A MAP
● Contact Sarpanch: Introduce yourself to the Sarpanch or to other senior members of thePanchayat. Tell them about ASER. Get the approximate number of households in the villagefrom the Sarpanch. Ask if he has a map of the village (usually patwari has it).
● Start mapping: To get to know the village, walk around and start mapping.
o Talk to people: How many different hamlets/sections in the village? Where they arelocated? What is the social composition of the households in each hamlet/section?What is the estimate of households in each hamlet/section? Tell them about ASER.
o Map: On the map, show the main landmarks – temples, mosques, river, road, school,bus-stop, panchayat bhavan, shop etc. Mark the main roads/streets/paths through thevillage prominently on the map.
● Marking and numbering sections on the map : If the village has hamlets, then mark thehamlets on the map and number them. If the village is one continuous habitation then dividethe entire village in 4 sections. For each hamlet/section, note the estimated number ofhouseholds and the social composition of the hamlet/section. Verify all the informa-tion on the map with people in the village as you walk around. Use the map sheet providedand fill out all the information.
TASK 2: HOW TO SAMPLE HOUSEHOLDS
● If the village consists of more than 4 different hamlets, then make chits with numbers for eachhamlet. Randomly pick 4 chits. If there are 4 or less hamlets, then we will go to all of thesehamlets. If the village is one continuous habitation, then divide the entire village into fourquadrants/sections. We will visit each quadrant/section. Show these sections on the villagemap.
● In the entire village, information will be collected for 20 randomly selected households.
● Go to each hamlet/section. Try to find the central point in that habitation. Stand facing dwell-ings in the center of the habitation. Visit every 5th dwelling in the habitation (e.g. 1st house, 6th
house, 11th house, etc). Get information about the household and children following instruc-tions in the next section.
● If the selected dwelling is closed or if there is nobody at home, note that down on yourcompilation sheet as “house closed” and move to the next open house. Continue until youhave 5 households in each hamlet/section in which there were inhabitants.
● If a household refuses to participate, note that down on your compilation sheet as “Noresponse”. However, as above, move on to the next house. Continue until you have 5 house-holds in each hamlet/section in which not only were the inhabitants present, but they alsoparticipated in the survey.
● If there are no children or no children in the age group 5 – 16 in a household but there areinhabitants, INCLUDE THAT HOUSEHOLD. Take all the relevant information like the householdnumber, name, age and education related information of the adult females. Such a householdwill count as one of the 5 surveyed households in each hamlet/section.
● Stop after you have completed 5 households in each hamlet/section. If you have reached theend of the section before 5 households are sampled, go around again using the same every5th household rule till you have 5 households in the section.
ASER 2006 9
Instructions given to volunteers
● Now move to the next selected hamlet/quadrant. Follow the same process.
● Make sure that you go to households ONLY when children are likely to be at home. Thismeans that it should be a Sunday or holiday.
TASK 3: WHAT TO DO IN EACH HOUSEHOLD:
IN EACH SAMPLED DWELLING: we will note information about all female adults and children wholive in the household on a regular basis.
● Children 3 and 4: On the children’s sheet, note down child’s name, age, whether they areattending anganwadi (ICDS) or any kind of pre-school center. We will not test these children.Note down the mother’s name as well. If the child is not going to any aanganwadi/preschool,etc., note it down under the “Not going to Aanganwadi” section.
● Children 5 to 16: On the children’s sheet, note down child’s name, age and all other details.All children in this age group will be tested in basic reading, basic maths, and writing. If theyare able to read the “story” fluently in the basic reading test then they will be given theadvanced test. Note down the mother’s name as well. We know that younger children will notbe able to read much or do sums but still follow the same process as for all children so as tokeep the process uniform.
● Adult females: More than 16 years of age. On the adult female section of the sheet, list theinformation about all adult females living in the household. Note down name, age, whetherthis person has attended school or not and up to what class they have studied. Ask the womanto read the simple paragraph. Please note that it would be best to have at least one femalemember in the survey team or be accompanied by a (local) female to gather information forthis group.
Other things to remember:
o Non-resident children: Do not survey children who are visiting. These children maybe tested but make sure they are not recorded. Ask members of the household as wellas neighbors about who all live in the household on a regular basis.
o Older children: Often older girls and boys (in the age group 11 to 16) may not bethought of as children. Be sensitive to this issue and therefore avoid using words like“children”. Probe about who all live in the household to make sure that nobody that isin our age group gets left out. Further, often such children are busy working in thehousehold or in the fields. Ask family members to call them so that you can speak tothem directly. If they do not come immediately, mark that household and revisit itonce you are done surveying the other households.
o Children out of the village: If there are children in the family but not in the village atpresent, note down their details in the survey sheet.
Many children may come up to you and want to be included out of curiosity. Do not discouragechildren who want to be tested. You can interact with them. But concentrate on the fact that datamust be noted down ONLY for children from households that have been randomly selected.
MAKE SURE THAT EACH VOLUNTEER IS NEATLY DRESSED, TALKS POLITELY AND ISABLE TO TALK ABOUT ASER 2006. MOST OF ALL ENJOY YOUR SELF AND MAKE SURE
THAT CHILDREN ARE ENJOYING THEMSELVES ALSO.
10 ASER 2006

• ASER 2006 tools are consistent with ASER 2005 tools ensuring comparability across years
• In developing tools, a common framework was followed across all states to ensure that allelements in each tool are the same in every language.
• The content of all tests was cross-checked with state textbook of Std 1, 2 and above forequivalence.
• Before finalization all tools were field-tested repeatedly with children.
• All surveyors in all districts spent a “practice day” in the field during training.
• All districts had tools and instructions in the local language(s) and also one set in English andUrdu.
• The Child could choose the language that she/he is most comfortable to be tested in.
ASER 2006 assessed …
Children in the age group5 to 16 in:
• Reading• Arithmetic• Writing• Comprehension
Women in the householdabove the age of 16 in:
• Reading
Children and women were tested at home.Effort was made to find all family members(women and children) and test them.
Make sure children are relaxed. Chat with
them : Ask them who is their best friend,
what is their favourite game.... Playing
simple games may also help. When the
child seems relaxed then you can
introduce the testing tasks. Give children
time to become familiar with the tool and
the task. Carry several sample tests of
each kind. Let the child practice for a
few minutes with one sample paper. For
actual testing use a different one. If the
child makes a mistake, let her have
another chance. Show her a different
problem. If she is struggling with
subtraction, take her to number
recognition and then come back to
subtraction. Work with the child, until
you are sure of what the child is able to
do comfortably and confidently.
ASER 2006: TESTS AND TESTING
ASER 2006 11
Can Rani read?
Reading tasks for Rani ...
Sample:Hindibasic
readingtest
Similartests
developedin all
languages
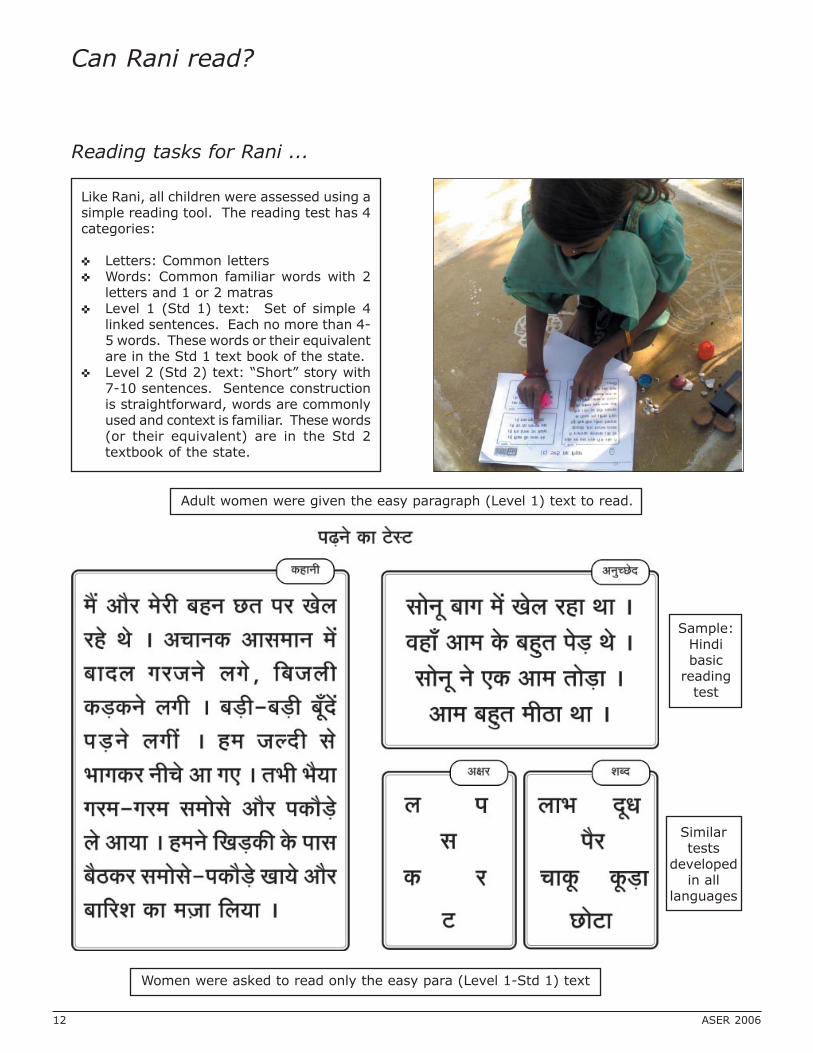
Women were asked to read only the easy para (Level 1-Std 1) text
Like Rani, all children were assessed using asimple reading tool. The reading test has 4categories:
✜ Letters: Common letters✜ Words: Common familiar words with 2
letters and 1 or 2 matras✜ Level 1 (Std 1) text: Set of simple 4
linked sentences. Each no more than 4-5 words. These words or their equivalentare in the Std 1 text book of the state.
✜ Level 2 (Std 2) text: “Short” story with7-10 sentences. Sentence constructionis straightforward, words are commonlyused and context is familiar. These words(or their equivalent) are in the Std 2textbook of the state.
Adult women were given the easy paragraph (Level 1) text to read.
12 ASER 2006

How to test reading?
EASY PARAGRAPH - LEVEL 1
START HERE:
Point to one of the easy paragraphs. Ask the child to readthe easy paragraph.
The child may read slowly. She may stop frequently; she maymake 3 or 4 mistakes in not reading words correctly.But as long as the child reads the text like she is reading asentence, she should be categorized as a child who can readeasy paragraphs. This level is also called LEVEL 1.
While reading the paragraph, if the childstops very often, has difficulty with morethan 3 or 4 words and reads like she isreading a string of words not a sentence,then show her the list of words.
If the child reads the paragraphfluently with ease, then ask herto read the story or LEVEL 2 text.
NEXT, DOWORDS LEVEL 2
NEXT, DOSTORY
Ask the child to read any 5 words from theword list. Let the child choose the wordsherself.If she can correctly read at least 4 out ofthe 5 words with ease, then ask her to tryto read the easy para again.Mark her as a “word” category child if shecan correctly and comfortably read wordsbut is still struggling with the easy para.
Show the child the story. If she can readfluently with ease and reads like she isreading a long text, then she is marked asa “story” child. This child can read LEVEL 2text.
If she is unable to read the story fluentlyand stops a lot, mark her as a “paragraphchild”. This child can read LEVEL 1 text.
If she cannot correctly read at least 4 outof the 5 words she chooses, then show herthe list of letters.
NEXT, DOLETTERS Ask the child to read any 5 letters from the letters list. Let the child
choose the letters herself. If she can correctly recognize at least4 out of 5 letters with ease, then show her the list of words again.She will be marked as a “letter” child if he can read 4 out of 5letters but cannot read words.If not, then mark her as a child who cannot even recognize letters.
ASER 2006 13
Can Rani recognize numbers? Can Rani subtract?Can Rani divide?
Sample:Arithmetic
test
Similartests
developedin all
languages
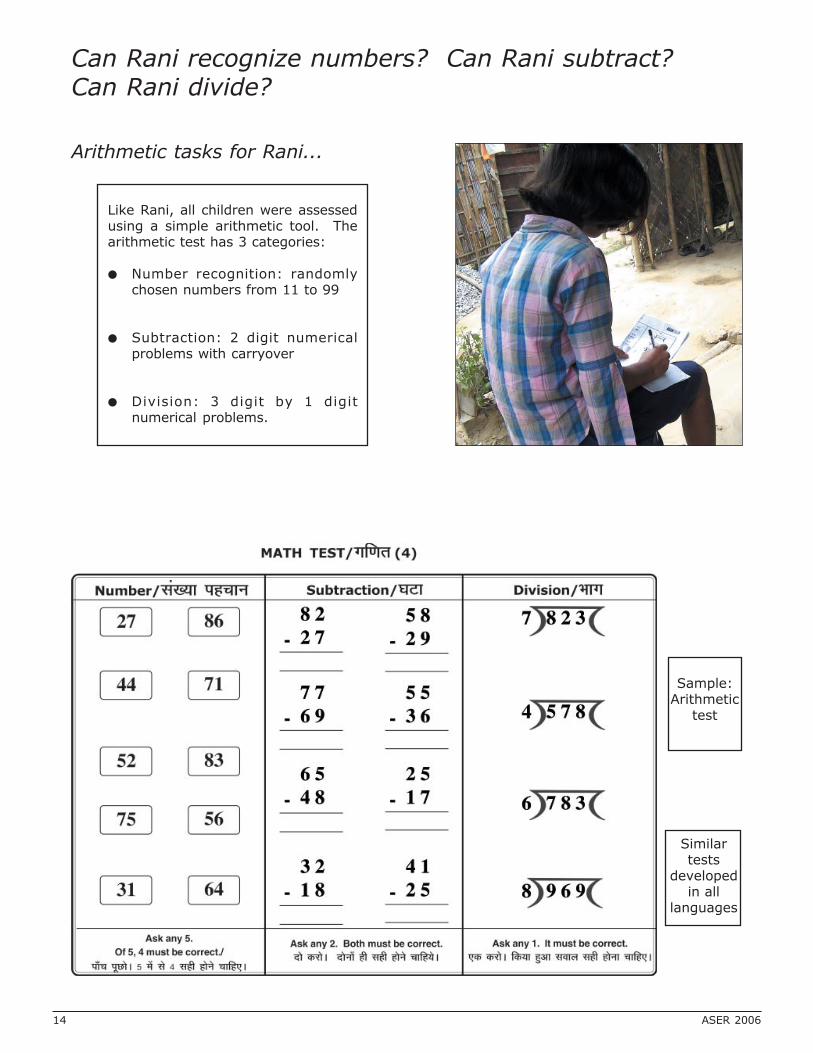
Arithmetic tasks for Rani...
Like Rani, all children were assessedusing a simple arithmetic tool. Thearithmetic test has 3 categories:
● Number recognition: randomlychosen numbers from 11 to 99
● Subtraction: 2 digit numericalproblems with carryover
● Division: 3 digit by 1 digitnumerical problems.
14 ASER 2006

How to test arithmetic? Can Rani do Arithmetic?
SUBTRACTION: 2 DIGIT WITH BORROWING
START HEREWITH
SUBTRACTION
Point to any one of the subtraction sums. Ask the childwhat the numbers are. For example: 56. If the child says5 and 6, ask her again to say what the number is whenthe numbers are together. Point to the minus sign andask “what do you have to do?”
Once you have established that the child correctly recog-nizes the 2 digit numbers you are showing her, ask her towrite and solve the problem. Give her or let her chooseanother similar problem from the sums on the page. Ob-serve the child as she solves the sum.
56
-38
If she cannot correctly do thesubtraction problems, then giveher the number recognition task.
If she does both the subtractionproblems correctly, give her adivision problem.
NEXT, DO NUMBERRECOGNITION
NEXT, DO DIVISION
NumberRecognition
(11-100)
36
48
Point one by one to atleast 5 numbers.
Ask her to identifynumbers.
If she can correctlyidentify at least 4 out of5 numbers then markher as a child who can“recognize numbers.”
If not, mark her as achild who “cannot evenrecognize numbers.”
Division 3 digit
by 1 digit
4687
Show the child thedivision problems. Shecan choose one to try.Ask her to tell you whatthe problem is and whatshe has to do.
Ask her to write andsolve the problem.
Observe what she does.if she is able to correctlysolve the problem, thenmark her as a child whocan do ”division”
If she is unable to do oneproblem, give heranother problem fromthe sheet.
If she is unable to solveany division problemcorrectly, mark her as achild who can do“subtraction”.
ASER 2006 15

Can Rani read, understand and answer?Can Rani read and solve?
Comprehension tasks for Rani ...
Like Rani, all children who are capable of readingstories were assessed using a simplecomprehension tool.
The text has 150-200 words. Sentenceconstruction, vocabulary and grammar at Std 2level of difficulty.
Only fluent readers (those who could read Level2 – Std 2 text) are to be given thecomprehension test.
Children were asked to read and answer 2questions based on the text. Both questionsrequired retrieving information directly fromthe text.
There were 2 additional arithmetic wordsproblems that a child had to read, understandand solve.
The comprehension and computation questions are like those in the Std 2 and Std 3 textbooksof each state. The same set of comprehension tests were translated into all languages.
Similar testswere translated
into alllanguages.Nouns werechanged for
context
16 ASER 2006

How to test comprehension?
Tasks:
Children had to do several tasks. They had to read the text, understand it and answer / solve the
questions below the text.
There were,
❑ 2 questions (comprehension) based on the text.
❑ 2 arithmetic word problems.
GENERAL INSTRUCTIONS
● Children who are able to read at Level 2 (story level) in the basic test should be given the
advanced test.
● Give the test paper to the child and say “Read this carefully. There are some questions you
have to answer on this after you finish reading.”
● Allow the child time to read the passage.
QUESTIONS BASED ON THE PASSAGE:
● Once the child has finished reading, point to Question 1: ask the child to read the question
aloud. Ask the child what the answer is. If you feel the child needs to read the passage again,
ask him or her to do so. The child can re-read the passage upto about 3-4 times.
● The child may tell you the answer in one word, or phrase or sentence. As long as he or she tells
you most of the main point, you should mark a tick in the format – denoting that the child can
read, understand and answer.
● Sometimes children go back and read the passage aloud in order to get the answer to the
question asked. If the child begins to read the passage aloud again and stops at the sentence
which contains the answer the question asked then mark the child as ‘can read+comprehend’’.
If the child continues to read beyond the sentence(s) where the answer is located, then mark
as “cannot read”.
WORD PROBLEMS:
● Ask the child to read each
problem. He or she can read
it aloud to you if needed. Ask
them to solve the problem.
DO NOT tell the child what
needs to be done.
● Ask the child to write down
how they are solving the
problem numerically. Mark as
correct if the child solves the
problem correctly.
ASER 2006 17

Can Rani write?
Writing tasks for Rani …
Like Rani, all children were asked to write a simple sentence that was dictated to them.
To warm up, the child was asked to write something – a friend’s name, name of foods, name of the
village or anything else. The child was not asked to write her name or her father’s name. Most children
can usually do this.
A simple sentence was dictated with clear and correct pronounciation. The sentence was repeated. If
the child stopped halfway, the entire sentence was repeated, not parts of it.
The sentence had 4-5 familiar words. The sentence was like the easy sentence in the easy paragraph
(Level 1 text).
If the child could write the full sentence but made one or two matra mistakes, the child was categorized
as “can write”. If the child could not write the full sentence or made more than 2 matra mistakes then
the child was categorized as “cannot write”.
18 ASER 2006

ASER 2006 19
ASER2006 Rural: Findings
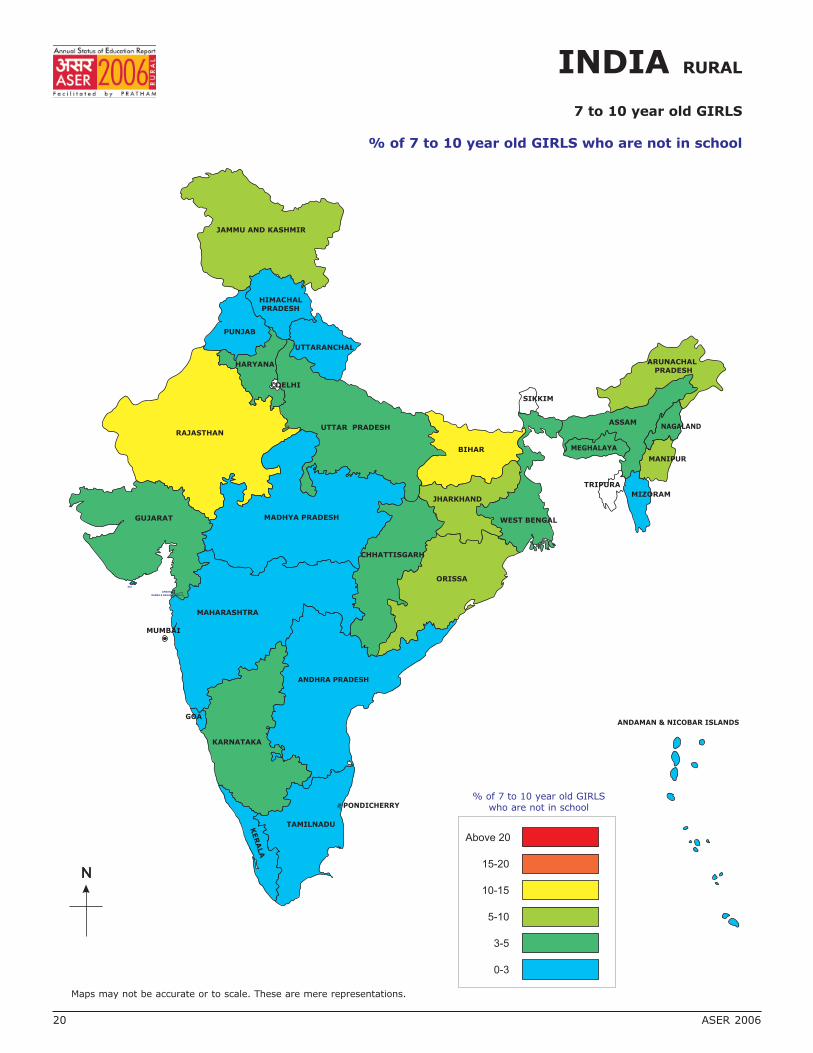
INDIA RURAL
7 to 10 year old GIRLS
% of 7 to 10 year old GIRLS who are not in school
Maps may not be accurate or to scale. These are mere representations.
% of 7 to 10 year old GIRLSwho are not in school
20 ASER 2006

ASER 2006 21
INDIA RURAL
11 to 14 year old GIRLS
% of 11 to 14 year old GIRLS who are not in school
Maps may not be accurate or to scale. These are mere representations.
% of 11 to 14 year old GIRLS who are not in school
22 ASER 2006
ENROLLMENT:
Overall enrollment is unchanged since last year.
Based on ASER 2006 and 2005 results, overall enrollment remains unchanged. There is howevera perceptible shift towards private schools especially in Punjab, Haryana and Karnataka.
● Enrollment remains steady at 93.2% for the 6-14 year age group as against 93.5% lastyear. No change discernible at the national level.
● Out of all 5 year-old children, 46.6% are enrolled in formal schools. Nationally, 5 year-olds form 21.8% of the Std I class. In Orissa, Rajasthan, Madhya Pradesh, Himachal,Uttaranchal and Haryana, the Std I class in 2006-2007 has more than 30% children whowere 5 years old. On the other hand, Maharashtra (3.2%), Nagaland (5.1%) and Karnataka(6.9%) have very small proportions of 5 year olds in the Std 1 cohort.
● In the 7-10 year age group, national enrollment stands at 95.3%. In most states exceptRajasthan, Bihar, Orissa, West Bengal, Jharkhand, Arunachal and Meghalaya enrollmentin 6-10 age group is above 95%.
● In the 11-14 year age group, national enrollment stands at 91.1%. In most states exceptRajasthan, Bihar, Orissa, West Bengal, Jharkhand and Chhattisgarh enrollment is above90%.
Enrollment of girls
● Amongst girls in the 7-10 year age group, more than 95% girls are enrolled in school inmost states except Rajasthan, Bihar, Orissa and Jharkhand.
● Amongst girls in the 11-14 year age group, many states have 10%-20% girls out ofschool. In particular, Rajasthan at 19.6% out of school girls and Bihar at 17.6% standout.
COMPLETING ELEMENTARY EDUCATION:
Four years after the 86th Amendment to the Constitution, large numbers of children will not completeelementary education.
● One of the goals of SSA is that children complete 8 years of schooling. ASER 2006records that 13.5 % of 14 year old children are not in school and an additional 14.4% ofthose that are in school are studying in Std 6 or lower. This means that over 25% childrenwho were 10 years old when the Constitution was amended in 2002 will not completeelementary education this year.
● In the 15-16 year age group, national enrollment stands at 78.7%. However, 24.7% ofthe 15-16 year olds who go to school are still enrolled in Std 8 or lower and are still in theprocess of trying to complete elementary schooling.
● If a child enters school at 6, she/he should be in Std 3 by age 8. If standard and age arecompared across the country, overall, 21.4% of Std 3 children are 10 years or older.However, there are significant variations across states. In Bihar and Jharkhand, morethan 35% of Std 3 children are 10 years or older. This number is 28% in UP. On the otherhand, in Tamil Nadu and Kerala, the percentage of children in Std 3 who are 10 years orolder is less than 3%. There are interesting and important implications to these numbers.Over-age children in primary school are less likely to complete the elementary stage.
ASER 2006 FINDINGS:

ASER 2006 23
PRIVATE SCHOOLS (including aided schools):
Shifts towards private schools in some states.
● Eight states have more than 30% children in non-government run schools whether primary(I-V) or upper primary (VI-VIII) - Manipur (56.7%), Nagaland (46.1), Kerala (45.2%),Meghalaya (44.6%), Goa (44.65), Haryana (40.35), Punjab (37.25) and UP (30.25). Thestates differ in the ratio of aided to unaided schools.
● Ten states have between 15% and 30% children in non-government run schools.
● ASER records big shifts in the last year into private schools. An increase of more than 5percentage points was recorded in Punjab (16+), Goa (15.35+), Haryana (9.8+) andKarnataka (6.1+). The shift to private schools has been at the expense of governmentschool enrollment.
Overall, more boys (20.4%) are in private schools than girls (16.8%). For the 7-10 age group, if wecompare percentage of boys enrolled in private school with that of girls, the largest differences bygender are in Punjab (50% boys and 43% girls) and Haryana (51% boys and 39% girls).
INDIA RURAL
Private schooling
Statewise map showing % of children inStd I to VIII going to private schools
% of children in Std I toVIII going to private
schools
Maps may not be accurate or to scale. These are mere representations.

LEARNING LEVELS: For Std I-II Reading
● At an all India level, a gain is recorded in the proportion of children who can read alphabetsor more by 4.3 percentage points - up from 70.3% last year to 74.5% in 2006.
● More than 5 percentage points improvement recorded in Madhya Pradesh (+31.9), Punjab(+13.9), Orissa (+13.5), Haryana (+10.2), Andhra Pradesh (+9.6) and Maharashtra (+6.5).
● In Punjab there is only a minor improvement in the learning levels in government schoolsand there is no major improvement in learning levels in the private schools. Hence, the bigoverall change appears largely due to the massive shift to private schools, which show amuch better performance than government schools.
● In most other states, there is a small change or no discernible change.
% of children inStd I and II who can
read alphabets or more
24 ASER 2006
INDIA RURAL
Std I and II reading
Statewise map showing % of children in Std I and II who can read alphabets ormore
Maps may not be accurate or to scale. These are mere representations.
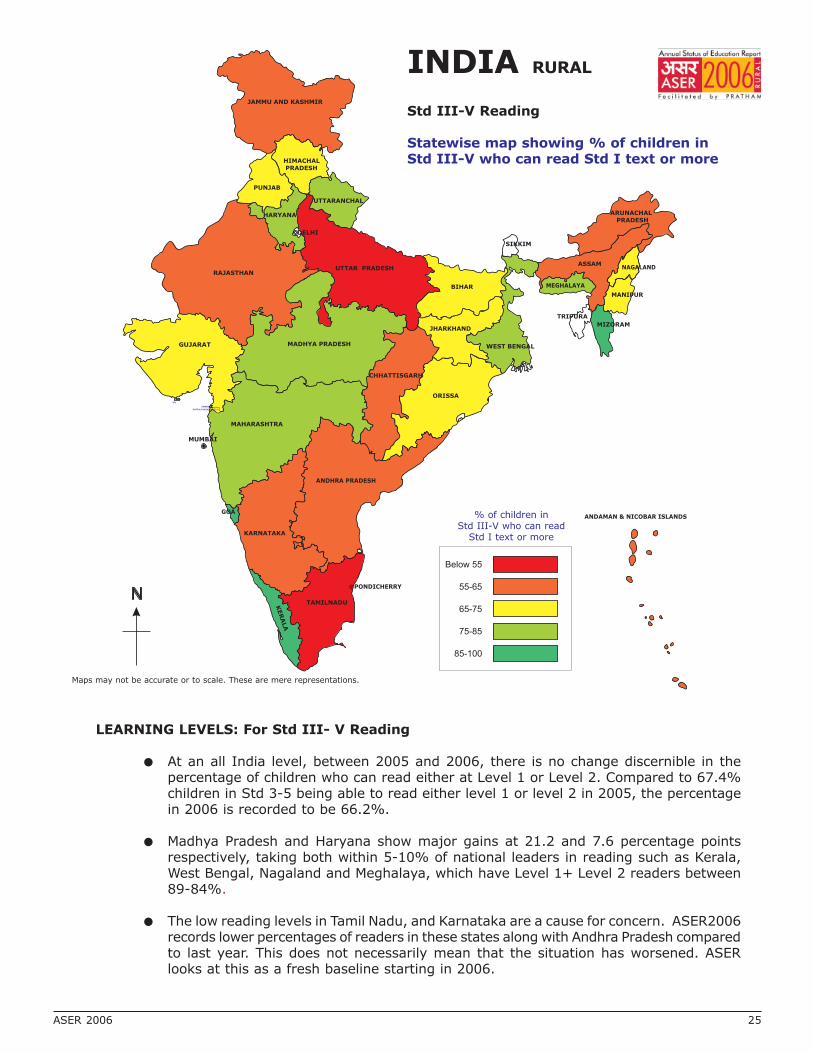
LEARNING LEVELS: For Std III- V Reading
● At an all India level, between 2005 and 2006, there is no change discernible in thepercentage of children who can read either at Level 1 or Level 2. Compared to 67.4%children in Std 3-5 being able to read either level 1 or level 2 in 2005, the percentagein 2006 is recorded to be 66.2%.
● Madhya Pradesh and Haryana show major gains at 21.2 and 7.6 percentage pointsrespectively, taking both within 5-10% of national leaders in reading such as Kerala,West Bengal, Nagaland and Meghalaya, which have Level 1+ Level 2 readers between89-84%.
● The low reading levels in Tamil Nadu, and Karnataka are a cause for concern. ASER2006records lower percentages of readers in these states along with Andhra Pradesh comparedto last year. This does not necessarily mean that the situation has worsened. ASERlooks at this as a fresh baseline starting in 2006.
ASER 2006 25
% of children inStd III-V who can read
Std I text or more
INDIA RURAL
Std III-V Reading
Statewise map showing % of children inStd III-V who can read Std I text or more
Maps may not be accurate or to scale. These are mere representations.

26 ASER 2006
LEARNING LEVELS: For Std I- II Math
● At an all India level, a gain is recorded in the proportion of children who can recognizenumbers or do more math by 5.3 percentage points up from 55.3% to 60.6%.
● More than 5 percentage points improvement recorded in Madhya Pradesh (+35.7), Orissa(+17.9), Maharashtra (+13.7), Haryana (+12.3), Chhattisgarh (+10.9), Andhra Pradesh(+9.4), Rajasthan (+7.5), Punjab (+7.0) and Jharkhand (+6.5).
● In most other states, there is a small change or no discernible change.
● The difference in % children who can recognize numbers or do more in math betweenGovernment and Private schools nationwide is only 8.4 percentage points in favor of Privateschools. In Madhya Pradesh, Nagaland, Mizoram, Meghalaya, Goa, and Kerala the differenceis under 2 percentage points. It is around 10-16 percentage points in UP, Punjab, Haryana,Himachal, Rajasthan, Karnataka, Bihar, Jharkhand and West Bengal.
% of children inStd I and II who canrecognize numbersor do more math
INDIA RURAL
Std I and II Math
Statewise map showing % of children in Std Iand II who can recognize numbers or do moremath
Maps may not be accurate or to scale. These are mere representations.
ASER 2006 27
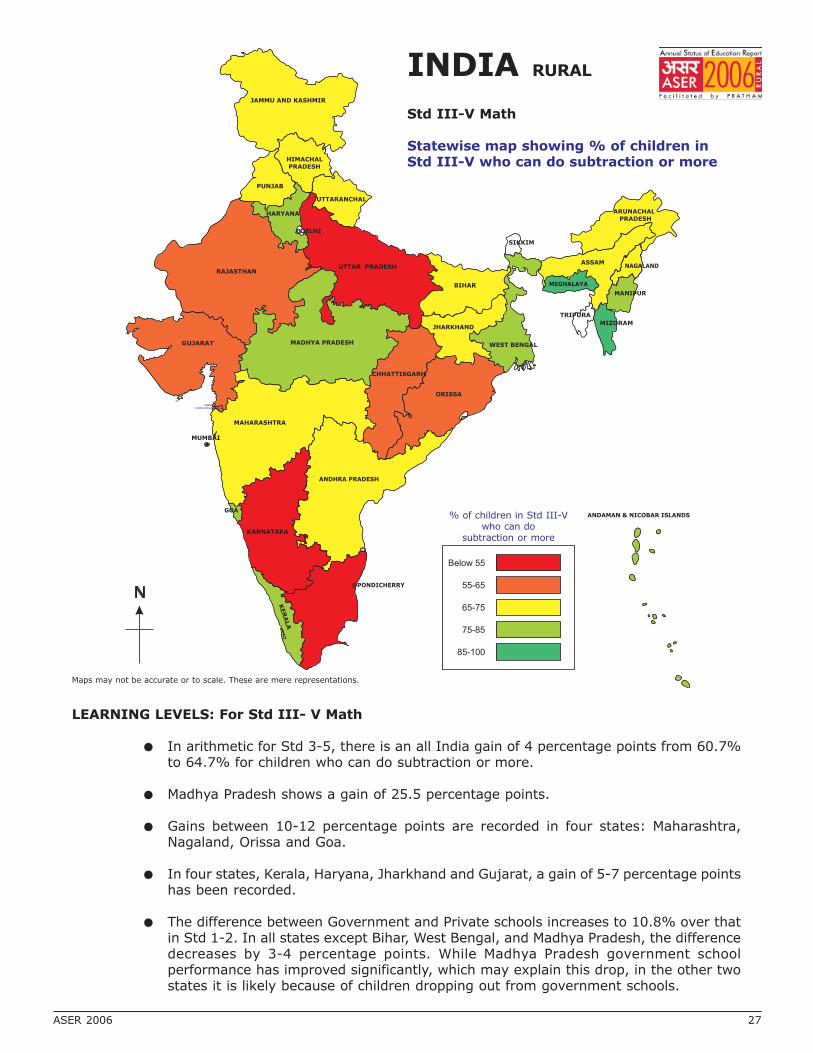
LEARNING LEVELS: For Std III- V Math
● In arithmetic for Std 3-5, there is an all India gain of 4 percentage points from 60.7%to 64.7% for children who can do subtraction or more.
● Madhya Pradesh shows a gain of 25.5 percentage points.
● Gains between 10-12 percentage points are recorded in four states: Maharashtra,Nagaland, Orissa and Goa.
● In four states, Kerala, Haryana, Jharkhand and Gujarat, a gain of 5-7 percentage pointshas been recorded.
● The difference between Government and Private schools increases to 10.8% over thatin Std 1-2. In all states except Bihar, West Bengal, and Madhya Pradesh, the differencedecreases by 3-4 percentage points. While Madhya Pradesh government schoolperformance has improved significantly, which may explain this drop, in the other twostates it is likely because of children dropping out from government schools.
% of children in Std III-Vwho can do
subtraction or more
INDIA RURAL
Std III-V Math
Statewise map showing % of children inStd III-V who can do subtraction or more
Maps may not be accurate or to scale. These are mere representations.
COMPREHENSION:
Fluent readers comprehend. A case for improving fluent reading.
● Comprehension was measured for the first time in ASER 2006. The data indicates that if a child(at any age or standard) can read Level 2 text fluently, his or her ability to answer comprehensionquestions is high. By Std 4, over 90% of fluent readers are able to answer simple comprehensionquestions. Fluent readers’ ability to correctly solve word problems in arithmetic is limited onlyby their inability to do arithmetic operations. This finding underlines the importance of ensuringfluent reading as a foundation for any educational progress.
MOTHERS:A case to integrate mothers’ literacy efforts with schools.
● Of mothers in the age group of 17 to 55 years who were surveyed in ASER 2006, 52.02% havenot been to school and 52.87% cannot read a Level 1 (Std 1) text.
● 95.7% mothers who have completed Std 5 or more can read a Std 1 text. The proportion ofmothers who can read is lower for mothers with lower levels of schooling. For example, just50% mothers who have completed Std 1 are able to read. Of women who have not been toschool, over 99% women cannot read.
Mothers and children
● For mothers who have had no schooling, the chances that their children will be out of school ismuch higher (at almost 10%) than that of their schooled counterparts (2.5%).
● There does not appear to be a gender difference in school enrollment of children whose mothershave had schooling. For unschooled mothers, the percentage of sons being out of school (at8.4%) is lower than that of daughters (at 11.4%).
● In terms of the relationship between young children’s learning levels and mothers’ schooling,25% children of unschooled mothers are unable to recognize even alphabets as compared to12.8% children of schooled mothers.
● Across the board, more 6 to 8 year-old children cannot recognize numbers as compared totheir ability to recognize letters. Here too, children of unschooled mothers have a greaterdisadvantage.
28 ASER 2006

YOUNG CHILDREN:
A self-evident case for pre-school classes in school.
● At the all India level, enrollment in anganwadi or balwadi is 68.6% for 4 year olds. However,there are inter-state variations. In Maharashtra and in Southern states except AP, morethan 90% of all 4 year-olds go to anganwadis. But in the North and the Northeast less than60% of all 4 year olds are in anganwadis in most states.
● By the time they are 5 years old, a large majority (84%) are either in anganwadi/balwadior in school. The proportion of children in anganwadi drops from almost 68.6% at age 4 to38% at age 5 with 46.6 % 5 year olds enrolling in Std I.
● There are significant variations at the state level. More than 60% of all five year olds arein school in Punjab, Rajasthan, Orissa, Arunachal Pradesh and Manipur. In 14 states, theproportion of 5 year-olds going to school is greater than 50%.
● Of all 5 year olds going to school, 12.2% are in private schools. In several states, however,more than 25% are in private schools. These include Jammu & Kashmir, Punjab and Haryana.
School enrollment is high by the time children are 6 years, most of them (88.4%) are in school.
% of 4 year oldswho go to anganwadi
ASER 2006 29
INDIA RURAL
Age 4 Years Anganwadi
Statewise map showing% of 4 year olds who go to anganwadi
Maps may not be accurate or to scale. These are mere representations.


The National picture
INDIA RURAL
All analysis based on data from 549 out of 575 districts
Enrollment
Age and Class
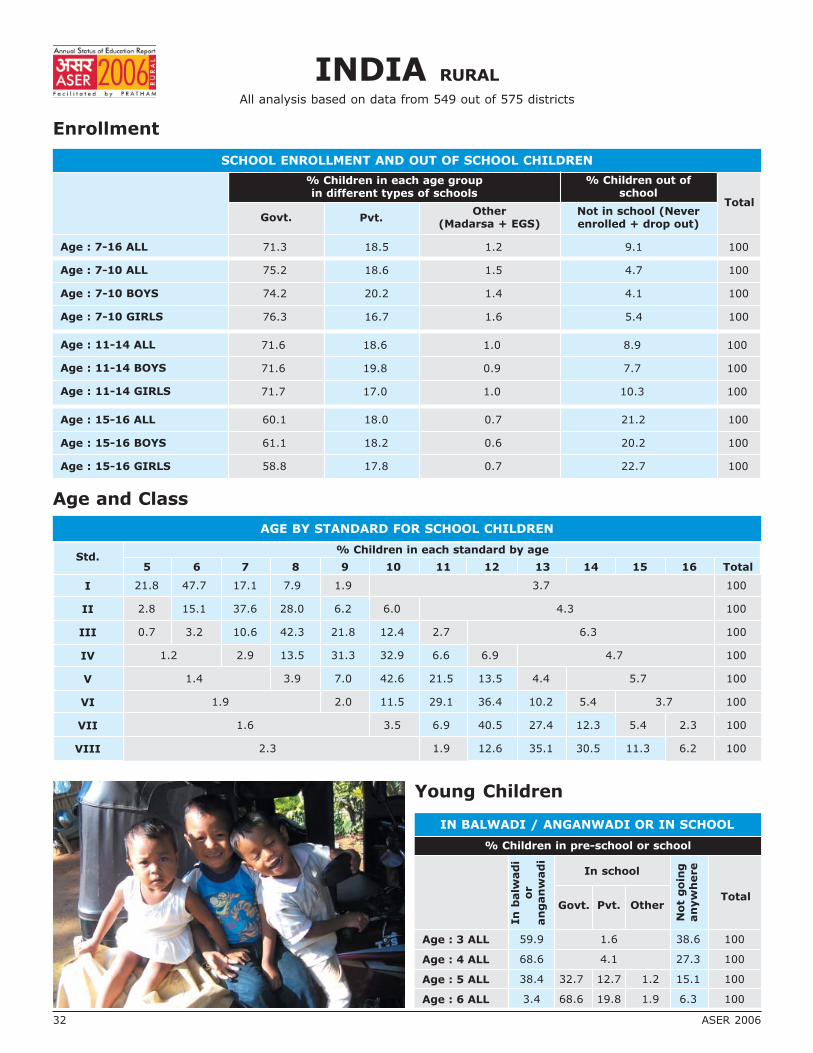
SCHOOL ENROLLMENT AND OUT OF SCHOOL CHILDREN
% Children in each age groupin different types of schools
% Children out ofschool
Govt. Pvt.Other
(Madarsa + EGS)Not in school (Neverenrolled + drop out)
Total
Age : 7-16 ALL
Age : 7-10 ALL
Age : 7-10 BOYS
Age : 7-10 GIRLS
Age : 11-14 ALL
Age : 11-14 BOYS
Age : 11-14 GIRLS
Age : 15-16 ALL
Age : 15-16 BOYS
Age : 15-16 GIRLS
71.3 18.5 1.2 9.1 100
75.2 18.6 1.5 4.7 100
74.2 20.2 1.4 4.1 100
76.3 16.7 1.6 5.4 100
71.6 18.6 1.0 8.9 100
71.6 19.8 0.9 7.7 100
71.7 17.0 1.0 10.3 100
60.1 18.0 0.7 21.2 100
61.1 18.2 0.6 20.2 100
58.8 17.8 0.7 22.7 100
Young Children
IN BALWADI / ANGANWADI OR IN SCHOOL
% Children in pre-school or school
Age : 3 ALL
Age : 4 ALL
Age : 5 ALL
Age : 6 ALL
In
balw
ad
io
ran
gan
wad
i
In school
Govt. Pvt. Other
Not
goin
gan
yw
here
Total
59.9 1.6 38.6 100
68.6 4.1 27.3 100
38.4 32.7 12.7 1.2 15.1 100
3.4 68.6 19.8 1.9 6.3 100
I
II
III
IV
V
VI
VII
VIII
Std.5 6 7 8 9 10 11 12 13 14 15 16 Total
% Children in each standard by age
AGE BY STANDARD FOR SCHOOL CHILDREN
21.8 47.7 17.1 7.9 1.9 3.7 100
2.8 15.1 37.6 28.0 6.2 6.0 4.3 100
0.7 3.2 10.6 42.3 21.8 12.4 2.7 6.3 100
1.2 2.9 13.5 31.3 32.9 6.6 6.9 4.7 100
1.4 3.9 7.0 42.6 21.5 13.5 4.4 5.7 100
1.9 2.0 11.5 29.1 36.4 10.2 5.4 3.7 100
1.6 3.5 6.9 40.5 27.4 12.3 5.4 2.3 100
2.3 1.9 12.6 35.1 30.5 11.3 6.2 100
32 ASER 2006

Learning Level
Reading : % Children who CAN read
I
II
III
IV
V
VI
VII
VIII
Total
Std. Nothing Letter WordLevel 1(Std 1)
text
Level 2(Std 2)
text
Total
38.4 38.3 16.8 4.0 2.6 100
14.2 30.1 32.5 15.0 8.3 100
6.3 16.5 29.3 28.0 19.9 100
3.2 8.9 18.7 31.7 37.6 100
2.1 4.9 11.9 28.1 53.0 100
1.3 2.5 6.7 22.9 66.6 100
0.8 1.5 4.1 17.5 76.1 100
0.6 0.9 2.3 12.6 83.7 100
9.9 14.8 16.5 19.8 39.0 100
Std.
Arithmetic : % Children who CAN
NothingRecognizenumbers
Subtract Divide Total
I
II
III
IV
V
VI
VII
VIII
Total
53.8 38.5 5.7 2.1 100
26.1 49.0 18.9 6.0 100
13.5 38.0 33.3 15.2 100
7.5 24.6 37.4 30.6 100
4.7 16.0 34.0 45.3 100
2.9 10.1 28.5 58.5 100
1.9 7.5 23.3 67.4 100
1.2 5.0 18.0 75.8 100
16.1 25.7 24.6 33.6 100
Writing : % Children whoCAN correctly write
One simple dictatedsentence
I
II
III
IV
V
VI
VII
VIII
Total
Std.
III
IV
V
VI
VII
VIII
Total
Comprehension : % Readers (Level 2) who CAN
Answer atleast onequestion
Answer bothquestions
Solve atleast one
wordproblem
Solve bothword
problems
Std.
89.0 80.3 78.7 64.2
92.3 84.3 82.0 67.5
95.1 88.5 86.9 74.4
96.2 90.4 89.3 77.6
97.0 92.2 91.2 80.3
97.9 93.3 93.0 83.7
95.6 89.6 88.4 76.7
15.6
35.9
56.9
74.4
83.5
90.0
93.5
95.7
64.4
INDIA RURAL
ASER 2006 33
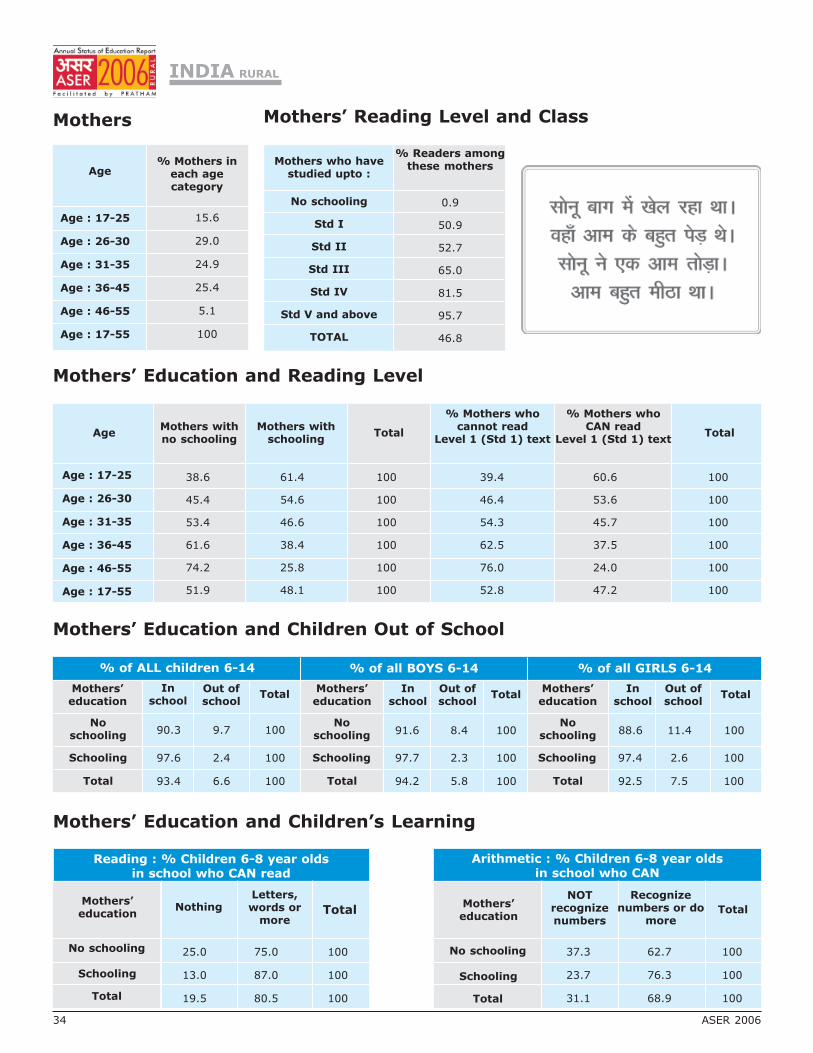
Mothers
Mothers’ Education and Children Out of School
Mothers’ Education and Children’s Learning
Age% Mothers in
each agecategory
Age : 17-25
Age : 26-30
Age : 31-35
Age : 36-45
Age : 46-55
Age : 17-55
% of ALL children 6-14 % of all BOYS 6-14 % of all GIRLS 6-14
Mothers’education
Noschooling
Schooling
Total
Mothers’education
Noschooling
Schooling
Total
Mothers’education
Noschooling
Schooling
Total
Inschool
Out ofschool
TotalIn
schoolOut ofschool
TotalIn
schoolOut ofschool
Total
Reading : % Children 6-8 year oldsin school who CAN read
Arithmetic : % Children 6-8 year oldsin school who CAN
Mothers’education
No schooling
Schooling
Total
Letters,words or
moreTotal
NOTrecognizenumbers
Recognizenumbers or do
moreTotal
Mothers’education
No schooling
Schooling
Total
Nothing
15.6
29.0
24.9
25.4
5.1
100
90.3 9.7 100
97.6 2.4 100
93.4 6.6 100
91.6 8.4 100
97.7 2.3 100
94.2 5.8 100
88.6 11.4 100
97.4 2.6 100
92.5 7.5 100
25.0 75.0 100
13.0 87.0 100
19.5 80.5 100
37.3 62.7 100
23.7 76.3 100
31.1 68.9 100
Mothers’ Education and Reading Level
AgeMothers withno schooling
Mothers withschooling
Total
% Mothers whocannot read
Level 1 (Std 1) text
% Mothers whoCAN read
Level 1 (Std 1) textTotal
Age : 17-25
Age : 26-30
Age : 31-35
Age : 36-45
Age : 46-55
Age : 17-55
38.6 61.4 100 39.4 60.6 100
45.4 54.6 100 46.4 53.6 100
53.4 46.6 100 54.3 45.7 100
61.6 38.4 100 62.5 37.5 100
74.2 25.8 100 76.0 24.0 100
51.9 48.1 100 52.8 47.2 100
INDIA RURAL
34 ASER 2006
Mothers’ Reading Level and Class
Mothers who havestudied upto :
% Readers amongthese mothers
No schooling
Std I
Std II
Std III
Std IV
Std V and above
TOTAL
0.9
50.9
52.7
65.0
81.5
95.7
46.8
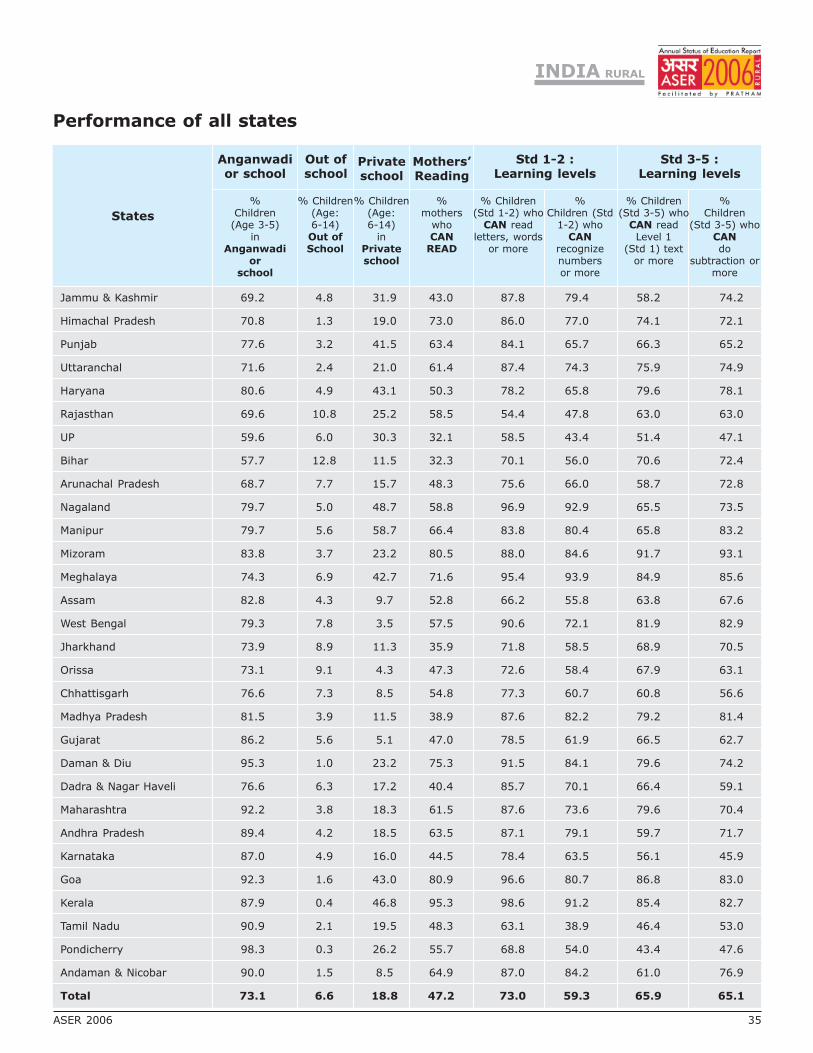
States
Anganwadior school
Out ofschool
Privateschool
Mothers’Reading
Std 1-2 :Learning levels
Std 3-5 :Learning levels
%Children
(Age 3-5)in
Anganwadior
school
% Children(Age:6-14)Out ofSchool
% Children(Age:6-14)
inPrivateschool
%mothers
whoCAN
READ
% Children(Std 1-2) who
CAN readletters, words
or more
% Children(Std 3-5) who
CAN readLevel 1
(Std 1) textor more
%Children (Std
1-2) whoCAN
recognizenumbersor more
%Children
(Std 3-5) whoCANdo
subtraction ormore
Jammu & Kashmir 69.2 4.8 31.9 43.0 87.8 79.4 58.2 74.2
Himachal Pradesh 70.8 1.3 19.0 73.0 86.0 77.0 74.1 72.1
Punjab 77.6 3.2 41.5 63.4 84.1 65.7 66.3 65.2
Uttaranchal 71.6 2.4 21.0 61.4 87.4 74.3 75.9 74.9
Haryana 80.6 4.9 43.1 50.3 78.2 65.8 79.6 78.1
Rajasthan 69.6 10.8 25.2 58.5 54.4 47.8 63.0 63.0
UP 59.6 6.0 30.3 32.1 58.5 43.4 51.4 47.1
Bihar 57.7 12.8 11.5 32.3 70.1 56.0 70.6 72.4
Arunachal Pradesh 68.7 7.7 15.7 48.3 75.6 66.0 58.7 72.8
Nagaland 79.7 5.0 48.7 58.8 96.9 92.9 65.5 73.5
Manipur 79.7 5.6 58.7 66.4 83.8 80.4 65.8 83.2
Mizoram 83.8 3.7 23.2 80.5 88.0 84.6 91.7 93.1
Meghalaya 74.3 6.9 42.7 71.6 95.4 93.9 84.9 85.6
Assam 82.8 4.3 9.7 52.8 66.2 55.8 63.8 67.6
West Bengal 79.3 7.8 3.5 57.5 90.6 72.1 81.9 82.9
Jharkhand 73.9 8.9 11.3 35.9 71.8 58.5 68.9 70.5
Orissa 73.1 9.1 4.3 47.3 72.6 58.4 67.9 63.1
Chhattisgarh 76.6 7.3 8.5 54.8 77.3 60.7 60.8 56.6
Madhya Pradesh 81.5 3.9 11.5 38.9 87.6 82.2 79.2 81.4
Gujarat 86.2 5.6 5.1 47.0 78.5 61.9 66.5 62.7
Daman & Diu 95.3 1.0 23.2 75.3 91.5 84.1 79.6 74.2
Dadra & Nagar Haveli 76.6 6.3 17.2 40.4 85.7 70.1 66.4 59.1
Maharashtra 92.2 3.8 18.3 61.5 87.6 73.6 79.6 70.4
Andhra Pradesh 89.4 4.2 18.5 63.5 87.1 79.1 59.7 71.7
Karnataka 87.0 4.9 16.0 44.5 78.4 63.5 56.1 45.9
Goa 92.3 1.6 43.0 80.9 96.6 80.7 86.8 83.0
Kerala 87.9 0.4 46.8 95.3 98.6 91.2 85.4 82.7
Tamil Nadu 90.9 2.1 19.5 48.3 63.1 38.9 46.4 53.0
Pondicherry 98.3 0.3 26.2 55.7 68.8 54.0 43.4 47.6
Andaman & Nicobar 90.0 1.5 8.5 64.9 87.0 84.2 61.0 76.9
Total 73.1 6.6 18.8 47.2 73.0 59.3 65.9 65.1
INDIA RURAL
Performance of all states
ASER 2006 35
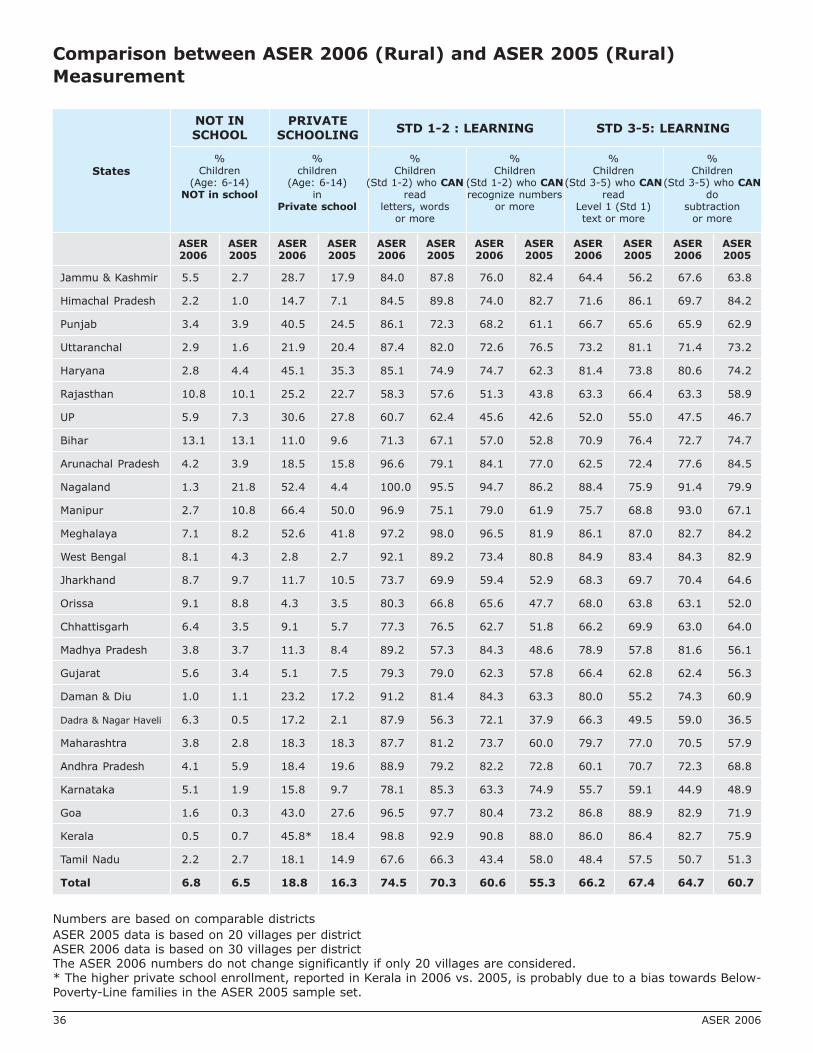
States
NOT INSCHOOL
PRIVATESCHOOLING
STD 1-2 : LEARNING STD 3-5: LEARNING
%Children
(Age: 6-14)NOT in school
%children
(Age: 6-14)in
Private school
%Children
(Std 1-2) who CANread
letters, wordsor more
%Children
(Std 1-2) who CANrecognize numbers
or more
%Children
(Std 3-5) who CANread
Level 1 (Std 1)text or more
%Children
(Std 3-5) who CANdo
subtractionor more
ASER2006
ASER2005
ASER2006
ASER2005
ASER2006
ASER2005
ASER2006
ASER2005
ASER2006
ASER2005
ASER2006
ASER2005
Numbers are based on comparable districts
ASER 2005 data is based on 20 villages per districtASER 2006 data is based on 30 villages per districtThe ASER 2006 numbers do not change significantly if only 20 villages are considered.* The higher private school enrollment, reported in Kerala in 2006 vs. 2005, is probably due to a bias towards Below-Poverty-Line families in the ASER 2005 sample set.
Comparison between ASER 2006 (Rural) and ASER 2005 (Rural)
Measurement
Jammu & Kashmir 5.5 2.7 28.7 17.9 84.0 87.8 76.0 82.4 64.4 56.2 67.6 63.8
Himachal Pradesh 2.2 1.0 14.7 7.1 84.5 89.8 74.0 82.7 71.6 86.1 69.7 84.2
Punjab 3.4 3.9 40.5 24.5 86.1 72.3 68.2 61.1 66.7 65.6 65.9 62.9
Uttaranchal 2.9 1.6 21.9 20.4 87.4 82.0 72.6 76.5 73.2 81.1 71.4 73.2
Haryana 2.8 4.4 45.1 35.3 85.1 74.9 74.7 62.3 81.4 73.8 80.6 74.2
Rajasthan 10.8 10.1 25.2 22.7 58.3 57.6 51.3 43.8 63.3 66.4 63.3 58.9
UP 5.9 7.3 30.6 27.8 60.7 62.4 45.6 42.6 52.0 55.0 47.5 46.7
Bihar 13.1 13.1 11.0 9.6 71.3 67.1 57.0 52.8 70.9 76.4 72.7 74.7
Arunachal Pradesh 4.2 3.9 18.5 15.8 96.6 79.1 84.1 77.0 62.5 72.4 77.6 84.5
Nagaland 1.3 21.8 52.4 4.4 100.0 95.5 94.7 86.2 88.4 75.9 91.4 79.9
Manipur 2.7 10.8 66.4 50.0 96.9 75.1 79.0 61.9 75.7 68.8 93.0 67.1
Meghalaya 7.1 8.2 52.6 41.8 97.2 98.0 96.5 81.9 86.1 87.0 82.7 84.2
West Bengal 8.1 4.3 2.8 2.7 92.1 89.2 73.4 80.8 84.9 83.4 84.3 82.9
Jharkhand 8.7 9.7 11.7 10.5 73.7 69.9 59.4 52.9 68.3 69.7 70.4 64.6
Orissa 9.1 8.8 4.3 3.5 80.3 66.8 65.6 47.7 68.0 63.8 63.1 52.0
Chhattisgarh 6.4 3.5 9.1 5.7 77.3 76.5 62.7 51.8 66.2 69.9 63.0 64.0
Madhya Pradesh 3.8 3.7 11.3 8.4 89.2 57.3 84.3 48.6 78.9 57.8 81.6 56.1
Gujarat 5.6 3.4 5.1 7.5 79.3 79.0 62.3 57.8 66.4 62.8 62.4 56.3
Daman & Diu 1.0 1.1 23.2 17.2 91.2 81.4 84.3 63.3 80.0 55.2 74.3 60.9
Dadra & Nagar Haveli 6.3 0.5 17.2 2.1 87.9 56.3 72.1 37.9 66.3 49.5 59.0 36.5
Maharashtra 3.8 2.8 18.3 18.3 87.7 81.2 73.7 60.0 79.7 77.0 70.5 57.9
Andhra Pradesh 4.1 5.9 18.4 19.6 88.9 79.2 82.2 72.8 60.1 70.7 72.3 68.8
Karnataka 5.1 1.9 15.8 9.7 78.1 85.3 63.3 74.9 55.7 59.1 44.9 48.9
Goa 1.6 0.3 43.0 27.6 96.5 97.7 80.4 73.2 86.8 88.9 82.9 71.9
Kerala 0.5 0.7 45.8* 18.4 98.8 92.9 90.8 88.0 86.0 86.4 82.7 75.9
Tamil Nadu 2.2 2.7 18.1 14.9 67.6 66.3 43.4 58.0 48.4 57.5 50.7 51.3
Total 6.8 6.5 18.8 16.3 74.5 70.3 60.6 55.3 66.2 67.4 64.7 60.7
36 ASER 2006

ASER 2006 37
Jammu and Kashmir
Himachal Pradesh
Uttaranchal
Punjab
Haryana
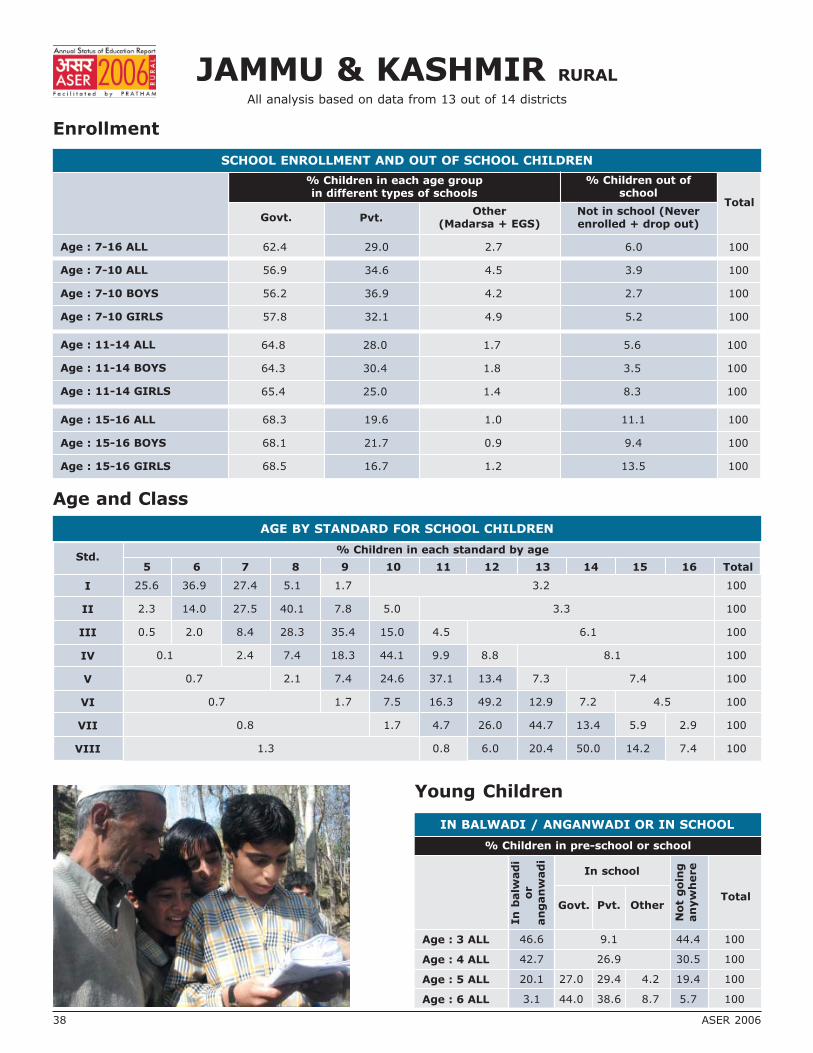
JAMMU & KASHMIR RURAL
All analysis based on data from 13 out of 14 districts
Enrollment
Age and Class
SCHOOL ENROLLMENT AND OUT OF SCHOOL CHILDREN
% Children in each age groupin different types of schools
% Children out ofschool
Govt. Pvt.Other
(Madarsa + EGS)Not in school (Neverenrolled + drop out)
Total
Age : 7-16 ALL
Age : 7-10 ALL
Age : 7-10 BOYS
Age : 7-10 GIRLS
Age : 11-14 ALL
Age : 11-14 BOYS
Age : 11-14 GIRLS
Age : 15-16 ALL
Age : 15-16 BOYS
Age : 15-16 GIRLS
62.4 29.0 2.7 6.0 100
56.9 34.6 4.5 3.9 100
56.2 36.9 4.2 2.7 100
57.8 32.1 4.9 5.2 100
64.8 28.0 1.7 5.6 100
64.3 30.4 1.8 3.5 100
65.4 25.0 1.4 8.3 100
68.3 19.6 1.0 11.1 100
68.1 21.7 0.9 9.4 100
68.5 16.7 1.2 13.5 100
Young Children
IN BALWADI / ANGANWADI OR IN SCHOOL
% Children in pre-school or school
Age : 3 ALL
Age : 4 ALL
Age : 5 ALL
Age : 6 ALL
In
balw
ad
io
ran
gan
wad
i
In school
Govt. Pvt. Other
Not
goin
gan
yw
here
Total
46.6 9.1 44.4 100
42.7 26.9 30.5 100
20.1 27.0 29.4 4.2 19.4 100
3.1 44.0 38.6 8.7 5.7 100
I
II
III
IV
V
VI
VII
VIII
Std.5 6 7 8 9 10 11 12 13 14 15 16 Total
% Children in each standard by age
AGE BY STANDARD FOR SCHOOL CHILDREN
25.6 36.9 27.4 5.1 1.7 3.2 100
2.3 14.0 27.5 40.1 7.8 5.0 3.3 100
0.5 2.0 8.4 28.3 35.4 15.0 4.5 6.1 100
0.1 2.4 7.4 18.3 44.1 9.9 8.8 8.1 100
0.7 2.1 7.4 24.6 37.1 13.4 7.3 7.4 100
0.7 1.7 7.5 16.3 49.2 12.9 7.2 4.5 100
0.8 1.7 4.7 26.0 44.7 13.4 5.9 2.9 100
1.3 0.8 6.0 20.4 50.0 14.2 7.4 100
38 ASER 2006

Learning Level
Reading : % Children who CAN read
I
II
III
IV
V
VI
VII
VIII
Total
Std. Nothing Letter WordLevel 1(Std 1)
text
Level 2(Std 2)
text
Total
18.8 30.3 42.6 4.1 4.2 100
6.9 19.3 54.9 12.9 6.0 100
2.3 9.9 50.8 23.1 13.9 100
2.1 4.9 29.4 37.4 26.2 100
1.5 2.9 19.4 38.5 37.7 100
1.5 2.1 10.0 39.0 47.4 100
0.2 1.9 5.6 31.4 61.0 100
0.8 1.1 4.5 24.1 69.5 100
4.1 8.9 28.1 26.5 32.5 100
Std.
Arithmetic : % Children who CAN
NothingRecognizenumbers
Subtract Divide Total
I
II
III
IV
V
VI
VII
VIII
Total
29.5 52.8 12.1 5.6 100
13.6 44.6 33.8 7.9 100
7.0 30.2 46.6 16.1 100
4.0 17.6 49.2 29.2 100
3.1 14.5 42.4 40.0 100
1.9 9.2 41.1 47.8 100
0.8 6.0 33.3 60.0 100
1.2 5.1 28.8 64.9 100
7.3 22.4 36.8 33.6 100
III
IV
V
VI
VII
VIII
Total
Comprehension : % Readers (Level 2) who CAN
Answer atleast onequestion
Answer bothquestions
Solve atleast one
wordproblem
Solve bothword
problems
Std.
81.5 66.1 80.0 54.9
80.6 66.6 83.7 57.3
84.2 70.0 86.2 65.6
84.7 69.7 90.4 67.4
86.4 76.1 90.0 69.4
87.6 76.7 92.0 71.0
85.2 72.5 88.8 66.7
JAMMU & KASHMIR RURAL
ASER 2006 39
Writing : % Children whoCAN correctly write
One simple dictatedsentence
I
II
III
IV
V
VI
VII
VIII
Total
Std.
40.3
62.6
78.4
85.4
89.2
92.8
95.5
96.9
80.8

Mothers
Mothers’ Education and Children Out of School
Mothers’ Education and Children’s Learning
Age% Mothers in
each agecategory
Age : 17-25
Age : 26-30
Age : 31-35
Age : 36-45
Age : 46-55
Age : 17-55
% of ALL children 6-14 % of all BOYS 6-14 % of all GIRLS 6-14
Mothers’education
Noschooling
Schooling
Total
Mothers’education
Noschooling
Schooling
Total
Mothers’education
Noschooling
Schooling
Total
Inschool
Out ofschool
TotalIn
schoolOut ofschool
TotalIn
schoolOut ofschool
Total
Mothers’education
No schooling
Schooling
Total
Letters,words or
moreTotal
NOTrecognizenumbers
Recognizenumbers or do
moreTotal
Mothers’education
No schooling
Schooling
Total
Nothing
Mothers’ Education and Reading Level
AgeMothers withno schooling
Mothers withschooling
Total
% Mothers whocannot read
Level 1 (Std 1) text
% Mothers whoCAN read
Level 1 (Std 1) textTotal
Age : 17-25
Age : 26-30
Age : 31-35
Age : 36-45
Age : 46-55
Age : 17-55
JAMMU & KASHMIR RURAL
9.2
22.6
27.4
33.3
7.5
100
93.2 6.8 100
98.7 1.3 100
95.4 4.7 100
95.3 4.7 100
98.9 1.1 100
96.7 3.3 100
90.8 9.2 100
98.5 1.5 100
93.7 6.3 100
9.0 91.0 100
5.7 94.3 100
7.6 92.4 100
16.4 83.6 100
9.8 90.2 100
13.6 86.4 100
37.6 62.4 100 37.4 62.6 100
47.0 53.0 100 44.6 55.4 100
54.2 45.8 100 54.0 46.0 100
70.6 29.4 100 71.6 28.4 100
81.9 18.1 100 85.9 14.1 100
58.6 41.4 100 57.0 43.0 100
Reading : % Children 6-8 year oldsin school who CAN read
Arithmetic : % Children 6-8 year oldsin school who CAN
Mothers’ Reading Level and Class
40 ASER 2006
Mothers who havestudied upto :
% Readers amongthese mothers
No schooling
Std I
Std II
Std III
Std IV
Std V and above
TOTAL
0.6
53.5
7.7
22.0
15.4
83.6
41.7
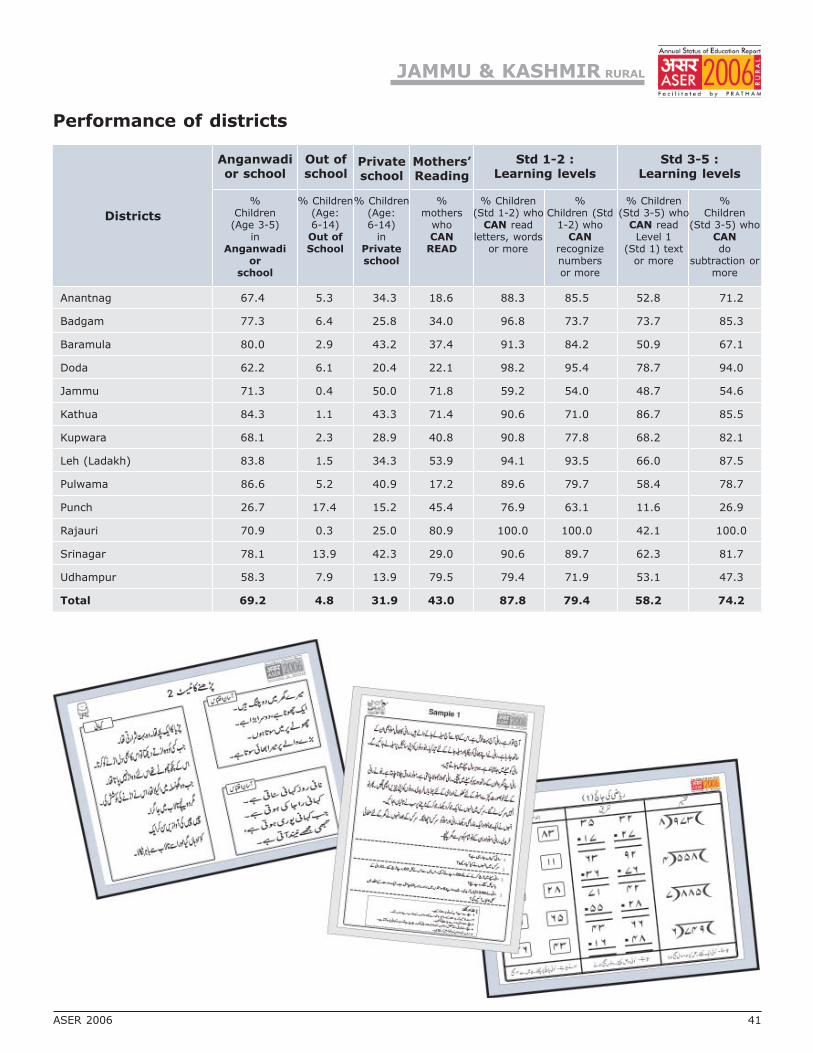
Districts
Anganwadior school
Out ofschool
Privateschool
Mothers’Reading
Std 1-2 :Learning levels
Std 3-5 :Learning levels
%Children
(Age 3-5)in
Anganwadior
school
% Children(Age:6-14)Out ofSchool
% Children(Age:6-14)
inPrivateschool
%mothers
whoCAN
READ
% Children(Std 1-2) who
CAN readletters, words
or more
% Children(Std 3-5) who
CAN readLevel 1
(Std 1) textor more
%Children (Std
1-2) whoCAN
recognizenumbersor more
%Children
(Std 3-5) whoCANdo
subtraction ormore
Performance of districts
Anantnag 67.4 5.3 34.3 18.6 88.3 85.5 52.8 71.2
Badgam 77.3 6.4 25.8 34.0 96.8 73.7 73.7 85.3
Baramula 80.0 2.9 43.2 37.4 91.3 84.2 50.9 67.1
Doda 62.2 6.1 20.4 22.1 98.2 95.4 78.7 94.0
Jammu 71.3 0.4 50.0 71.8 59.2 54.0 48.7 54.6
Kathua 84.3 1.1 43.3 71.4 90.6 71.0 86.7 85.5
Kupwara 68.1 2.3 28.9 40.8 90.8 77.8 68.2 82.1
Leh (Ladakh) 83.8 1.5 34.3 53.9 94.1 93.5 66.0 87.5
Pulwama 86.6 5.2 40.9 17.2 89.6 79.7 58.4 78.7
Punch 26.7 17.4 15.2 45.4 76.9 63.1 11.6 26.9
Rajauri 70.9 0.3 25.0 80.9 100.0 100.0 42.1 100.0
Srinagar 78.1 13.9 42.3 29.0 90.6 89.7 62.3 81.7
Udhampur 58.3 7.9 13.9 79.5 79.4 71.9 53.1 47.3
Total 69.2 4.8 31.9 43.0 87.8 79.4 58.2 74.2
JAMMU & KASHMIR RURAL
ASER 2006 41

HIMACHAL PRADESH RURAL
All analysis based on data from 12 out of 12 districts
Enrollment
Age and Class
SCHOOL ENROLLMENT AND OUT OF SCHOOL CHILDREN
% Children in each age groupin different types of schools
% Children out ofschool
Govt. Pvt.Other
(Madarsa + EGS)Not in school (Neverenrolled + drop out)
Total
Age : 7-16 ALL
Age : 7-10 ALL
Age : 7-10 BOYS
Age : 7-10 GIRLS
Age : 11-14 ALL
Age : 11-14 BOYS
Age : 11-14 GIRLS
Age : 15-16 ALL
Age : 15-16 BOYS
Age : 15-16 GIRLS
81.8 16.0 0.1 2.2 100
75.6 23.4 0.1 0.9 100
73.1 26.0 0.1 0.8 100
78.4 20.5 0.1 1.0 100
85.3 12.9 0.0 1.8 100
83.5 15.4 0.1 1.1 100
87.2 10.1 0.0 2.7 100
86.1 8.8 0.0 5.1 100
85.4 10.0 0.0 4.7 100
86.9 7.5 0.0 5.6 100
Young Children
IN BALWADI / ANGANWADI OR IN SCHOOL
% Children in pre-school or school
Age : 3 ALL
Age : 4 ALL
Age : 5 ALL
Age : 6 ALL
In
balw
ad
io
ran
gan
wad
i
In school
Govt. Pvt. Other
Not
goin
gan
yw
here
Total
55.1 1.8 43.0 100
60.4 9.4 30.2 100
31.0 31.7 24.3 0.0 13.0 100
2.1 67.2 28.7 0.0 2.1 100
I
II
III
IV
V
VI
VII
VIII
Std.5 6 7 8 9 10 11 12 13 14 15 16 Total
% Children in each standard by age
AGE BY STANDARD FOR SCHOOL CHILDREN
30.3 50.8 11.9 1.7 5.3 100
1.8 22.4 49.5 20.8 3.3 2.2 100
2.4 18.5 46.4 24.8 5.6 2.4 100
1.7 17.7 41.4 29.9 5.8 3.6 100
2.1 10.5 47.7 25.9 7.8 6.0 100
1.2 10.8 36.4 35.1 11.7 4.9 100
2.8 9.2 41.6 29.6 10.7 6.0 100
1.9 10.2 33.7 31.2 14.5 8.6 100
42 ASER 2006
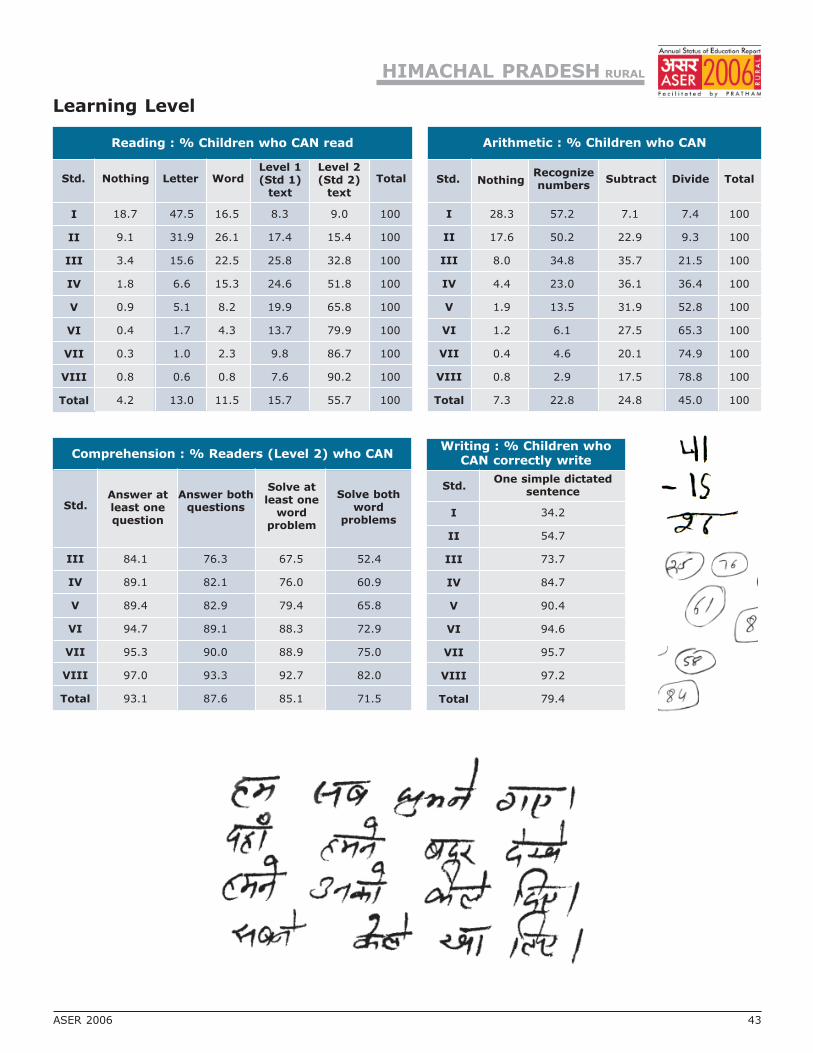
Learning Level
Reading : % Children who CAN read
I
II
III
IV
V
VI
VII
VIII
Total
Std. Nothing Letter WordLevel 1(Std 1)
text
Level 2(Std 2)
text
Total
18.7 47.5 16.5 8.3 9.0 100
9.1 31.9 26.1 17.4 15.4 100
3.4 15.6 22.5 25.8 32.8 100
1.8 6.6 15.3 24.6 51.8 100
0.9 5.1 8.2 19.9 65.8 100
0.4 1.7 4.3 13.7 79.9 100
0.3 1.0 2.3 9.8 86.7 100
0.8 0.6 0.8 7.6 90.2 100
4.2 13.0 11.5 15.7 55.7 100
Std.
Arithmetic : % Children who CAN
NothingRecognizenumbers
Subtract Divide Total
I
II
III
IV
V
VI
VII
VIII
Total
28.3 57.2 7.1 7.4 100
17.6 50.2 22.9 9.3 100
8.0 34.8 35.7 21.5 100
4.4 23.0 36.1 36.4 100
1.9 13.5 31.9 52.8 100
1.2 6.1 27.5 65.3 100
0.4 4.6 20.1 74.9 100
0.8 2.9 17.5 78.8 100
7.3 22.8 24.8 45.0 100
Writing : % Children whoCAN correctly write
One simple dictatedsentence
I
II
III
IV
V
VI
VII
VIII
Total
Std.
III
IV
V
VI
VII
VIII
Total
Comprehension : % Readers (Level 2) who CAN
Answer atleast onequestion
Answer bothquestions
Solve atleast one
wordproblem
Solve bothword
problems
Std.
84.1 76.3 67.5 52.4
89.1 82.1 76.0 60.9
89.4 82.9 79.4 65.8
94.7 89.1 88.3 72.9
95.3 90.0 88.9 75.0
97.0 93.3 92.7 82.0
93.1 87.6 85.1 71.5
34.2
54.7
73.7
84.7
90.4
94.6
95.7
97.2
79.4
HIMACHAL PRADESH RURAL
ASER 2006 43

Mothers
Mothers’ Education and Children Out of School
Mothers’ Education and Children’s Learning
Age% Mothers in
each agecategory
Age : 17-25
Age : 26-30
Age : 31-35
Age : 36-45
Age : 46-55
Age : 17-55
% of ALL children 6-14 % of all BOYS 6-14 % of all GIRLS 6-14
Mothers’education
Noschooling
Schooling
Total
Mothers’education
Noschooling
Schooling
Total
Mothers’education
Noschooling
Schooling
Total
Inschool
Out ofschool
TotalIn
schoolOut ofschool
TotalIn
schoolOut ofschool
Total
Mothers’education
No schooling
Schooling
Total
Letters,words or
moreTotal
NOTrecognizenumbers
Recognizenumbers or do
moreTotal
Mothers’education
No schooling
Schooling
Total
Nothing
Mothers’ Education and Reading Level
AgeMothers withno schooling
Mothers withschooling
Total
% Mothers whocannot read
Level 1 (Std 1) text
% Mothers whoCAN read
Level 1 (Std 1) textTotal
Age : 17-25
Age : 26-30
Age : 31-35
Age : 36-45
Age : 46-55
Age : 17-55
HIMACHAL PRADESH RURAL
11.2
30.2
28.1
24.8
5.9
100
96.6 3.4 100
99.5 0.5 100
98.7 1.3 100
97.9 2.1 100
99.6 0.4 100
99.1 0.9 100
95.3 4.7 100
99.4 0.6 100
98.2 1.8 100
18.1 81.9 100
7.6 92.4 100
10.0 90.0 100
30.1 69.9 100
13.4 86.7 100
17.1 82.9 100
12.1 87.9 100 14.2 85.8 100
15.9 84.1 100 16.5 83.5 100
24.3 75.7 100 25.0 75.0 100
36.6 63.4 100 39.0 61.0 100
66.0 34.0 100 66.6 33.4 100
25.9 74.1 100 27.0 73.0 100
Reading : % Children 6-8 year oldsin school who CAN read
Arithmetic : % Children 6-8 year oldsin school who CAN
Mothers’ Reading Level and Class
44 ASER 2006
Mothers who havestudied upto :
% Readers amongthese mothers
No schooling
Std I
Std II
Std III
Std IV
Std V and above
TOTAL
1.3
98.1
63.1
65.3
86.3
97.3
73.0

Districts
Anganwadior school
Out ofschool
Privateschool
Mothers’Reading
Std 1-2 :Learning levels
Std 3-5 :Learning levels
%Children
(Age 3-5)in
Anganwadior
school
% Children(Age:6-14)Out ofSchool
% Children(Age:6-14)
inPrivateschool
%mothers
whoCAN
READ
% Children(Std 1-2) who
CAN readletters, words
or more
% Children(Std 3-5) who
CAN readLevel 1
(Std 1) textor more
%Children (Std
1-2) whoCAN
recognizenumbersor more
%Children
(Std 3-5) whoCANdo
subtraction ormore
Performance of districts
Bilaspur 70.7 0.9 24.3 75.2 92.5 91.0 70.6 76.9
Chamba 72.0 5.7 3.9 37.7 71.3 57.2 62.5 57.4
Hamirpur 84.1 0.2 27.0 94.4 100.0 98.0 95.5 93.5
Kangra 74.0 0.0 24.4 86.1 79.6 68.5 66.9 65.5
Kinnaur 86.1 0.6 16.3 64.4 95.6 91.0 81.2 84.5
Kullu 82.1 1.2 12.3 55.0 94.4 85.6 80.3 79.4
Lahul & Spiti 98.6 0.5 16.2 37.8 97.2 93.3 84.0 88.2
Mandi 46.3 1.6 12.5 74.8 93.6 84.7 75.6 79.8
Shimla 72.4 1.8 25.4 75.7 89.7 78.7 87.6 75.2
Sirmaur 71.2 2.8 12.6 54.8 73.9 62.8 60.1 54.7
Solan 75.2 0.7 21.8 71.9 79.2 68.5 79.8 77.2
Una 85.6 0.2 25.2 81.4 91.0 83.0 76.8 70.3
Total 70.8 1.3 19.0 73.0 86.0 77.0 74.1 72.1
HIMACHAL PRADESH RURAL
ASER 2006 45
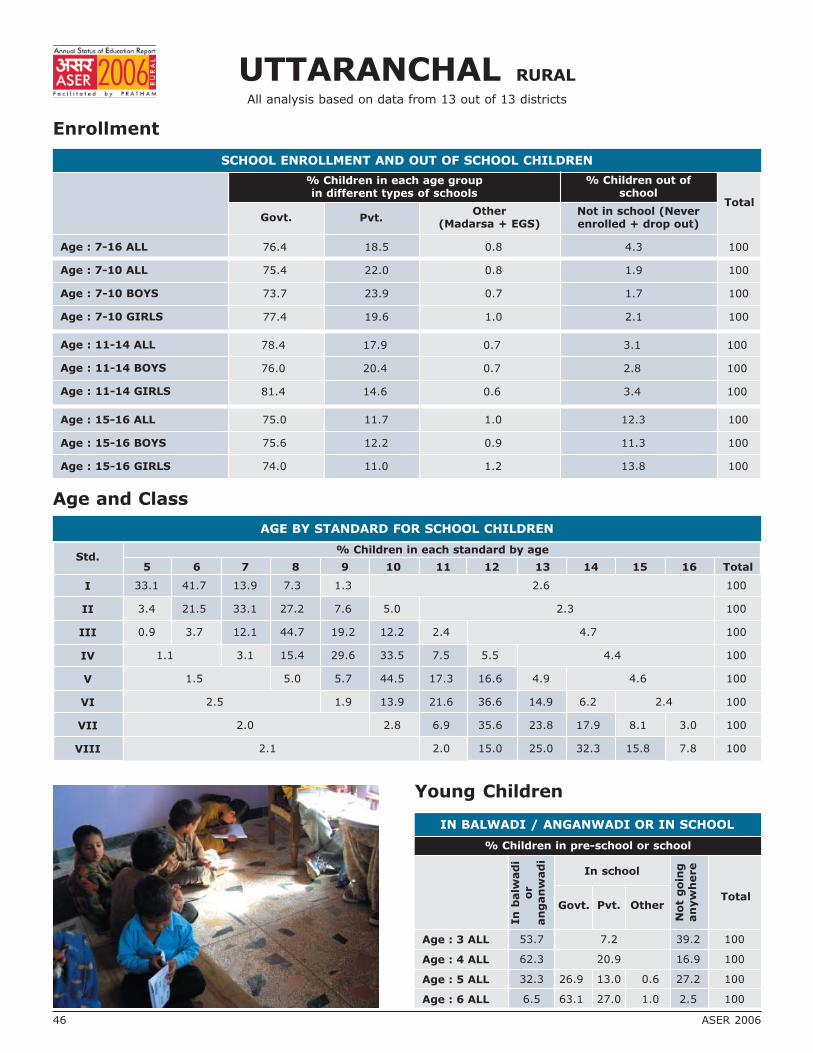
UTTARANCHAL RURAL
All analysis based on data from 13 out of 13 districts
Enrollment
Age and Class
SCHOOL ENROLLMENT AND OUT OF SCHOOL CHILDREN
% Children in each age groupin different types of schools
% Children out ofschool
Govt. Pvt.Other
(Madarsa + EGS)Not in school (Neverenrolled + drop out)
Total
Age : 7-16 ALL
Age : 7-10 ALL
Age : 7-10 BOYS
Age : 7-10 GIRLS
Age : 11-14 ALL
Age : 11-14 BOYS
Age : 11-14 GIRLS
Age : 15-16 ALL
Age : 15-16 BOYS
Age : 15-16 GIRLS
76.4 18.5 0.8 4.3 100
75.4 22.0 0.8 1.9 100
73.7 23.9 0.7 1.7 100
77.4 19.6 1.0 2.1 100
78.4 17.9 0.7 3.1 100
76.0 20.4 0.7 2.8 100
81.4 14.6 0.6 3.4 100
75.0 11.7 1.0 12.3 100
75.6 12.2 0.9 11.3 100
74.0 11.0 1.2 13.8 100
Young Children
IN BALWADI / ANGANWADI OR IN SCHOOL
% Children in pre-school or school
Age : 3 ALL
Age : 4 ALL
Age : 5 ALL
Age : 6 ALL
In
balw
ad
io
ran
gan
wad
i
In school
Govt. Pvt. Other
Not
goin
gan
yw
here
Total
53.7 7.2 39.2 100
62.3 20.9 16.9 100
32.3 26.9 13.0 0.6 27.2 100
6.5 63.1 27.0 1.0 2.5 100
I
II
III
IV
V
VI
VII
VIII
Std.5 6 7 8 9 10 11 12 13 14 15 16 Total
% Children in each standard by age
AGE BY STANDARD FOR SCHOOL CHILDREN
33.1 41.7 13.9 7.3 1.3 2.6 100
3.4 21.5 33.1 27.2 7.6 5.0 2.3 100
0.9 3.7 12.1 44.7 19.2 12.2 2.4 4.7 100
1.1 3.1 15.4 29.6 33.5 7.5 5.5 4.4 100
1.5 5.0 5.7 44.5 17.3 16.6 4.9 4.6 100
2.5 1.9 13.9 21.6 36.6 14.9 6.2 2.4 100
2.0 2.8 6.9 35.6 23.8 17.9 8.1 3.0 100
2.1 2.0 15.0 25.0 32.3 15.8 7.8 100
46 ASER 2006
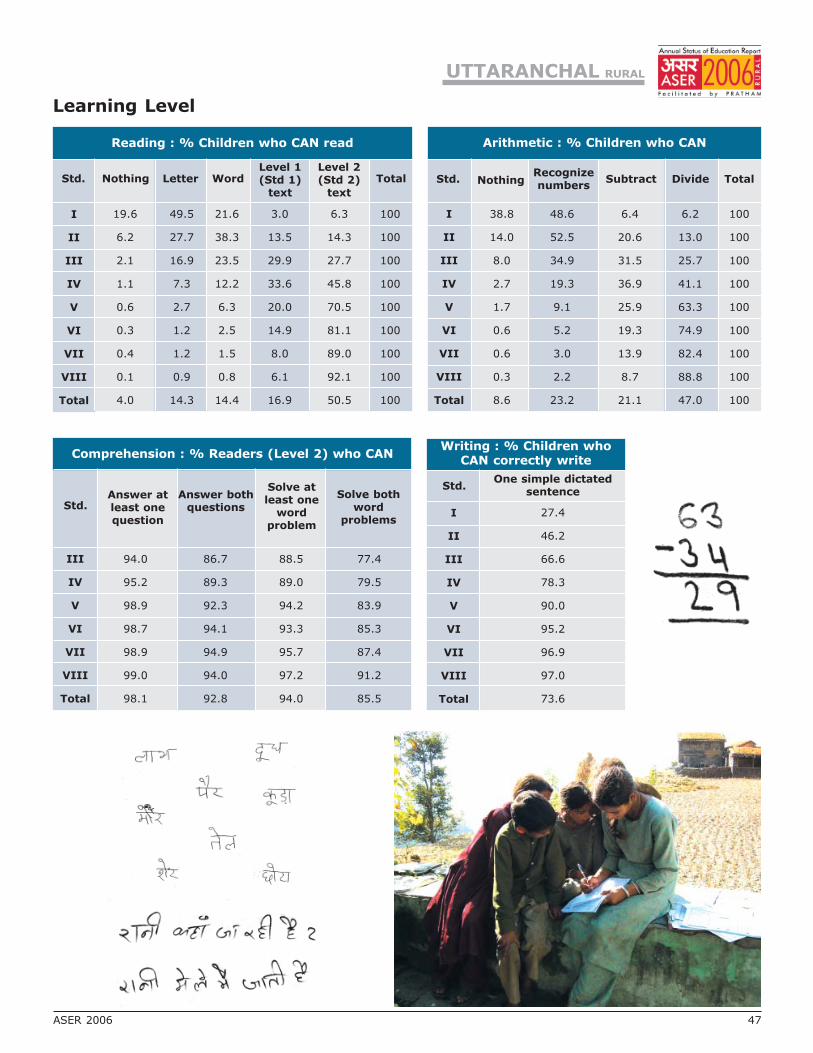
Learning Level
Reading : % Children who CAN read
I
II
III
IV
V
VI
VII
VIII
Total
Std. Nothing Letter WordLevel 1(Std 1)
text
Level 2(Std 2)
text
Total
19.6 49.5 21.6 3.0 6.3 100
6.2 27.7 38.3 13.5 14.3 100
2.1 16.9 23.5 29.9 27.7 100
1.1 7.3 12.2 33.6 45.8 100
0.6 2.7 6.3 20.0 70.5 100
0.3 1.2 2.5 14.9 81.1 100
0.4 1.2 1.5 8.0 89.0 100
0.1 0.9 0.8 6.1 92.1 100
4.0 14.3 14.4 16.9 50.5 100
Std.
Arithmetic : % Children who CAN
NothingRecognizenumbers
Subtract Divide Total
I
II
III
IV
V
VI
VII
VIII
Total
38.8 48.6 6.4 6.2 100
14.0 52.5 20.6 13.0 100
8.0 34.9 31.5 25.7 100
2.7 19.3 36.9 41.1 100
1.7 9.1 25.9 63.3 100
0.6 5.2 19.3 74.9 100
0.6 3.0 13.9 82.4 100
0.3 2.2 8.7 88.8 100
8.6 23.2 21.1 47.0 100
Writing : % Children whoCAN correctly write
One simple dictatedsentence
I
II
III
IV
V
VI
VII
VIII
Total
Std.
III
IV
V
VI
VII
VIII
Total
Comprehension : % Readers (Level 2) who CAN
Answer atleast onequestion
Answer bothquestions
Solve atleast one
wordproblem
Solve bothword
problems
Std.
94.0 86.7 88.5 77.4
95.2 89.3 89.0 79.5
98.9 92.3 94.2 83.9
98.7 94.1 93.3 85.3
98.9 94.9 95.7 87.4
99.0 94.0 97.2 91.2
98.1 92.8 94.0 85.5
27.4
46.2
66.6
78.3
90.0
95.2
96.9
97.0
73.6
UTTARANCHAL RURAL
ASER 2006 47
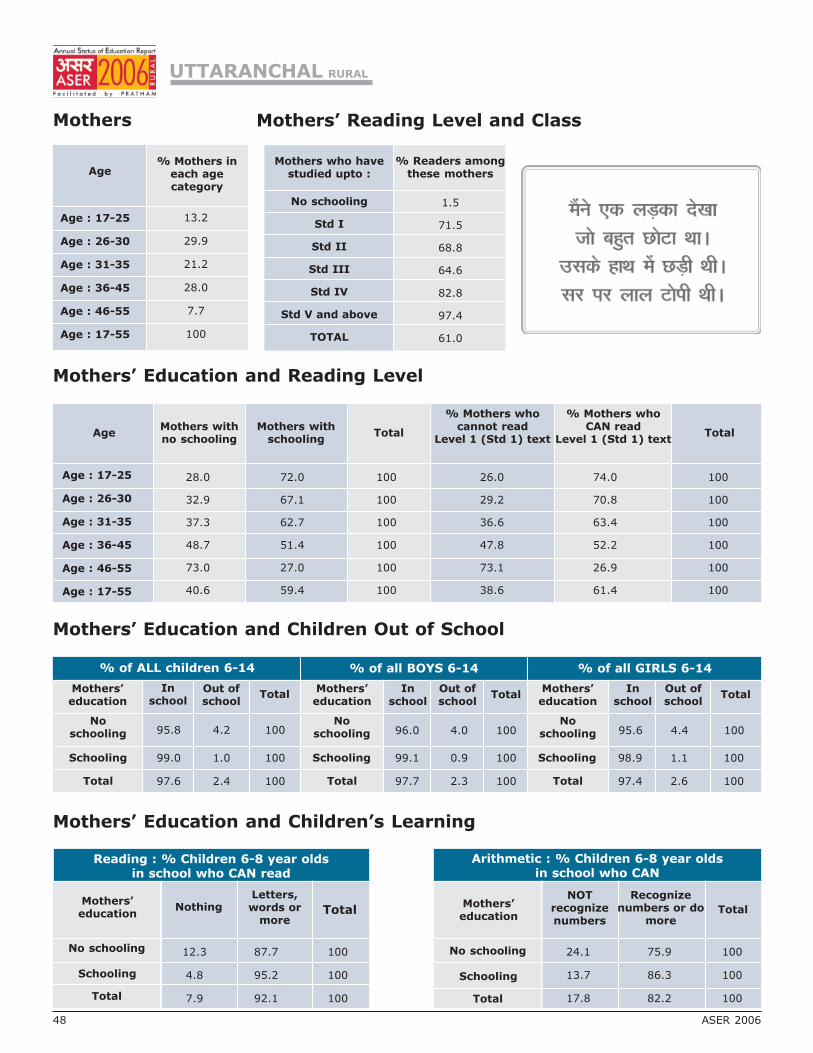
Mothers
Mothers’ Education and Children Out of School
Mothers’ Education and Children’s Learning
Age% Mothers in
each agecategory
Age : 17-25
Age : 26-30
Age : 31-35
Age : 36-45
Age : 46-55
Age : 17-55
% of ALL children 6-14 % of all BOYS 6-14 % of all GIRLS 6-14
Mothers’education
Noschooling
Schooling
Total
Mothers’education
Noschooling
Schooling
Total
Mothers’education
Noschooling
Schooling
Total
Inschool
Out ofschool
TotalIn
schoolOut ofschool
TotalIn
schoolOut ofschool
Total
Mothers’education
No schooling
Schooling
Total
Letters,words or
moreTotal
NOTrecognizenumbers
Recognizenumbers or do
moreTotal
Mothers’education
No schooling
Schooling
Total
Nothing
Mothers’ Education and Reading Level
AgeMothers withno schooling
Mothers withschooling
Total
% Mothers whocannot read
Level 1 (Std 1) text
% Mothers whoCAN read
Level 1 (Std 1) textTotal
Age : 17-25
Age : 26-30
Age : 31-35
Age : 36-45
Age : 46-55
Age : 17-55
UTTARANCHAL RURAL
13.2
29.9
21.2
28.0
7.7
100
95.8 4.2 100
99.0 1.0 100
97.6 2.4 100
96.0 4.0 100
99.1 0.9 100
97.7 2.3 100
95.6 4.4 100
98.9 1.1 100
97.4 2.6 100
12.3 87.7 100
4.8 95.2 100
7.9 92.1 100
24.1 75.9 100
13.7 86.3 100
17.8 82.2 100
28.0 72.0 100 26.0 74.0 100
32.9 67.1 100 29.2 70.8 100
37.3 62.7 100 36.6 63.4 100
48.7 51.4 100 47.8 52.2 100
73.0 27.0 100 73.1 26.9 100
40.6 59.4 100 38.6 61.4 100
Reading : % Children 6-8 year oldsin school who CAN read
Arithmetic : % Children 6-8 year oldsin school who CAN
Mothers’ Reading Level and Class
48 ASER 2006
Mothers who havestudied upto :
% Readers amongthese mothers
No schooling
Std I
Std II
Std III
Std IV
Std V and above
TOTAL
1.5
71.5
68.8
64.6
82.8
97.4
61.0
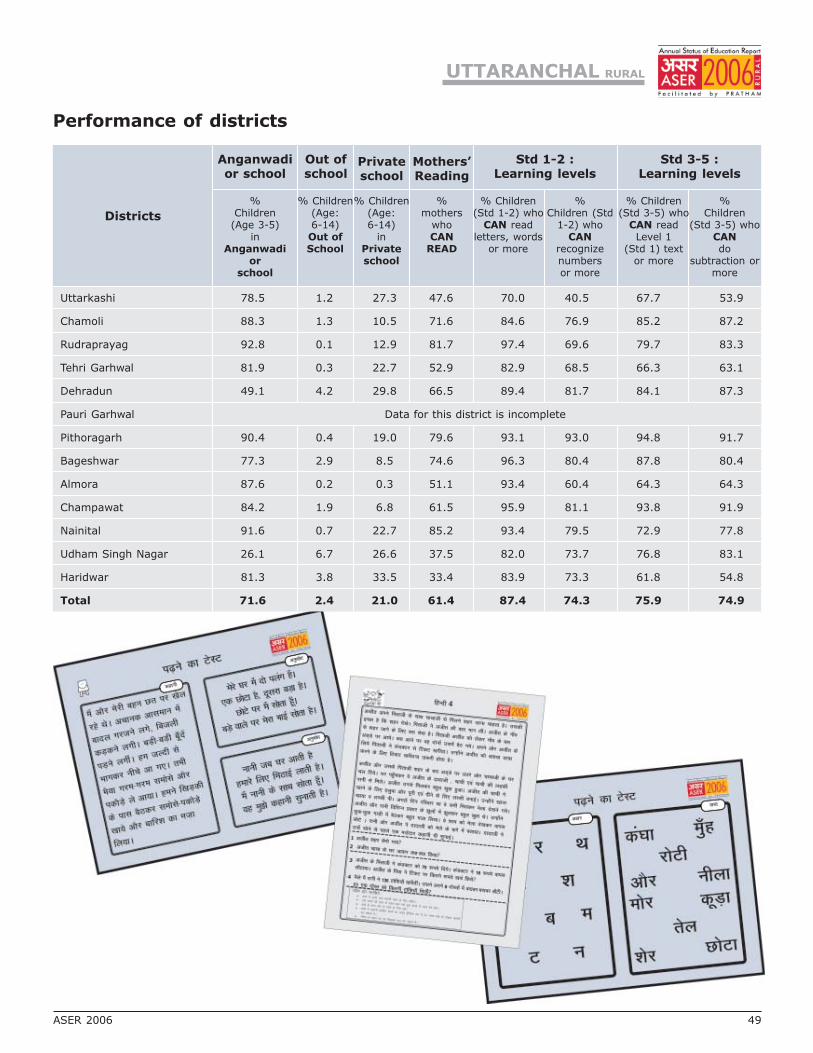
Districts
Anganwadior school
Out ofschool
Privateschool
Mothers’Reading
Std 1-2 :Learning levels
Std 3-5 :Learning levels
%Children
(Age 3-5)in
Anganwadior
school
% Children(Age:6-14)Out ofSchool
% Children(Age:6-14)
inPrivateschool
%mothers
whoCAN
READ
% Children(Std 1-2) who
CAN readletters, words
or more
% Children(Std 3-5) who
CAN readLevel 1
(Std 1) textor more
%Children (Std
1-2) whoCAN
recognizenumbersor more
%Children
(Std 3-5) whoCANdo
subtraction ormore
Performance of districts
UTTARANCHAL RURAL
ASER 2006 49
Uttarkashi 78.5 1.2 27.3 47.6 70.0 40.5 67.7 53.9
Chamoli 88.3 1.3 10.5 71.6 84.6 76.9 85.2 87.2
Rudraprayag 92.8 0.1 12.9 81.7 97.4 69.6 79.7 83.3
Tehri Garhwal 81.9 0.3 22.7 52.9 82.9 68.5 66.3 63.1
Dehradun 49.1 4.2 29.8 66.5 89.4 81.7 84.1 87.3
Pauri Garhwal Data for this district is incomplete
Pithoragarh 90.4 0.4 19.0 79.6 93.1 93.0 94.8 91.7
Bageshwar 77.3 2.9 8.5 74.6 96.3 80.4 87.8 80.4
Almora 87.6 0.2 0.3 51.1 93.4 60.4 64.3 64.3
Champawat 84.2 1.9 6.8 61.5 95.9 81.1 93.8 91.9
Nainital 91.6 0.7 22.7 85.2 93.4 79.5 72.9 77.8
Udham Singh Nagar 26.1 6.7 26.6 37.5 82.0 73.7 76.8 83.1
Haridwar 81.3 3.8 33.5 33.4 83.9 73.3 61.8 54.8
Total 71.6 2.4 21.0 61.4 87.4 74.3 75.9 74.9

PUNJAB RURAL
All analysis based on data from 18 out of 18 districts
Enrollment
Age and Class
SCHOOL ENROLLMENT AND OUT OF SCHOOL CHILDREN
% Children in each age groupin different types of schools
% Children out ofschool
Govt. Pvt.Other
(Madarsa + EGS)Not in school (Neverenrolled + drop out)
Total
Age : 7-16 ALL
Age : 7-10 ALL
Age : 7-10 BOYS
Age : 7-10 GIRLS
Age : 11-14 ALL
Age : 11-14 BOYS
Age : 11-14 GIRLS
Age : 15-16 ALL
Age : 15-16 BOYS
Age : 15-16 GIRLS
57.5 37.2 0.3 5.0 100
50.7 46.7 0.5 2.0 100
47.8 49.6 0.6 2.1 100
55.0 42.6 0.5 2.0 100
61.4 34.0 0.2 4.4 100
58.8 37.1 0.2 3.9 100
64.6 30.2 0.2 5.0 100
62.3 25.9 0.0 11.8 100
61.8 26.4 0.0 11.8 100
62.9 25.4 0.0 11.7 100
Young Children
IN BALWADI / ANGANWADI OR IN SCHOOL
% Children in pre-school or school
Age : 3 ALL
Age : 4 ALL
Age : 5 ALL
Age : 6 ALL
In
balw
ad
io
ran
gan
wad
i
In school
Govt. Pvt. Other
Not
goin
gan
yw
here
Total
48.1 9.9 42.1 100
46.4 33.4 20.2 100
21.2 22.8 46.1 1.1 8.8 100
3.8 37.3 54.7 0.5 3.6 100
I
II
III
IV
V
VI
VII
VIII
Std.5 6 7 8 9 10 11 12 13 14 15 16 Total
% Children in each standard by age
AGE BY STANDARD FOR SCHOOL CHILDREN
27.0 34.9 23.0 9.8 2.0 3.2 100
4.7 15.4 30.9 31.8 10.2 5.0 2.1 100
0.9 3.8 13.2 30.6 28.7 15.4 3.3 4.2 100
0.9 3.6 13.8 26.0 35.3 11.2 6.0 3.2 100
1.8 4.1 9.5 33.1 28.3 14.7 4.6 4.0 100
1.1 1.7 14.2 25.7 36.8 13.3 4.5 2.7 100
2.3 4.1 8.2 30.8 31.6 15.3 5.2 2.5 100
1.8 1.2 13.1 25.6 33.5 16.4 8.5 100
50 ASER 2006
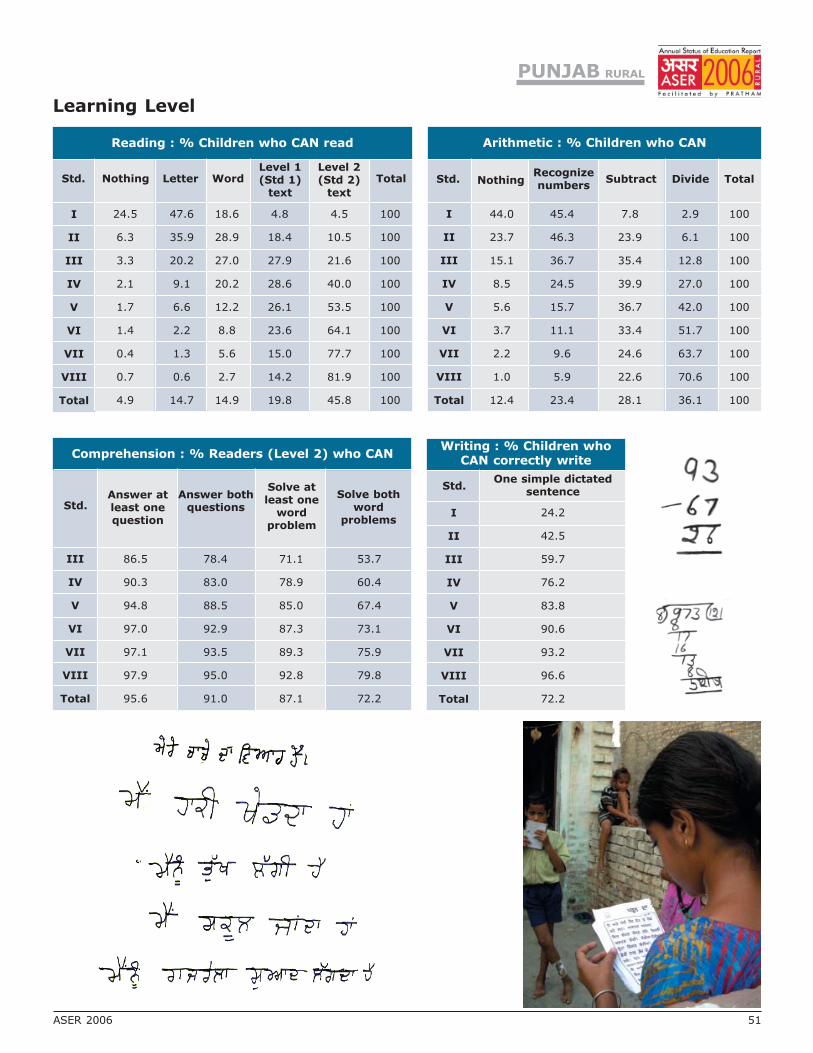
Learning Level
Reading : % Children who CAN read
I
II
III
IV
V
VI
VII
VIII
Total
Std. Nothing Letter WordLevel 1(Std 1)
text
Level 2(Std 2)
text
Total
24.5 47.6 18.6 4.8 4.5 100
6.3 35.9 28.9 18.4 10.5 100
3.3 20.2 27.0 27.9 21.6 100
2.1 9.1 20.2 28.6 40.0 100
1.7 6.6 12.2 26.1 53.5 100
1.4 2.2 8.8 23.6 64.1 100
0.4 1.3 5.6 15.0 77.7 100
0.7 0.6 2.7 14.2 81.9 100
4.9 14.7 14.9 19.8 45.8 100
Std.
Arithmetic : % Children who CAN
NothingRecognizenumbers
Subtract Divide Total
I
II
III
IV
V
VI
VII
VIII
Total
44.0 45.4 7.8 2.9 100
23.7 46.3 23.9 6.1 100
15.1 36.7 35.4 12.8 100
8.5 24.5 39.9 27.0 100
5.6 15.7 36.7 42.0 100
3.7 11.1 33.4 51.7 100
2.2 9.6 24.6 63.7 100
1.0 5.9 22.6 70.6 100
12.4 23.4 28.1 36.1 100
Writing : % Children whoCAN correctly write
One simple dictatedsentence
I
II
III
IV
V
VI
VII
VIII
Total
Std.
III
IV
V
VI
VII
VIII
Total
Comprehension : % Readers (Level 2) who CAN
Answer atleast onequestion
Answer bothquestions
Solve atleast one
wordproblem
Solve bothword
problems
Std.
86.5 78.4 71.1 53.7
90.3 83.0 78.9 60.4
94.8 88.5 85.0 67.4
97.0 92.9 87.3 73.1
97.1 93.5 89.3 75.9
97.9 95.0 92.8 79.8
95.6 91.0 87.1 72.2
24.2
42.5
59.7
76.2
83.8
90.6
93.2
96.6
72.2
PUNJAB RURAL
ASER 2006 51
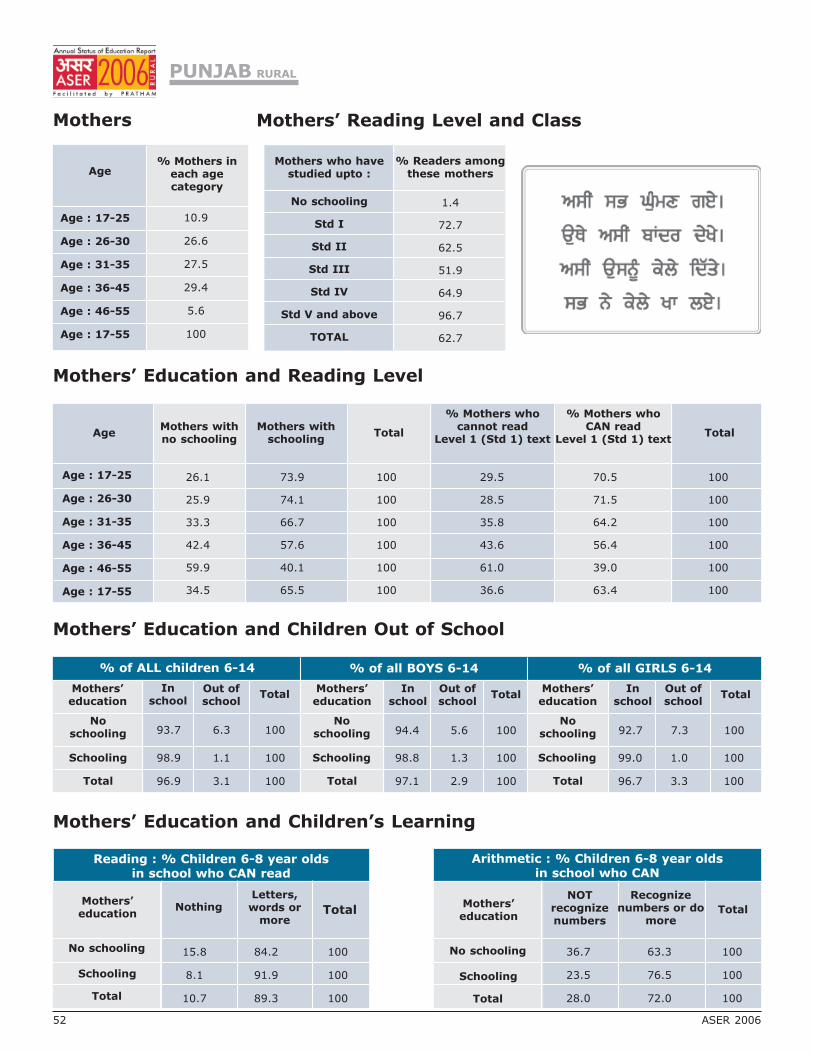
Mothers
Mothers’ Education and Children Out of School
Mothers’ Education and Children’s Learning
Age% Mothers in
each agecategory
Age : 17-25
Age : 26-30
Age : 31-35
Age : 36-45
Age : 46-55
Age : 17-55
% of ALL children 6-14 % of all BOYS 6-14 % of all GIRLS 6-14
Mothers’education
Noschooling
Schooling
Total
Mothers’education
Noschooling
Schooling
Total
Mothers’education
Noschooling
Schooling
Total
Inschool
Out ofschool
TotalIn
schoolOut ofschool
TotalIn
schoolOut ofschool
Total
Mothers’education
No schooling
Schooling
Total
Letters,words or
moreTotal
NOTrecognizenumbers
Recognizenumbers or do
moreTotal
Mothers’education
No schooling
Schooling
Total
Nothing
Mothers’ Education and Reading Level
AgeMothers withno schooling
Mothers withschooling
Total
% Mothers whocannot read
Level 1 (Std 1) text
% Mothers whoCAN read
Level 1 (Std 1) textTotal
Age : 17-25
Age : 26-30
Age : 31-35
Age : 36-45
Age : 46-55
Age : 17-55
PUNJAB RURAL
10.9
26.6
27.5
29.4
5.6
100
93.7 6.3 100
98.9 1.1 100
96.9 3.1 100
94.4 5.6 100
98.8 1.3 100
97.1 2.9 100
92.7 7.3 100
99.0 1.0 100
96.7 3.3 100
15.8 84.2 100
8.1 91.9 100
10.7 89.3 100
36.7 63.3 100
23.5 76.5 100
28.0 72.0 100
26.1 73.9 100 29.5 70.5 100
25.9 74.1 100 28.5 71.5 100
33.3 66.7 100 35.8 64.2 100
42.4 57.6 100 43.6 56.4 100
59.9 40.1 100 61.0 39.0 100
34.5 65.5 100 36.6 63.4 100
Reading : % Children 6-8 year oldsin school who CAN read
Arithmetic : % Children 6-8 year oldsin school who CAN
Mothers’ Reading Level and Class
52 ASER 2006
Mothers who havestudied upto :
% Readers amongthese mothers
No schooling
Std I
Std II
Std III
Std IV
Std V and above
TOTAL
1.4
72.7
62.5
51.9
64.9
96.7
62.7

Districts
Anganwadior school
Out ofschool
Privateschool
Mothers’Reading
Std 1-2 :Learning levels
Std 3-5 :Learning levels
%Children
(Age 3-5)in
Anganwadior
school
% Children(Age:6-14)Out ofSchool
% Children(Age:6-14)
inPrivateschool
%mothers
whoCAN
READ
% Children(Std 1-2) who
CAN readletters, words
or more
% Children(Std 3-5) who
CAN readLevel 1
(Std 1) textor more
%Children (Std
1-2) whoCAN
recognizenumbersor more
%Children
(Std 3-5) whoCANdo
subtraction ormore
Performance of districts
Amritsar 77.4 4.5 44.5 55.3 75.2 58.9 57.4 56.6
Bathinda 74.6 6.1 38.1 45.7 82.2 61.2 77.1 68.1
Faridkot 75.3 4.0 41.5 62.6 83.3 75.2 72.3 73.6
Fatehgarh Sahib 86.1 2.0 48.8 79.5 92.8 70.3 77.1 71.8
Firozpur 71.7 6.6 27.8 37.6 77.5 56.6 54.6 56.2
Gurdaspur 75.5 2.0 48.1 69.1 84.3 70.3 60.6 64.5
Hoshiarpur 94.4 0.9 33.7 89.1 99.2 98.4 86.9 93.1
Jalandhar 83.2 1.7 35.7 71.0 93.6 67.9 60.8 61.9
Kapurthala 92.6 2.0 45.8 64.2 78.0 60.0 53.0 55.8
Ludhiana 74.6 3.6 34.3 71.4 84.6 53.9 73.1 58.1
Mansa 64.2 4.1 29.9 44.6 65.4 50.7 57.9 69.0
Moga 84.9 2.2 45.7 69.7 89.1 62.8 71.0 64.5
Muktsar 64.5 6.4 30.7 53.7 91.3 78.1 81.5 80.2
Nawanshahr 76.5 0.8 37.6 69.9 88.1 75.5 65.8 69.0
Sangrur 77.5 2.0 57.1 60.0 87.5 70.8 71.4 72.4
SAS Nagar 81.2 1.2 50.9 77.7 94.7 71.7 64.4 72.5
Patiala 74.7 3.1 49.3 53.2 82.0 57.8 64.5 51.1
Rupnagar 83.3 0.9 43.7 77.9 86.5 64.7 72.3 74.6
Total 77.6 3.2 41.5 63.4 84.1 65.7 66.3 65.2
PUNJAB RURAL
ASER 2006 53
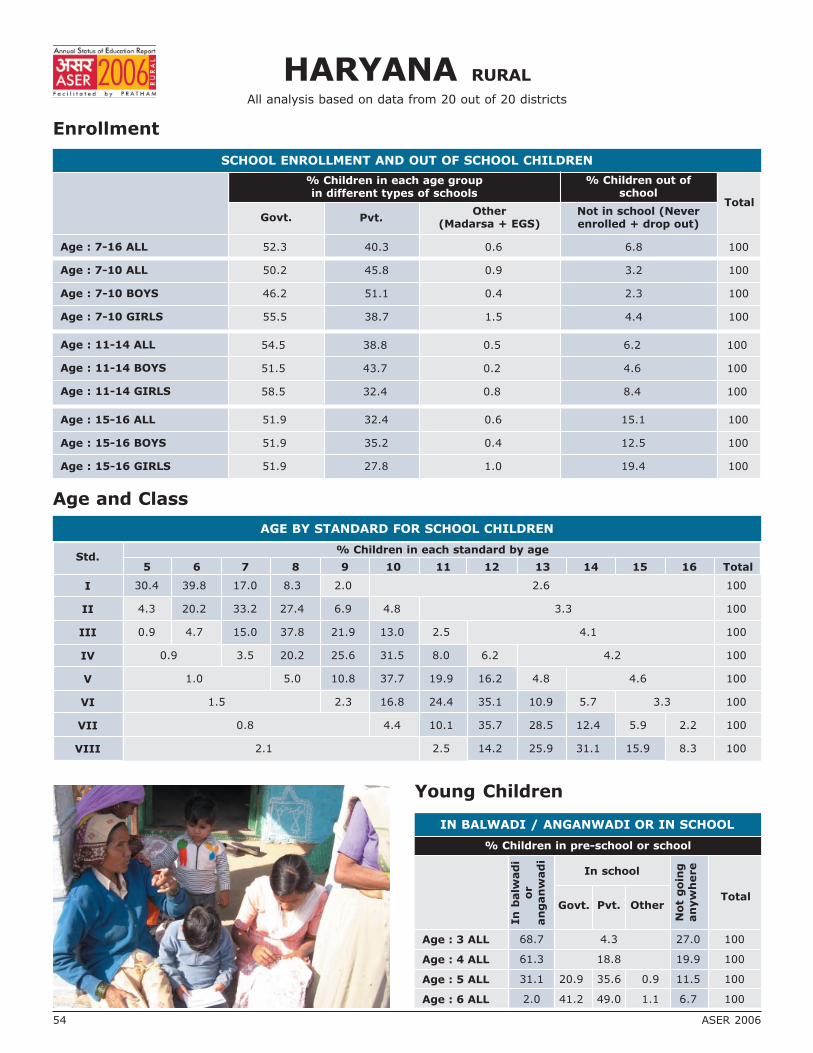
HARYANA RURAL
All analysis based on data from 20 out of 20 districts
Enrollment
Age and Class
SCHOOL ENROLLMENT AND OUT OF SCHOOL CHILDREN
% Children in each age groupin different types of schools
% Children out ofschool
Govt. Pvt.Other
(Madarsa + EGS)Not in school (Neverenrolled + drop out)
Total
Age : 7-16 ALL
Age : 7-10 ALL
Age : 7-10 BOYS
Age : 7-10 GIRLS
Age : 11-14 ALL
Age : 11-14 BOYS
Age : 11-14 GIRLS
Age : 15-16 ALL
Age : 15-16 BOYS
Age : 15-16 GIRLS
52.3 40.3 0.6 6.8 100
50.2 45.8 0.9 3.2 100
46.2 51.1 0.4 2.3 100
55.5 38.7 1.5 4.4 100
54.5 38.8 0.5 6.2 100
51.5 43.7 0.2 4.6 100
58.5 32.4 0.8 8.4 100
51.9 32.4 0.6 15.1 100
51.9 35.2 0.4 12.5 100
51.9 27.8 1.0 19.4 100
Young Children
IN BALWADI / ANGANWADI OR IN SCHOOL
% Children in pre-school or school
Age : 3 ALL
Age : 4 ALL
Age : 5 ALL
Age : 6 ALL
In
balw
ad
io
ran
gan
wad
i
In school
Govt. Pvt. Other
Not
goin
gan
yw
here
Total
68.7 4.3 27.0 100
61.3 18.8 19.9 100
31.1 20.9 35.6 0.9 11.5 100
2.0 41.2 49.0 1.1 6.7 100
I
II
III
IV
V
VI
VII
VIII
Std.5 6 7 8 9 10 11 12 13 14 15 16 Total
% Children in each standard by age
AGE BY STANDARD FOR SCHOOL CHILDREN
30.4 39.8 17.0 8.3 2.0 2.6 100
4.3 20.2 33.2 27.4 6.9 4.8 3.3 100
0.9 4.7 15.0 37.8 21.9 13.0 2.5 4.1 100
0.9 3.5 20.2 25.6 31.5 8.0 6.2 4.2 100
1.0 5.0 10.8 37.7 19.9 16.2 4.8 4.6 100
1.5 2.3 16.8 24.4 35.1 10.9 5.7 3.3 100
0.8 4.4 10.1 35.7 28.5 12.4 5.9 2.2 100
2.1 2.5 14.2 25.9 31.1 15.9 8.3 100
54 ASER 2006
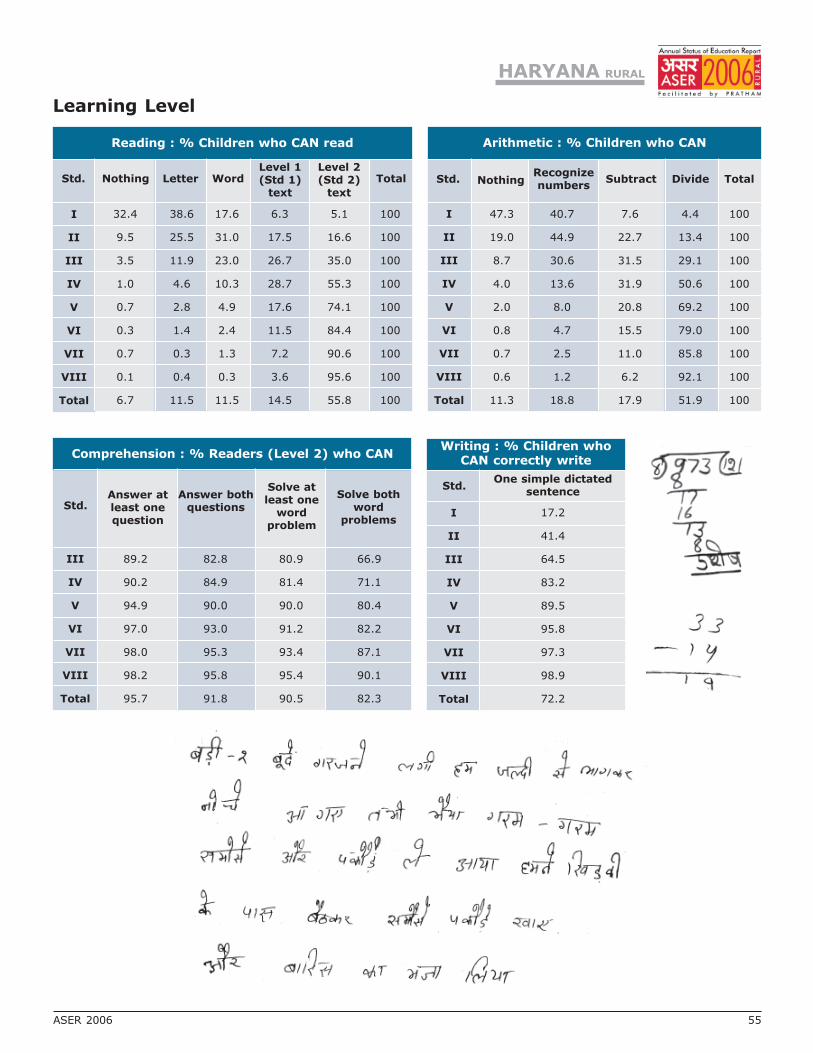
Learning Level
Reading : % Children who CAN read
I
II
III
IV
V
VI
VII
VIII
Total
Std. Nothing Letter WordLevel 1(Std 1)
text
Level 2(Std 2)
text
Total
32.4 38.6 17.6 6.3 5.1 100
9.5 25.5 31.0 17.5 16.6 100
3.5 11.9 23.0 26.7 35.0 100
1.0 4.6 10.3 28.7 55.3 100
0.7 2.8 4.9 17.6 74.1 100
0.3 1.4 2.4 11.5 84.4 100
0.7 0.3 1.3 7.2 90.6 100
0.1 0.4 0.3 3.6 95.6 100
6.7 11.5 11.5 14.5 55.8 100
Std.
Arithmetic : % Children who CAN
NothingRecognizenumbers
Subtract Divide Total
I
II
III
IV
V
VI
VII
VIII
Total
47.3 40.7 7.6 4.4 100
19.0 44.9 22.7 13.4 100
8.7 30.6 31.5 29.1 100
4.0 13.6 31.9 50.6 100
2.0 8.0 20.8 69.2 100
0.8 4.7 15.5 79.0 100
0.7 2.5 11.0 85.8 100
0.6 1.2 6.2 92.1 100
11.3 18.8 17.9 51.9 100
Writing : % Children whoCAN correctly write
One simple dictatedsentence
I
II
III
IV
V
VI
VII
VIII
Total
Std.
III
IV
V
VI
VII
VIII
Total
Comprehension : % Readers (Level 2) who CAN
Answer atleast onequestion
Answer bothquestions
Solve atleast one
wordproblem
Solve bothword
problems
Std.
89.2 82.8 80.9 66.9
90.2 84.9 81.4 71.1
94.9 90.0 90.0 80.4
97.0 93.0 91.2 82.2
98.0 95.3 93.4 87.1
98.2 95.8 95.4 90.1
95.7 91.8 90.5 82.3
17.2
41.4
64.5
83.2
89.5
95.8
97.3
98.9
72.2
HARYANA RURAL
ASER 2006 55

Mothers
Mothers’ Education and Children Out of School
Mothers’ Education and Children’s Learning
Age% Mothers in
each agecategory
Age : 17-25
Age : 26-30
Age : 31-35
Age : 36-45
Age : 46-55
Age : 17-55
% of ALL children 6-14 % of all BOYS 6-14 % of all GIRLS 6-14
Mothers’education
Noschooling
Schooling
Total
Mothers’education
Noschooling
Schooling
Total
Mothers’education
Noschooling
Schooling
Total
Inschool
Out ofschool
TotalIn
schoolOut ofschool
TotalIn
schoolOut ofschool
Total
Mothers’education
No schooling
Schooling
Total
Letters,words or
moreTotal
NOTrecognizenumbers
Recognizenumbers or do
moreTotal
Mothers’education
No schooling
Schooling
Total
Nothing
Mothers’ Education and Reading Level
AgeMothers withno schooling
Mothers withschooling
Total
% Mothers whocannot read
Level 1 (Std 1) text
% Mothers whoCAN read
Level 1 (Std 1) textTotal
Age : 17-25
Age : 26-30
Age : 31-35
Age : 36-45
Age : 46-55
Age : 17-55
HARYANA RURAL
18.3
29.0
24.4
23.9
4.5
100
92.1 7.9 100
98.8 1.3 100
95.3 4.8 100
94.3 5.7 100
98.9 1.1 100
96.5 3.5 100
89.4 10.7 100
98.5 1.5 100
93.6 6.4 100
22.7 77.3 100
9.1 90.9 100
14.8 85.2 100
34.0 66.0 100
17.4 82.6 100
24.5 75.5 100
24.5 75.5 100 27.3 72.7 100
36.9 63.1 100 38.7 61.3 100
51.9 48.1 100 54.1 45.9 100
67.3 32.7 100 69.6 30.4 100
83.1 16.9 100 84.4 15.6 100
47.6 52.4 100 49.7 50.3 100
Reading : % Children 6-8 year oldsin school who CAN read
Arithmetic : % Children 6-8 year oldsin school who CAN
Mothers’ Reading Level and Class
56 ASER 2006
Mothers who havestudied upto :
% Readers amongthese mothers
No schooling
Std I
Std II
Std III
Std IV
Std V and above
TOTAL
0.7
43.8
54.6
55.6
86.5
97.2
49.6

Districts
Anganwadior school
Out ofschool
Privateschool
Mothers’Reading
Std 1-2 :Learning levels
Std 3-5 :Learning levels
%Children
(Age 3-5)in
Anganwadior
school
% Children(Age:6-14)Out ofSchool
% Children(Age:6-14)
inPrivateschool
%mothers
whoCAN
READ
% Children(Std 1-2) who
CAN readletters, words
or more
% Children(Std 3-5) who
CAN readLevel 1
(Std 1) textor more
%Children (Std
1-2) whoCAN
recognizenumbersor more
%Children
(Std 3-5) whoCANdo
subtraction ormore
Performance of districts
Ambala 88.8 1.0 42.4 67.2 99.4 91.3 77.6 77.2
Bhiwani 77.9 2.5 53.4 59.0 83.2 73.6 84.5 82.6
Fatehabad 87.1 8.0 34.7 35.4 63.2 45.5 71.4 63.5
Hisar 93.0 5.0 41.0 50.5 86.7 77.0 89.9 86.6
Jhajjar 83.9 1.2 51.7 62.9 80.1 78.1 84.8 86.9
Jind 90.0 2.7 43.4 46.5 88.4 78.6 90.5 88.6
Kaithal 77.7 2.5 44.7 34.4 82.1 71.5 76.8 78.5
Karnal 87.8 1.5 60.2 66.0 78.0 61.5 79.3 79.3
Kurukshetra 80.3 2.0 45.4 64.7 79.2 66.0 79.4 72.8
Mahendragarh 80.6 1.0 51.3 42.8 77.8 63.7 77.0 76.6
Panchkula 90.8 1.7 32.8 54.2 93.1 85.1 79.6 82.4
Panipat 84.1 2.1 45.6 49.6 80.4 71.5 80.7 77.2
Rewari 89.1 0.8 53.0 72.6 92.8 86.4 81.5 85.4
Rohtak 82.1 1.2 42.6 62.4 81.5 69.2 75.9 77.1
Sirsa 97.9 6.6 33.9 38.4 74.5 67.0 71.4 83.5
Sonipat 92.7 1.4 46.7 62.8 87.6 65.9 82.8 83.8
Yamunanagar 74.7 6.5 26.4 50.2 79.3 64.2 78.0 72.1
Mewat 40.3 24.1 14.9 11.2 39.5 28.1 62.1 57.7
Faridabad 59.1 10.3 44.6 21.8 63.5 44.0 69.5 65.7
Gurgaon 65.6 6.4 54.3 51.9 72.1 48.4 78.3 65.6
Total 80.6 4.9 43.1 50.3 78.2 65.8 79.6 78.1
HARYANA RURAL
ASER 2006 57

58 ASER 2006

Rajasthan
Bihar
West Bengal
Jharkhand
Andaman and Nicobar
Uttar Pradesh
ASER 2006 59
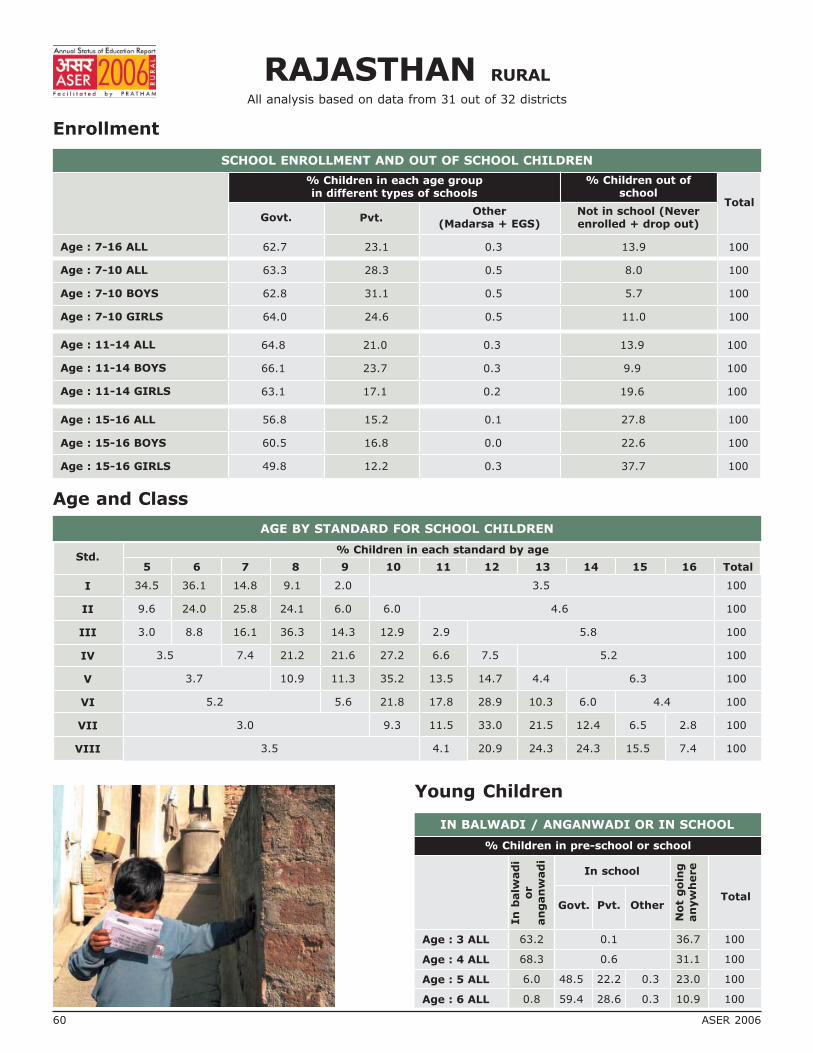
RAJASTHAN RURAL
All analysis based on data from 31 out of 32 districts
Enrollment
Age and Class
SCHOOL ENROLLMENT AND OUT OF SCHOOL CHILDREN
% Children in each age groupin different types of schools
% Children out ofschool
Govt. Pvt.Other
(Madarsa + EGS)Not in school (Neverenrolled + drop out)
Total
Age : 7-16 ALL
Age : 7-10 ALL
Age : 7-10 BOYS
Age : 7-10 GIRLS
Age : 11-14 ALL
Age : 11-14 BOYS
Age : 11-14 GIRLS
Age : 15-16 ALL
Age : 15-16 BOYS
Age : 15-16 GIRLS
62.7 23.1 0.3 13.9 100
63.3 28.3 0.5 8.0 100
62.8 31.1 0.5 5.7 100
64.0 24.6 0.5 11.0 100
64.8 21.0 0.3 13.9 100
66.1 23.7 0.3 9.9 100
63.1 17.1 0.2 19.6 100
56.8 15.2 0.1 27.8 100
60.5 16.8 0.0 22.6 100
49.8 12.2 0.3 37.7 100
Young Children
IN BALWADI / ANGANWADI OR IN SCHOOL
% Children in pre-school or school
Age : 3 ALL
Age : 4 ALL
Age : 5 ALL
Age : 6 ALL
In
balw
ad
io
ran
gan
wad
i
In school
Govt. Pvt. Other
Not
goin
gan
yw
here
Total
63.2 0.1 36.7 100
68.3 0.6 31.1 100
6.0 48.5 22.2 0.3 23.0 100
0.8 59.4 28.6 0.3 10.9 100
I
II
III
IV
V
VI
VII
VIII
Std.5 6 7 8 9 10 11 12 13 14 15 16 Total
% Children in each standard by age
AGE BY STANDARD FOR SCHOOL CHILDREN
34.5 36.1 14.8 9.1 2.0 3.5 100
9.6 24.0 25.8 24.1 6.0 6.0 4.6 100
3.0 8.8 16.1 36.3 14.3 12.9 2.9 5.8 100
3.5 7.4 21.2 21.6 27.2 6.6 7.5 5.2 100
3.7 10.9 11.3 35.2 13.5 14.7 4.4 6.3 100
5.2 5.6 21.8 17.8 28.9 10.3 6.0 4.4 100
3.0 9.3 11.5 33.0 21.5 12.4 6.5 2.8 100
3.5 4.1 20.9 24.3 24.3 15.5 7.4 100
60 ASER 2006
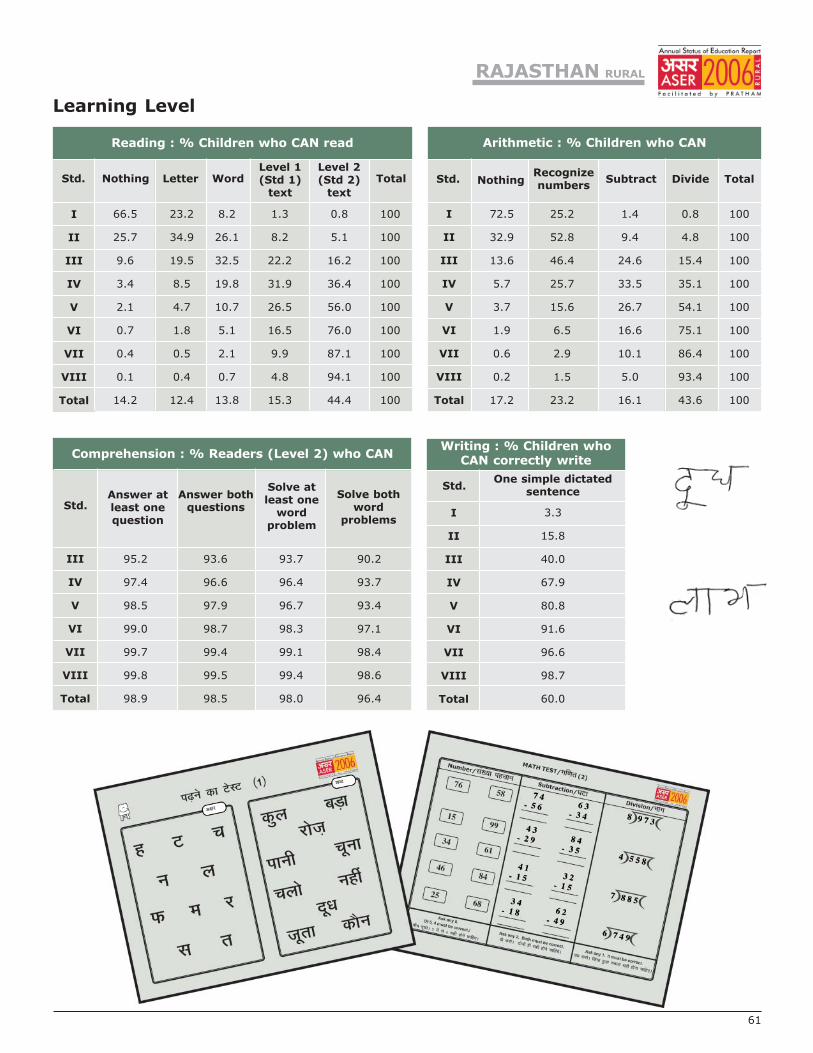
Learning Level
Reading : % Children who CAN read
I
II
III
IV
V
VI
VII
VIII
Total
Std. Nothing Letter WordLevel 1(Std 1)
text
Level 2(Std 2)
text
Total
66.5 23.2 8.2 1.3 0.8 100
25.7 34.9 26.1 8.2 5.1 100
9.6 19.5 32.5 22.2 16.2 100
3.4 8.5 19.8 31.9 36.4 100
2.1 4.7 10.7 26.5 56.0 100
0.7 1.8 5.1 16.5 76.0 100
0.4 0.5 2.1 9.9 87.1 100
0.1 0.4 0.7 4.8 94.1 100
14.2 12.4 13.8 15.3 44.4 100
Std.
Arithmetic : % Children who CAN
NothingRecognizenumbers
Subtract Divide Total
I
II
III
IV
V
VI
VII
VIII
Total
72.5 25.2 1.4 0.8 100
32.9 52.8 9.4 4.8 100
13.6 46.4 24.6 15.4 100
5.7 25.7 33.5 35.1 100
3.7 15.6 26.7 54.1 100
1.9 6.5 16.6 75.1 100
0.6 2.9 10.1 86.4 100
0.2 1.5 5.0 93.4 100
17.2 23.2 16.1 43.6 100
Writing : % Children whoCAN correctly write
One simple dictatedsentence
I
II
III
IV
V
VI
VII
VIII
Total
Std.
III
IV
V
VI
VII
VIII
Total
Comprehension : % Readers (Level 2) who CAN
Answer atleast onequestion
Answer bothquestions
Solve atleast one
wordproblem
Solve bothword
problems
Std.
95.2 93.6 93.7 90.2
97.4 96.6 96.4 93.7
98.5 97.9 96.7 93.4
99.0 98.7 98.3 97.1
99.7 99.4 99.1 98.4
99.8 99.5 99.4 98.6
98.9 98.5 98.0 96.4
3.3
15.8
40.0
67.9
80.8
91.6
96.6
98.7
60.0
RAJASTHAN RURAL
61
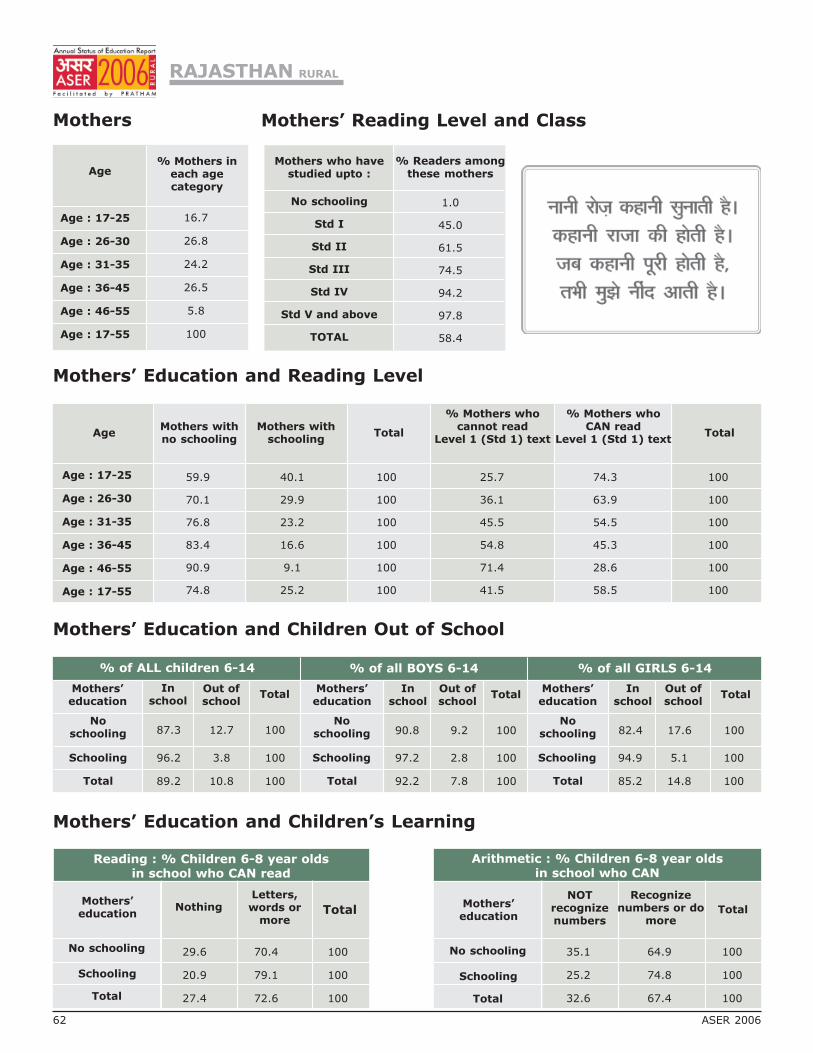
Mothers
Mothers’ Education and Children Out of School
Mothers’ Education and Children’s Learning
Age% Mothers in
each agecategory
Age : 17-25
Age : 26-30
Age : 31-35
Age : 36-45
Age : 46-55
Age : 17-55
% of ALL children 6-14 % of all BOYS 6-14 % of all GIRLS 6-14
Mothers’education
Noschooling
Schooling
Total
Mothers’education
Noschooling
Schooling
Total
Mothers’education
Noschooling
Schooling
Total
Inschool
Out ofschool
TotalIn
schoolOut ofschool
TotalIn
schoolOut ofschool
Total
Mothers’education
No schooling
Schooling
Total
Letters,words or
moreTotal
NOTrecognizenumbers
Recognizenumbers or do
moreTotal
Mothers’education
No schooling
Schooling
Total
Nothing
Mothers’ Education and Reading Level
AgeMothers withno schooling
Mothers withschooling
Total
% Mothers whocannot read
Level 1 (Std 1) text
% Mothers whoCAN read
Level 1 (Std 1) textTotal
Age : 17-25
Age : 26-30
Age : 31-35
Age : 36-45
Age : 46-55
Age : 17-55
RAJASTHAN RURAL
16.7
26.8
24.2
26.5
5.8
100
87.3 12.7 100
96.2 3.8 100
89.2 10.8 100
90.8 9.2 100
97.2 2.8 100
92.2 7.8 100
82.4 17.6 100
94.9 5.1 100
85.2 14.8 100
29.6 70.4 100
20.9 79.1 100
27.4 72.6 100
35.1 64.9 100
25.2 74.8 100
32.6 67.4 100
59.9 40.1 100 25.7 74.3 100
70.1 29.9 100 36.1 63.9 100
76.8 23.2 100 45.5 54.5 100
83.4 16.6 100 54.8 45.3 100
90.9 9.1 100 71.4 28.6 100
74.8 25.2 100 41.5 58.5 100
Reading : % Children 6-8 year oldsin school who CAN read
Arithmetic : % Children 6-8 year oldsin school who CAN
Mothers’ Reading Level and Class
62 ASER 2006
Mothers who havestudied upto :
% Readers amongthese mothers
No schooling
Std I
Std II
Std III
Std IV
Std V and above
TOTAL
1.0
45.0
61.5
74.5
94.2
97.8
58.4
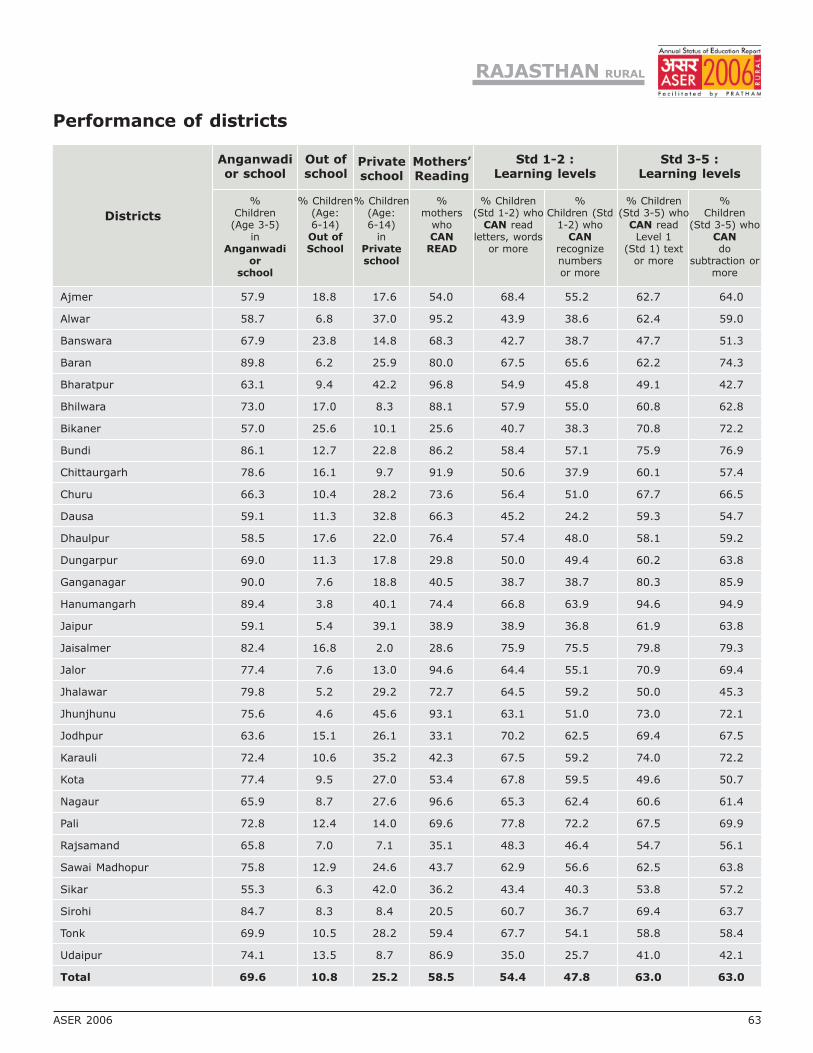
RAJASTHAN RURAL
Districts
Anganwadior school
Out ofschool
Privateschool
Mothers’Reading
Std 1-2 :Learning levels
Std 3-5 :Learning levels
%Children
(Age 3-5)in
Anganwadior
school
% Children(Age:6-14)Out ofSchool
% Children(Age:6-14)
inPrivateschool
%mothers
whoCAN
READ
% Children(Std 1-2) who
CAN readletters, words
or more
% Children(Std 3-5) who
CAN readLevel 1
(Std 1) textor more
%Children (Std
1-2) whoCAN
recognizenumbersor more
%Children
(Std 3-5) whoCANdo
subtraction ormore
Performance of districts
Ajmer 57.9 18.8 17.6 54.0 68.4 55.2 62.7 64.0
Alwar 58.7 6.8 37.0 95.2 43.9 38.6 62.4 59.0
Banswara 67.9 23.8 14.8 68.3 42.7 38.7 47.7 51.3
Baran 89.8 6.2 25.9 80.0 67.5 65.6 62.2 74.3
Bharatpur 63.1 9.4 42.2 96.8 54.9 45.8 49.1 42.7
Bhilwara 73.0 17.0 8.3 88.1 57.9 55.0 60.8 62.8
Bikaner 57.0 25.6 10.1 25.6 40.7 38.3 70.8 72.2
Bundi 86.1 12.7 22.8 86.2 58.4 57.1 75.9 76.9
Chittaurgarh 78.6 16.1 9.7 91.9 50.6 37.9 60.1 57.4
Churu 66.3 10.4 28.2 73.6 56.4 51.0 67.7 66.5
Dausa 59.1 11.3 32.8 66.3 45.2 24.2 59.3 54.7
Dhaulpur 58.5 17.6 22.0 76.4 57.4 48.0 58.1 59.2
Dungarpur 69.0 11.3 17.8 29.8 50.0 49.4 60.2 63.8
Ganganagar 90.0 7.6 18.8 40.5 38.7 38.7 80.3 85.9
Hanumangarh 89.4 3.8 40.1 74.4 66.8 63.9 94.6 94.9
Jaipur 59.1 5.4 39.1 38.9 38.9 36.8 61.9 63.8
Jaisalmer 82.4 16.8 2.0 28.6 75.9 75.5 79.8 79.3
Jalor 77.4 7.6 13.0 94.6 64.4 55.1 70.9 69.4
Jhalawar 79.8 5.2 29.2 72.7 64.5 59.2 50.0 45.3
Jhunjhunu 75.6 4.6 45.6 93.1 63.1 51.0 73.0 72.1
Jodhpur 63.6 15.1 26.1 33.1 70.2 62.5 69.4 67.5
Karauli 72.4 10.6 35.2 42.3 67.5 59.2 74.0 72.2
Kota 77.4 9.5 27.0 53.4 67.8 59.5 49.6 50.7
Nagaur 65.9 8.7 27.6 96.6 65.3 62.4 60.6 61.4
Pali 72.8 12.4 14.0 69.6 77.8 72.2 67.5 69.9
Rajsamand 65.8 7.0 7.1 35.1 48.3 46.4 54.7 56.1
Sawai Madhopur 75.8 12.9 24.6 43.7 62.9 56.6 62.5 63.8
Sikar 55.3 6.3 42.0 36.2 43.4 40.3 53.8 57.2
Sirohi 84.7 8.3 8.4 20.5 60.7 36.7 69.4 63.7
Tonk 69.9 10.5 28.2 59.4 67.7 54.1 58.8 58.4
Udaipur 74.1 13.5 8.7 86.9 35.0 25.7 41.0 42.1
Total 69.6 10.8 25.2 58.5 54.4 47.8 63.0 63.0
ASER 2006 63

BIHAR RURAL
All analysis based on data from 37 out of 37 districts
Enrollment
Age and Class
SCHOOL ENROLLMENT AND OUT OF SCHOOL CHILDREN
% Children in each age groupin different types of schools
% Children out ofschool
Govt. Pvt.Other
(Madarsa + EGS)Not in school (Neverenrolled + drop out)
Total
Age : 7-16 ALL
Age : 7-10 ALL
Age : 7-10 BOYS
Age : 7-10 GIRLS
Age : 11-14 ALL
Age : 11-14 BOYS
Age : 11-14 GIRLS
Age : 15-16 ALL
Age : 15-16 BOYS
Age : 15-16 GIRLS
72.0 10.7 3.2 14.2 100
72.6 12.7 3.7 11.1 100
73.2 14.0 3.4 9.4 100
71.7 11.0 4.0 13.3 100
73.2 9.5 2.8 14.6 100
75.2 10.3 2.2 12.3 100
70.4 8.4 3.5 17.6 100
66.2 5.5 2.1 26.2 100
67.9 5.4 1.7 25.1 100
63.2 5.7 2.9 28.2 100
Young Children
IN BALWADI / ANGANWADI OR IN SCHOOL
% Children in pre-school or school
Age : 3 ALL
Age : 4 ALL
Age : 5 ALL
Age : 6 ALL
In
balw
ad
io
ran
gan
wad
i
In school
Govt. Pvt. Other
Not
goin
gan
yw
here
Total
47.1 0.5 52.4 100
55.9 0.7 43.4 100
29.6 33.4 7.4 2.0 27.6 100
0.4 68.2 12.6 4.1 14.8 100
I
II
III
IV
V
VI
VII
VIII
Std.5 6 7 8 9 10 11 12 13 14 15 16 Total
% Children in each standard by age
AGE BY STANDARD FOR SCHOOL CHILDREN
17.3 39.8 18.2 14.3 3.4 4.4 2.6 100
3.2 14.8 21.2 29.8 8.8 12.6 2.8 6.9 100
0.9 4.7 10.0 31.0 13.0 21.5 5.1 7.9 5.9 100
2.1 4.2 15.6 15.0 30.2 8.8 14.3 4.1 5.7 100
2.6 7.2 6.8 31.9 12.5 21.0 6.9 6.0 5.1 100
4.6 2.4 16.0 14.1 33.1 12.7 10.4 4.9 1.9 100
3.2 7.1 7.1 32.5 20.0 16.8 8.6 4.7 100
5.0 3.1 18.6 22.3 27.2 14.5 9.3 100
64 ASER 2006
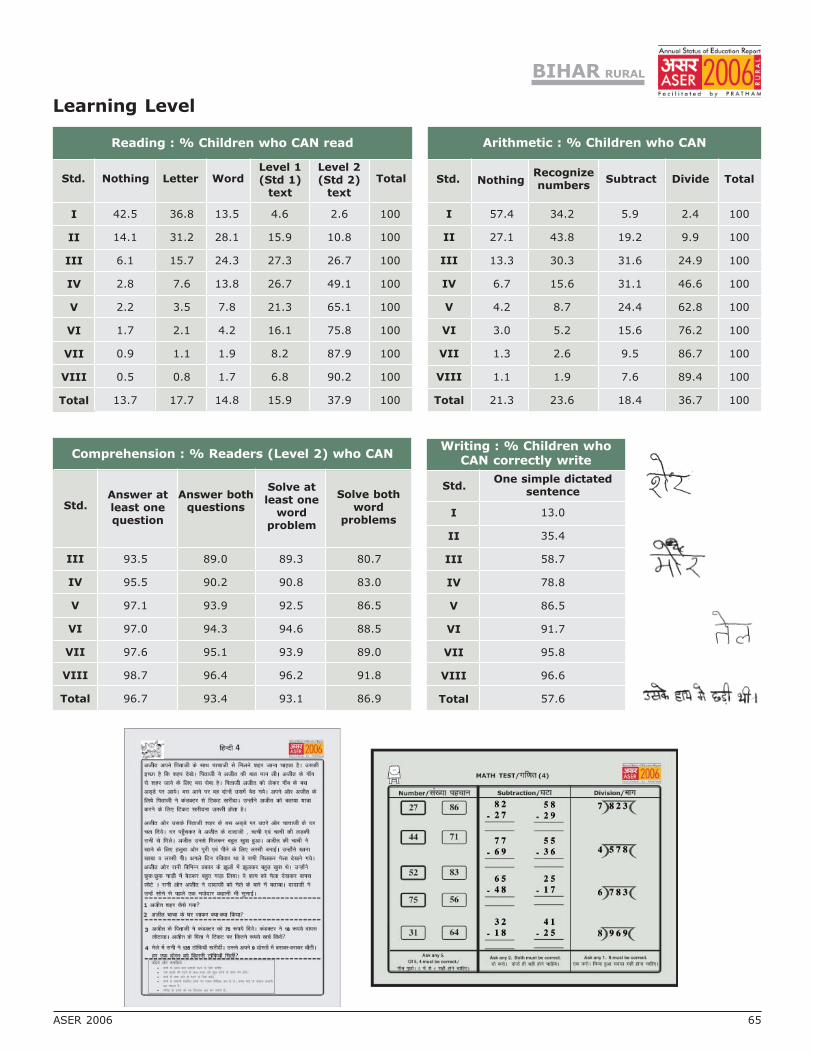
Learning Level
Reading : % Children who CAN read
I
II
III
IV
V
VI
VII
VIII
Total
Std. Nothing Letter WordLevel 1(Std 1)
text
Level 2(Std 2)
text
Total
42.5 36.8 13.5 4.6 2.6 100
14.1 31.2 28.1 15.9 10.8 100
6.1 15.7 24.3 27.3 26.7 100
2.8 7.6 13.8 26.7 49.1 100
2.2 3.5 7.8 21.3 65.1 100
1.7 2.1 4.2 16.1 75.8 100
0.9 1.1 1.9 8.2 87.9 100
0.5 0.8 1.7 6.8 90.2 100
13.7 17.7 14.8 15.9 37.9 100
Std.
Arithmetic : % Children who CAN
NothingRecognizenumbers
Subtract Divide Total
I
II
III
IV
V
VI
VII
VIII
Total
57.4 34.2 5.9 2.4 100
27.1 43.8 19.2 9.9 100
13.3 30.3 31.6 24.9 100
6.7 15.6 31.1 46.6 100
4.2 8.7 24.4 62.8 100
3.0 5.2 15.6 76.2 100
1.3 2.6 9.5 86.7 100
1.1 1.9 7.6 89.4 100
21.3 23.6 18.4 36.7 100
Writing : % Children whoCAN correctly write
One simple dictatedsentence
I
II
III
IV
V
VI
VII
VIII
Total
Std.
III
IV
V
VI
VII
VIII
Total
Comprehension : % Readers (Level 2) who CAN
Answer atleast onequestion
Answer bothquestions
Solve atleast one
wordproblem
Solve bothword
problems
Std.
93.5 89.0 89.3 80.7
95.5 90.2 90.8 83.0
97.1 93.9 92.5 86.5
97.0 94.3 94.6 88.5
97.6 95.1 93.9 89.0
98.7 96.4 96.2 91.8
96.7 93.4 93.1 86.9
13.0
35.4
58.7
78.8
86.5
91.7
95.8
96.6
57.6
BIHAR RURAL
ASER 2006 65

Mothers
Mothers’ Education and Children Out of School
Mothers’ Education and Children’s Learning
Age% Mothers in
each agecategory
Age : 17-25
Age : 26-30
Age : 31-35
Age : 36-45
Age : 46-55
Age : 17-55
% of ALL children 6-14 % of all BOYS 6-14 % of all GIRLS 6-14
Mothers’education
Noschooling
Schooling
Total
Mothers’education
Noschooling
Schooling
Total
Mothers’education
Noschooling
Schooling
Total
Inschool
Out ofschool
TotalIn
schoolOut ofschool
TotalIn
schoolOut ofschool
Total
Mothers’education
No schooling
Schooling
Total
Letters,words or
moreTotal
NOTrecognizenumbers
Recognizenumbers or do
moreTotal
Mothers’education
No schooling
Schooling
Total
Nothing
Mothers’ Education and Reading Level
AgeMothers withno schooling
Mothers withschooling
Total
% Mothers whocannot read
Level 1 (Std 1) text
% Mothers whoCAN read
Level 1 (Std 1) textTotal
Age : 17-25
Age : 26-30
Age : 31-35
Age : 36-45
Age : 46-55
Age : 17-55
BIHAR RURAL
15.7
29.1
24.5
25.5
5.2
100
83.2 16.8 100
95.3 4.7 100
87.2 12.8 100
85.8 14.2 100
95.6 4.4 100
89.0 11.0 100
79.8 20.2 100
94.9 5.2 100
84.9 15.1 100
27.8 72.2 100
16.0 84.0 100
23.5 76.5 100
41.3 58.8 100
25.8 74.2 100
35.6 64.4 100
52.7 47.3 100 55.7 44.3 100
59.8 40.3 100 62.9 37.1 100
66.8 33.2 100 69.5 30.6 100
73.1 26.9 100 75.6 24.4 100
82.0 18.1 100 83.8 16.2 100
64.9 35.1 100 67.7 32.3 100
Reading : % Children 6-8 year oldsin school who CAN read
Arithmetic : % Children 6-8 year oldsin school who CAN
Mothers’ Reading Level and Class
66 ASER 2006
Mothers who havestudied upto :
% Readers amongthese mothers
No schooling
Std I
Std II
Std III
Std IV
Std V and above
TOTAL
0.5
57.7
74.2
83.1
90.6
97.5
31.5

BIHAR RURAL
Districts
Anganwadior school
Out ofschool
Privateschool
Mothers’Reading
Std 1-2 :Learning levels
Std 3-5 :Learning levels
%Children
(Age 3-5)in
Anganwadior
school
% Children(Age:6-14)Out ofSchool
% Children(Age:6-14)
inPrivateschool
%mothers
whoCAN
READ
% Children(Std 1-2) who
CAN readletters, words
or more
% Children(Std 3-5) who
CAN readLevel 1
(Std 1) textor more
%Children (Std
1-2) whoCAN
recognizenumbersor more
%Children
(Std 3-5) whoCANdo
subtraction ormore
Performance of districts
Pashchimi Champaran 47.5 15.7 16.0 15.9 58.8 39.3 70.4 63.6
Purba Champaran 80.1 5.7 15.8 26.5 71.0 57.8 67.7 69.9
Sheohar 38.4 30.1 5.3 25.1 85.9 77.3 80.0 82.3
Sitamarhi 38.8 17.1 10.3 27.5 65.8 37.0 63.1 61.6
Madhubani 45.8 14.9 7.2 20.2 55.4 36.5 70.8 69.0
Supaul 42.0 21.7 4.0 21.2 72.3 52.1 68.1 73.4
Araria 55.4 28.1 7.4 18.4 72.3 47.3 61.3 57.0
Kishanganj 40.4 24.7 7.8 19.1 66.5 55.6 70.7 71.4
Purnia 62.8 16.3 2.6 38.7 87.1 75.8 79.9 83.7
Katihar 48.8 18.7 5.3 37.6 92.5 79.8 77.8 79.8
Madhepura 49.6 17.9 14.8 26.8 66.9 51.3 64.6 67.6
Saharsa 60.3 14.6 10.3 19.0 70.9 58.5 71.1 77.8
Darbhanga 51.5 22.4 7.7 20.0 68.4 56.5 61.9 64.4
Muzaffarpur 56.1 9.6 11.2 36.3 68.3 56.7 71.4 70.5
Gopalganj 94.8 4.9 16.3 47.9 73.9 64.8 79.7 82.5
Siwan 66.0 5.5 24.2 34.7 75.1 62.1 65.2 70.3
Saran 54.5 11.0 10.7 34.2 74.5 59.5 69.5 72.8
Vaishali 43.6 9.8 13.1 39.2 73.2 64.4 61.0 68.1
Samastipur 47.0 10.6 8.0 38.6 67.9 56.4 74.6 73.7
Begusarai 52.3 9.4 14.6 36.5 69.5 55.6 82.7 83.8
Khagaria 44.5 12.0 10.2 31.4 82.5 66.1 84.1 84.5
Bhagalpur 64.8 10.3 18.6 41.6 64.8 46.3 64.5 67.8
Banka 47.4 13.3 15.0 33.3 51.3 34.6 56.7 62.7
Munger 68.7 11.2 19.6 46.9 79.6 66.7 78.1 86.5
Lakhisarai 73.3 12.1 11.9 36.4 71.7 53.6 73.9 75.4
Sheikhpura 71.5 11.7 9.5 36.4 66.7 58.4 74.5 77.0
Nalanda 61.5 16.6 10.0 28.5 65.5 51.5 66.8 66.8
Patna 69.4 6.3 17.0 49.9 69.0 61.8 81.9 84.4
Bhojpur 73.3 12.2 8.2 36.9 78.4 67.7 65.2 73.0
Buxar 74.3 6.8 12.1 39.6 78.4 63.9 70.6 73.3
Kaimur (Bhabua) 64.2 3.1 7.3 40.2 78.9 66.7 72.2 74.0
Rohtas 78.4 6.1 16.7 34.0 74.7 60.0 69.1 66.5
Jahanabad 61.4 8.0 10.2 37.5 46.8 35.4 63.1 63.9
Aurangabad 96.1 9.3 3.7 40.5 71.1 59.6 69.9 71.8
Gaya 43.9 12.3 7.0 35.8 73.8 65.4 73.7 75.0
Nawada 54.4 14.9 16.9 31.8 72.7 67.2 78.3 78.5
Jamui 61.0 12.0 12.5 33.4 73.3 55.9 68.5 72.1
Total 57.7 12.8 11.5 32.3 70.1 56.0 70.6 72.4
ASER 2006 67
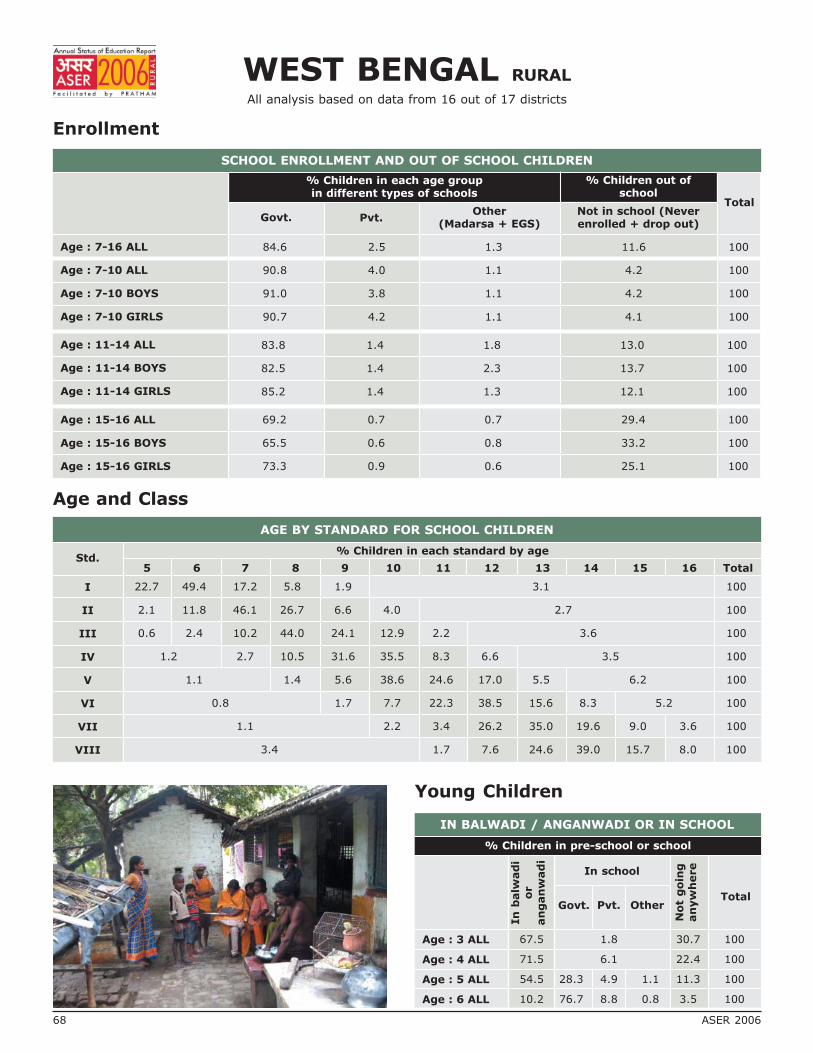
WEST BENGAL RURAL
All analysis based on data from 16 out of 17 districts
Enrollment
Age and Class
SCHOOL ENROLLMENT AND OUT OF SCHOOL CHILDREN
% Children in each age groupin different types of schools
% Children out ofschool
Govt. Pvt.Other
(Madarsa + EGS)Not in school (Neverenrolled + drop out)
Total
Age : 7-16 ALL
Age : 7-10 ALL
Age : 7-10 BOYS
Age : 7-10 GIRLS
Age : 11-14 ALL
Age : 11-14 BOYS
Age : 11-14 GIRLS
Age : 15-16 ALL
Age : 15-16 BOYS
Age : 15-16 GIRLS
84.6 2.5 1.3 11.6 100
90.8 4.0 1.1 4.2 100
91.0 3.8 1.1 4.2 100
90.7 4.2 1.1 4.1 100
83.8 1.4 1.8 13.0 100
82.5 1.4 2.3 13.7 100
85.2 1.4 1.3 12.1 100
69.2 0.7 0.7 29.4 100
65.5 0.6 0.8 33.2 100
73.3 0.9 0.6 25.1 100
Young Children
IN BALWADI / ANGANWADI OR IN SCHOOL
% Children in pre-school or school
Age : 3 ALL
Age : 4 ALL
Age : 5 ALL
Age : 6 ALL
In
balw
ad
io
ran
gan
wad
i
In school
Govt. Pvt. Other
Not
goin
gan
yw
here
Total
67.5 1.8 30.7 100
71.5 6.1 22.4 100
54.5 28.3 4.9 1.1 11.3 100
10.2 76.7 8.8 0.8 3.5 100
I
II
III
IV
V
VI
VII
VIII
Std.5 6 7 8 9 10 11 12 13 14 15 16 Total
% Children in each standard by age
AGE BY STANDARD FOR SCHOOL CHILDREN
22.7 49.4 17.2 5.8 1.9 3.1 100
2.1 11.8 46.1 26.7 6.6 4.0 2.7 100
0.6 2.4 10.2 44.0 24.1 12.9 2.2 3.6 100
1.2 2.7 10.5 31.6 35.5 8.3 6.6 3.5 100
1.1 1.4 5.6 38.6 24.6 17.0 5.5 6.2 100
0.8 1.7 7.7 22.3 38.5 15.6 8.3 5.2 100
1.1 2.2 3.4 26.2 35.0 19.6 9.0 3.6 100
3.4 1.7 7.6 24.6 39.0 15.7 8.0 100
68 ASER 2006

Learning Level
Reading : % Children who CAN read
I
II
III
IV
V
VI
VII
VIII
Total
Std. Nothing Letter WordLevel 1(Std 1)
text
Level 2(Std 2)
text
Total
13.6 53.7 24.1 6.0 2.7 100
4.7 21.8 40.9 22.7 10.0 100
1.2 7.3 23.6 44.6 23.4 100
0.4 4.4 10.2 33.8 51.2 100
0.5 1.2 6.5 26.6 65.3 100
0.2 0.5 2.1 21.3 76.0 100
0.2 0.4 0.8 12.1 86.5 100
0.0 0.2 0.4 7.7 91.8 100
2.9 12.4 14.8 23.2 46.6 100
Std.
Arithmetic : % Children who CAN
NothingRecognizenumbers
Subtract Divide Total
I
II
III
IV
V
VI
VII
VIII
Total
40.1 47.3 9.6 3.0 100
14.2 47.6 29.0 9.2 100
4.8 26.0 45.3 23.9 100
2.2 11.2 37.8 48.9 100
1.6 6.2 26.9 65.4 100
0.8 3.2 18.2 77.9 100
0.3 2.8 8.5 88.5 100
0.3 1.8 7.7 90.2 100
8.8 19.7 24.6 46.9 100
Writing : % Children whoCAN correctly write
One simple dictatedsentence
I
II
III
IV
V
VI
VII
VIII
Total
Std.
III
IV
V
VI
VII
VIII
Total
Comprehension : % Readers (Level 2) who CAN
Answer atleast onequestion
Answer bothquestions
Solve atleast one
wordproblem
Solve bothword
problems
Std.
80.6 63.7 66.6 50.6
90.5 80.4 72.4 55.1
96.1 86.9 83.7 68.9
96.0 87.4 85.7 76.9
97.6 93.9 90.6 81.7
98.9 94.2 92.7 85.2
94.8 86.7 83.8 72.1
26.0
59.5
81.6
92.0
95.8
98.1
99.0
98.9
79.9
WEST BENGAL RURAL
ASER 2006 69

Mothers
Mothers’ Education and Children Out of School
Mothers’ Education and Children’s Learning
Age% Mothers in
each agecategory
Age : 17-25
Age : 26-30
Age : 31-35
Age : 36-45
Age : 46-55
Age : 17-55
% of ALL children 6-14 % of all BOYS 6-14 % of all GIRLS 6-14
Mothers’education
Noschooling
Schooling
Total
Mothers’education
Noschooling
Schooling
Total
Mothers’education
Noschooling
Schooling
Total
Inschool
Out ofschool
TotalIn
schoolOut ofschool
TotalIn
schoolOut ofschool
Total
Mothers’education
No schooling
Schooling
Total
Letters,words or
moreTotal
NOTrecognizenumbers
Recognizenumbers or do
moreTotal
Mothers’education
No schooling
Schooling
Total
Nothing
Mothers’ Education and Reading Level
AgeMothers withno schooling
Mothers withschooling
Total
% Mothers whocannot read
Level 1 (Std 1) text
% Mothers whoCAN read
Level 1 (Std 1) textTotal
Age : 17-25
Age : 26-30
Age : 31-35
Age : 36-45
Age : 46-55
Age : 17-55
WEST BENGAL RURAL
19.6
33.2
22.4
21.6
3.2
100
88.5 11.5 100
95.5 4.5 100
92.4 7.6 100
87.6 12.4 100
95.6 4.4 100
92.0 8.0 100
89.6 10.5 100
95.4 4.6 100
92.9 7.1 100
9.5 90.5 100
4.1 95.9 100
6.4 93.6 100
23.3 76.7 100
16.1 83.9 100
19.1 80.9 100
28.1 71.9 100 35.1 64.9 100
33.2 66.8 100 38.1 61.9 100
44.1 55.9 100 45.7 54.3 100
48.3 51.7 100 50.2 49.8 100
55.4 44.6 100 63.3 36.7 100
38.6 61.4 100 42.5 57.5 100
Reading : % Children 6-8 year oldsin school who CAN read
Arithmetic : % Children 6-8 year oldsin school who CAN
Mothers’ Reading Level and Class
70 ASER 2006
Mothers who havestudied upto :
% Readers amongthese mothers
No schooling
Std I
Std II
Std III
Std IV
Std V and above
TOTAL
2.5
35.9
34.5
56.8
75.5
95.0
57.6
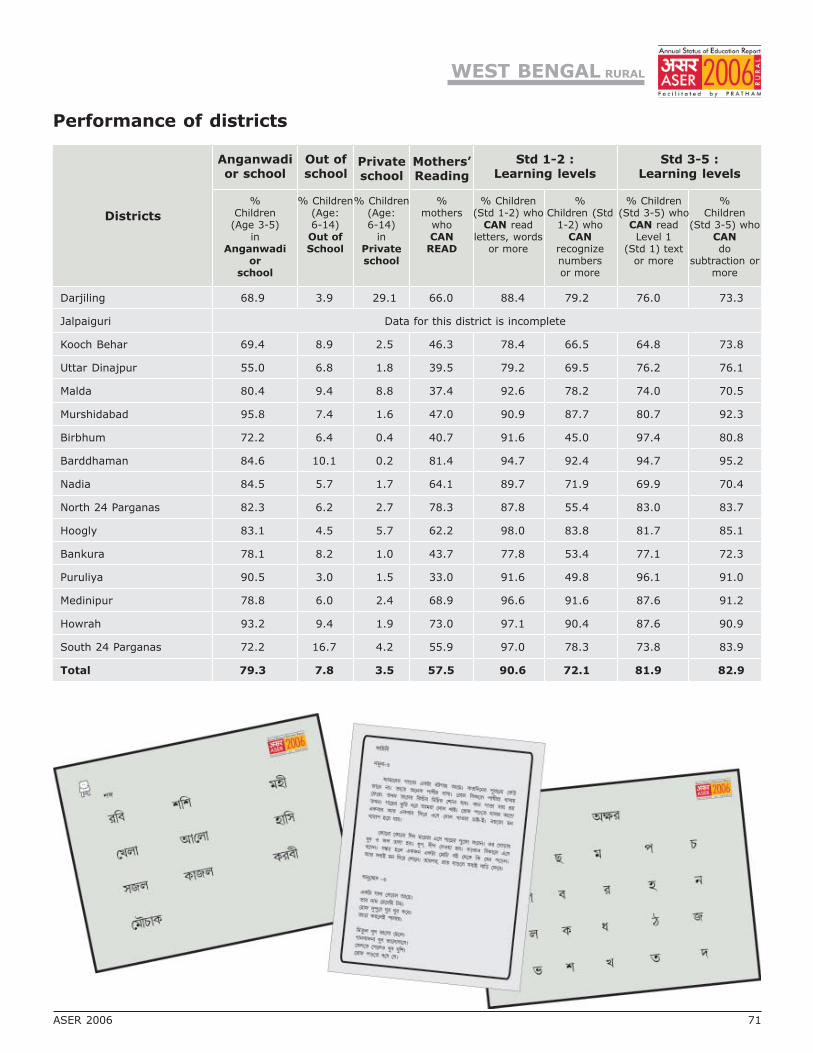
Districts
Anganwadior school
Out ofschool
Privateschool
Mothers’Reading
Std 1-2 :Learning levels
Std 3-5 :Learning levels
%Children
(Age 3-5)in
Anganwadior
school
% Children(Age:6-14)Out ofSchool
% Children(Age:6-14)
inPrivateschool
%mothers
whoCAN
READ
% Children(Std 1-2) who
CAN readletters, words
or more
% Children(Std 3-5) who
CAN readLevel 1
(Std 1) textor more
%Children (Std
1-2) whoCAN
recognizenumbersor more
%Children
(Std 3-5) whoCANdo
subtraction ormore
Performance of districts
WEST BENGAL RURAL
ASER 2006 71
Darjiling 68.9 3.9 29.1 66.0 88.4 79.2 76.0 73.3
Jalpaiguri Data for this district is incomplete
Kooch Behar 69.4 8.9 2.5 46.3 78.4 66.5 64.8 73.8
Uttar Dinajpur 55.0 6.8 1.8 39.5 79.2 69.5 76.2 76.1
Malda 80.4 9.4 8.8 37.4 92.6 78.2 74.0 70.5
Murshidabad 95.8 7.4 1.6 47.0 90.9 87.7 80.7 92.3
Birbhum 72.2 6.4 0.4 40.7 91.6 45.0 97.4 80.8
Barddhaman 84.6 10.1 0.2 81.4 94.7 92.4 94.7 95.2
Nadia 84.5 5.7 1.7 64.1 89.7 71.9 69.9 70.4
North 24 Parganas 82.3 6.2 2.7 78.3 87.8 55.4 83.0 83.7
Hoogly 83.1 4.5 5.7 62.2 98.0 83.8 81.7 85.1
Bankura 78.1 8.2 1.0 43.7 77.8 53.4 77.1 72.3
Puruliya 90.5 3.0 1.5 33.0 91.6 49.8 96.1 91.0
Medinipur 78.8 6.0 2.4 68.9 96.6 91.6 87.6 91.2
Howrah 93.2 9.4 1.9 73.0 97.1 90.4 87.6 90.9
South 24 Parganas 72.2 16.7 4.2 55.9 97.0 78.3 73.8 83.9
Total 79.3 7.8 3.5 57.5 90.6 72.1 81.9 82.9

JHARKHAND RURAL
All analysis based on data from 22 out of 22 districts
Enrollment
Age and Class
SCHOOL ENROLLMENT AND OUT OF SCHOOL CHILDREN
% Children in each age groupin different types of schools
% Children out ofschool
Govt. Pvt.Other
(Madarsa + EGS)Not in school (Neverenrolled + drop out)
Total
Age : 7-16 ALL
Age : 7-10 ALL
Age : 7-10 BOYS
Age : 7-10 GIRLS
Age : 11-14 ALL
Age : 11-14 BOYS
Age : 11-14 GIRLS
Age : 15-16 ALL
Age : 15-16 BOYS
Age : 15-16 GIRLS
73.3 11.4 3.7 11.5 100
77.0 10.9 5.2 6.9 100
77.3 11.9 4.8 6.0 100
76.6 9.8 5.7 7.8 100
74.0 11.8 2.5 11.7 100
75.3 11.8 2.3 10.6 100
72.4 11.8 2.7 13.0 100
59.0 12.0 1.8 27.3 100
61.0 11.4 1.5 26.0 100
55.7 13.0 2.1 29.3 100
Young Children
IN BALWADI / ANGANWADI OR IN SCHOOL
% Children in pre-school or school
Age : 3 ALL
Age : 4 ALL
Age : 5 ALL
Age : 6 ALL
In
balw
ad
io
ran
gan
wad
i
In school
Govt. Pvt. Other
Not
goin
gan
yw
here
Total
59.0 3.7 37.3 100
65.8 8.4 25.8 100
26.6 44.7 7.1 6.0 15.7 100
3.0 71.2 10.6 6.9 8.4 100
I
II
III
IV
V
VI
VII
VIII
Std.5 6 7 8 9 10 11 12 13 14 15 16 Total
% Children in each standard by age
AGE BY STANDARD FOR SCHOOL CHILDREN
27.2 38.8 15.3 10.8 2.5 2.6 2.8 100
5.0 15.0 25.6 29.7 8.5 9.6 2.2 4.6 100
1.6 5.0 11.0 31.3 16.0 18.6 4.4 7.8 4.3 100
1.8 4.1 13.1 16.1 33.0 8.5 13.8 4.4 5.3 100
2.4 6.2 7.5 28.6 15.9 21.6 8.2 5.5 4.2 100
3.5 2.4 12.8 14.7 36.1 13.2 10.5 4.7 2.2 100
1.9 5.5 6.0 32.1 21.9 19.0 8.7 4.9 100
3.6 2.5 15.9 25.5 26.1 16.8 9.5 100
72 ASER 2006
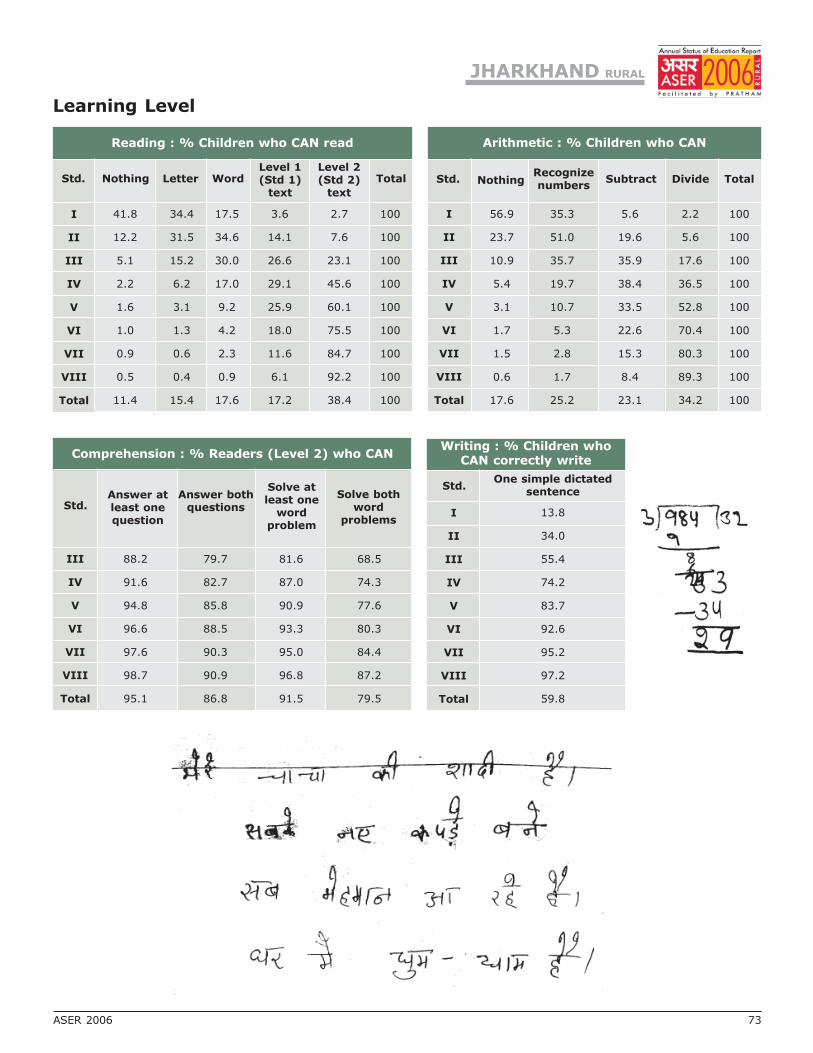
Learning Level
Reading : % Children who CAN read
I
II
III
IV
V
VI
VII
VIII
Total
Std. Nothing Letter WordLevel 1(Std 1)
text
Level 2(Std 2)
text
Total
41.8 34.4 17.5 3.6 2.7 100
12.2 31.5 34.6 14.1 7.6 100
5.1 15.2 30.0 26.6 23.1 100
2.2 6.2 17.0 29.1 45.6 100
1.6 3.1 9.2 25.9 60.1 100
1.0 1.3 4.2 18.0 75.5 100
0.9 0.6 2.3 11.6 84.7 100
0.5 0.4 0.9 6.1 92.2 100
11.4 15.4 17.6 17.2 38.4 100
Std.
Arithmetic : % Children who CAN
NothingRecognizenumbers
Subtract Divide Total
I
II
III
IV
V
VI
VII
VIII
Total
56.9 35.3 5.6 2.2 100
23.7 51.0 19.6 5.6 100
10.9 35.7 35.9 17.6 100
5.4 19.7 38.4 36.5 100
3.1 10.7 33.5 52.8 100
1.7 5.3 22.6 70.4 100
1.5 2.8 15.3 80.3 100
0.6 1.7 8.4 89.3 100
17.6 25.2 23.1 34.2 100
Writing : % Children whoCAN correctly write
One simple dictatedsentence
I
II
III
IV
V
VI
VII
VIII
Total
Std.
III
IV
V
VI
VII
VIII
Total
Comprehension : % Readers (Level 2) who CAN
Answer atleast onequestion
Answer bothquestions
Solve atleast one
wordproblem
Solve bothword
problems
Std.
88.2 79.7 81.6 68.5
91.6 82.7 87.0 74.3
94.8 85.8 90.9 77.6
96.6 88.5 93.3 80.3
97.6 90.3 95.0 84.4
98.7 90.9 96.8 87.2
95.1 86.8 91.5 79.5
13.8
34.0
55.4
74.2
83.7
92.6
95.2
97.2
59.8
JHARKHAND RURAL
ASER 2006 73
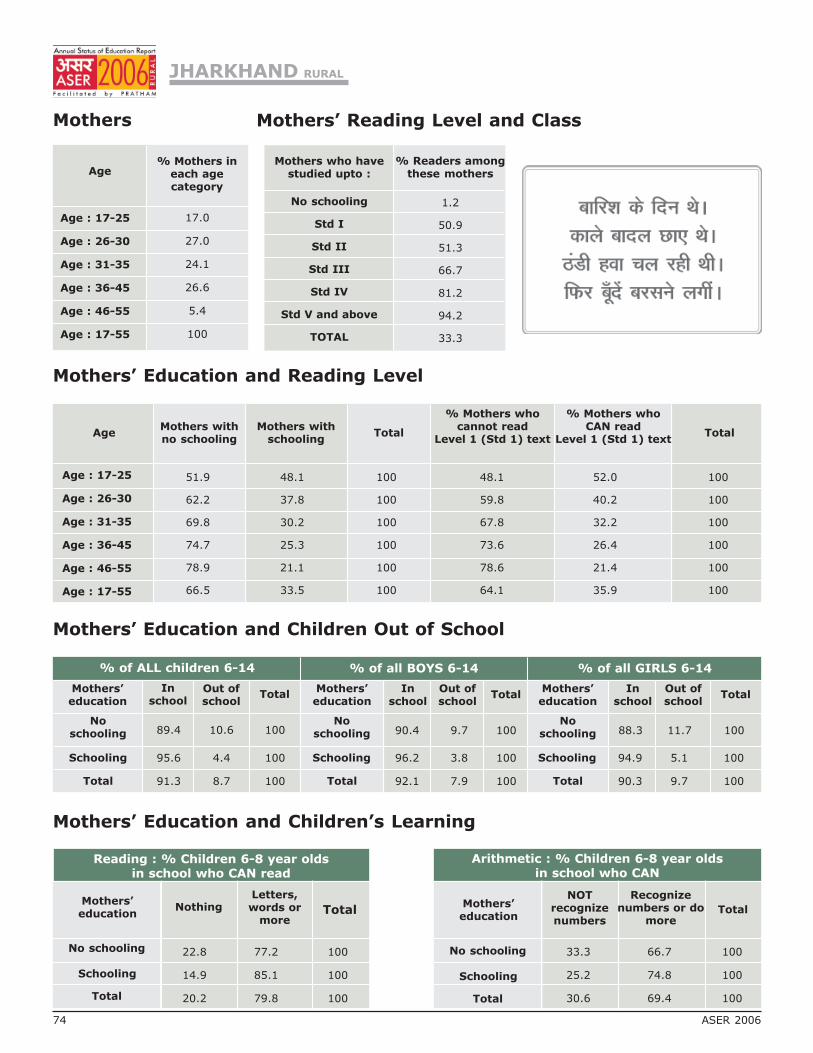
Mothers
Mothers’ Education and Children Out of School
Mothers’ Education and Children’s Learning
Age% Mothers in
each agecategory
Age : 17-25
Age : 26-30
Age : 31-35
Age : 36-45
Age : 46-55
Age : 17-55
% of ALL children 6-14 % of all BOYS 6-14 % of all GIRLS 6-14
Mothers’education
Noschooling
Schooling
Total
Mothers’education
Noschooling
Schooling
Total
Mothers’education
Noschooling
Schooling
Total
Inschool
Out ofschool
TotalIn
schoolOut ofschool
TotalIn
schoolOut ofschool
Total
Mothers’education
No schooling
Schooling
Total
Letters,words or
moreTotal
NOTrecognizenumbers
Recognizenumbers or do
moreTotal
Mothers’education
No schooling
Schooling
Total
Nothing
Mothers’ Education and Reading Level
AgeMothers withno schooling
Mothers withschooling
Total
% Mothers whocannot read
Level 1 (Std 1) text
% Mothers whoCAN read
Level 1 (Std 1) textTotal
Age : 17-25
Age : 26-30
Age : 31-35
Age : 36-45
Age : 46-55
Age : 17-55
JHARKHAND RURAL
17.0
27.0
24.1
26.6
5.4
100
89.4 10.6 100
95.6 4.4 100
91.3 8.7 100
90.4 9.7 100
96.2 3.8 100
92.1 7.9 100
88.3 11.7 100
94.9 5.1 100
90.3 9.7 100
22.8 77.2 100
14.9 85.1 100
20.2 79.8 100
33.3 66.7 100
25.2 74.8 100
30.6 69.4 100
51.9 48.1 100 48.1 52.0 100
62.2 37.8 100 59.8 40.2 100
69.8 30.2 100 67.8 32.2 100
74.7 25.3 100 73.6 26.4 100
78.9 21.1 100 78.6 21.4 100
66.5 33.5 100 64.1 35.9 100
Reading : % Children 6-8 year oldsin school who CAN read
Arithmetic : % Children 6-8 year oldsin school who CAN
Mothers’ Reading Level and Class
74 ASER 2006
Mothers who havestudied upto :
% Readers amongthese mothers
No schooling
Std I
Std II
Std III
Std IV
Std V and above
TOTAL
1.2
50.9
51.3
66.7
81.2
94.2
33.3

Districts
Anganwadior school
Out ofschool
Privateschool
Mothers’Reading
Std 1-2 :Learning levels
Std 3-5 :Learning levels
%Children
(Age 3-5)in
Anganwadior
school
% Children(Age:6-14)Out ofSchool
% Children(Age:6-14)
inPrivateschool
%mothers
whoCAN
READ
% Children(Std 1-2) who
CAN readletters, words
or more
% Children(Std 3-5) who
CAN readLevel 1
(Std 1) textor more
%Children (Std
1-2) whoCAN
recognizenumbersor more
%Children
(Std 3-5) whoCANdo
subtraction ormore
Performance of districts
Garhwa 65.3 12.4 7.3 16.7 70.1 62.5 64.7 65.4
Palamau 24.3 11.6 4.8 27.1 68.8 60.0 63.8 77.5
Chatra 69.5 5.8 4.3 54.3 55.5 37.3 56.9 55.4
Hazaribagh 84.9 3.5 20.7 34.0 79.5 65.4 76.1 72.8
Kodarma 87.2 12.1 13.7 35.8 90.4 77.5 78.2 80.4
Giridih 79.2 7.3 17.9 80.3 70.8 59.8 73.1 68.5
Deoghar 76.6 9.0 5.3 33.5 59.7 40.3 66.2 62.3
Godda 71.8 9.4 8.1 35.8 67.1 52.7 63.7 65.9
Sahebganj 63.6 10.9 7.8 29.3 66.7 53.2 66.0 66.2
Pakaur 64.3 20.3 6.6 41.0 80.7 68.6 73.5 78.1
Dumka 79.6 7.6 2.7 34.4 73.0 53.8 68.6 84.1
Dhanbad 80.8 4.3 27.2 50.9 73.4 63.5 77.5 80.2
Bokaro 83.5 3.5 8.8 27.1 61.8 47.3 63.4 63.4
Ranchi 68.8 11.9 15.5 36.2 78.7 63.4 64.4 67.8
Lohardaga 82.4 8.6 11.2 31.3 76.7 71.3 69.1 66.1
Gumla 83.3 10.8 11.5 42.6 71.4 61.9 82.2 78.7
Pachim Singhbhum 88.4 9.0 7.8 27.9 90.6 86.1 86.6 83.6
Purbi Singhbhum 81.8 10.0 8.2 39.3 68.1 48.9 56.5 59.5
Latehar 77.1 8.9 11.1 24.0 72.7 48.7 75.7 72.3
Jamtara 76.0 7.8 3.7 30.9 72.7 58.3 39.0 58.2
Sindega 84.8 5.8 24.5 42.9 73.8 53.9 71.2 56.5
Saraikela (Jamshedpur) 70.3 11.3 6.3 64.4 83.3 72.0 74.2 76.9
Total 73.9 8.9 11.3 35.9 71.8 58.5 68.9 70.5
JHARKHAND RURAL
ASER 2006 75

ANDAMAN & NICOBAR RURAL
All analysis based on data from 1 out of 2 districts
Enrollment
Age and Class
SCHOOL ENROLLMENT AND OUT OF SCHOOL CHILDREN
% Children in each age groupin different types of schools
% Children out ofschool
Govt. Pvt.Other
(Madarsa + EGS)Not in school (Neverenrolled + drop out)
Total
Age : 7-16 ALL
Age : 7-10 ALL
Age : 7-10 BOYS
Age : 7-10 GIRLS
Age : 11-14 ALL
Age : 11-14 BOYS
Age : 11-14 GIRLS
Age : 15-16 ALL
Age : 15-16 BOYS
Age : 15-16 GIRLS
88.8 7.6 0.2 3.4 100
86.4 12.8 0.4 0.4 100
85.8 14.2 0.0 0.0 100
87.0 11.5 0.8 0.8 100
93.7 3.9 0.0 2.5 100
93.6 3.8 0.0 2.6 100
93.8 3.9 0.0 2.3 100
82.6 5.0 0.0 12.4 100
77.6 3.5 0.0 19.0 100
87.3 6.4 0.0 6.4 100
I
II
III
IV
V
VI
VII
VIII
Std.5 6 7 8 9 10 11 12 13 14 15 16 Total
% Children in each standard by age
AGE BY STANDARD FOR SCHOOL CHILDREN
32.5 50.0 15.0 0.0 0.0 2.5 100
2.7 10.8 59.5 18.9 5.4 2.7 0.0 100
0.0 2.9 14.3 54.3 17.1 2.9 5.7 2.9 100
0.0 2.5 12.5 37.5 32.5 5.0 0.0 10.0 100
0.0 0.0 4.2 56.3 29.2 6.3 0.0 4.2 100
5.6 2.8 2.8 25.0 33.3 16.7 2.8 11.1 100
0.0 0.0 4.3 51.1 12.8 25.5 4.3 2.1 100
0.0 4.2 8.3 25.0 37.5 25.0 0.0 100
76 ASER 2006
Young Children
IN BALWADI / ANGANWADI OR IN SCHOOL
% Children in pre-school or school
Age : 3 ALL
Age : 4 ALL
Age : 5 ALL
Age : 6 ALL
In
balw
ad
io
ran
gan
wad
i
In school
Govt. Pvt. Other
Not
goin
gan
yw
here
Total
78.2 3.9 18.0 100
92.5 1.9 5.7 100
41.4 34.5 19.0 1.7 3.5 100
2.0 80.0 12.0 4.0 2.0 100
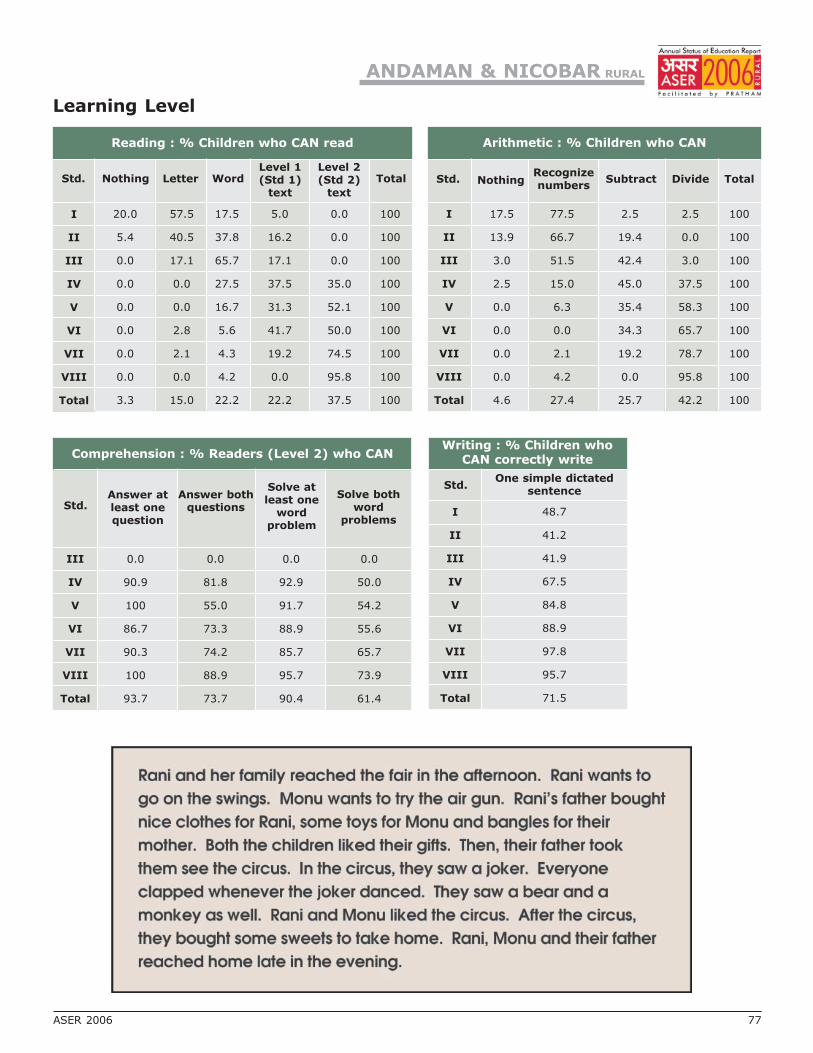
Learning Level
Reading : % Children who CAN read
I
II
III
IV
V
VI
VII
VIII
Total
Std. Nothing Letter WordLevel 1(Std 1)
text
Level 2(Std 2)
text
Total
20.0 57.5 17.5 5.0 0.0 100
5.4 40.5 37.8 16.2 0.0 100
0.0 17.1 65.7 17.1 0.0 100
0.0 0.0 27.5 37.5 35.0 100
0.0 0.0 16.7 31.3 52.1 100
0.0 2.8 5.6 41.7 50.0 100
0.0 2.1 4.3 19.2 74.5 100
0.0 0.0 4.2 0.0 95.8 100
3.3 15.0 22.2 22.2 37.5 100
Std.
Arithmetic : % Children who CAN
NothingRecognizenumbers
Subtract Divide Total
I
II
III
IV
V
VI
VII
VIII
Total
17.5 77.5 2.5 2.5 100
13.9 66.7 19.4 0.0 100
3.0 51.5 42.4 3.0 100
2.5 15.0 45.0 37.5 100
0.0 6.3 35.4 58.3 100
0.0 0.0 34.3 65.7 100
0.0 2.1 19.2 78.7 100
0.0 4.2 0.0 95.8 100
4.6 27.4 25.7 42.2 100
III
IV
V
VI
VII
VIII
Total
Comprehension : % Readers (Level 2) who CAN
Answer atleast onequestion
Answer bothquestions
Solve atleast one
wordproblem
Solve bothword
problems
Std.
0.0 0.0 0.0 0.0
90.9 81.8 92.9 50.0
100 55.0 91.7 54.2
86.7 73.3 88.9 55.6
90.3 74.2 85.7 65.7
100 88.9 95.7 73.9
93.7 73.7 90.4 61.4
ANDAMAN & NICOBAR RURAL
ASER 2006 77
Writing : % Children whoCAN correctly write
One simple dictatedsentence
I
II
III
IV
V
VI
VII
VIII
Total
Std.
48.7
41.2
41.9
67.5
84.8
88.9
97.8
95.7
71.5

Mothers
Mothers’ Education and Children Out of
School
Mothers’ Education and Children’s Learning
Age% Mothers in
each agecategory
Age : 17-25
Age : 26-30
Age : 31-35
Age : 36-45
Age : 46-55
Age : 17-55
% of ALL children 6-14 % of all BOYS 6-14 % of all GIRLS 6-14
Mothers’education
Noschooling
Schooling
Total
Mothers’education
Noschooling
Schooling
Total
Mothers’education
Noschooling
Schooling
Total
Inschool
Out ofschool
TotalIn
schoolOut ofschool
TotalIn
schoolOut ofschool
Total
Mothers’education
No schooling
Schooling
Total
Letters,words or
moreTotal
NOTrecognizenumbers
Recognizenumbers or do
moreTotal
Mothers’education
No schooling
Schooling
Total
Nothing
Mothers’ Education and Reading
Level
AgeMothers withno schooling
Mothers withschooling
Total
% Mothers whocannot read
Level 1 (Std 1) text
% Mothers whoCAN read
Level 1 (Std 1) textTotal
Age : 17-25
Age : 26-30
Age : 31-35
Age : 36-45
Age : 46-55
Age : 17-55
ANDAMAN & NICOBAR RURAL
25.1
37.3
19.4
15.6
2.5
100
98.8 1.2 100
98.3 1.7 100
98.5 1.5 100
98.9 1.1 100
98.6 1.4 100
98.7 1.3 100
98.8 1.2 100
98.0 2.0 100
98.2 1.8 100
14.3 85.7 100
4.7 95.4 100
7.0 93.0 100
17.1 82.9 100
8.9 91.1 100
10.9 89.1 100
14.4 85.6 100 27.7 72.3 100
24.0 76.0 100 31.2 68.8 100
28.7 71.3 100 36.7 63.3
100 34.2 65.9 100 50.7
49.3 100 61.5 38.5 100
66.7 33.3 100 25.0 75.0
100 35.1 64.9 100
Reading : % Children 6-8 year oldsin school who CAN read
Arithmetic : % Children 6-8 year oldsin school who CAN
78 ASER 2006
Mothers who havestudied upto :
% Readers amongthese mothers
No schooling
Std I
Std II
Std III
Std IV
Std V and above
TOTAL
0.0
25.0
44.4
76.5
63.2
88.2
63.8
Mothers’ Reading Level and
Class
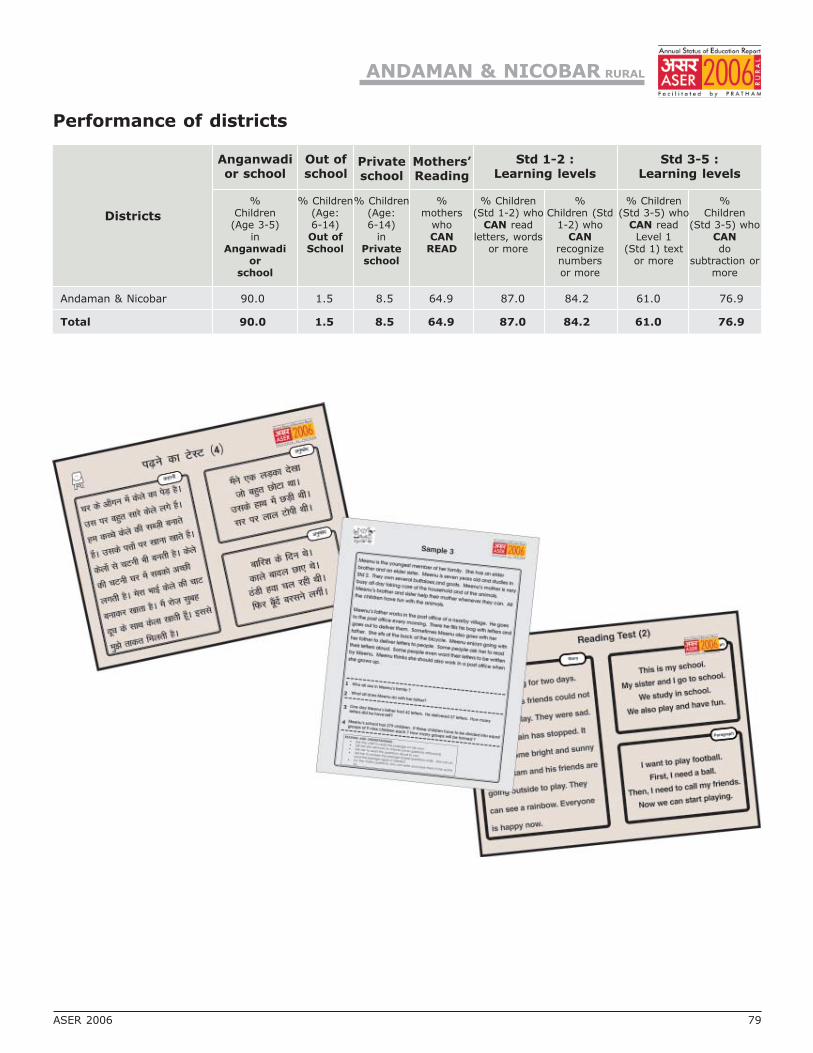
Districts
Anganwadior school
Out ofschool
Privateschool
Mothers’Reading
Std 1-2 :Learning levels
Std 3-5 :Learning levels
%Children
(Age 3-5)in
Anganwadior
school
% Children(Age:6-14)Out ofSchool
% Children(Age:6-14)
inPrivateschool
%mothers
whoCAN
READ
% Children(Std 1-2) who
CAN readletters, words
or more
% Children(Std 3-5) who
CAN readLevel 1
(Std 1) textor more
%Children (Std
1-2) whoCAN
recognizenumbersor more
%Children
(Std 3-5) whoCANdo
subtraction ormore
Performance of districts
Andaman & Nicobar 90.0 1.5 8.5 64.9 87.0 84.2 61.0 76.9
Total 90.0 1.5 8.5 64.9 87.0 84.2 61.0 76.9
ANDAMAN & NICOBAR RURAL
ASER 2006 79
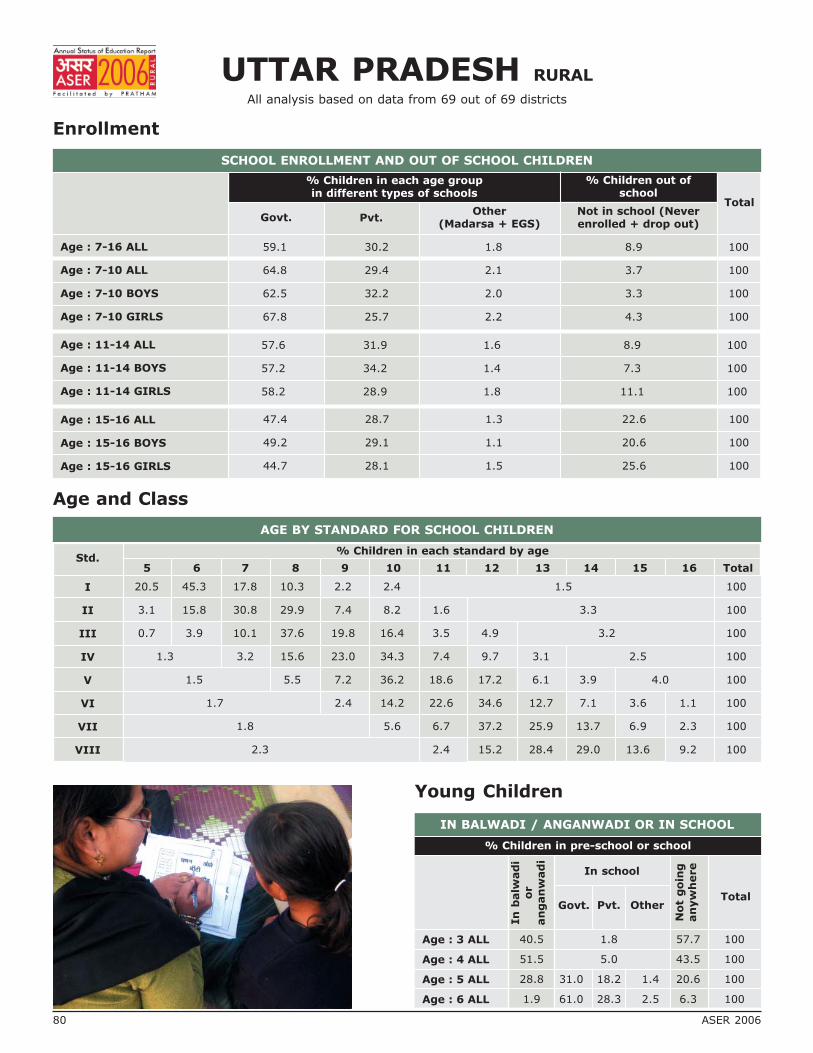
UTTAR PRADESH RURAL
All analysis based on data from 69 out of 69 districts
Enrollment
Age and Class
SCHOOL ENROLLMENT AND OUT OF SCHOOL CHILDREN
% Children in each age groupin different types of schools
% Children out ofschool
Govt. Pvt.Other
(Madarsa + EGS)Not in school (Neverenrolled + drop out)
Total
Age : 7-16 ALL
Age : 7-10 ALL
Age : 7-10 BOYS
Age : 7-10 GIRLS
Age : 11-14 ALL
Age : 11-14 BOYS
Age : 11-14 GIRLS
Age : 15-16 ALL
Age : 15-16 BOYS
Age : 15-16 GIRLS
59.1 30.2 1.8 8.9 100
64.8 29.4 2.1 3.7 100
62.5 32.2 2.0 3.3 100
67.8 25.7 2.2 4.3 100
57.6 31.9 1.6 8.9 100
57.2 34.2 1.4 7.3 100
58.2 28.9 1.8 11.1 100
Young Children
IN BALWADI / ANGANWADI OR IN SCHOOL
% Children in pre-school or school
Age : 3 ALL
Age : 4 ALL
Age : 5 ALL
Age : 6 ALL
In
balw
ad
io
ran
gan
wad
i
In school
Govt. Pvt. Other
Not
goin
gan
yw
here
Total
40.5 1.8 57.7 100
51.5 5.0 43.5 100
28.8 31.0 18.2 1.4 20.6 100
1.9 61.0 28.3 2.5 6.3 100
47.4 28.7 1.3 22.6 100
49.2 29.1 1.1 20.6 100
44.7 28.1 1.5 25.6 100
I
II
III
IV
V
VI
VII
VIII
Std.5 6 7 8 9 10 11 12 13 14 15 16 Total
% Children in each standard by age
AGE BY STANDARD FOR SCHOOL CHILDREN
20.5 45.3 17.8 10.3 2.2 2.4 1.5 100
3.1 15.8 30.8 29.9 7.4 8.2 1.6 3.3 100
0.7 3.9 10.1 37.6 19.8 16.4 3.5 4.9 3.2 100
1.3 3.2 15.6 23.0 34.3 7.4 9.7 3.1 2.5 100
1.5 5.5 7.2 36.2 18.6 17.2 6.1 3.9 4.0 100
1.7 2.4 14.2 22.6 34.6 12.7 7.1 3.6 1.1 100
1.8 5.6 6.7 37.2 25.9 13.7 6.9 2.3 100
2.3 2.4 15.2 28.4 29.0 13.6 9.2 100
80 ASER 2006

Learning Level
Reading : % Children who CAN read
I
II
III
IV
V
VI
VII
VIII
Total
Std. Nothing Letter WordLevel 1(Std 1)
text
Level 2(Std 2)
text
Total
55.7 33.0 8.0 2.4 1.0 100
24.3 38.0 24.3 9.4 4.0 100
11.7 26.4 30.8 19.6 11.5 100
5.7 16.2 23.4 31.8 23.0 100
3.8 9.8 15.8 33.4 37.2 100
1.7 4.1 7.7 27.7 58.7 100
0.8 2.6 4.7 20.4 71.4 100
0.8 1.6 2.3 13.8 81.6 100
17.0 19.6 15.8 18.6 29.0 100
Std.
Arithmetic : % Children who CAN
NothingRecognizenumbers
Subtract Divide Total
I
II
III
IV
V
VI
VII
VIII
Total
70.3 26.7 2.3 0.7 100
39.9 48.2 9.3 2.6 100
23.5 47.9 20.9 7.7 100
14.0 36.2 33.1 16.7 100
9.2 25.9 36.4 28.5 100
5.0 14.5 32.5 48.1 100
3.2 10.3 27.0 59.4 100
2.1 6.5 20.3 71.1 100
26.1 29.7 20.9 23.3 100
III
IV
V
VI
VII
VIII
Total
Comprehension : % Readers (Level 2) who CAN
Answer atleast onequestion
Answer bothquestions
Solve atleast one
wordproblem
Solve bothword
problems
Std.
82.6 74.2 64.7 53.2
86.5 78.7 68.9 56.0
91.4 85.5 76.5 64.2
94.0 89.4 81.7 69.3
95.0 90.9 85.6 74.1
96.5 92.6 88.4 78.4
93.0 87.9 81.1 69.4
UTTAR PRADESH RURAL
ASER 2006 81
Writing : % Children whoCAN correctly write
One simple dictatedsentence
I
II
III
IV
V
VI
VII
VIII
Total
Std.
8.6
21.7
39.8
59.6
72.2
85.2
90.5
94.3
51.6

Mothers
Mothers’ Education and Children Out of School
Mothers’ Education and Children’s Learning
Age% Mothers in
each agecategory
Age : 17-25
Age : 26-30
Age : 31-35
Age : 36-45
Age : 46-55
Age : 17-55
% of ALL children 6-14 % of all BOYS 6-14 % of all GIRLS 6-14
Mothers’education
Noschooling
Schooling
Total
Mothers’education
Noschooling
Schooling
Total
Mothers’education
Noschooling
Schooling
Total
Inschool
Out ofschool
TotalIn
schoolOut ofschool
TotalIn
schoolOut ofschool
Total
Mothers’education
No schooling
Schooling
Total
Letters,words or
moreTotal
NOTrecognizenumbers
Recognizenumbers or do
moreTotal
Mothers’education
No schooling
Schooling
Total
Nothing
Mothers’ Education and Reading Level
AgeMothers withno schooling
Mothers withschooling
Total
% Mothers whocannot read
Level 1 (Std 1) text
% Mothers whoCAN read
Level 1 (Std 1) textTotal
Age : 17-25
Age : 26-30
Age : 31-35
Age : 36-45
Age : 46-55
Age : 17-55
UTTAR PRADESH RURAL
13.3
26.1
23.1
29.7
7.7
100
92.5 7.5 100
97.7 2.3 100
94.1 5.9 100
93.6 6.5 100
98.0 2.0 100
94.9 5.1 100
91.2 8.8 100
97.4 2.6 100
93.0 7.0 100
35.6 64.4 100
24.7 75.3 100
32.0 68.0 100
49.7 50.3 100
38.4 61.6 100
46.0 54.0 100
48.6 51.4 100 51.6 48.4 100
56.6 43.4 100 58.8 41.2 100
67.6 32.4 100 69.6 30.4 100
75.6 24.4 100 77.3 22.7 100
83.4 16.6 100 85.2 14.8 100
65.8 34.2 100 67.9 32.1 100
Reading : % Children 6-8 year oldsin school who CAN read
Arithmetic : % Children 6-8 year oldsin school who CAN
Mothers’ Reading Level and Class
82 ASER 2006
Mothers who havestudied upto :
% Readers amongthese mothers
No schooling
Std I
Std II
Std III
Std IV
Std V and above
TOTAL
1.1
68.7
60.9
69.9
84.4
95.7
31.3
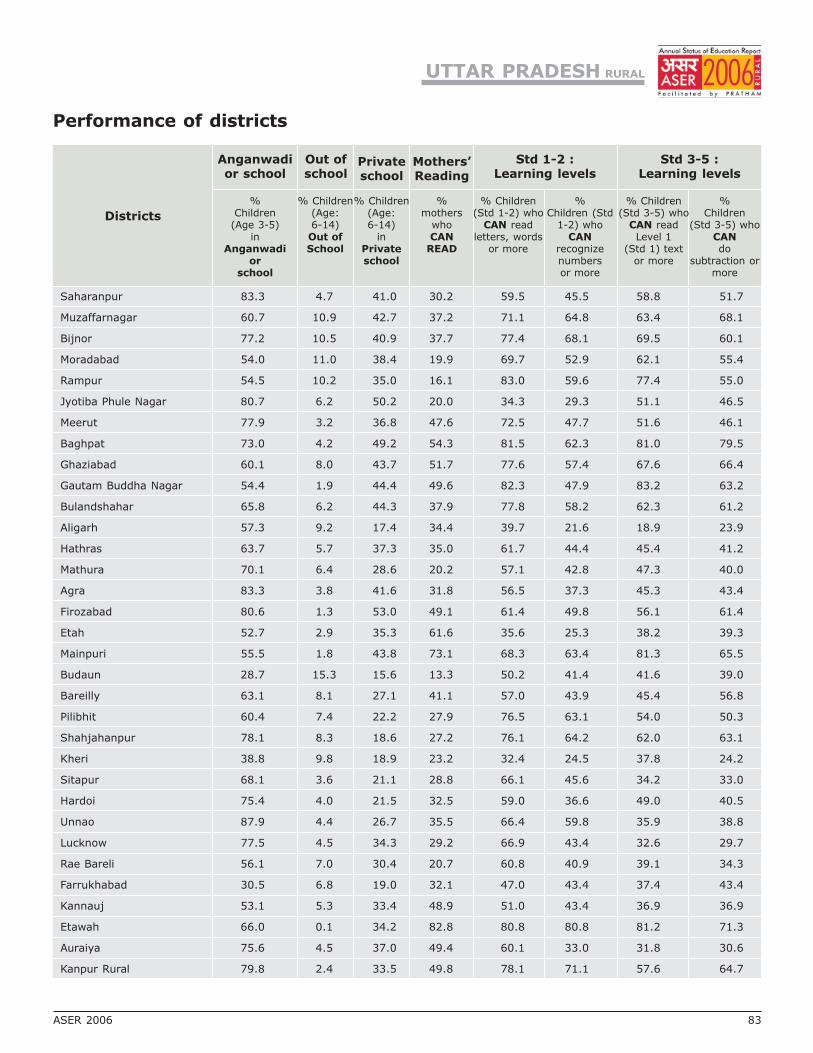
Districts
Anganwadior school
Out ofschool
Privateschool
Mothers’Reading
Std 1-2 :Learning levels
Std 3-5 :Learning levels
%Children
(Age 3-5)in
Anganwadior
school
% Children(Age:6-14)Out ofSchool
% Children(Age:6-14)
inPrivateschool
%mothers
whoCAN
READ
% Children(Std 1-2) who
CAN readletters, words
or more
% Children(Std 3-5) who
CAN readLevel 1
(Std 1) textor more
%Children (Std
1-2) whoCAN
recognizenumbersor more
%Children
(Std 3-5) whoCANdo
subtraction ormore
Performance of districts
Saharanpur 83.3 4.7 41.0 30.2 59.5 45.5 58.8 51.7
Muzaffarnagar 60.7 10.9 42.7 37.2 71.1 64.8 63.4 68.1
Bijnor 77.2 10.5 40.9 37.7 77.4 68.1 69.5 60.1
Moradabad 54.0 11.0 38.4 19.9 69.7 52.9 62.1 55.4
Rampur 54.5 10.2 35.0 16.1 83.0 59.6 77.4 55.0
Jyotiba Phule Nagar 80.7 6.2 50.2 20.0 34.3 29.3 51.1 46.5
Meerut 77.9 3.2 36.8 47.6 72.5 47.7 51.6 46.1
Baghpat 73.0 4.2 49.2 54.3 81.5 62.3 81.0 79.5
Ghaziabad 60.1 8.0 43.7 51.7 77.6 57.4 67.6 66.4
Gautam Buddha Nagar 54.4 1.9 44.4 49.6 82.3 47.9 83.2 63.2
Bulandshahar 65.8 6.2 44.3 37.9 77.8 58.2 62.3 61.2
Aligarh 57.3 9.2 17.4 34.4 39.7 21.6 18.9 23.9
Hathras 63.7 5.7 37.3 35.0 61.7 44.4 45.4 41.2
Mathura 70.1 6.4 28.6 20.2 57.1 42.8 47.3 40.0
Agra 83.3 3.8 41.6 31.8 56.5 37.3 45.3 43.4
Firozabad 80.6 1.3 53.0 49.1 61.4 49.8 56.1 61.4
Etah 52.7 2.9 35.3 61.6 35.6 25.3 38.2 39.3
Mainpuri 55.5 1.8 43.8 73.1 68.3 63.4 81.3 65.5
Budaun 28.7 15.3 15.6 13.3 50.2 41.4 41.6 39.0
Bareilly 63.1 8.1 27.1 41.1 57.0 43.9 45.4 56.8
Pilibhit 60.4 7.4 22.2 27.9 76.5 63.1 54.0 50.3
Shahjahanpur 78.1 8.3 18.6 27.2 76.1 64.2 62.0 63.1
Kheri 38.8 9.8 18.9 23.2 32.4 24.5 37.8 24.2
Sitapur 68.1 3.6 21.1 28.8 66.1 45.6 34.2 33.0
Hardoi 75.4 4.0 21.5 32.5 59.0 36.6 49.0 40.5
Unnao 87.9 4.4 26.7 35.5 66.4 59.8 35.9 38.8
Lucknow 77.5 4.5 34.3 29.2 66.9 43.4 32.6 29.7
Rae Bareli 56.1 7.0 30.4 20.7 60.8 40.9 39.1 34.3
Farrukhabad 30.5 6.8 19.0 32.1 47.0 43.4 37.4 43.4
Kannauj 53.1 5.3 33.4 48.9 51.0 43.4 36.9 36.9
Etawah 66.0 0.1 34.2 82.8 80.8 80.8 81.2 71.3
Auraiya 75.6 4.5 37.0 49.4 60.1 33.0 31.8 30.6
Kanpur Rural 79.8 2.4 33.5 49.8 78.1 71.1 57.6 64.7
UTTAR PRADESH RURAL
ASER 2006 83

Districts
Anganwadior school
Out ofschool
Privateschool
Mothers’Reading
Std 1-2 :Learning levels
Std 3-5 :Learning levels
%Children
(Age 3-5)in
Anganwadior
school
% Children(Age:6-14)Out ofSchool
% Children(Age:6-14)
inPrivateschool
%mothers
whoCAN
READ
% Children(Std 1-2) who
CAN readletters, words
or more
% Children(Std 3-5) who
CAN readLevel 1
(Std 1) textor more
%Children (Std
1-2) whoCAN
recognizenumbersor more
%Children
(Std 3-5) whoCANdo
subtraction ormore
Jalaun 54.9 1.2 33.0 39.6 75.6 50.5 57.8 48.2
Jhansi 41.6 4.9 22.1 40.0 60.0 48.7 47.4 48.9
Lalitpur 54.8 3.5 12.3 31.2 54.0 43.7 43.8 40.6
Hamirpur 83.8 5.2 29.2 37.7 67.0 51.0 50.6 53.5
Mahoba 64.6 6.3 18.0 31.2 72.9 51.1 56.3 51.4
Banda 47.2 8.0 11.6 23.5 61.2 35.1 54.0 44.0
Chitrakoot 64.6 8.7 18.1 29.6 69.9 50.9 50.3 47.3
Fatehpur 70.3 5.2 27.2 42.4 78.5 50.4 62.7 64.1
Pratapgarh 65.5 2.6 34.4 33.9 58.2 51.1 53.5 52.9
Kaushambi 58.1 4.1 26.8 29.1 69.0 44.4 57.9 57.9
Allahabad 47.3 5.2 23.4 21.9 38.9 35.3 59.4 57.6
Bara Banki 47.9 12.5 29.7 31.8 54.5 39.3 40.7 38.6
Faizabad 68.6 2.5 35.6 41.8 68.9 54.1 54.2 58.0
Ambedkar Nagar 54.7 2.4 22.4 28.9 43.6 29.4 45.8 33.4
Sultanpur 75.7 3.6 25.8 33.5 61.4 52.7 52.1 50.5
Bahraich 43.2 16.5 19.1 19.0 53.8 36.4 44.4 34.0
Shrawasti 55.6 1.0 6.9 11.1 21.9 11.3 23.6 16.1
Balrampur 29.0 11.8 15.6 18.3 50.7 43.5 31.8 33.4
Gonda 37.3 7.2 24.9 32.6 66.0 47.4 59.8 47.7
Siddharth Nagar 65.1 8.3 15.8 21.7 57.0 46.1 47.9 47.2
Basti 59.6 5.1 29.7 21.0 54.0 44.5 57.1 51.1
Sant Kabir Nagar 51.7 6.9 32.5 33.7 58.5 51.0 55.3 50.0
Mahrajganj 55.6 6.4 25.4 13.9 45.2 29.7 51.0 41.4
Gorakhpur 51.9 4.5 36.1 21.2 51.1 35.9 48.0 40.3
Kushinagar 60.1 5.5 27.8 24.3 50.8 27.3 48.0 35.6
Deoria 71.4 3.3 49.5 28.9 46.9 31.2 49.4 43.8
Azamgarh 52.5 2.8 37.3 30.6 37.6 30.0 50.6 46.3
Mau 64.5 2.8 47.5 33.3 68.0 48.6 66.2 51.3
Ballia 52.0 2.2 39.1 37.8 69.7 49.3 71.7 64.9
Jaunpur 64.4 2.0 26.6 31.7 55.5 43.0 56.2 49.8
Ghazipur 70.9 2.7 52.7 39.4 65.1 50.9 61.9 57.4
Chandauli 58.8 4.0 37.7 35.8 69.3 34.8 54.3 43.7
Varanasi 58.5 3.7 31.3 34.0 62.6 37.3 62.4 44.1
Sant Ravidas Nagar 50.0 4.3 31.8 20.0 58.0 46.1 50.2 45.3
Mirzapur 43.6 6.7 20.3 22.6 68.0 43.2 50.8 44.7
Sonbhadra 27.9 14.3 16.0 18.5 53.8 32.9 50.3 40.0
Total 59.6 6.0 30.3 32.1 58.5 43.4 51.4 47.1
84 ASER 2006
Gujarat
Daman and Diu
Dadra and Nagar Haveli
Madhya Pradesh
Chhattisgarh
Orissa
ASER 2006 85
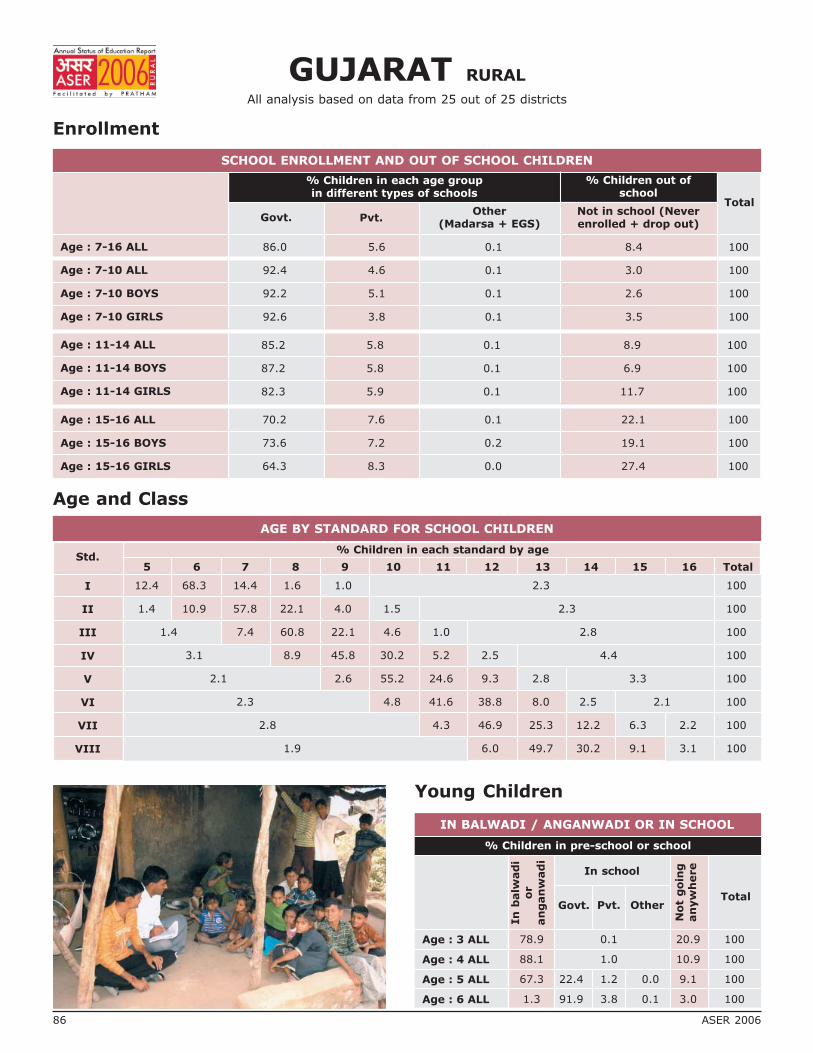
GUJARAT RURAL
All analysis based on data from 25 out of 25 districts
Enrollment
Age and Class
SCHOOL ENROLLMENT AND OUT OF SCHOOL CHILDREN
% Children in each age groupin different types of schools
% Children out ofschool
Govt. Pvt.Other
(Madarsa + EGS)Not in school (Neverenrolled + drop out)
Total
Age : 7-16 ALL
Age : 7-10 ALL
Age : 7-10 BOYS
Age : 7-10 GIRLS
Age : 11-14 ALL
Age : 11-14 BOYS
Age : 11-14 GIRLS
Age : 15-16 ALL
Age : 15-16 BOYS
Age : 15-16 GIRLS
86.0 5.6 0.1 8.4 100
92.4 4.6 0.1 3.0 100
92.2 5.1 0.1 2.6 100
92.6 3.8 0.1 3.5 100
85.2 5.8 0.1 8.9 100
87.2 5.8 0.1 6.9 100
82.3 5.9 0.1 11.7 100
70.2 7.6 0.1 22.1 100
73.6 7.2 0.2 19.1 100
64.3 8.3 0.0 27.4 100
Young Children
IN BALWADI / ANGANWADI OR IN SCHOOL
% Children in pre-school or school
Age : 3 ALL
Age : 4 ALL
Age : 5 ALL
Age : 6 ALL
In
balw
ad
io
ran
gan
wad
i
In school
Govt. Pvt. Other
Not
goin
gan
yw
here
Total
78.9 0.1 20.9 100
88.1 1.0 10.9 100
67.3 22.4 1.2 0.0 9.1 100
1.3 91.9 3.8 0.1 3.0 100
I
II
III
IV
V
VI
VII
VIII
Std.5 6 7 8 9 10 11 12 13 14 15 16 Total
% Children in each standard by age
AGE BY STANDARD FOR SCHOOL CHILDREN
12.4 68.3 14.4 1.6 1.0 2.3 100
1.4 10.9 57.8 22.1 4.0 1.5 2.3 100
1.4 7.4 60.8 22.1 4.6 1.0 2.8 100
3.1 8.9 45.8 30.2 5.2 2.5 4.4 100
2.1 2.6 55.2 24.6 9.3 2.8 3.3 100
2.3 4.8 41.6 38.8 8.0 2.5 2.1 100
2.8 4.3 46.9 25.3 12.2 6.3 2.2 100
1.9 6.0 49.7 30.2 9.1 3.1 100
86 ASER 2006
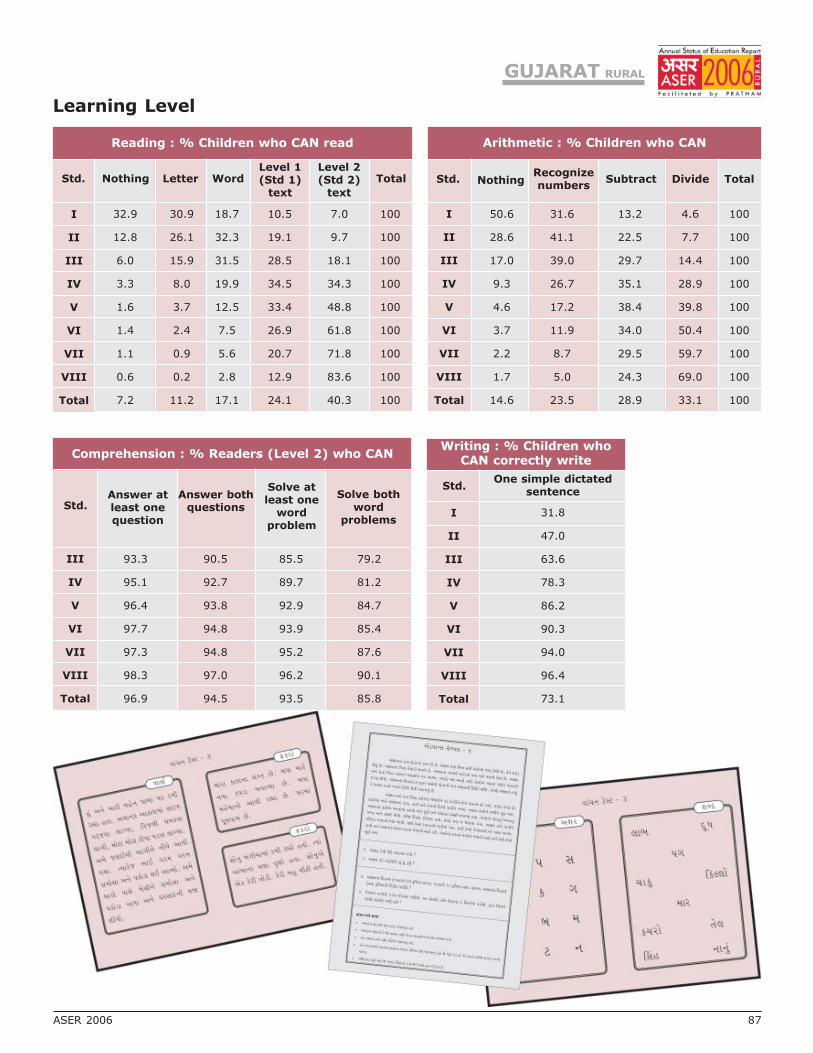
Learning Level
Reading : % Children who CAN read
I
II
III
IV
V
VI
VII
VIII
Total
Std. Nothing Letter WordLevel 1(Std 1)
text
Level 2(Std 2)
text
Total
32.9 30.9 18.7 10.5 7.0 100
12.8 26.1 32.3 19.1 9.7 100
6.0 15.9 31.5 28.5 18.1 100
3.3 8.0 19.9 34.5 34.3 100
1.6 3.7 12.5 33.4 48.8 100
1.4 2.4 7.5 26.9 61.8 100
1.1 0.9 5.6 20.7 71.8 100
0.6 0.2 2.8 12.9 83.6 100
7.2 11.2 17.1 24.1 40.3 100
Std.
Arithmetic : % Children who CAN
NothingRecognizenumbers
Subtract Divide Total
I
II
III
IV
V
VI
VII
VIII
Total
50.6 31.6 13.2 4.6 100
28.6 41.1 22.5 7.7 100
17.0 39.0 29.7 14.4 100
9.3 26.7 35.1 28.9 100
4.6 17.2 38.4 39.8 100
3.7 11.9 34.0 50.4 100
2.2 8.7 29.5 59.7 100
1.7 5.0 24.3 69.0 100
14.6 23.5 28.9 33.1 100
Writing : % Children whoCAN correctly write
One simple dictatedsentence
I
II
III
IV
V
VI
VII
VIII
Total
Std.
III
IV
V
VI
VII
VIII
Total
Comprehension : % Readers (Level 2) who CAN
Answer atleast onequestion
Answer bothquestions
Solve atleast one
wordproblem
Solve bothword
problems
Std.
93.3 90.5 85.5 79.2
95.1 92.7 89.7 81.2
96.4 93.8 92.9 84.7
97.7 94.8 93.9 85.4
97.3 94.8 95.2 87.6
98.3 97.0 96.2 90.1
96.9 94.5 93.5 85.8
31.8
47.0
63.6
78.3
86.2
90.3
94.0
96.4
73.1
GUJARAT RURAL
ASER 2006 87
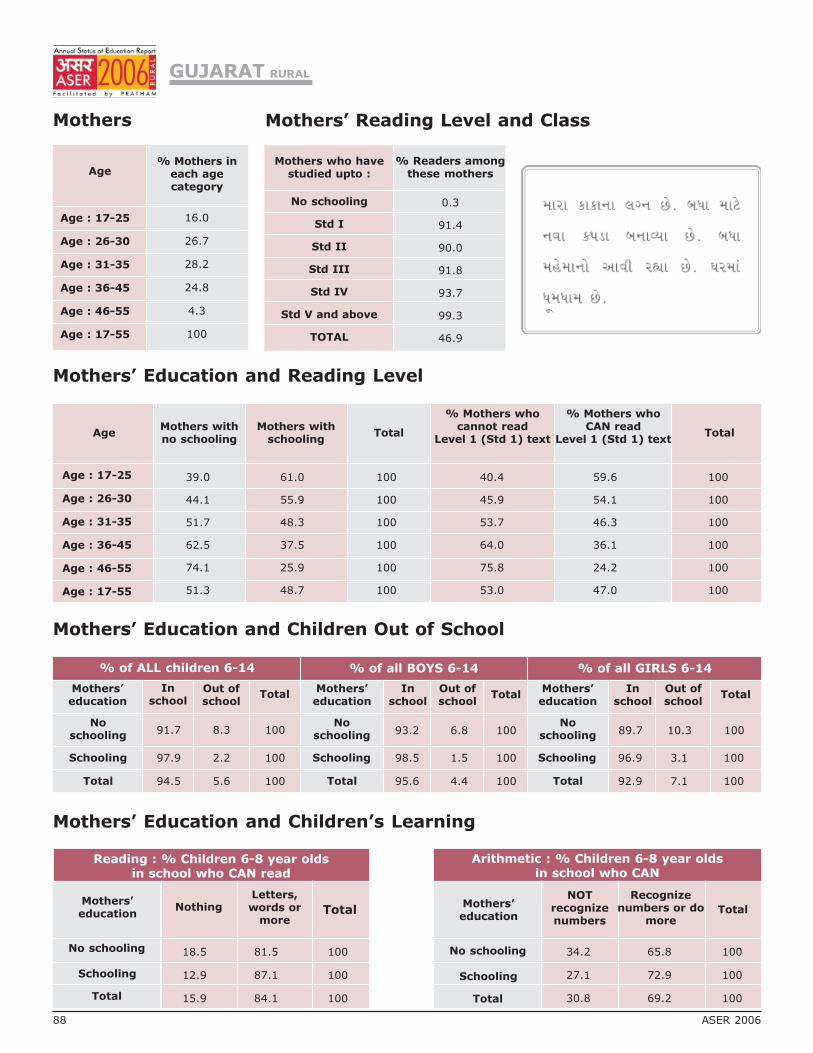
Mothers
Mothers’ Education and Children Out of School
Mothers’ Education and Children’s Learning
Age% Mothers in
each agecategory
Age : 17-25
Age : 26-30
Age : 31-35
Age : 36-45
Age : 46-55
Age : 17-55
% of ALL children 6-14 % of all BOYS 6-14 % of all GIRLS 6-14
Mothers’education
Noschooling
Schooling
Total
Mothers’education
Noschooling
Schooling
Total
Mothers’education
Noschooling
Schooling
Total
Inschool
Out ofschool
TotalIn
schoolOut ofschool
TotalIn
schoolOut ofschool
Total
Mothers’education
No schooling
Schooling
Total
Letters,words or
moreTotal
NOTrecognizenumbers
Recognizenumbers or do
moreTotal
Mothers’education
No schooling
Schooling
Total
Nothing
Mothers’ Education and Reading Level
AgeMothers withno schooling
Mothers withschooling
Total
% Mothers whocannot read
Level 1 (Std 1) text
% Mothers whoCAN read
Level 1 (Std 1) textTotal
Age : 17-25
Age : 26-30
Age : 31-35
Age : 36-45
Age : 46-55
Age : 17-55
GUJARAT RURAL
16.0
26.7
28.2
24.8
4.3
100
91.7 8.3 100
97.9 2.2 100
94.5 5.6 100
93.2 6.8 100
98.5 1.5 100
95.6 4.4 100
89.7 10.3 100
96.9 3.1 100
92.9 7.1 100
18.5 81.5 100
12.9 87.1 100
15.9 84.1 100
34.2 65.8 100
27.1 72.9 100
30.8 69.2 100
39.0 61.0 100 40.4 59.6 100
44.1 55.9 100 45.9 54.1 100
51.7 48.3 100 53.7 46.3 100
62.5 37.5 100 64.0 36.1 100
74.1 25.9 100 75.8 24.2 100
51.3 48.7 100 53.0 47.0 100
Reading : % Children 6-8 year oldsin school who CAN read
Arithmetic : % Children 6-8 year oldsin school who CAN
88 ASER 2006
Mothers who havestudied upto :
% Readers amongthese mothers
No schooling
Std I
Std II
Std III
Std IV
Std V and above
TOTAL
0.3
91.4
90.0
91.8
93.7
99.3
46.9
Mothers’ Reading Level and Class
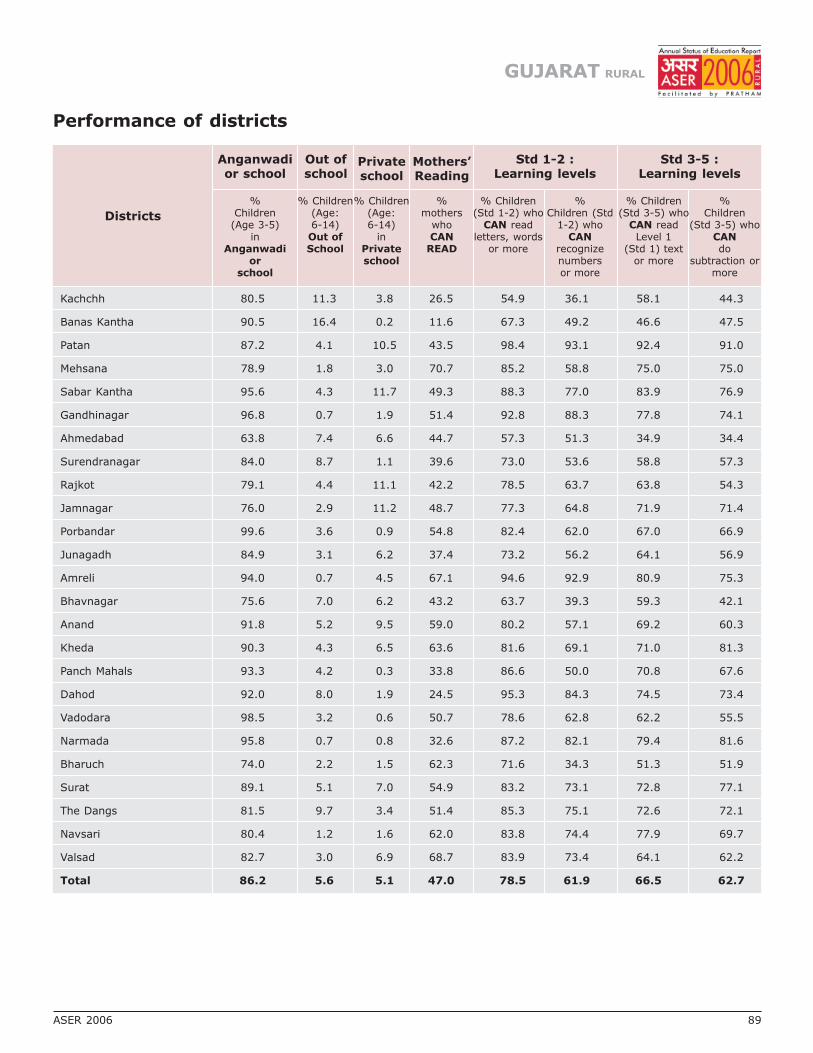
Districts
Anganwadior school
Out ofschool
Privateschool
Mothers’Reading
Std 1-2 :Learning levels
Std 3-5 :Learning levels
%Children
(Age 3-5)in
Anganwadior
school
% Children(Age:6-14)Out ofSchool
% Children(Age:6-14)
inPrivateschool
%mothers
whoCAN
READ
% Children(Std 1-2) who
CAN readletters, words
or more
% Children(Std 3-5) who
CAN readLevel 1
(Std 1) textor more
%Children (Std
1-2) whoCAN
recognizenumbersor more
%Children
(Std 3-5) whoCANdo
subtraction ormore
Performance of districts
Kachchh 80.5 11.3 3.8 26.5 54.9 36.1 58.1 44.3
Banas Kantha 90.5 16.4 0.2 11.6 67.3 49.2 46.6 47.5
Patan 87.2 4.1 10.5 43.5 98.4 93.1 92.4 91.0
Mehsana 78.9 1.8 3.0 70.7 85.2 58.8 75.0 75.0
Sabar Kantha 95.6 4.3 11.7 49.3 88.3 77.0 83.9 76.9
Gandhinagar 96.8 0.7 1.9 51.4 92.8 88.3 77.8 74.1
Ahmedabad 63.8 7.4 6.6 44.7 57.3 51.3 34.9 34.4
Surendranagar 84.0 8.7 1.1 39.6 73.0 53.6 58.8 57.3
Rajkot 79.1 4.4 11.1 42.2 78.5 63.7 63.8 54.3
Jamnagar 76.0 2.9 11.2 48.7 77.3 64.8 71.9 71.4
Porbandar 99.6 3.6 0.9 54.8 82.4 62.0 67.0 66.9
Junagadh 84.9 3.1 6.2 37.4 73.2 56.2 64.1 56.9
Amreli 94.0 0.7 4.5 67.1 94.6 92.9 80.9 75.3
Bhavnagar 75.6 7.0 6.2 43.2 63.7 39.3 59.3 42.1
Anand 91.8 5.2 9.5 59.0 80.2 57.1 69.2 60.3
Kheda 90.3 4.3 6.5 63.6 81.6 69.1 71.0 81.3
Panch Mahals 93.3 4.2 0.3 33.8 86.6 50.0 70.8 67.6
Dahod 92.0 8.0 1.9 24.5 95.3 84.3 74.5 73.4
Vadodara 98.5 3.2 0.6 50.7 78.6 62.8 62.2 55.5
Narmada 95.8 0.7 0.8 32.6 87.2 82.1 79.4 81.6
Bharuch 74.0 2.2 1.5 62.3 71.6 34.3 51.3 51.9
Surat 89.1 5.1 7.0 54.9 83.2 73.1 72.8 77.1
The Dangs 81.5 9.7 3.4 51.4 85.3 75.1 72.6 72.1
Navsari 80.4 1.2 1.6 62.0 83.8 74.4 77.9 69.7
Valsad 82.7 3.0 6.9 68.7 83.9 73.4 64.1 62.2
Total 86.2 5.6 5.1 47.0 78.5 61.9 66.5 62.7
GUJARAT RURAL
ASER 2006 89
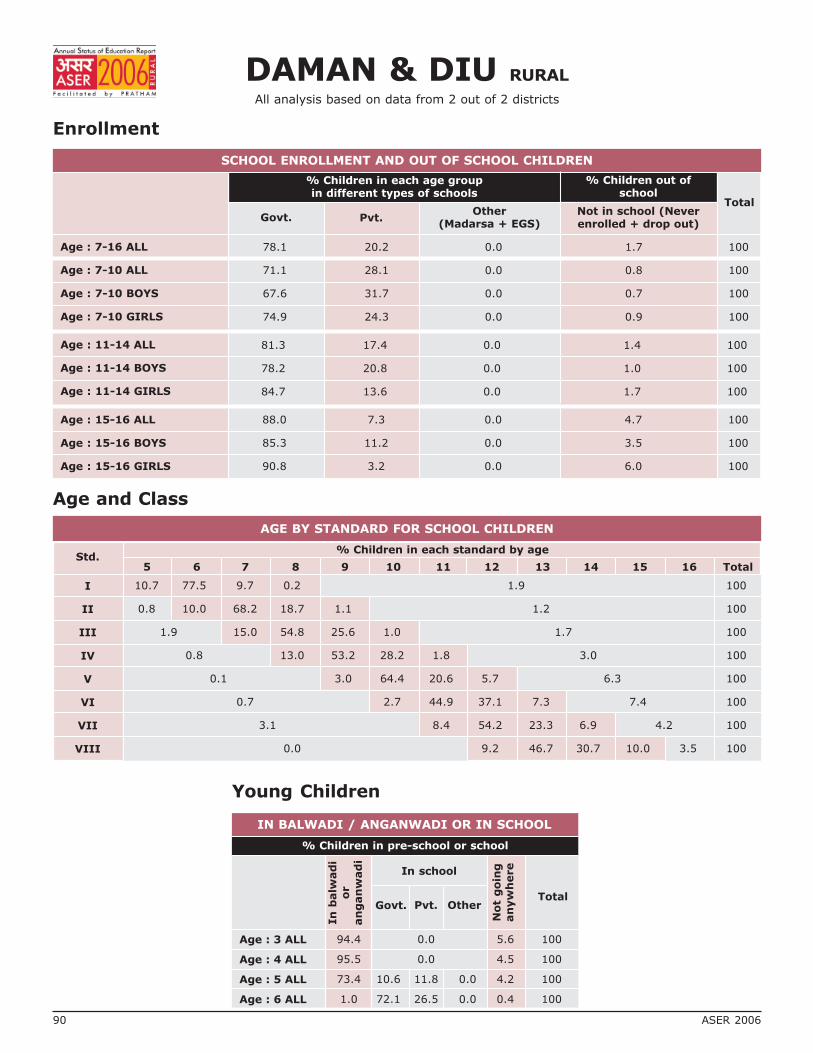
DAMAN & DIU RURAL
All analysis based on data from 2 out of 2 districts
Enrollment
Age and Class
SCHOOL ENROLLMENT AND OUT OF SCHOOL CHILDREN
% Children in each age groupin different types of schools
% Children out ofschool
Govt. Pvt.Other
(Madarsa + EGS)Not in school (Neverenrolled + drop out)
Total
Age : 7-16 ALL
Age : 7-10 ALL
Age : 7-10 BOYS
Age : 7-10 GIRLS
Age : 11-14 ALL
Age : 11-14 BOYS
Age : 11-14 GIRLS
Age : 15-16 ALL
Age : 15-16 BOYS
Age : 15-16 GIRLS
78.1 20.2 0.0 1.7 100
71.1 28.1 0.0 0.8 100
67.6 31.7 0.0 0.7 100
74.9 24.3 0.0 0.9 100
81.3 17.4 0.0 1.4 100
78.2 20.8 0.0 1.0 100
84.7 13.6 0.0 1.7 100
88.0 7.3 0.0 4.7 100
85.3 11.2 0.0 3.5 100
90.8 3.2 0.0 6.0 100
I
II
III
IV
V
VI
VII
VIII
Std.5 6 7 8 9 10 11 12 13 14 15 16 Total
% Children in each standard by age
AGE BY STANDARD FOR SCHOOL CHILDREN
10.7 77.5 9.7 0.2 1.9 100
0.8 10.0 68.2 18.7 1.1 1.2 100
1.9 15.0 54.8 25.6 1.0 1.7 100
0.8 13.0 53.2 28.2 1.8 3.0 100
0.1 3.0 64.4 20.6 5.7 6.3 100
0.7 2.7 44.9 37.1 7.3 7.4 100
3.1 8.4 54.2 23.3 6.9 4.2 100
0.0 9.2 46.7 30.7 10.0 3.5 100
90 ASER 2006
Young Children
IN BALWADI / ANGANWADI OR IN SCHOOL
% Children in pre-school or school
Age : 3 ALL
Age : 4 ALL
Age : 5 ALL
Age : 6 ALL
In
balw
ad
io
ran
gan
wad
i
In school
Govt. Pvt. Other
Not
goin
gan
yw
here
Total
94.4 0.0 5.6 100
95.5 0.0 4.5 100
73.4 10.6 11.8 0.0 4.2 100
1.0 72.1 26.5 0.0 0.4 100
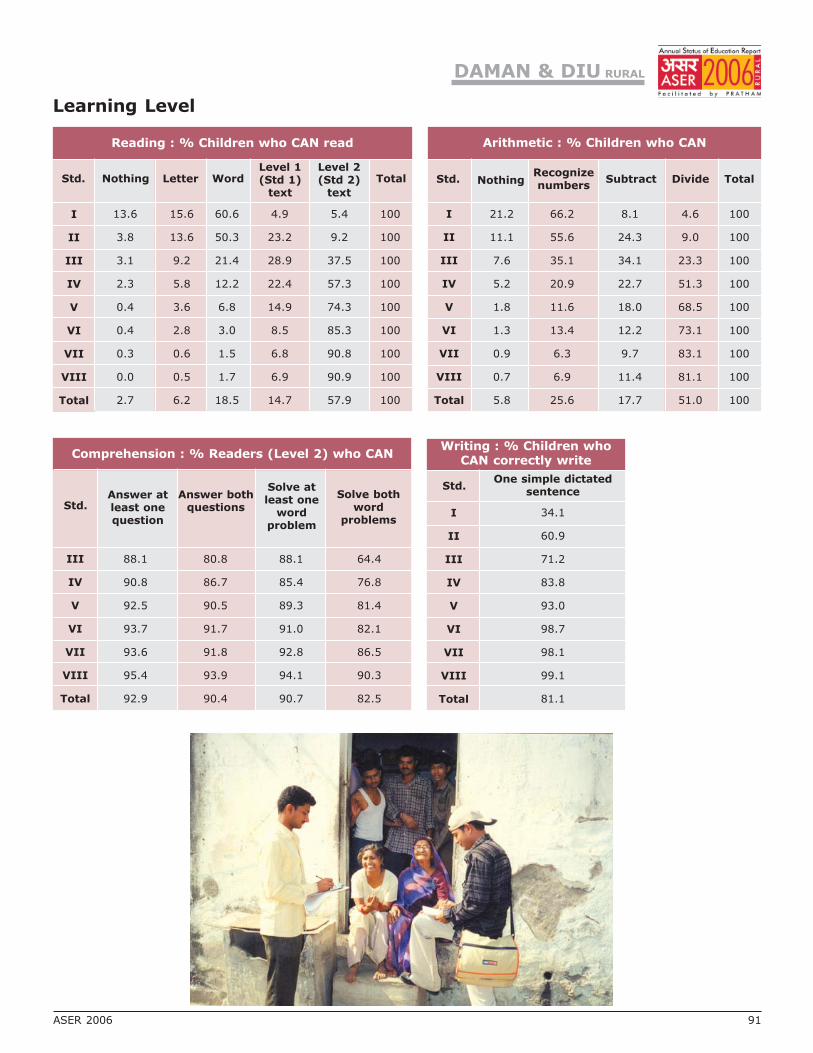
Learning Level
Reading : % Children who CAN read
I
II
III
IV
V
VI
VII
VIII
Total
Std. Nothing Letter WordLevel 1(Std 1)
text
Level 2(Std 2)
text
Total
13.6 15.6 60.6 4.9 5.4 100
3.8 13.6 50.3 23.2 9.2 100
3.1 9.2 21.4 28.9 37.5 100
2.3 5.8 12.2 22.4 57.3 100
0.4 3.6 6.8 14.9 74.3 100
0.4 2.8 3.0 8.5 85.3 100
0.3 0.6 1.5 6.8 90.8 100
0.0 0.5 1.7 6.9 90.9 100
2.7 6.2 18.5 14.7 57.9 100
Std.
Arithmetic : % Children who CAN
NothingRecognizenumbers
Subtract Divide Total
I
II
III
IV
V
VI
VII
VIII
Total
21.2 66.2 8.1 4.6 100
11.1 55.6 24.3 9.0 100
7.6 35.1 34.1 23.3 100
5.2 20.9 22.7 51.3 100
1.8 11.6 18.0 68.5 100
1.3 13.4 12.2 73.1 100
0.9 6.3 9.7 83.1 100
0.7 6.9 11.4 81.1 100
5.8 25.6 17.7 51.0 100
Writing : % Children whoCAN correctly write
One simple dictatedsentence
I
II
III
IV
V
VI
VII
VIII
Total
Std.
III
IV
V
VI
VII
VIII
Total
Comprehension : % Readers (Level 2) who CAN
Answer atleast onequestion
Answer bothquestions
Solve atleast one
wordproblem
Solve bothword
problems
Std.
88.1 80.8 88.1 64.4
90.8 86.7 85.4 76.8
92.5 90.5 89.3 81.4
93.7 91.7 91.0 82.1
93.6 91.8 92.8 86.5
95.4 93.9 94.1 90.3
92.9 90.4 90.7 82.5
34.1
60.9
71.2
83.8
93.0
98.7
98.1
99.1
81.1
DAMAN & DIU RURAL
ASER 2006 91

Mothers
Mothers’ Education and Children Out of School
Mothers’ Education and Children’s Learning
Age% Mothers in
each agecategory
Age : 17-25
Age : 26-30
Age : 31-35
Age : 36-45
Age : 46-55
Age : 17-55
% of ALL children 6-14 % of all BOYS 6-14 % of all GIRLS 6-14
Mothers’education
Schooling
Total
Mothers’education
Schooling
Total
Mothers’education
Schooling
Total
Inschool
Out ofschool
TotalIn
schoolOut ofschool
TotalIn
schoolOut ofschool
Total
Mothers’education
Schooling
Total
Letters,words or
moreTotal
NOTrecognizenumbers
Recognizenumbers or do
moreTotal
Mothers’education
Schooling
Total
Nothing
Mothers’ Education and Reading Level
AgeMothers withno schooling
Mothers withschooling
Total
% Mothers whocannot read
Level 1 (Std 1) text
% Mothers whoCAN read
Level 1 (Std 1) textTotal
Age : 17-25
Age : 26-30
Age : 31-35
Age : 36-45
Age : 46-55
Age : 17-55
DAMAN & DIU RURAL
19.2
26.0
31.1
19.2
4.5
100
97.4 2.6 100
99.8 0.2 100
99.1 1.0 100
97.7 2.4 100
99.9 0.1 100
99.3 0.8 100
97.1 2.9 100
99.7 0.3 100
98.8 1.2 100
16.4 83.6 100
3.6 96.4 100
7.2 92.8 100
26.8 73.2 100
8.6 91.4 100
13.8 86.3 100
10.6 89.4 100 10.1 89.9 100
21.3 78.7 100 23.4 76.7 100
26.3 73.7 100 25.1 74.9 100
33.8 66.2 100 34.5 65.5 100
52.8 47.2 100 52.8 47.2 100
24.6 75.4 100 24.8 75.3 100
Reading : % Children 6-8 year oldsin school who CAN read
Arithmetic : % Children 6-8 year oldsin school who CAN
Noschooling
Noschooling
No schooling No schooling
Noschooling
92 ASER 2006
Mothers who havestudied upto :
% Readers amongthese mothers
No schooling
Std I
Std II
Std III
Std IV
Std V and above
TOTAL
0.0
96.2
97.3
100.0
100.0
100.0
75.3
Mothers’ Reading Level and Class
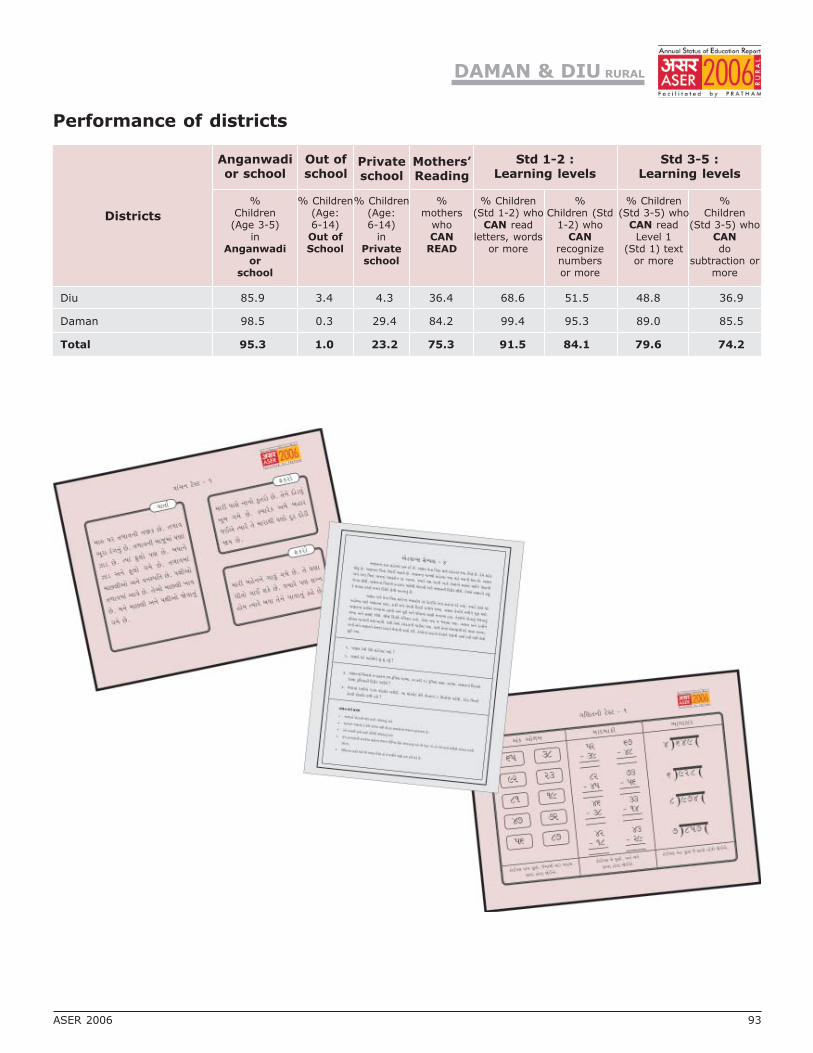
Districts
Anganwadior school
Out ofschool
Privateschool
Mothers’Reading
Std 1-2 :Learning levels
Std 3-5 :Learning levels
%Children
(Age 3-5)in
Anganwadior
school
% Children(Age:6-14)Out ofSchool
% Children(Age:6-14)
inPrivateschool
%mothers
whoCAN
READ
% Children(Std 1-2) who
CAN readletters, words
or more
% Children(Std 3-5) who
CAN readLevel 1
(Std 1) textor more
%Children (Std
1-2) whoCAN
recognizenumbersor more
%Children
(Std 3-5) whoCANdo
subtraction ormore
Performance of districts
Diu 85.9 3.4 4.3 36.4 68.6 51.5 48.8 36.9
Daman 98.5 0.3 29.4 84.2 99.4 95.3 89.0 85.5
Total 95.3 1.0 23.2 75.3 91.5 84.1 79.6 74.2
DAMAN & DIU RURAL
ASER 2006 93

DADRA & NAGAR HAVELI RURAL
All analysis based on data from 1 out of 1 districts
Enrollment
Age and Class
SCHOOL ENROLLMENT AND OUT OF SCHOOL CHILDREN
% Children in each age groupin different types of schools
% Children out ofschool
Govt. Pvt.Other
(Madarsa + EGS)Not in school (Neverenrolled + drop out)
Total
Age : 7-16 ALL
Age : 7-10 ALL
Age : 7-10 BOYS
Age : 7-10 GIRLS
Age : 11-14 ALL
Age : 11-14 BOYS
Age : 11-14 GIRLS
Age : 15-16 ALL
Age : 15-16 BOYS
Age : 15-16 GIRLS
72.7 16.4 0.0 10.9 100
76.5 19.9 0.0 3.6 100
76.6 20.4 0.0 3.0 100
76.3 19.4 0.0 4.3 100
75.1 14.1 0.0 10.8 100
80.1 15.1 0.0 4.9 100
68.6 12.8 0.0 18.6 100
57.3 12.2 0.0 30.5 100
68.0 13.6 0.0 18.5 100
39.3 9.8 0.0 50.8 100
I
II
III
IV
V
VI
VII
VIII
Std.5 6 7 8 9 10 11 12 13 14 15 16 Total
% Children in each standard by age
AGE BY STANDARD FOR SCHOOL CHILDREN
21.4 67.2 6.1 2.3 3.1 100
0.9 9.6 61.7 24.4 2.6 0.9 100
1.5 11.3 48.1 29.3 5.3 4.5 100
0.8 8.1 52.4 29.8 5.7 3.2 100
1.9 0.9 50.0 29.6 10.2 7.4 100
1.2 9.4 31.8 34.1 15.3 8.2 100
1.0 8.9 37.6 25.7 18.8 7.9 100
1.5 5.8 36.2 34.8 15.9 5.8 100
94 ASER 2006
Young Children
IN BALWADI / ANGANWADI OR IN SCHOOL
% Children in pre-school or school
Age : 3 ALL
Age : 4 ALL
Age : 5 ALL
Age : 6 ALL
In
balw
ad
io
ran
gan
wad
i
In school
Govt. Pvt. Other
Not
goin
gan
yw
here
Total
60.6 0.0 39.4 100
72.9 1.4 25.7 100
60.8 24.5 3.9 0.0 10.8 100
5.4 76.6 15.3 0.0 2.7 100

Learning Level
Reading : % Children who CAN read
I
II
III
IV
V
VI
VII
VIII
Total
Std. Nothing Letter WordLevel 1(Std 1)
text
Level 2(Std 2)
text
Total
24.6 56.9 12.3 3.9 2.3 100
2.6 27.8 58.3 9.6 1.7 100
3.8 10.6 40.9 38.6 6.1 100
1.6 5.7 22.0 46.3 24.4 100
0.9 2.8 8.3 39.8 48.2 100
0.0 0.0 10.7 21.4 67.9 100
0.0 1.0 3.0 33.7 62.4 100
0.0 1.5 4.4 18.8 75.4 100
5.0 15.3 21.8 26.9 31.0 100
Std.
Arithmetic : % Children who CAN
NothingRecognizenumbers
Subtract Divide Total
I
II
III
IV
V
VI
VII
VIII
Total
43.4 52.7 2.3 1.6 100
14.8 74.8 10.4 0.0 100
15.0 46.6 32.3 6.0 100
4.1 33.3 45.5 17.1 100
2.8 16.7 39.8 40.7 100
0.0 14.1 24.7 61.2 100
0.0 8.9 25.7 65.4 100
0.0 11.6 23.2 65.2 100
11.7 35.2 25.5 27.6 100
Writing : % Children whoCAN correctly write
One simple dictatedsentence
I
II
III
IV
V
VI
VII
VIII
Total
Std.
III
IV
V
VI
VII
VIII
Total
Comprehension : % Readers (Level 2) who CAN
Answer atleast onequestion
Answer bothquestions
Solve atleast one
wordproblem
Solve bothword
problems
Std.
100 100 75.0 62.5
93.3 86.7 86.7 63.3
94.2 86.5 84.6 63.5
100.0 82.1 92.7 70.9
98.4 96.7 90.2 78.7
96.2 94.2 92.3 84.6
96.9 90.0 89.2 72.9
15.5
31.3
64.4
78.1
89.8
96.4
98.0
97.1
67.5
DADRA & NAGAR HAVELI RURAL
ASER 2006 95
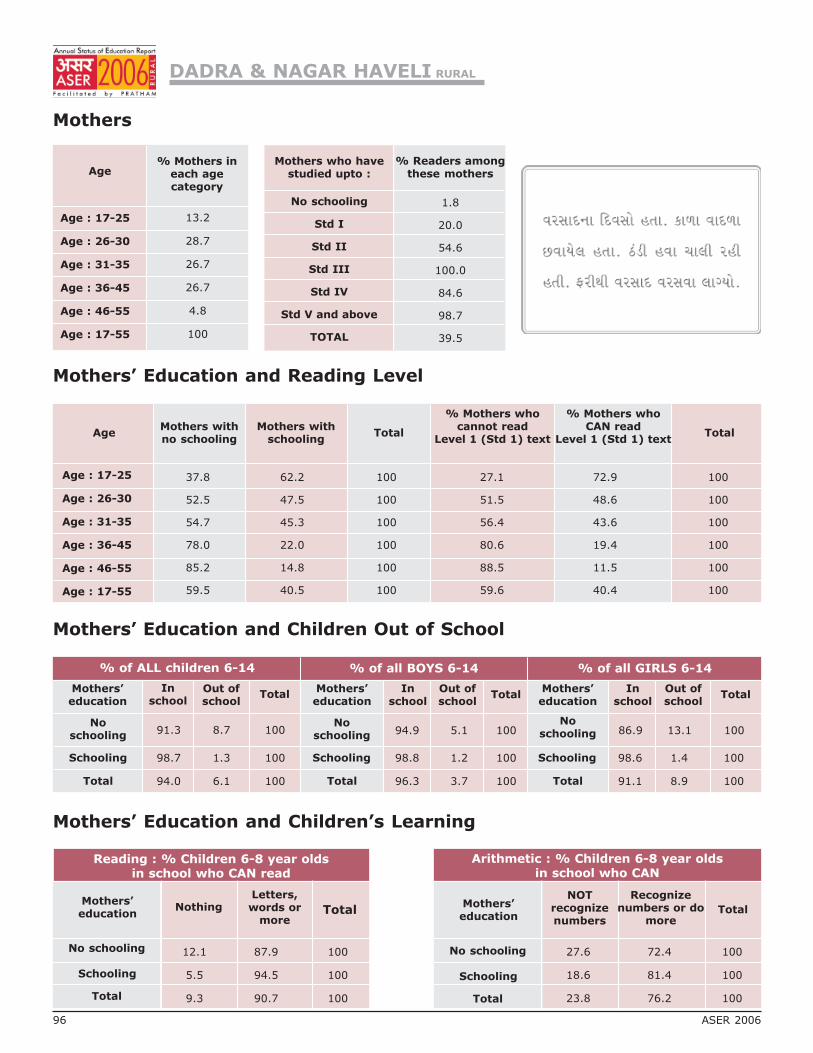
Mothers
Mothers’ Education and Children Out of School
Mothers’ Education and Children’s Learning
Age% Mothers in
each agecategory
Age : 17-25
Age : 26-30
Age : 31-35
Age : 36-45
Age : 46-55
Age : 17-55
% of ALL children 6-14 % of all BOYS 6-14 % of all GIRLS 6-14
Mothers’education
Schooling
Total
Mothers’education
Schooling
Total
Mothers’education
Schooling
Total
Inschool
Out ofschool
TotalIn
schoolOut ofschool
TotalIn
schoolOut ofschool
Total
Mothers’education
Schooling
Total
Letters,words or
moreTotal
NOTrecognizenumbers
Recognizenumbers or do
moreTotal
Mothers’education
Schooling
Total
Nothing
Mothers’ Education and Reading Level
AgeMothers withno schooling
Mothers withschooling
Total
% Mothers whocannot read
Level 1 (Std 1) text
% Mothers whoCAN read
Level 1 (Std 1) textTotal
Age : 17-25
Age : 26-30
Age : 31-35
Age : 36-45
Age : 46-55
Age : 17-55
DADRA & NAGAR HAVELI RURAL
13.2
28.7
26.7
26.7
4.8
100
91.3 8.7 100
98.7 1.3 100
94.0 6.1 100
94.9 5.1 100
98.8 1.2 100
96.3 3.7 100
86.9 13.1 100
98.6 1.4 100
91.1 8.9 100
12.1 87.9 100
5.5 94.5 100
9.3 90.7 100
27.6 72.4 100
18.6 81.4 100
23.8 76.2 100
37.8 62.2 100 27.1 72.9 100
52.5 47.5 100 51.5 48.6 100
54.7 45.3 100 56.4 43.6 100
78.0 22.0 100 80.6 19.4 100
85.2 14.8 100 88.5 11.5 100
59.5 40.5 100 59.6 40.4 100
Reading : % Children 6-8 year oldsin school who CAN read
Arithmetic : % Children 6-8 year oldsin school who CAN
Noschooling
Noschooling
Noschooling
No schooling No schooling
96 ASER 2006
Mothers who havestudied upto :
% Readers amongthese mothers
No schooling
Std I
Std II
Std III
Std IV
Std V and above
TOTAL
1.8
20.0
54.6
100.0
84.6
98.7
39.5
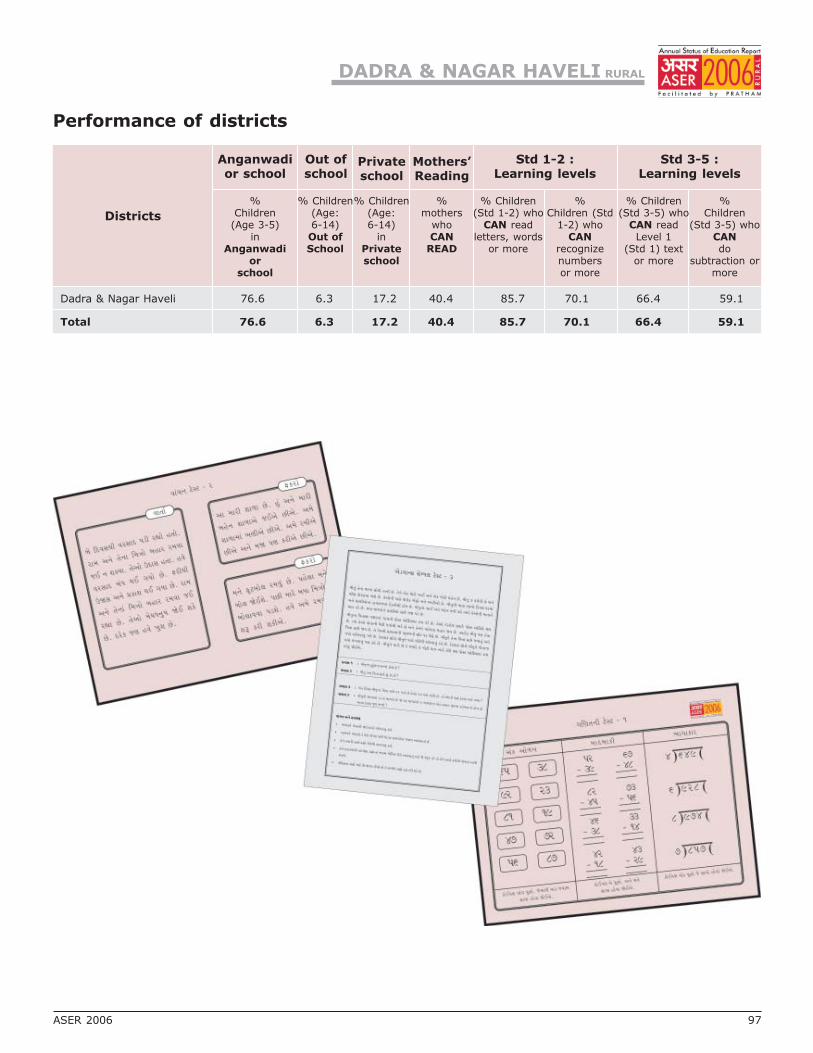
Districts
Anganwadior school
Out ofschool
Privateschool
Mothers’Reading
Std 1-2 :Learning levels
Std 3-5 :Learning levels
%Children
(Age 3-5)in
Anganwadior
school
% Children(Age:6-14)Out ofSchool
% Children(Age:6-14)
inPrivateschool
%mothers
whoCAN
READ
% Children(Std 1-2) who
CAN readletters, words
or more
% Children(Std 3-5) who
CAN readLevel 1
(Std 1) textor more
%Children (Std
1-2) whoCAN
recognizenumbersor more
%Children
(Std 3-5) whoCANdo
subtraction ormore
Performance of districts
Dadra & Nagar Haveli 76.6 6.3 17.2 40.4 85.7 70.1 66.4 59.1
Total 76.6 6.3 17.2 40.4 85.7 70.1 66.4 59.1
DADRA & NAGAR HAVELI RURAL
ASER 2006 97

98 ASER 2006
MADHYA PRADESH RURAL
All analysis based on data from 45 out of 45 districts
Enrollment
Age and Class
SCHOOL ENROLLMENT AND OUT OF SCHOOL CHILDREN
% Children in each age groupin different types of schools
% Children out ofschool
Govt. Pvt.Other
(Madarsa + EGS)Not in school (Neverenrolled + drop out)
Total
Age : 7-16 ALL
Age : 7-10 ALL
Age : 7-10 BOYS
Age : 7-10 GIRLS
Age : 11-14 ALL
Age : 11-14 BOYS
Age : 11-14 GIRLS
Age : 15-16 ALL
Age : 15-16 BOYS
Age : 15-16 GIRLS
82.5 10.6 0.6 6.3 100
84.4 12.4 1.0 2.3 100
83.8 13.1 1.0 2.1 100
85.1 11.5 1.0 2.5 100
84.4 9.3 0.2 6.2 100
84.1 10.4 0.2 5.4 100
84.8 7.8 0.1 7.3 100
71.7 8.0 0.1 20.2 100
73.5 8.2 0.1 18.2 100
69.0 7.6 0.1 23.4 100
Young Children
IN BALWADI / ANGANWADI OR IN SCHOOL
% Children in pre-school or school
Age : 3 ALL
Age : 4 ALL
Age : 5 ALL
Age : 6 ALL
In
balw
ad
io
ran
gan
wad
i
In school
Govt. Pvt. Other
Not
goin
gan
yw
here
Total
69.7 1.4 28.9 100
78.8 3.7 17.5 100
29.2 46.9 12.9 1.1 10.0 100
1.4 78.7 14.9 1.6 3.3 100
I
II
III
IV
V
VI
VII
VIII
Std.5 6 7 8 9 10 11 12 13 14 15 16 Total
% Children in each standard by age
AGE BY STANDARD FOR SCHOOL CHILDREN
32.6 52.7 9.2 3.3 0.7 1.5 100
2.2 18.0 45.7 26.8 3.0 2.7 1.6 100
0.4 1.7 8.7 51.9 25.9 7.2 1.3 2.9 100
0.9 1.9 11.8 34.6 38.6 6.1 3.8 2.3 100
0.8 2.1 4.3 47.2 25.5 12.4 3.9 3.8 100
1.2 1.1 5.9 24.7 48.6 10.4 5.4 2.9 100
1.5 1.8 4.6 34.7 31.5 18.6 5.3 2.0 100
1.5 1.3 6.8 27.7 39.5 14.8 8.6 100

ASER 2006 99
Learning Level
Reading : % Children who CAN read
I
II
III
IV
V
VI
VII
VIII
Total
Std. Nothing Letter WordLevel 1(Std 1)
text
Level 2(Std 2)
text
Total
19.4 42.0 32.9 4.3 1.4 100
4.9 19.2 49.8 21.0 5.1 100
2.0 6.8 26.2 46.3 18.7 100
1.1 3.4 14.3 33.3 47.9 100
0.4 1.5 5.8 19.0 73.4 100
0.2 0.7 2.5 10.6 86.1 100
0.1 0.5 2.1 7.3 90.0 100
0.1 0.2 1.1 5.4 93.2 100
4.2 11.0 19.2 19.7 45.9 100
Std.
Arithmetic : % Children who CAN
NothingRecognizenumbers
Subtract Divide Total
I
II
III
IV
V
VI
VII
VIII
Total
26.6 63.6 8.6 1.2 100
8.4 57.4 30.5 3.7 100
3.2 27.4 54.0 15.4 100
1.6 15.7 40.8 41.9 100
0.8 6.5 25.9 66.8 100
0.3 2.8 17.1 79.8 100
0.3 2.1 12.5 85.1 100
0.2 1.5 8.8 89.6 100
6.1 25.6 26.2 42.1 100
Writing : % Children whoCAN correctly write
One simple dictatedsentence
I
II
III
IV
V
VI
VII
VIII
Total
Std.
III
IV
V
VI
VII
VIII
Total
Comprehension : % Readers (Level 2) who CAN
Answer atleast onequestion
Answer bothquestions
Solve atleast one
wordproblem
Solve bothword
problems
Std.
90.6 81.0 79.3 67.0
92.2 83.2 82.1 68.0
94.0 85.7 87.4 76.4
96.1 90.8 91.6 82.0
96.5 90.4 92.6 82.8
98.0 93.4 94.0 87.0
95.2 88.5 89.3 79.1
13.1
31.8
60.9
78.8
91.1
96.2
97.4
98.1
66.7
MADHYA PRADESH RURAL
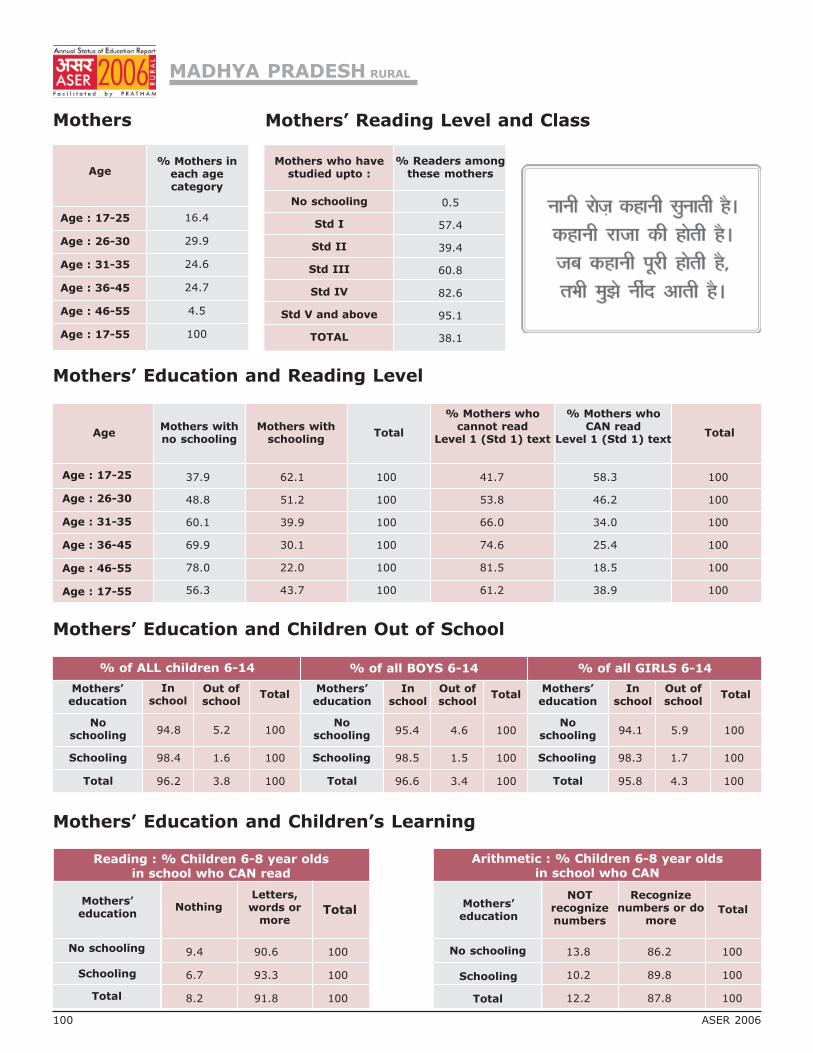
Mothers
Mothers’ Education and Children Out of School
Mothers’ Education and Children’s Learning
Age% Mothers in
each agecategory
Age : 17-25
Age : 26-30
Age : 31-35
Age : 36-45
Age : 46-55
Age : 17-55
% of ALL children 6-14 % of all BOYS 6-14 % of all GIRLS 6-14
Mothers’education
Noschooling
Schooling
Total
Mothers’education
Noschooling
Schooling
Total
Mothers’education
Noschooling
Schooling
Total
Inschool
Out ofschool
TotalIn
schoolOut ofschool
TotalIn
schoolOut ofschool
Total
Mothers’education
No schooling
Schooling
Total
Letters,words or
moreTotal
NOTrecognizenumbers
Recognizenumbers or do
moreTotal
Mothers’education
No schooling
Schooling
Total
Nothing
Mothers’ Education and Reading Level
AgeMothers withno schooling
Mothers withschooling
Total
% Mothers whocannot read
Level 1 (Std 1) text
% Mothers whoCAN read
Level 1 (Std 1) textTotal
Age : 17-25
Age : 26-30
Age : 31-35
Age : 36-45
Age : 46-55
Age : 17-55
16.4
29.9
24.6
24.7
4.5
100
94.8 5.2 100
98.4 1.6 100
96.2 3.8 100
95.4 4.6 100
98.5 1.5 100
96.6 3.4 100
94.1 5.9 100
98.3 1.7 100
95.8 4.3 100
9.4 90.6 100
6.7 93.3 100
8.2 91.8 100
13.8 86.2 100
10.2 89.8 100
12.2 87.8 100
37.9 62.1 100 41.7 58.3 100
48.8 51.2 100 53.8 46.2 100
60.1 39.9 100 66.0 34.0 100
69.9 30.1 100 74.6 25.4 100
78.0 22.0 100 81.5 18.5 100
56.3 43.7 100 61.2 38.9 100
MADHYA PRADESH RURAL
Reading : % Children 6-8 year oldsin school who CAN read
Arithmetic : % Children 6-8 year oldsin school who CAN
Mothers who havestudied upto :
% Readers amongthese mothers
No schooling
Std I
Std II
Std III
Std IV
Std V and above
TOTAL
0.5
57.4
39.4
60.8
82.6
95.1
38.1
Mothers’ Reading Level and Class
100 ASER 2006

Districts
Anganwadior school
Out ofschool
Privateschool
Mothers’Reading
Std 1-2 :Learning levels
Std 3-5 :Learning levels
%Children
(Age 3-5)in
Anganwadior
school
% Children(Age:6-14)Out ofSchool
% Children(Age:6-14)
inPrivateschool
%mothers
whoCAN
READ
% Children(Std 1-2) who
CAN readletters, words
or more
% Children(Std 3-5) who
CAN readLevel 1
(Std 1) textor more
%Children (Std
1-2) whoCAN
recognizenumbersor more
%Children
(Std 3-5) whoCANdo
subtraction ormore
Performance of districts
Sheopur 98.4 7.9 8.2 12.0 65.8 56.1 41.5 51.8
Morena 94.8 0.2 10.3 39.8 85.3 82.4 96.6 98.1
Bhind 98.2 0.2 7.2 26.3 92.8 92.3 82.2 86.9
Gwalior 94.9 0.1 6.8 45.4 83.2 82.4 65.3 85.4
Datia 93.0 1.0 6.8 39.5 88.2 90.4 95.2 96.4
Shivpuri 99.3 1.6 4.1 27.6 82.8 77.5 74.0 77.5
Guna 88.9 1.8 27.6 72.3 70.9 66.2 58.3 52.2
Tikamgarh 56.0 5.8 8.0 16.7 69.4 60.3 49.4 55.3
Chhatarpur 68.5 6.4 5.4 21.0 66.8 49.5 65.8 64.6
Panna 46.5 2.3 12.3 34.6 68.6 65.8 60.7 73.4
Sagar 93.0 2.8 6.9 36.3 80.0 70.0 62.9 78.1
Damoh 76.6 4.8 6.4 26.6 87.6 85.6 60.3 71.2
Satna 50.5 4.8 17.7 37.0 81.4 76.2 63.0 63.2
Rewa 60.7 5.4 17.5 36.3 91.6 77.7 63.0 60.1
Umaria 54.4 3.5 12.5 31.4 89.0 62.7 77.3 76.1
Shahdol 82.0 5.7 9.6 28.0 74.3 53.5 57.2 63.7
Sidhi 60.5 10.7 9.7 26.8 84.3 77.8 63.8 70.6
Neemach 78.2 3.7 19.8 44.6 93.1 82.3 71.0 56.9
Mandsaur 94.9 0.1 13.4 54.2 93.6 92.7 89.6 88.8
Ratlam 91.7 4.4 14.6 36.3 89.7 85.4 79.0 83.0
Ujjain 78.6 3.6 27.9 32.0 100.0 100.0 92.2 90.4
Shajapur 80.6 3.1 19.3 43.1 81.1 63.3 68.1 66.2
Dewas 68.0 4.4 29.8 41.4 83.8 79.6 80.1 88.7
Jhabua 61.9 9.0 11.5 34.1 90.7 85.3 88.2 87.6
Dhar 72.2 9.9 16.7 50.2 97.9 96.6 91.2 94.3
Indore 73.3 3.9 19.2 34.2 95.4 93.6 92.1 90.4
West Nimar 83.7 7.8 7.8 39.6 96.7 95.8 89.9 95.8
Barwani 97.2 5.9 6.9 43.7 99.0 98.3 85.1 90.4
East Nimar 90.6 1.5 13.8 60.3 98.7 98.2 96.8 91.7
Rajgarh 100.0 0.7 0.2 22.5 89.2 88.9 92.9 93.5
Vidisha 91.9 2.4 10.3 29.9 94.5 89.8 93.1 92.2
Bhopal 94.4 2.0 3.7 39.6 92.4 93.5 94.6 98.0
Sehore 73.6 2.8 22.1 59.4 90.7 86.2 90.8 85.8
Raisen 85.5 3.5 9.3 44.9 94.8 90.0 75.9 74.9
Betul 93.9 0.0 1.4 56.2 87.6 86.8 99.4 99.4
Harda 89.1 3.4 9.4 33.6 90.6 89.5 80.8 84.0
Hoshangabad 88.6 1.3 8.0 44.8 96.3 95.9 83.5 87.2
Katni 86.3 3.3 10.8 31.8 91.8 91.4 85.1 89.1
Jabalpur 65.5 5.5 9.7 47.3 83.2 66.5 84.8 81.8
Narsimhapur 73.5 2.0 14.6 58.3 92.1 88.9 78.0 84.3
Dindori 96.9 1.0 5.6 35.9 84.3 78.5 85.5 86.8
Mandla 99.3 0.6 3.6 18.7 84.2 78.6 97.3 96.1
Chhindwara 92.8 4.7 9.2 44.0 92.5 87.4 92.7 84.3
Seoni 92.4 2.5 4.8 52.9 90.1 89.4 92.2 92.5
Balaghat 99.1 1.4 25.9 59.2 94.7 81.4 85.2 79.6
Total 81.5 3.9 11.5 38.9 87.6 82.2 79.2 81.4
MADHYA PRADESH RURAL
ASER 2006 101
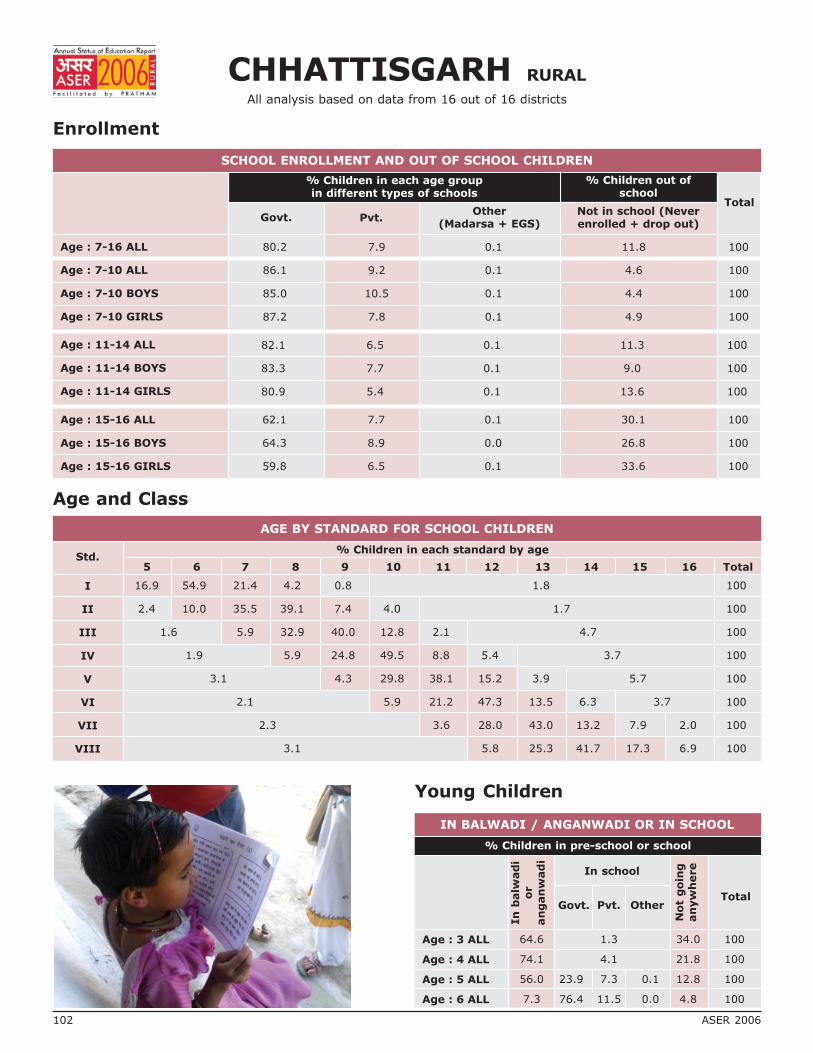
CHHATTISGARH RURAL
All analysis based on data from 16 out of 16 districts
Enrollment
Age and Class
SCHOOL ENROLLMENT AND OUT OF SCHOOL CHILDREN
% Children in each age groupin different types of schools
% Children out ofschool
Govt. Pvt.Other
(Madarsa + EGS)Not in school (Neverenrolled + drop out)
Total
Age : 7-16 ALL
Age : 7-10 ALL
Age : 7-10 BOYS
Age : 7-10 GIRLS
Age : 11-14 ALL
Age : 11-14 BOYS
Age : 11-14 GIRLS
Age : 15-16 ALL
Age : 15-16 BOYS
Age : 15-16 GIRLS
80.2 7.9 0.1 11.8 100
86.1 9.2 0.1 4.6 100
85.0 10.5 0.1 4.4 100
87.2 7.8 0.1 4.9 100
82.1 6.5 0.1 11.3 100
83.3 7.7 0.1 9.0 100
80.9 5.4 0.1 13.6 100
62.1 7.7 0.1 30.1 100
64.3 8.9 0.0 26.8 100
59.8 6.5 0.1 33.6 100
Young Children
IN BALWADI / ANGANWADI OR IN SCHOOL
% Children in pre-school or school
Age : 3 ALL
Age : 4 ALL
Age : 5 ALL
Age : 6 ALL
In
balw
ad
io
ran
gan
wad
i
In school
Govt. Pvt. Other
Not
goin
gan
yw
here
Total
64.6 1.3 34.0 100
74.1 4.1 21.8 100
56.0 23.9 7.3 0.1 12.8 100
7.3 76.4 11.5 0.0 4.8 100
I
II
III
IV
V
VI
VII
VIII
Std.5 6 7 8 9 10 11 12 13 14 15 16 Total
% Children in each standard by age
AGE BY STANDARD FOR SCHOOL CHILDREN
16.9 54.9 21.4 4.2 0.8 1.8 100
2.4 10.0 35.5 39.1 7.4 4.0 1.7 100
1.6 5.9 32.9 40.0 12.8 2.1 4.7 100
1.9 5.9 24.8 49.5 8.8 5.4 3.7 100
3.1 4.3 29.8 38.1 15.2 3.9 5.7 100
2.1 5.9 21.2 47.3 13.5 6.3 3.7 100
2.3 3.6 28.0 43.0 13.2 7.9 2.0 100
3.1 5.8 25.3 41.7 17.3 6.9 100
102 ASER 2006

Learning Level
Reading : % Children who CAN read
I
II
III
IV
V
VI
VII
VIII
Total
Std. Nothing Letter WordLevel 1(Std 1)
text
Level 2(Std 2)
text
Total
33.5 49.7 13.8 1.4 1.6 100
10.6 46.5 36.1 4.6 2.2 100
2.9 19.3 41.7 25.0 11.2 100
1.4 9.7 21.8 41.3 25.8 100
1.1 5.6 10.7 28.8 53.9 100
0.4 2.8 5.1 19.9 71.9 100
0.1 0.7 3.9 9.8 85.6 100
0.3 1.3 0.6 7.2 90.7 100
7.7 19.8 18.3 16.9 37.3 100
Std.
Arithmetic : % Children who CAN
NothingRecognizenumbers
Subtract Divide Total
I
II
III
IV
V
VI
VII
VIII
Total
53.6 43.0 1.9 1.5 100
23.7 69.0 5.8 1.6 100
10.6 52.1 30.2 7.1 100
5.0 38.0 39.4 17.5 100
3.0 19.6 39.1 38.4 100
2.0 11.2 40.6 46.3 100
0.4 5.2 33.6 60.8 100
0.5 4.7 23.8 71.0 100
14.5 33.2 25.4 26.9 100
Writing : % Children whoCAN correctly write
One simple dictatedsentence
I
II
III
IV
V
VI
VII
VIII
Total
Std.
III
IV
V
VI
VII
VIII
Total
Comprehension : % Readers (Level 2) who CAN
Answer atleast onequestion
Answer bothquestions
Solve atleast one
wordproblem
Solve bothword
problems
Std.
94.5 68.4 84.9 63.9
92.3 68.7 84.7 59.3
95.6 77.9 86.7 64.1
97.6 80.5 88.3 60.7
99.2 84.6 93.4 68.7
98.6 87.0 94.4 74.1
97.3 81.2 90.4 66.6
21.2
41.4
70.3
84.1
92.0
96.1
97.6
98.2
71.4
CHHATTISGARH RURAL
ASER 2006 103

Mothers
Mothers’ Education and Children Out of School
Mothers’ Education and Children’s Learning
Age% Mothers in
each agecategory
Age : 17-25
Age : 26-30
Age : 31-35
Age : 36-45
Age : 46-55
Age : 17-55
% of ALL children 6-14 % of all BOYS 6-14 % of all GIRLS 6-14
Mothers’education
Noschooling
Schooling
Total
Mothers’education
Noschooling
Schooling
Total
Mothers’education
Noschooling
Schooling
Total
Inschool
Out ofschool
TotalIn
schoolOut ofschool
TotalIn
schoolOut ofschool
Total
Mothers’education
No schooling
Schooling
Total
Letters,words or
moreTotal
NOTrecognizenumbers
Recognizenumbers or do
moreTotal
Mothers’education
No schooling
Schooling
Total
Nothing
Mothers’ Education and Reading Level
AgeMothers withno schooling
Mothers withschooling
Total
% Mothers whocannot read
Level 1 (Std 1) text
% Mothers whoCAN read
Level 1 (Std 1) textTotal
Age : 17-25
Age : 26-30
Age : 31-35
Age : 36-45
Age : 46-55
Age : 17-55
CHHATTISGARH RURAL
16.9
29.5
25.1
24.2
4.4
100
89.9 10.1 100
97.0 3.0 100
92.7 7.3 100
91.7 8.3 100
97.7 2.3 100
94.1 6.0 100
88.1 11.9 100
96.2 3.8 100
91.3 8.7 100
18.5 81.6 100
14.1 85.9 100
16.6 83.4 100
35.1 64.9 100
26.7 73.3 100
31.5 68.5 100
38.7 61.3 100 24.1 75.9 100
49.9 50.1 100 37.8 62.2 100
62.9 37.1 100 52.0 48.0 100
71.1 28.9 100 60.3 39.7 100
78.1 21.9 100 77.1 22.9 100
57.6 42.4 100 45.2 54.8 100
Reading : % Children 6-8 year oldsin school who CAN read
Arithmetic : % Children 6-8 year oldsin school who CAN
Mothers’ Reading Level and Class
104 ASER 2006
Mothers who havestudied upto :
% Readers amongthese mothers
No schooling
Std I
Std II
Std III
Std IV
Std V and above
TOTAL
1.3
57.0
43.9
67.5
90.8
97.5
54.7
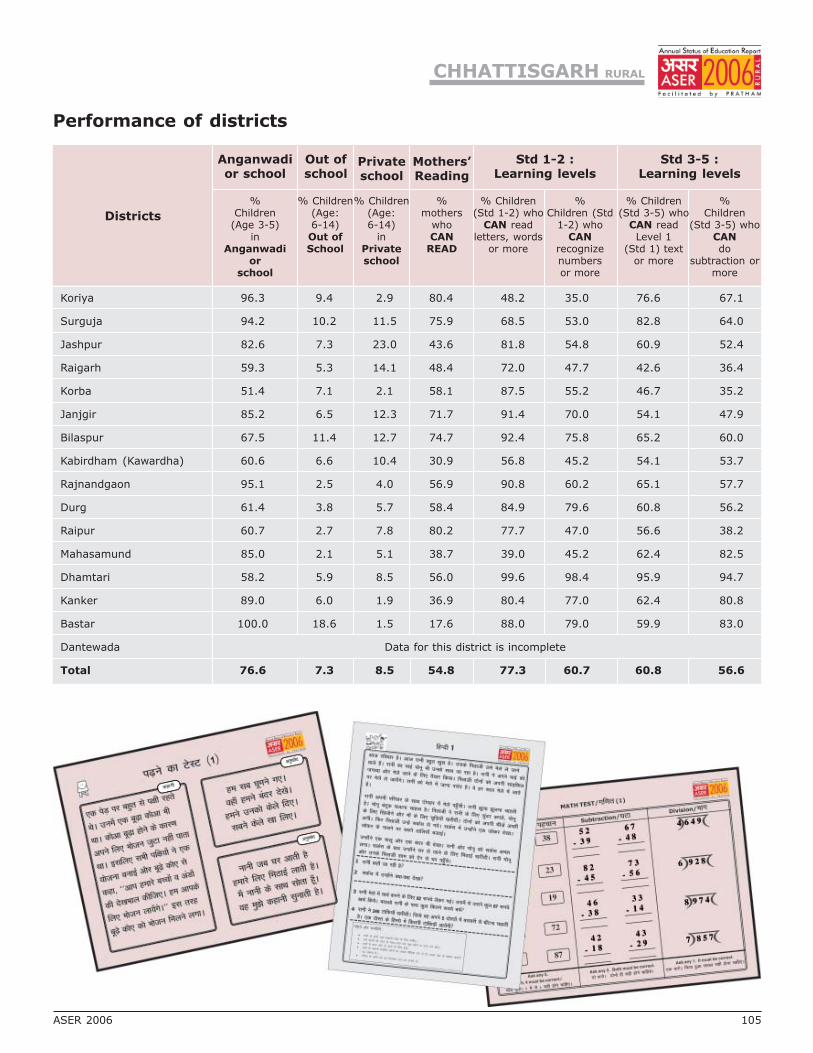
CHHATTISGARH RURAL
Districts
Anganwadior school
Out ofschool
Privateschool
Mothers’Reading
Std 1-2 :Learning levels
Std 3-5 :Learning levels
%Children
(Age 3-5)in
Anganwadior
school
% Children(Age:6-14)Out ofSchool
% Children(Age:6-14)
inPrivateschool
%mothers
whoCAN
READ
% Children(Std 1-2) who
CAN readletters, words
or more
% Children(Std 3-5) who
CAN readLevel 1
(Std 1) textor more
%Children (Std
1-2) whoCAN
recognizenumbersor more
%Children
(Std 3-5) whoCANdo
subtraction ormore
Performance of districts
Koriya 96.3 9.4 2.9 80.4 48.2 35.0 76.6 67.1
Surguja 94.2 10.2 11.5 75.9 68.5 53.0 82.8 64.0
Jashpur 82.6 7.3 23.0 43.6 81.8 54.8 60.9 52.4
Raigarh 59.3 5.3 14.1 48.4 72.0 47.7 42.6 36.4
Korba 51.4 7.1 2.1 58.1 87.5 55.2 46.7 35.2
Janjgir 85.2 6.5 12.3 71.7 91.4 70.0 54.1 47.9
Bilaspur 67.5 11.4 12.7 74.7 92.4 75.8 65.2 60.0
Kabirdham (Kawardha) 60.6 6.6 10.4 30.9 56.8 45.2 54.1 53.7
Rajnandgaon 95.1 2.5 4.0 56.9 90.8 60.2 65.1 57.7
Durg 61.4 3.8 5.7 58.4 84.9 79.6 60.8 56.2
Raipur 60.7 2.7 7.8 80.2 77.7 47.0 56.6 38.2
Mahasamund 85.0 2.1 5.1 38.7 39.0 45.2 62.4 82.5
Dhamtari 58.2 5.9 8.5 56.0 99.6 98.4 95.9 94.7
Kanker 89.0 6.0 1.9 36.9 80.4 77.0 62.4 80.8
Bastar 100.0 18.6 1.5 17.6 88.0 79.0 59.9 83.0
Dantewada Data for this district is incomplete
Total 76.6 7.3 8.5 54.8 77.3 60.7 60.8 56.6
ASER 2006 105

ORISSA RURAL
All analysis based on data from 30 out of 30 districts
Enrollment
Age and Class
SCHOOL ENROLLMENT AND OUT OF SCHOOL CHILDREN
% Children in each age groupin different types of schools
% Children out ofschool
Govt. Pvt.Other
(Madarsa + EGS)Not in school (Neverenrolled + drop out)
Total
Age : 7-16 ALL
Age : 7-10 ALL
Age : 7-10 BOYS
Age : 7-10 GIRLS
Age : 11-14 ALL
Age : 11-14 BOYS
Age : 11-14 GIRLS
Age : 15-16 ALL
Age : 15-16 BOYS
Age : 15-16 GIRLS
82.2 4.4 0.3 13.2 100
88.5 4.1 0.6 6.8 100
88.7 4.2 0.7 6.4 100
88.4 4.0 0.5 7.2 100
83.2 4.3 0.1 12.4 100
84.0 4.6 0.1 11.4 100
82.3 3.9 0.1 13.7 100
64.6 5.2 0.0 30.2 100
65.7 5.1 0.0 29.2 100
63.2 5.4 0.0 31.4 100
Young Children
IN BALWADI / ANGANWADI OR IN SCHOOL
% Children in pre-school or school
Age : 3 ALL
Age : 4 ALL
Age : 5 ALL
Age : 6 ALL
In
balw
ad
io
ran
gan
wad
i
In school
Govt. Pvt. Other
Not
goin
gan
yw
here
Total
58.8 0.1 41.1 100
65.1 0.3 34.6 100
15.0 69.1 4.9 0.8 10.2 100
0.0 87.8 5.2 1.1 6.0 100
I
II
III
IV
V
VI
VII
VIII
Std.5 6 7 8 9 10 11 12 13 14 15 16 Total
% Children in each standard by age
AGE BY STANDARD FOR SCHOOL CHILDREN
43.7 42.9 10.4 2.2 0.4 0.5 100
1.5 17.9 55.1 18.4 3.5 2.1 1.6 100
0.3 1.4 15.3 60.2 13.2 5.5 0.9 3.2 100
0.6 2.0 16.3 51.0 21.3 3.3 3.6 1.9 100
0.7 2.9 8.3 57.7 14.9 9.5 2.5 3.5 100
1.2 2.0 11.7 47.5 26.9 5.7 2.9 2.1 100
1.4 3.0 9.4 59.3 15.5 6.7 2.8 1.8 100
2.5 2.3 14.6 47.6 23.1 6.4 3.5 100
106 ASER 2006
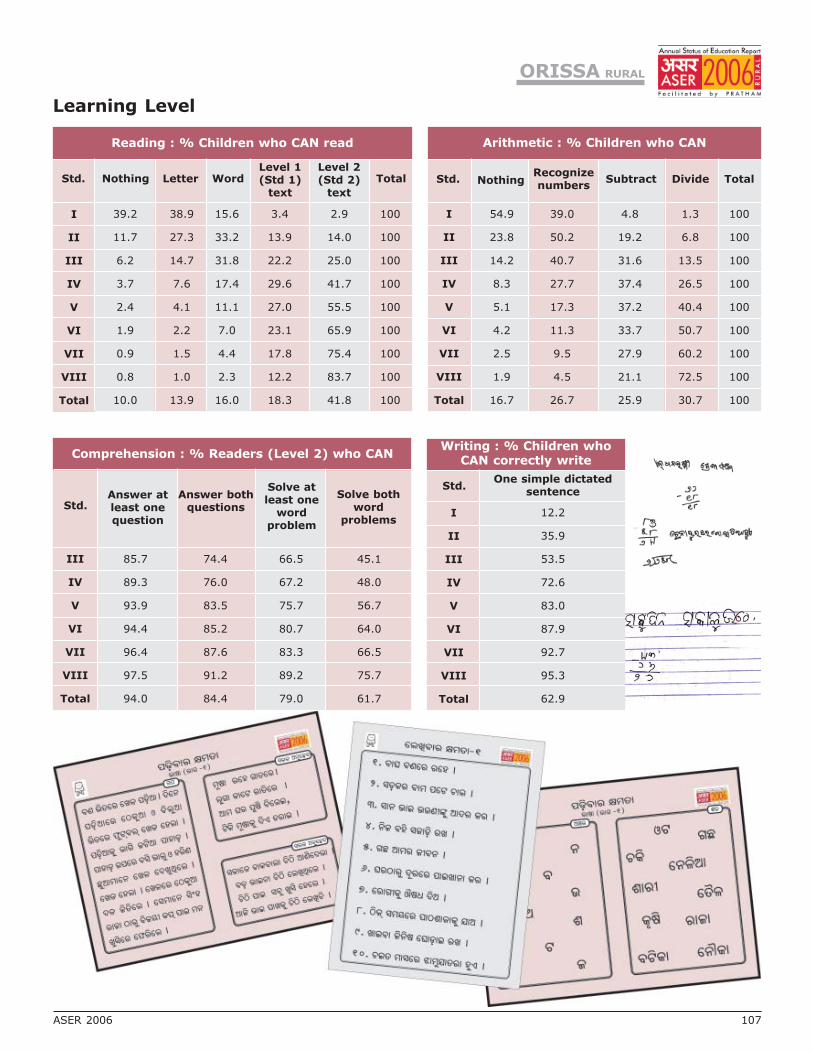
Learning Level
Reading : % Children who CAN read
I
II
III
IV
V
VI
VII
VIII
Total
Std. Nothing Letter WordLevel 1(Std 1)
text
Level 2(Std 2)
text
Total
39.2 38.9 15.6 3.4 2.9 100
11.7 27.3 33.2 13.9 14.0 100
6.2 14.7 31.8 22.2 25.0 100
3.7 7.6 17.4 29.6 41.7 100
2.4 4.1 11.1 27.0 55.5 100
1.9 2.2 7.0 23.1 65.9 100
0.9 1.5 4.4 17.8 75.4 100
0.8 1.0 2.3 12.2 83.7 100
10.0 13.9 16.0 18.3 41.8 100
Std.
Arithmetic : % Children who CAN
NothingRecognizenumbers
Subtract Divide Total
I
II
III
IV
V
VI
VII
VIII
Total
54.9 39.0 4.8 1.3 100
23.8 50.2 19.2 6.8 100
14.2 40.7 31.6 13.5 100
8.3 27.7 37.4 26.5 100
5.1 17.3 37.2 40.4 100
4.2 11.3 33.7 50.7 100
2.5 9.5 27.9 60.2 100
1.9 4.5 21.1 72.5 100
16.7 26.7 25.9 30.7 100
Writing : % Children whoCAN correctly write
One simple dictatedsentence
I
II
III
IV
V
VI
VII
VIII
Total
Std.
III
IV
V
VI
VII
VIII
Total
Comprehension : % Readers (Level 2) who CAN
Answer atleast onequestion
Answer bothquestions
Solve atleast one
wordproblem
Solve bothword
problems
Std.
85.7 74.4 66.5 45.1
89.3 76.0 67.2 48.0
93.9 83.5 75.7 56.7
94.4 85.2 80.7 64.0
96.4 87.6 83.3 66.5
97.5 91.2 89.2 75.7
94.0 84.4 79.0 61.7
12.2
35.9
53.5
72.6
83.0
87.9
92.7
95.3
62.9
ORISSA RURAL
ASER 2006 107
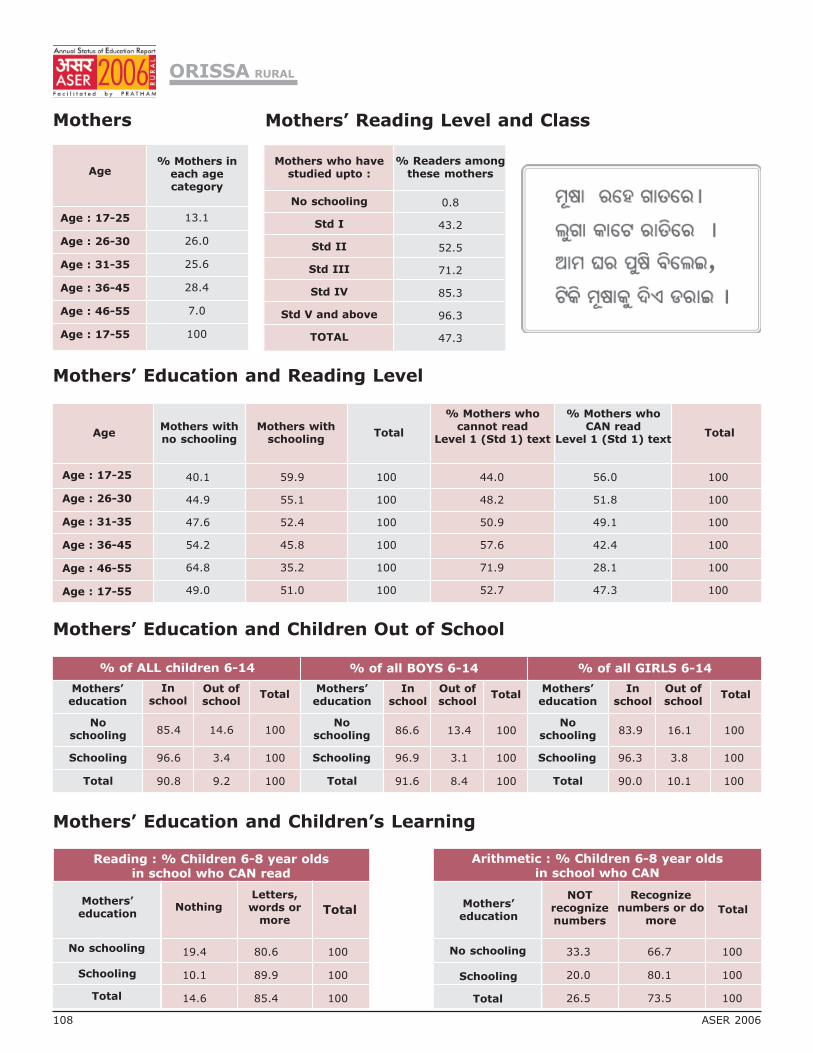
Mothers
Mothers’ Education and Children Out of School
Mothers’ Education and Children’s Learning
Age% Mothers in
each agecategory
Age : 17-25
Age : 26-30
Age : 31-35
Age : 36-45
Age : 46-55
Age : 17-55
% of ALL children 6-14 % of all BOYS 6-14 % of all GIRLS 6-14
Mothers’education
Noschooling
Schooling
Total
Mothers’education
Noschooling
Schooling
Total
Mothers’education
Noschooling
Schooling
Total
Inschool
Out ofschool
TotalIn
schoolOut ofschool
TotalIn
schoolOut ofschool
Total
Mothers’education
No schooling
Schooling
Total
Letters,words or
moreTotal
NOTrecognizenumbers
Recognizenumbers or do
moreTotal
Mothers’education
No schooling
Schooling
Total
Nothing
Mothers’ Education and Reading Level
AgeMothers withno schooling
Mothers withschooling
Total
% Mothers whocannot read
Level 1 (Std 1) text
% Mothers whoCAN read
Level 1 (Std 1) textTotal
Age : 17-25
Age : 26-30
Age : 31-35
Age : 36-45
Age : 46-55
Age : 17-55
ORISSA RURAL
13.1
26.0
25.6
28.4
7.0
100
85.4 14.6 100
96.6 3.4 100
90.8 9.2 100
86.6 13.4 100
96.9 3.1 100
91.6 8.4 100
83.9 16.1 100
96.3 3.8 100
90.0 10.1 100
19.4 80.6 100
10.1 89.9 100
14.6 85.4 100
33.3 66.7 100
20.0 80.1 100
26.5 73.5 100
40.1 59.9 100 44.0 56.0 100
44.9 55.1 100 48.2 51.8 100
47.6 52.4 100 50.9 49.1 100
54.2 45.8 100 57.6 42.4 100
64.8 35.2 100 71.9 28.1 100
49.0 51.0 100 52.7 47.3 100
Reading : % Children 6-8 year oldsin school who CAN read
Arithmetic : % Children 6-8 year oldsin school who CAN
108 ASER 2006
Mothers who havestudied upto :
% Readers amongthese mothers
No schooling
Std I
Std II
Std III
Std IV
Std V and above
TOTAL
0.8
43.2
52.5
71.2
85.3
96.3
47.3
Mothers’ Reading Level and Class
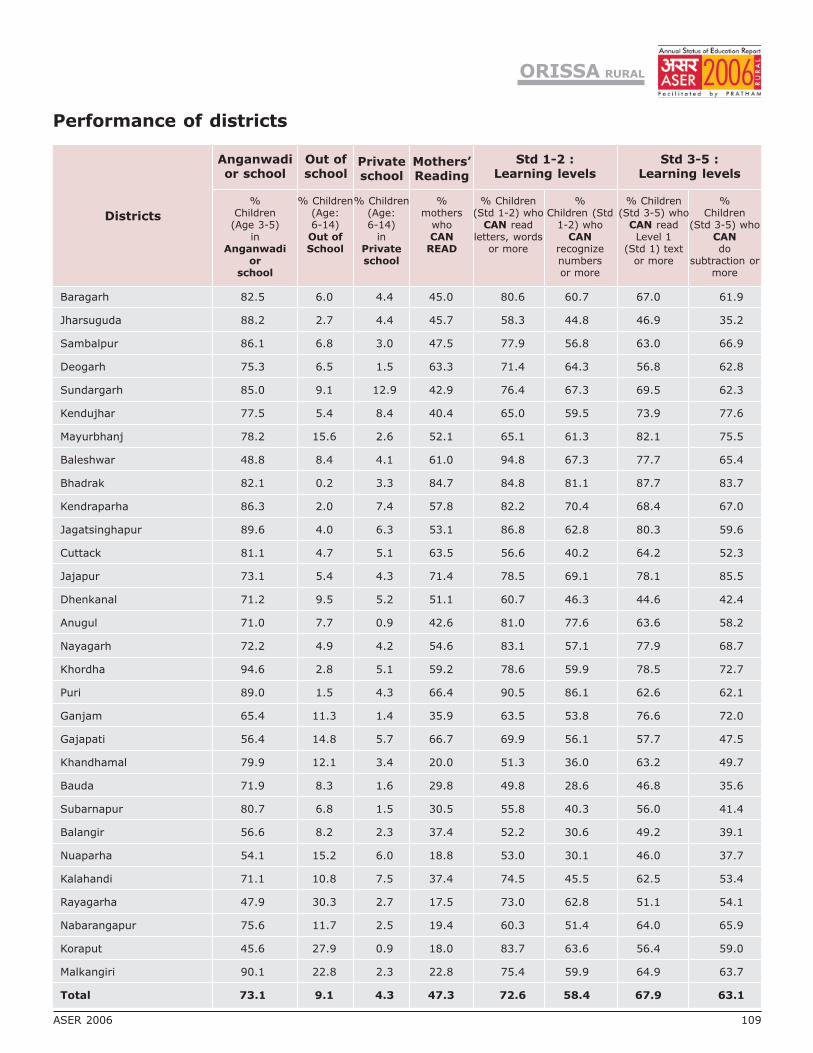
Districts
Anganwadior school
Out ofschool
Privateschool
Mothers’Reading
Std 1-2 :Learning levels
Std 3-5 :Learning levels
%Children
(Age 3-5)in
Anganwadior
school
% Children(Age:6-14)Out ofSchool
% Children(Age:6-14)
inPrivateschool
%mothers
whoCAN
READ
% Children(Std 1-2) who
CAN readletters, words
or more
% Children(Std 3-5) who
CAN readLevel 1
(Std 1) textor more
%Children (Std
1-2) whoCAN
recognizenumbersor more
%Children
(Std 3-5) whoCANdo
subtraction ormore
Performance of districts
Baragarh 82.5 6.0 4.4 45.0 80.6 60.7 67.0 61.9
Jharsuguda 88.2 2.7 4.4 45.7 58.3 44.8 46.9 35.2
Sambalpur 86.1 6.8 3.0 47.5 77.9 56.8 63.0 66.9
Deogarh 75.3 6.5 1.5 63.3 71.4 64.3 56.8 62.8
Sundargarh 85.0 9.1 12.9 42.9 76.4 67.3 69.5 62.3
Kendujhar 77.5 5.4 8.4 40.4 65.0 59.5 73.9 77.6
Mayurbhanj 78.2 15.6 2.6 52.1 65.1 61.3 82.1 75.5
Baleshwar 48.8 8.4 4.1 61.0 94.8 67.3 77.7 65.4
Bhadrak 82.1 0.2 3.3 84.7 84.8 81.1 87.7 83.7
Kendraparha 86.3 2.0 7.4 57.8 82.2 70.4 68.4 67.0
Jagatsinghapur 89.6 4.0 6.3 53.1 86.8 62.8 80.3 59.6
Cuttack 81.1 4.7 5.1 63.5 56.6 40.2 64.2 52.3
Jajapur 73.1 5.4 4.3 71.4 78.5 69.1 78.1 85.5
Dhenkanal 71.2 9.5 5.2 51.1 60.7 46.3 44.6 42.4
Anugul 71.0 7.7 0.9 42.6 81.0 77.6 63.6 58.2
Nayagarh 72.2 4.9 4.2 54.6 83.1 57.1 77.9 68.7
Khordha 94.6 2.8 5.1 59.2 78.6 59.9 78.5 72.7
Puri 89.0 1.5 4.3 66.4 90.5 86.1 62.6 62.1
Ganjam 65.4 11.3 1.4 35.9 63.5 53.8 76.6 72.0
Gajapati 56.4 14.8 5.7 66.7 69.9 56.1 57.7 47.5
Khandhamal 79.9 12.1 3.4 20.0 51.3 36.0 63.2 49.7
Bauda 71.9 8.3 1.6 29.8 49.8 28.6 46.8 35.6
Subarnapur 80.7 6.8 1.5 30.5 55.8 40.3 56.0 41.4
Balangir 56.6 8.2 2.3 37.4 52.2 30.6 49.2 39.1
Nuaparha 54.1 15.2 6.0 18.8 53.0 30.1 46.0 37.7
Kalahandi 71.1 10.8 7.5 37.4 74.5 45.5 62.5 53.4
Rayagarha 47.9 30.3 2.7 17.5 73.0 62.8 51.1 54.1
Nabarangapur 75.6 11.7 2.5 19.4 60.3 51.4 64.0 65.9
Koraput 45.6 27.9 0.9 18.0 83.7 63.6 56.4 59.0
Malkangiri 90.1 22.8 2.3 22.8 75.4 59.9 64.9 63.7
Total 73.1 9.1 4.3 47.3 72.6 58.4 67.9 63.1
ORISSA RURAL
ASER 2006 109
110 ASER 2006
Maharashtra
Andhra Pradesh
Goa
Karnataka
Kerala
Tamil Nadu
Pondicherry
ASER 2006 111

MAHARASHTRA RURAL
All analysis based on data from 33 out of 33 districts
Enrollment
Age and Class
SCHOOL ENROLLMENT AND OUT OF SCHOOL CHILDREN
% Children in each age groupin different types of schools
% Children out ofschool
Govt. Pvt.Other
(Madarsa + EGS)Not in school (Neverenrolled + drop out)
Total
Age : 7-16 ALL
Age : 7-10 ALL
Age : 7-10 BOYS
Age : 7-10 GIRLS
Age : 11-14 ALL
Age : 11-14 BOYS
Age : 11-14 GIRLS
Age : 15-16 ALL
Age : 15-16 BOYS
Age : 15-16 GIRLS
71.0 22.6 0.3 6.1 100
88.5 8.6 0.4 2.6 100
88.6 8.7 0.3 2.4 100
88.4 8.4 0.4 2.7 100
64.9 29.6 0.2 5.4 100
65.2 29.9 0.2 4.7 100
64.5 29.2 0.2 6.1 100
46.9 37.5 0.2 15.5 100
47.8 37.3 0.2 14.7 100
45.8 37.7 0.2 16.4 100
Young Children
IN BALWADI / ANGANWADI OR IN SCHOOL
% Children in pre-school or school
Age : 3 ALL
Age : 4 ALL
Age : 5 ALL
Age : 6 ALL
In
balw
ad
io
ran
gan
wad
i
In school
Govt. Pvt. Other
Not
goin
gan
yw
here
Total
84.8 0.2 15.0 100
94.4 0.3 5.3 100
90.8 4.5 0.9 0.0 3.8 100
5.7 86.0 6.5 0.2 1.5 100
I
II
III
IV
V
VI
VII
VIII
Std.5 6 7 8 9 10 11 12 13 14 15 16 Total
% Children in each standard by age
AGE BY STANDARD FOR SCHOOL CHILDREN
3.2 62.1 28.8 3.4 2.6 100
0.1 5.3 42.9 43.5 5.5 2.8 100
0.2 4.3 36.8 46.5 7.7 3.5 100
0.9 3.9 31.2 52.2 6.1 5.8 100
0.9 2.7 35.9 44.8 10.5 5.2 100
1.4 3.2 26.4 53.5 9.8 5.7 100
2.1 3.2 33.5 44.1 12.1 5.0 100
1.9 5.0 34.4 47.7 8.0 3.1 100
112 ASER 2006

Learning Level
Reading : % Children who CAN read
I
II
III
IV
V
VI
VII
VIII
Total
Std. Nothing Letter WordLevel 1(Std 1)
text
Level 2(Std 2)
text
Total
19.6 38.6 31.5 5.9 4.5 100
4.6 17.1 35.2 29.3 13.8 100
2.7 7.8 23.5 38.5 27.6 100
1.8 3.3 13.1 35.3 46.6 100
1.3 1.7 7.1 30.5 59.5 100
0.5 1.4 5.5 23.5 69.0 100
1.0 0.9 2.8 19.0 76.4 100
0.4 0.5 2.1 14.2 82.8 100
4.1 9.2 15.4 24.7 46.6 100
Std.
Arithmetic : % Children who CAN
NothingRecognizenumbers
Subtract Divide Total
I
II
III
IV
V
VI
VII
VIII
Total
36.7 53.6 7.5 2.3 100
15.2 50.0 29.5 5.3 100
7.9 37.0 41.5 13.6 100
4.9 22.0 41.9 31.2 100
2.7 15.3 37.7 44.4 100
2.1 12.3 29.8 55.9 100
2.5 9.2 24.8 63.5 100
1.2 6.9 21.1 70.9 100
9.4 26.2 29.4 35.0 100
Writing : % Children whoCAN correctly write
One simple dictatedsentence
I
II
III
IV
V
VI
VII
VIII
Total
Std.
III
IV
V
VI
VII
VIII
Total
Comprehension : % Readers (Level 2) who CAN
Answer atleast onequestion
Answer bothquestions
Solve atleast one
wordproblem
Solve bothword
problems
Std.
92.1 80.6 82.1 60.1
94.9 87.0 88.2 71.9
96.6 88.5 91.8 76.4
97.2 90.8 92.7 81.8
98.0 93.0 94.6 83.9
97.9 93.6 94.9 86.1
96.7 90.1 91.9 79.1
23.4
53.9
73.0
86.1
92.3
94.2
95.2
97.1
76.4
MAHARASHTRA RURAL
ASER 2006 113

Mothers
Mothers’ Education and Children Out of School
Mothers’ Education and Children’s Learning
Age% Mothers in
each agecategory
Age : 17-25
Age : 26-30
Age : 31-35
Age : 36-45
Age : 46-55
Age : 17-55
% of ALL children 6-14 % of all BOYS 6-14 % of all GIRLS 6-14
Mothers’education
Noschooling
Schooling
Total
Mothers’education
Noschooling
Schooling
Total
Mothers’education
Noschooling
Schooling
Total
Inschool
Out ofschool
TotalIn
schoolOut ofschool
TotalIn
schoolOut ofschool
Total
Mothers’education
No schooling
Schooling
Total
Letters,words or
moreTotal
NOTrecognizenumbers
Recognizenumbers or do
moreTotal
Mothers’education
No schooling
Schooling
Total
Nothing
Mothers who havestudied upto :
% Readers amongthese mothers
No schooling
Std I
Std II
Std III
Std IV
Std V and above
TOTAL
Mothers’ Education and Reading Level
AgeMothers withno schooling
Mothers withschooling
Total
% Mothers whocannot read
Level 1 (Std 1) text
% Mothers whoCAN read
Level 1 (Std 1) textTotal
Age : 17-25
Age : 26-30
Age : 31-35
Age : 36-45
Age : 46-55
Age : 17-55
MAHARASHTRA RURAL
18.3
30.5
26.5
20.9
3.9
100
93.6 6.4 100
98.1 1.9 100
96.4 3.6 100
94.6 5.4 100
98.1 2.0 100
96.7 3.3 100
92.6 7.4 100
98.2 1.8 100
96.0 4.0 100
15.4 84.6 100
8.5 91.5 100
10.9 89.1 100
28.8 71.2 100
20.0 80.0 100
23.1 76.9 100
22.3 77.7 100 24.6 75.4 100
29.6 70.4 100 32.0 68.0 100
38.2 61.8 100 40.4 59.6 100
51.1 48.9 100 53.0 47.1 100
61.9 38.1 100 64.2 35.8 100
36.3 63.7 100 38.5 61.5 100
0.3
62.8
74.2
83.4
93.5
98.8
61.3
Reading : % Children 6-8 year oldsin school who CAN read
Arithmetic : % Children 6-8 year oldsin school who CAN
Mothers’ Reading Level and Class
114 ASER 2006
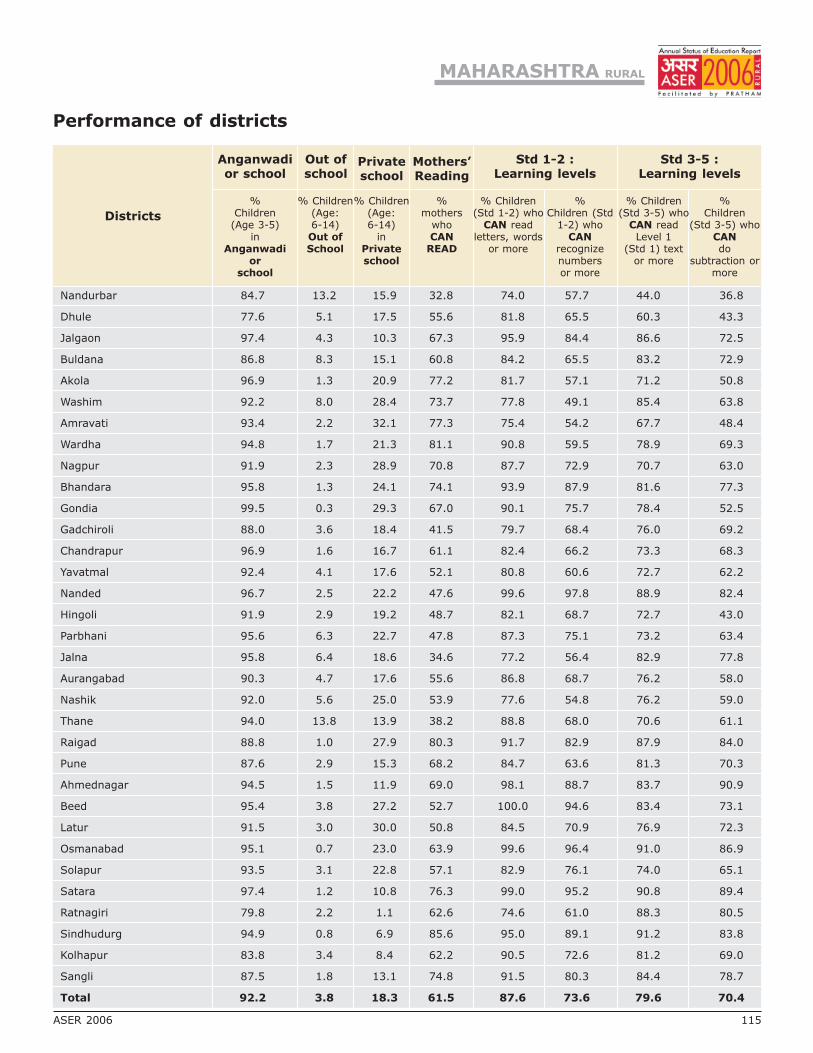
Districts
Anganwadior school
Out ofschool
Privateschool
Mothers’Reading
Std 1-2 :Learning levels
Std 3-5 :Learning levels
%Children
(Age 3-5)in
Anganwadior
school
% Children(Age:6-14)Out ofSchool
% Children(Age:6-14)
inPrivateschool
%mothers
whoCAN
READ
% Children(Std 1-2) who
CAN readletters, words
or more
% Children(Std 3-5) who
CAN readLevel 1
(Std 1) textor more
%Children (Std
1-2) whoCAN
recognizenumbersor more
%Children
(Std 3-5) whoCANdo
subtraction ormore
Performance of districts
Nandurbar 84.7 13.2 15.9 32.8 74.0 57.7 44.0 36.8
Dhule 77.6 5.1 17.5 55.6 81.8 65.5 60.3 43.3
Jalgaon 97.4 4.3 10.3 67.3 95.9 84.4 86.6 72.5
Buldana 86.8 8.3 15.1 60.8 84.2 65.5 83.2 72.9
Akola 96.9 1.3 20.9 77.2 81.7 57.1 71.2 50.8
Washim 92.2 8.0 28.4 73.7 77.8 49.1 85.4 63.8
Amravati 93.4 2.2 32.1 77.3 75.4 54.2 67.7 48.4
Wardha 94.8 1.7 21.3 81.1 90.8 59.5 78.9 69.3
Nagpur 91.9 2.3 28.9 70.8 87.7 72.9 70.7 63.0
Bhandara 95.8 1.3 24.1 74.1 93.9 87.9 81.6 77.3
Gondia 99.5 0.3 29.3 67.0 90.1 75.7 78.4 52.5
Gadchiroli 88.0 3.6 18.4 41.5 79.7 68.4 76.0 69.2
Chandrapur 96.9 1.6 16.7 61.1 82.4 66.2 73.3 68.3
Yavatmal 92.4 4.1 17.6 52.1 80.8 60.6 72.7 62.2
Nanded 96.7 2.5 22.2 47.6 99.6 97.8 88.9 82.4
Hingoli 91.9 2.9 19.2 48.7 82.1 68.7 72.7 43.0
Parbhani 95.6 6.3 22.7 47.8 87.3 75.1 73.2 63.4
Jalna 95.8 6.4 18.6 34.6 77.2 56.4 82.9 77.8
Aurangabad 90.3 4.7 17.6 55.6 86.8 68.7 76.2 58.0
Nashik 92.0 5.6 25.0 53.9 77.6 54.8 76.2 59.0
Thane 94.0 13.8 13.9 38.2 88.8 68.0 70.6 61.1
Raigad 88.8 1.0 27.9 80.3 91.7 82.9 87.9 84.0
Pune 87.6 2.9 15.3 68.2 84.7 63.6 81.3 70.3
Ahmednagar 94.5 1.5 11.9 69.0 98.1 88.7 83.7 90.9
Beed 95.4 3.8 27.2 52.7 100.0 94.6 83.4 73.1
Latur 91.5 3.0 30.0 50.8 84.5 70.9 76.9 72.3
Osmanabad 95.1 0.7 23.0 63.9 99.6 96.4 91.0 86.9
Solapur 93.5 3.1 22.8 57.1 82.9 76.1 74.0 65.1
Satara 97.4 1.2 10.8 76.3 99.0 95.2 90.8 89.4
Ratnagiri 79.8 2.2 1.1 62.6 74.6 61.0 88.3 80.5
Sindhudurg 94.9 0.8 6.9 85.6 95.0 89.1 91.2 83.8
Kolhapur 83.8 3.4 8.4 62.2 90.5 72.6 81.2 69.0
Sangli 87.5 1.8 13.1 74.8 91.5 80.3 84.4 78.7
Total 92.2 3.8 18.3 61.5 87.6 73.6 79.6 70.4
MAHARASHTRA RURAL
ASER 2006 115

ANDHRA PRADESH RURAL
All analysis based on data from 22 out of 22 districts
Enrollment
Age and Class
SCHOOL ENROLLMENT AND OUT OF SCHOOL CHILDREN
% Children in each age groupin different types of schools
% Children out ofschool
Govt. Pvt.Other
(Madarsa + EGS)Not in school (Neverenrolled + drop out)
Total
Age : 7-16 ALL
Age : 7-10 ALL
Age : 7-10 BOYS
Age : 7-10 GIRLS
Age : 11-14 ALL
Age : 11-14 BOYS
Age : 11-14 GIRLS
Age : 15-16 ALL
Age : 15-16 BOYS
Age : 15-16 GIRLS
76.4 16.8 0.2 6.6 100
76.7 21.4 0.3 1.6 100
75.1 23.3 0.3 1.3 100
78.4 19.5 0.3 1.9 100
79.2 13.6 0.1 7.1 100
78.6 15.8 0.1 5.6 100
79.9 11.4 0.1 8.6 100
68.5 13.8 0.1 17.6 100
69.4 14.0 0.1 16.5 100
67.4 13.6 0.1 19.0 100
Young Children
IN BALWADI / ANGANWADI OR IN SCHOOL
% Children in pre-school or school
Age : 3 ALL
Age : 4 ALL
Age : 5 ALL
Age : 6 ALL
In
balw
ad
io
ran
gan
wad
i
In school
Govt. Pvt. Other
Not
goin
gan
yw
here
Total
75.9 3.8 20.3 100
78.8 10.6 10.6 100
35.2 37.9 23.2 0.1 3.7 100
8.6 61.7 27.3 0.1 2.2 100
I
II
III
IV
V
VI
VII
VIII
Std.5 6 7 8 9 10 11 12 13 14 15 16 Total
% Children in each standard by age
AGE BY STANDARD FOR SCHOOL CHILDREN
26.0 49.6 16.2 4.9 1.4 2.0 100
2.5 15.7 52.5 19.9 4.8 2.4 2.1 100
1.0 2.7 11.9 55.4 18.6 6.8 1.0 2.5 100
0.7 2.7 14.7 50.8 21.5 5.0 2.7 1.9 100
1.3 2.8 9.7 59.2 15.0 6.8 1.7 3.5 100
1.9 2.7 13.0 47.2 27.2 4.9 1.8 1.4 100
1.9 2.2 8.7 58.3 20.0 5.5 2.5 1.0 100
1.8 2.2 13.0 58.0 19.1 4.0 1.9 100
116 ASER 2006
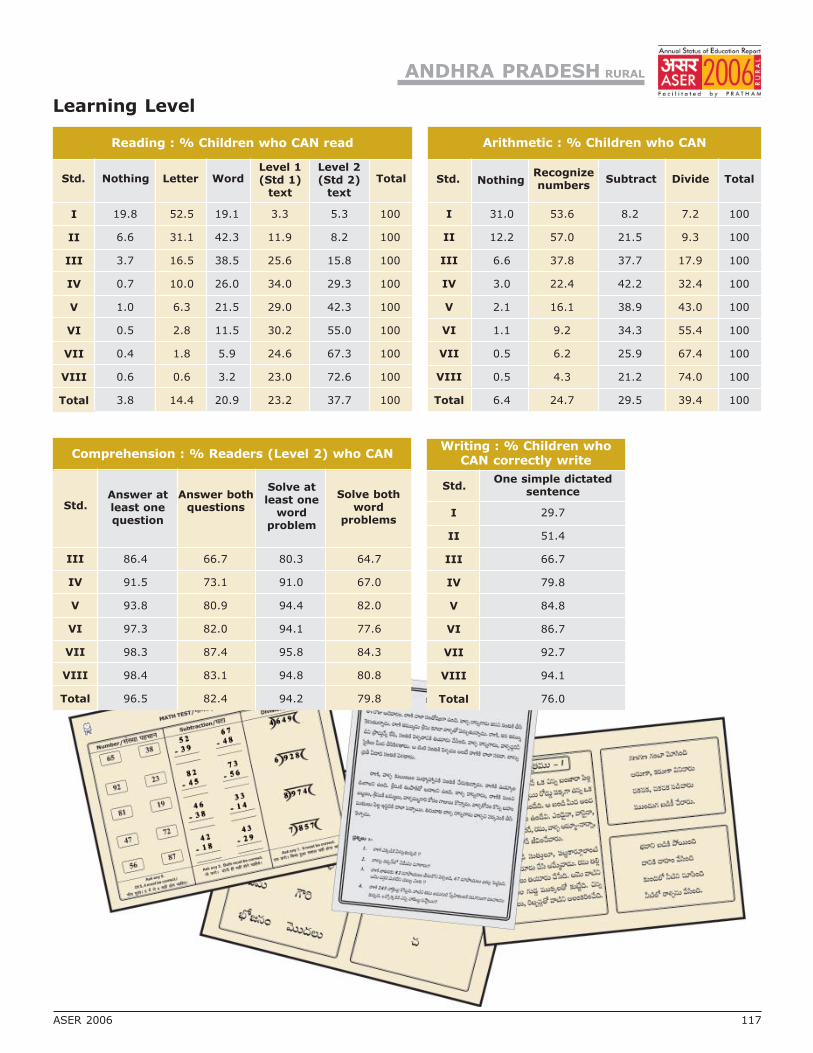
Learning Level
Reading : % Children who CAN read
I
II
III
IV
V
VI
VII
VIII
Total
Std. Nothing Letter WordLevel 1(Std 1)
text
Level 2(Std 2)
text
Total
19.8 52.5 19.1 3.3 5.3 100
6.6 31.1 42.3 11.9 8.2 100
3.7 16.5 38.5 25.6 15.8 100
0.7 10.0 26.0 34.0 29.3 100
1.0 6.3 21.5 29.0 42.3 100
0.5 2.8 11.5 30.2 55.0 100
0.4 1.8 5.9 24.6 67.3 100
0.6 0.6 3.2 23.0 72.6 100
3.8 14.4 20.9 23.2 37.7 100
Std.
Arithmetic : % Children who CAN
NothingRecognizenumbers
Subtract Divide Total
I
II
III
IV
V
VI
VII
VIII
Total
31.0 53.6 8.2 7.2 100
12.2 57.0 21.5 9.3 100
6.6 37.8 37.7 17.9 100
3.0 22.4 42.2 32.4 100
2.1 16.1 38.9 43.0 100
1.1 9.2 34.3 55.4 100
0.5 6.2 25.9 67.4 100
0.5 4.3 21.2 74.0 100
6.4 24.7 29.5 39.4 100
Writing : % Children whoCAN correctly write
One simple dictatedsentence
I
II
III
IV
V
VI
VII
VIII
Total
Std.
III
IV
V
VI
VII
VIII
Total
Comprehension : % Readers (Level 2) who CAN
Answer atleast onequestion
Answer bothquestions
Solve atleast one
wordproblem
Solve bothword
problems
Std.
86.4 66.7 80.3 64.7
91.5 73.1 91.0 67.0
93.8 80.9 94.4 82.0
97.3 82.0 94.1 77.6
98.3 87.4 95.8 84.3
98.4 83.1 94.8 80.8
96.5 82.4 94.2 79.8
29.7
51.4
66.7
79.8
84.8
86.7
92.7
94.1
76.0
ANDHRA PRADESH RURAL
ASER 2006 117
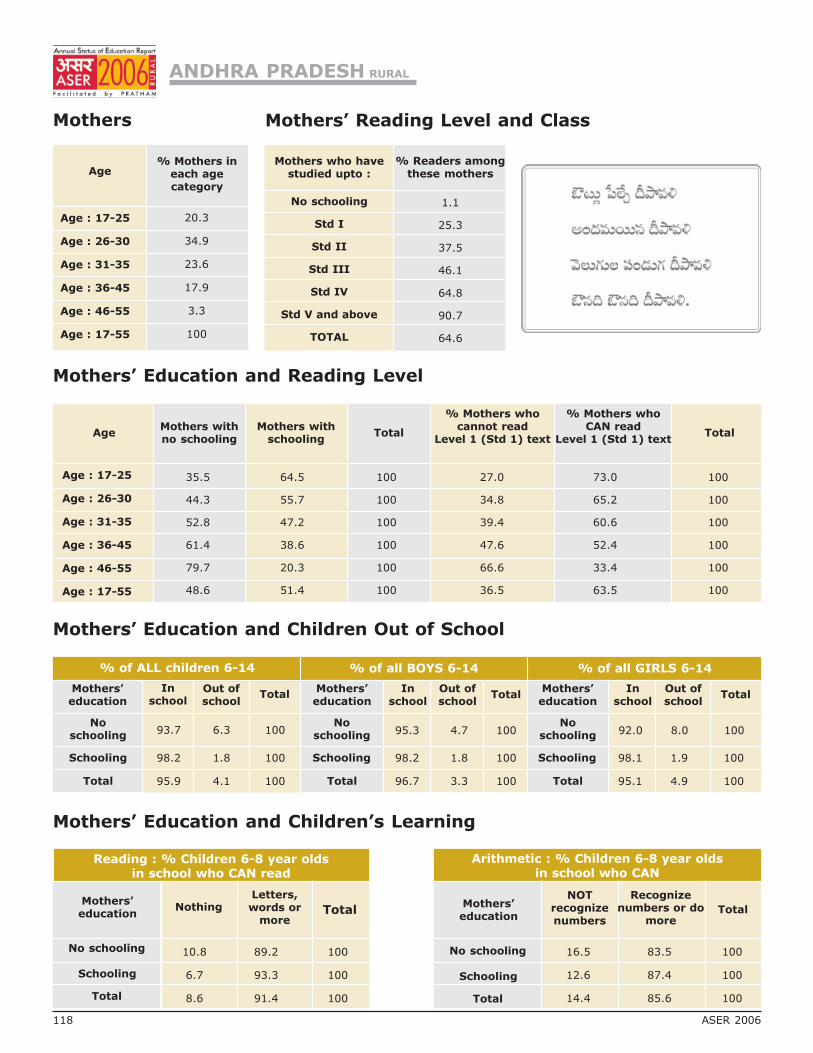
Mothers
Mothers’ Education and Children Out of School
Mothers’ Education and Children’s Learning
Age% Mothers in
each agecategory
Age : 17-25
Age : 26-30
Age : 31-35
Age : 36-45
Age : 46-55
Age : 17-55
% of ALL children 6-14 % of all BOYS 6-14 % of all GIRLS 6-14
Mothers’education
Noschooling
Schooling
Total
Mothers’education
Noschooling
Schooling
Total
Mothers’education
Noschooling
Schooling
Total
Inschool
Out ofschool
TotalIn
schoolOut ofschool
TotalIn
schoolOut ofschool
Total
Mothers’education
No schooling
Schooling
Total
Letters,words or
moreTotal
NOTrecognizenumbers
Recognizenumbers or do
moreTotal
Mothers’education
No schooling
Schooling
Total
Nothing
Mothers’ Education and Reading Level
AgeMothers withno schooling
Mothers withschooling
Total
% Mothers whocannot read
Level 1 (Std 1) text
% Mothers whoCAN read
Level 1 (Std 1) textTotal
Age : 17-25
Age : 26-30
Age : 31-35
Age : 36-45
Age : 46-55
Age : 17-55
ANDHRA PRADESH RURAL
20.3
34.9
23.6
17.9
3.3
100
93.7 6.3 100
98.2 1.8 100
95.9 4.1 100
95.3 4.7 100
98.2 1.8 100
96.7 3.3 100
92.0 8.0 100
98.1 1.9 100
95.1 4.9 100
10.8 89.2 100
6.7 93.3 100
8.6 91.4 100
16.5 83.5 100
12.6 87.4 100
14.4 85.6 100
35.5 64.5 100 27.0 73.0 100
44.3 55.7 100 34.8 65.2 100
52.8 47.2 100 39.4 60.6 100
61.4 38.6 100 47.6 52.4 100
79.7 20.3 100 66.6 33.4 100
48.6 51.4 100 36.5 63.5 100
Reading : % Children 6-8 year oldsin school who CAN read
Arithmetic : % Children 6-8 year oldsin school who CAN
118 ASER 2006
Mothers who havestudied upto :
% Readers amongthese mothers
No schooling
Std I
Std II
Std III
Std IV
Std V and above
TOTAL
1.1
25.3
37.5
46.1
64.8
90.7
64.6
Mothers’ Reading Level and Class
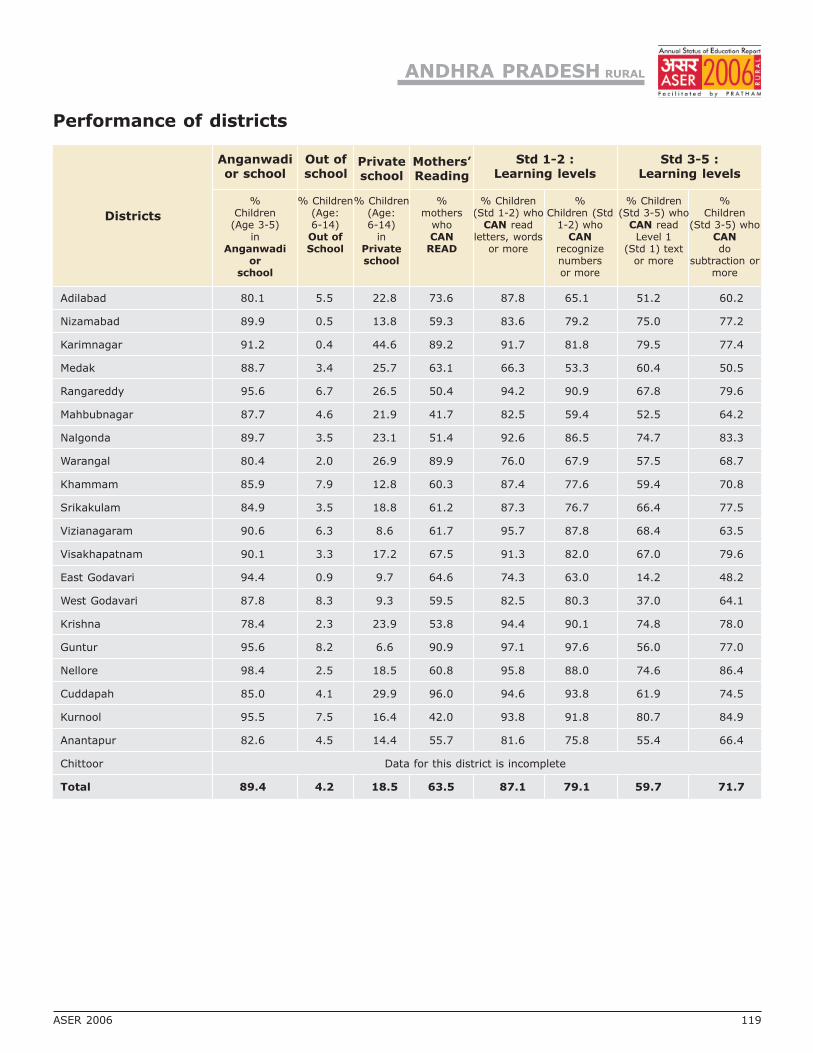
Districts
Anganwadior school
Out ofschool
Privateschool
Mothers’Reading
Std 1-2 :Learning levels
Std 3-5 :Learning levels
%Children
(Age 3-5)in
Anganwadior
school
% Children(Age:6-14)Out ofSchool
% Children(Age:6-14)
inPrivateschool
%mothers
whoCAN
READ
% Children(Std 1-2) who
CAN readletters, words
or more
% Children(Std 3-5) who
CAN readLevel 1
(Std 1) textor more
%Children (Std
1-2) whoCAN
recognizenumbersor more
%Children
(Std 3-5) whoCANdo
subtraction ormore
Performance of districts
Adilabad 80.1 5.5 22.8 73.6 87.8 65.1 51.2 60.2
Nizamabad 89.9 0.5 13.8 59.3 83.6 79.2 75.0 77.2
Karimnagar 91.2 0.4 44.6 89.2 91.7 81.8 79.5 77.4
Medak 88.7 3.4 25.7 63.1 66.3 53.3 60.4 50.5
Rangareddy 95.6 6.7 26.5 50.4 94.2 90.9 67.8 79.6
Mahbubnagar 87.7 4.6 21.9 41.7 82.5 59.4 52.5 64.2
Nalgonda 89.7 3.5 23.1 51.4 92.6 86.5 74.7 83.3
Warangal 80.4 2.0 26.9 89.9 76.0 67.9 57.5 68.7
Khammam 85.9 7.9 12.8 60.3 87.4 77.6 59.4 70.8
Srikakulam 84.9 3.5 18.8 61.2 87.3 76.7 66.4 77.5
Vizianagaram 90.6 6.3 8.6 61.7 95.7 87.8 68.4 63.5
Visakhapatnam 90.1 3.3 17.2 67.5 91.3 82.0 67.0 79.6
East Godavari 94.4 0.9 9.7 64.6 74.3 63.0 14.2 48.2
West Godavari 87.8 8.3 9.3 59.5 82.5 80.3 37.0 64.1
Krishna 78.4 2.3 23.9 53.8 94.4 90.1 74.8 78.0
Guntur 95.6 8.2 6.6 90.9 97.1 97.6 56.0 77.0
Nellore 98.4 2.5 18.5 60.8 95.8 88.0 74.6 86.4
Cuddapah 85.0 4.1 29.9 96.0 94.6 93.8 61.9 74.5
Kurnool 95.5 7.5 16.4 42.0 93.8 91.8 80.7 84.9
Anantapur 82.6 4.5 14.4 55.7 81.6 75.8 55.4 66.4
Chittoor Data for this district is incomplete
Total 89.4 4.2 18.5 63.5 87.1 79.1 59.7 71.7
ANDHRA PRADESH RURAL
ASER 2006 119

GOA RURAL
All analysis based on data from 2 out of 2 districts
Enrollment
Age and Class
SCHOOL ENROLLMENT AND OUT OF SCHOOL CHILDREN
% Children in each age groupin different types of schools
% Children out ofschool
Govt. Pvt.Other
(Madarsa + EGS)Not in school (Neverenrolled + drop out)
Total
Age : 7-16 ALL
Age : 7-10 ALL
Age : 7-10 BOYS
Age : 7-10 GIRLS
Age : 11-14 ALL
Age : 11-14 BOYS
Age : 11-14 GIRLS
Age : 15-16 ALL
Age : 15-16 BOYS
Age : 15-16 GIRLS
52.9 44.6 0.9 1.6 100
58.3 40.9 0.0 0.8 100
61.9 37.1 0.0 1.0 100
55.0 44.4 0.0 0.6 100
52.2 45.0 0.9 1.9 100
51.3 46.0 1.3 1.4 100
53.0 44.1 0.6 2.3 100
44.5 50.3 2.6 2.5 100
44.3 51.1 1.9 2.7 100
44.8 49.4 3.5 2.3 100
Young Children
IN BALWADI / ANGANWADI OR IN SCHOOL
% Children in pre-school or school
Age : 3 ALL
Age : 4 ALL
Age : 5 ALL
Age : 6 ALL
In
balw
ad
io
ran
gan
wad
i
In school
Govt. Pvt. Other
Not
goin
gan
yw
here
Total
88.2 0.0 11.8 100
92.3 0.0 7.7 100
88.9 4.9 1.2 0.0 4.9 100
3.0 49.6 41.3 0.0 6.1 100
I
II
III
IV
V
VI
VII
VIII
Std.5 6 7 8 9 10 11 12 13 14 15 16 Total
% Children in each standard by age
AGE BY STANDARD FOR SCHOOL CHILDREN
2.5 64.5 27.3 1.6 4.1 100
0.0 5.2 42.1 47.0 3.3 2.4 100
1.5 3.2 46.1 43.0 5.5 0.8 100
1.6 4.4 45.4 40.4 2.1 6.2 100
1.8 3.2 59.4 26.3 6.3 2.9 100
0.0 14.9 31.5 34.5 10.1 9.0 100
1.7 12.2 43.2 31.1 7.4 4.4 100
3.1 14.2 38.2 31.7 9.8 3.1 100
120 ASER 2006

Learning Level
Reading : % Children who CAN read
I
II
III
IV
V
VI
VII
VIII
Total
Std. Nothing Letter WordLevel 1(Std 1)
text
Level 2(Std 2)
text
Total
3.5 31.2 36.8 14.4 14.3 100
3.4 12.9 35.5 33.2 15.0 100
0.0 3.5 22.7 28.1 45.7 100
0.0 0.8 7.3 23.8 68.1 100
0.0 2.1 3.5 28.1 66.3 100
0.0 0.0 1.5 19.8 78.7 100
0.0 0.0 3.4 10.8 85.8 100
0.0 0.0 0.7 5.6 93.7 100
0.8 6.0 13.2 20.3 59.8 100
Std.
Arithmetic : % Children who CAN
NothingRecognizenumbers
Subtract Divide Total
I
II
III
IV
V
VI
VII
VIII
Total
22.7 51.8 14.8 10.7 100
15.4 39.4 34.1 11.1 100
7.2 19.0 40.1 33.7 100
4.5 8.3 31.7 55.5 100
3.2 9.1 30.4 57.3 100
0.0 3.5 15.0 81.5 100
0.8 2.5 13.8 82.8 100
0.0 1.5 4.1 94.5 100
6.4 16.2 22.9 54.5 100
Writing : % Children whoCAN correctly write
One simple dictatedsentence
I
II
III
IV
V
VI
VII
VIII
Total
Std.
III
IV
V
VI
VII
VIII
Total
Comprehension : % Readers (Level 2) who CAN
Answer atleast onequestion
Answer bothquestions
Solve atleast one
wordproblem
Solve bothword
problems
Std.
83.1 63.1 79.6 72.7
95.4 82.2 88.3 72.3
92.8 86.1 90.9 81.4
99.0 92.3 97.5 89.6
100 98.0 96.8 93.6
99.2 97.1 100.0 97.1
96.2 89.2 93.8 86.6
50.5
83.0
91.3
98.4
97.2
99.2
99.2
100
90.3
GOA RURAL
ASER 2006 121

Mothers
Mothers’ Education and Children Out of School
Mothers’ Education and Children’s Learning
Age% Mothers in
each agecategory
Age : 17-25
Age : 26-30
Age : 31-35
Age : 36-45
Age : 46-55
Age : 17-55
% of ALL children 6-14 % of all BOYS 6-14 % of all GIRLS 6-14
Mothers’education
Noschooling
Schooling
Total
Mothers’education
Noschooling
Schooling
Total
Mothers’education
Noschooling
Schooling
Total
Inschool
Out ofschool
TotalIn
schoolOut ofschool
TotalIn
schoolOut ofschool
Total
Mothers’education
No schooling
Schooling
Total
Letters,words or
moreTotal
NOTrecognizenumbers
Recognizenumbers or do
moreTotal
Mothers’education
No schooling
Schooling
Total
Nothing
Mothers’ Education and Reading Level
AgeMothers withno schooling
Mothers withschooling
Total
% Mothers whocannot read
Level 1 (Std 1) text
% Mothers whoCAN read
Level 1 (Std 1) textTotal
Age : 17-25
Age : 26-30
Age : 31-35
Age : 36-45
Age : 46-55
Age : 17-55
GOA RURAL
7.8
20.2
27.1
38.5
6.4
100
99.3 0.7 100
98.0 2.0 100
98.3 1.7 100
100 0.0 100
97.8 2.2 100
98.3 1.8 100
98.6 1.4 100
98.3 1.7 100
98.3 1.7 100
4.0 96.0 100
2.7 97.3 100
2.9 97.1 100
20.9 79.1 100
14.6 85.4 100
16.0 84.0 100
17.9 82.2 100 17.9 82.2 100
15.0 85.0 100 14.5 85.5 100
12.3 87.7 100 13.4 86.6 100
21.1 78.9 100 21.7 78.3 100
38.4 61.6 100 43.9 56.1 100
18.3 81.7 100 19.1 80.9 100
Reading : % Children 6-8 year oldsin school who CAN read
Arithmetic : % Children 6-8 year oldsin school who CAN
122 ASER 2006
Mothers who havestudied upto :
% Readers amongthese mothers
No schooling
Std I
Std II
Std III
Std IV
Std V and above
TOTAL
1.8
100
82.5
92.6
100.0
99.6
80.8
Mothers’ Reading Level and Class

Districts
Anganwadior school
Out ofschool
Privateschool
Mothers’Reading
Std 1-2 :Learning levels
Std 3-5 :Learning levels
%Children
(Age 3-5)in
Anganwadior
school
% Children(Age:6-14)Out ofSchool
% Children(Age:6-14)
inPrivateschool
%mothers
whoCAN
READ
% Children(Std 1-2) who
CAN readletters, words
or more
% Children(Std 3-5) who
CAN readLevel 1
(Std 1) textor more
%Children (Std
1-2) whoCAN
recognizenumbersor more
%Children
(Std 3-5) whoCANdo
subtraction ormore
Performance of districts
GOA RURAL
North Goa 88.9 2.6 38.4 85.8 96.1 74.7 88.7 82.3
South Goa 95.8 0.5 48.0 74.7 97.2 87.9 84.5 83.9
Total 92.3 1.6 43.0 80.9 96.6 80.7 86.8 83.0
ASER 2006 123

KARNATAKA RURAL
All analysis based on data from 27 out of 27 districts
Enrollment
Age and Class
SCHOOL ENROLLMENT AND OUT OF SCHOOL CHILDREN
% Children in each age groupin different types of schools
% Children out ofschool
Govt. Pvt.Other
(Madarsa + EGS)Not in school (Neverenrolled + drop out)
Total
Age : 7-16 ALL
Age : 7-10 ALL
Age : 7-10 BOYS
Age : 7-10 GIRLS
Age : 11-14 ALL
Age : 11-14 BOYS
Age : 11-14 GIRLS
Age : 15-16 ALL
Age : 15-16 BOYS
Age : 15-16 GIRLS
75.9 16.6 0.3 7.2 100
81.9 14.6 0.5 3.0 100
81.5 15.8 0.3 2.4 100
82.4 13.4 0.6 3.6 100
76.2 16.5 0.3 7.1 100
76.8 16.9 0.3 6.1 100
75.6 16.1 0.3 8.0 100
59.8 22.1 0.1 18.1 100
59.1 21.9 0.0 19.0 100
60.4 22.2 0.1 17.4 100
Young Children
IN BALWADI / ANGANWADI OR IN SCHOOL
% Children in pre-school or school
Age : 3 ALL
Age : 4 ALL
Age : 5 ALL
Age : 6 ALL
In
balw
ad
io
ran
gan
wad
i
In school
Govt. Pvt. Other
Not
goin
gan
yw
here
Total
76.0 0.0 24.0 100
90.7 0.3 8.9 100
76.8 9.6 5.7 0.9 7.0 100
10.4 68.2 18.3 0.5 2.7 100
I
II
III
IV
V
VI
VII
VIII
Std.5 6 7 8 9 10 11 12 13 14 15 16 Total
% Children in each standard by age
AGE BY STANDARD FOR SCHOOL CHILDREN
6.9 63.2 26.3 2.6 1.1 100
0.5 5.7 41.3 47.2 2.5 2.9 100
0.9 6.4 38.7 47.2 4.4 2.3 100
1.5 8.8 32.3 51.8 3.3 2.3 100
1.8 5.5 40.0 45.5 4.6 2.7 100
1.9 7.5 31.2 54.1 3.8 1.5 100
2.2 6.7 35.7 43.0 9.6 2.9 100
2.2 9.9 35.1 47.2 4.7 1.0 100
124 ASER 2006
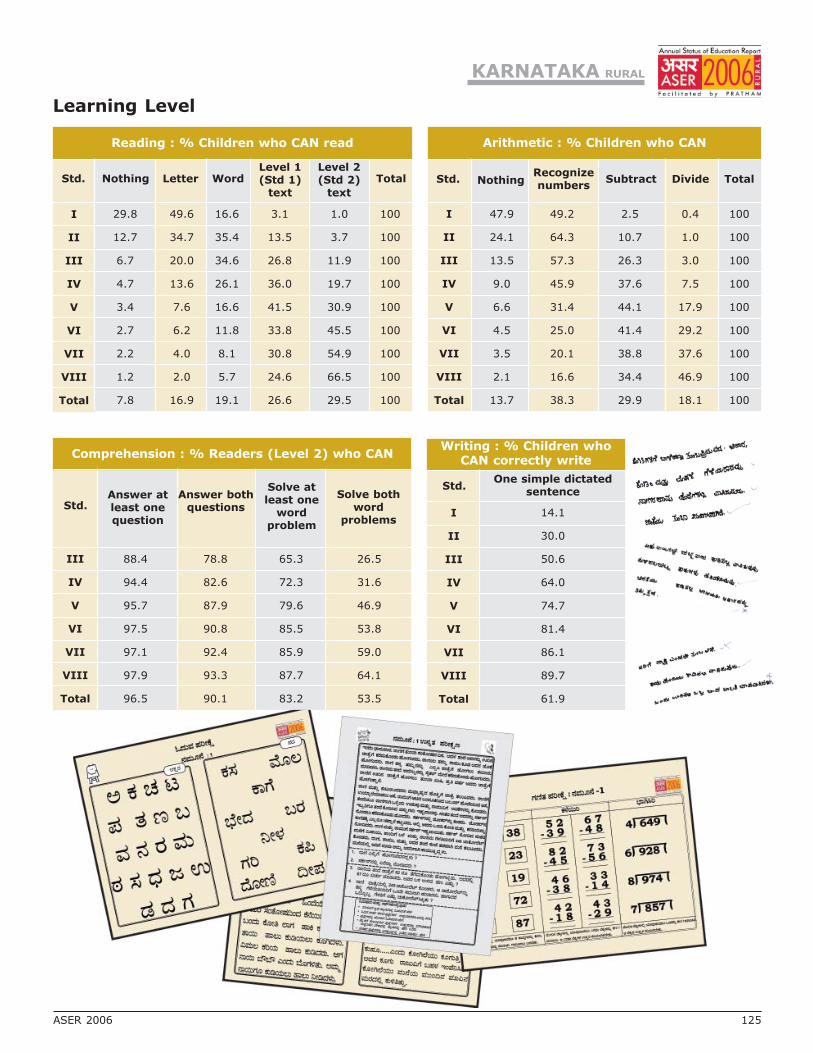
Learning Level
Reading : % Children who CAN read
I
II
III
IV
V
VI
VII
VIII
Total
Std. Nothing Letter WordLevel 1(Std 1)
text
Level 2(Std 2)
text
Total
29.8 49.6 16.6 3.1 1.0 100
12.7 34.7 35.4 13.5 3.7 100
6.7 20.0 34.6 26.8 11.9 100
4.7 13.6 26.1 36.0 19.7 100
3.4 7.6 16.6 41.5 30.9 100
2.7 6.2 11.8 33.8 45.5 100
2.2 4.0 8.1 30.8 54.9 100
1.2 2.0 5.7 24.6 66.5 100
7.8 16.9 19.1 26.6 29.5 100
Std.
Arithmetic : % Children who CAN
NothingRecognizenumbers
Subtract Divide Total
I
II
III
IV
V
VI
VII
VIII
Total
47.9 49.2 2.5 0.4 100
24.1 64.3 10.7 1.0 100
13.5 57.3 26.3 3.0 100
9.0 45.9 37.6 7.5 100
6.6 31.4 44.1 17.9 100
4.5 25.0 41.4 29.2 100
3.5 20.1 38.8 37.6 100
2.1 16.6 34.4 46.9 100
13.7 38.3 29.9 18.1 100
Writing : % Children whoCAN correctly write
One simple dictatedsentence
I
II
III
IV
V
VI
VII
VIII
Total
Std.
III
IV
V
VI
VII
VIII
Total
Comprehension : % Readers (Level 2) who CAN
Answer atleast onequestion
Answer bothquestions
Solve atleast one
wordproblem
Solve bothword
problems
Std.
88.4 78.8 65.3 26.5
94.4 82.6 72.3 31.6
95.7 87.9 79.6 46.9
97.5 90.8 85.5 53.8
97.1 92.4 85.9 59.0
97.9 93.3 87.7 64.1
96.5 90.1 83.2 53.5
14.1
30.0
50.6
64.0
74.7
81.4
86.1
89.7
61.9
KARNATAKA RURAL
ASER 2006 125
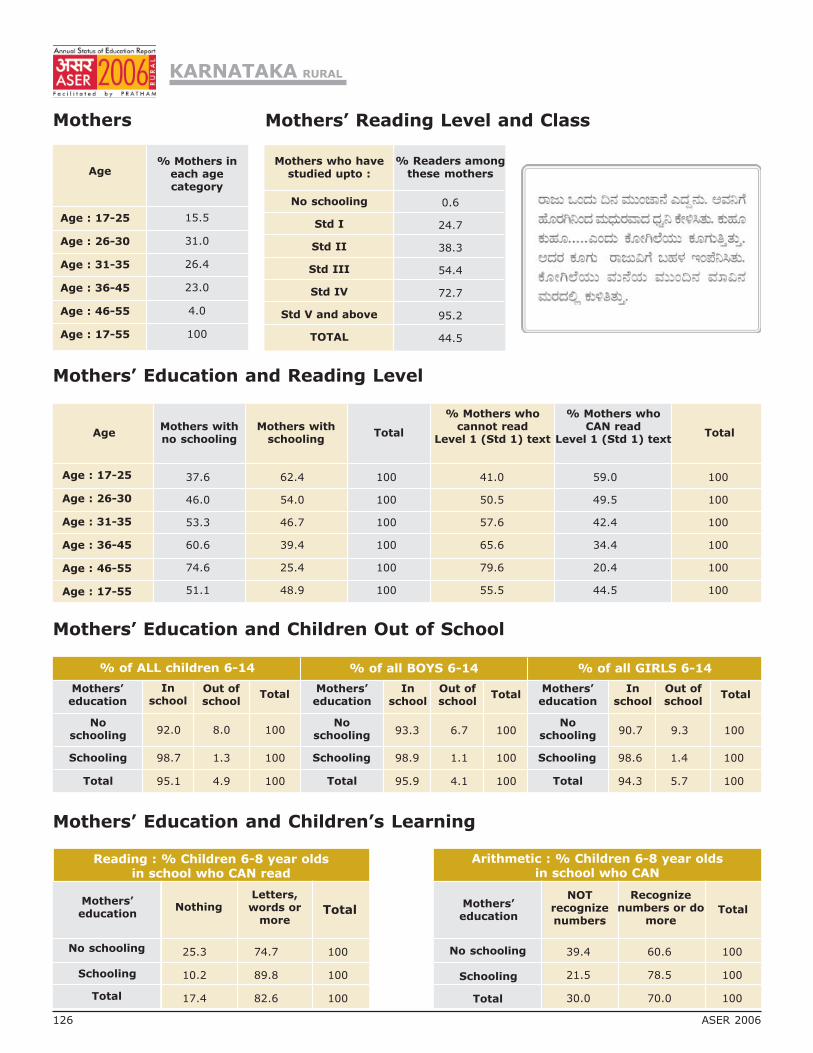
Mothers
Mothers’ Education and Children Out of School
Mothers’ Education and Children’s Learning
Age% Mothers in
each agecategory
Age : 17-25
Age : 26-30
Age : 31-35
Age : 36-45
Age : 46-55
Age : 17-55
% of ALL children 6-14 % of all BOYS 6-14 % of all GIRLS 6-14
Mothers’education
Noschooling
Schooling
Total
Mothers’education
Noschooling
Schooling
Total
Mothers’education
Noschooling
Schooling
Total
Inschool
Out ofschool
TotalIn
schoolOut ofschool
TotalIn
schoolOut ofschool
Total
Mothers’education
No schooling
Schooling
Total
Letters,words or
moreTotal
NOTrecognizenumbers
Recognizenumbers or do
moreTotal
Mothers’education
No schooling
Schooling
Total
Nothing
Mothers’ Education and Reading Level
AgeMothers withno schooling
Mothers withschooling
Total
% Mothers whocannot read
Level 1 (Std 1) text
% Mothers whoCAN read
Level 1 (Std 1) textTotal
Age : 17-25
Age : 26-30
Age : 31-35
Age : 36-45
Age : 46-55
Age : 17-55
KARNATAKA RURAL
15.5
31.0
26.4
23.0
4.0
100
92.0 8.0 100
98.7 1.3 100
95.1 4.9 100
93.3 6.7 100
98.9 1.1 100
95.9 4.1 100
90.7 9.3 100
98.6 1.4 100
94.3 5.7 100
25.3 74.7 100
10.2 89.8 100
17.4 82.6 100
39.4 60.6 100
21.5 78.5 100
30.0 70.0 100
37.6 62.4 100 41.0 59.0 100
46.0 54.0 100 50.5 49.5 100
53.3 46.7 100 57.6 42.4 100
60.6 39.4 100 65.6 34.4 100
74.6 25.4 100 79.6 20.4 100
51.1 48.9 100 55.5 44.5 100
Reading : % Children 6-8 year oldsin school who CAN read
Arithmetic : % Children 6-8 year oldsin school who CAN
126 ASER 2006
Mothers who havestudied upto :
% Readers amongthese mothers
No schooling
Std I
Std II
Std III
Std IV
Std V and above
TOTAL
0.6
24.7
38.3
54.4
72.7
95.2
44.5
Mothers’ Reading Level and Class
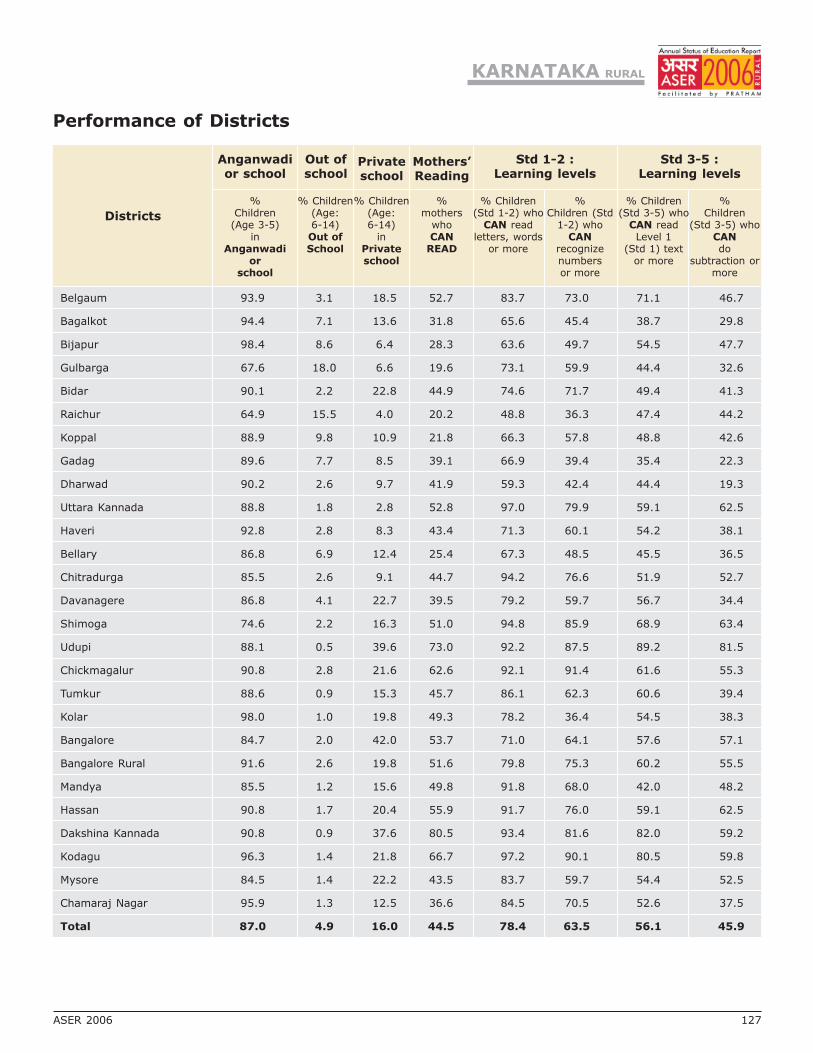
Districts
Anganwadior school
Out ofschool
Privateschool
Mothers’Reading
Std 1-2 :Learning levels
Std 3-5 :Learning levels
%Children
(Age 3-5)in
Anganwadior
school
% Children(Age:6-14)Out ofSchool
% Children(Age:6-14)
inPrivateschool
%mothers
whoCAN
READ
% Children(Std 1-2) who
CAN readletters, words
or more
% Children(Std 3-5) who
CAN readLevel 1
(Std 1) textor more
%Children (Std
1-2) whoCAN
recognizenumbersor more
%Children
(Std 3-5) whoCANdo
subtraction ormore
Performance of Districts
Belgaum 93.9 3.1 18.5 52.7 83.7 73.0 71.1 46.7
Bagalkot 94.4 7.1 13.6 31.8 65.6 45.4 38.7 29.8
Bijapur 98.4 8.6 6.4 28.3 63.6 49.7 54.5 47.7
Gulbarga 67.6 18.0 6.6 19.6 73.1 59.9 44.4 32.6
Bidar 90.1 2.2 22.8 44.9 74.6 71.7 49.4 41.3
Raichur 64.9 15.5 4.0 20.2 48.8 36.3 47.4 44.2
Koppal 88.9 9.8 10.9 21.8 66.3 57.8 48.8 42.6
Gadag 89.6 7.7 8.5 39.1 66.9 39.4 35.4 22.3
Dharwad 90.2 2.6 9.7 41.9 59.3 42.4 44.4 19.3
Uttara Kannada 88.8 1.8 2.8 52.8 97.0 79.9 59.1 62.5
Haveri 92.8 2.8 8.3 43.4 71.3 60.1 54.2 38.1
Bellary 86.8 6.9 12.4 25.4 67.3 48.5 45.5 36.5
Chitradurga 85.5 2.6 9.1 44.7 94.2 76.6 51.9 52.7
Davanagere 86.8 4.1 22.7 39.5 79.2 59.7 56.7 34.4
Shimoga 74.6 2.2 16.3 51.0 94.8 85.9 68.9 63.4
Udupi 88.1 0.5 39.6 73.0 92.2 87.5 89.2 81.5
Chickmagalur 90.8 2.8 21.6 62.6 92.1 91.4 61.6 55.3
Tumkur 88.6 0.9 15.3 45.7 86.1 62.3 60.6 39.4
Kolar 98.0 1.0 19.8 49.3 78.2 36.4 54.5 38.3
Bangalore 84.7 2.0 42.0 53.7 71.0 64.1 57.6 57.1
Bangalore Rural 91.6 2.6 19.8 51.6 79.8 75.3 60.2 55.5
Mandya 85.5 1.2 15.6 49.8 91.8 68.0 42.0 48.2
Hassan 90.8 1.7 20.4 55.9 91.7 76.0 59.1 62.5
Dakshina Kannada 90.8 0.9 37.6 80.5 93.4 81.6 82.0 59.2
Kodagu 96.3 1.4 21.8 66.7 97.2 90.1 80.5 59.8
Mysore 84.5 1.4 22.2 43.5 83.7 59.7 54.4 52.5
Chamaraj Nagar 95.9 1.3 12.5 36.6 84.5 70.5 52.6 37.5
Total 87.0 4.9 16.0 44.5 78.4 63.5 56.1 45.9
KARNATAKA RURAL
ASER 2006 127

KERALA RURAL
All analysis based on data from 14 out of 14 districts
Enrollment
Age and Class
SCHOOL ENROLLMENT AND OUT OF SCHOOL CHILDREN
% Children in each age groupin different types of schools
% Children out ofschool
Govt. Pvt.Other
(Madarsa + EGS)Not in school (Neverenrolled + drop out)
Total
Age : 7-16 ALL
Age : 7-10 ALL
Age : 7-10 BOYS
Age : 7-10 GIRLS
Age : 11-14 ALL
Age : 11-14 BOYS
Age : 11-14 GIRLS
Age : 15-16 ALL
Age : 15-16 BOYS
Age : 15-16 GIRLS
54.0 45.2 0.1 0.7 100
51.0 48.6 0.1 0.3 100
51.2 48.5 0.1 0.3 100
50.8 48.7 0.1 0.4 100
55.2 44.3 0.1 0.5 100
55.8 43.7 0.1 0.4 100
54.6 44.8 0.1 0.6 100
58.7 39.2 0.2 1.9 100
59.0 37.9 0.4 2.8 100
58.5 40.3 0.1 1.1 100
Young Children
IN BALWADI / ANGANWADI OR IN SCHOOL
% Children in pre-school or school
Age : 3 ALL
Age : 4 ALL
Age : 5 ALL
Age : 6 ALL
In
balw
ad
io
ran
gan
wad
i
In school
Govt. Pvt. Other
Not
goin
gan
yw
here
Total
65.9 0.5 33.6 100
90.4 2.0 7.6 100
64.3 16.7 16.6 0.1 2.2 100
7.7 44.1 47.1 0.4 0.8 100
I
II
III
IV
V
VI
VII
VIII
Std.5 6 7 8 9 10 11 12 13 14 15 16 Total
% Children in each standard by age
AGE BY STANDARD FOR SCHOOL CHILDREN
23.5 64.1 11.2 0.4 0.8 100
0.2 18.0 65.2 14.7 1.5 0.5 100
0.6 11.7 70.4 14.4 2.3 0.7 100
0.8 15.1 58.2 21.9 2.6 1.4 100
1.0 10.1 69.7 15.6 2.5 1.1 100
1.9 13.0 54.2 26.1 4.5 0.4 100
1.2 10.9 64.8 19.1 2.9 1.1 100
1.2 16.7 64.6 14.5 1.9 1.1 100
128 ASER 2006

Learning Level
Reading : % Children who CAN read
I
II
III
IV
V
VI
VII
VIII
Total
Std. Nothing Letter WordLevel 1(Std 1)
text
Level 2(Std 2)
text
Total
2.2 36.8 46.7 7.3 7.0 100
0.8 11.0 44.7 24.8 18.8 100
0.1 5.3 20.8 32.3 41.6 100
0.1 2.2 9.6 27.2 61.0 100
0.3 1.2 5.5 18.1 74.9 100
0.2 0.9 2.6 15.5 80.9 100
0.0 0.7 1.6 9.0 88.8 100
0.1 0.3 0.8 6.1 92.7 100
0.4 6.6 15.4 17.7 59.9 100
Std.
Arithmetic : % Children who CAN
NothingRecognizenumbers
Subtract Divide Total
I
II
III
IV
V
VI
VII
VIII
Total
13.0 72.5 12.6 1.9 100
5.1 57.3 34.3 3.2 100
2.1 28.3 58.8 10.9 100
1.3 12.7 60.7 25.2 100
0.8 8.4 44.3 46.5 100
0.4 5.8 35.0 58.9 100
0.9 4.3 21.6 73.3 100
0.4 2.5 16.7 80.4 100
2.6 21.4 36.3 39.7 100
Writing : % Children whoCAN correctly write
One simple dictatedsentence
I
II
III
IV
V
VI
VII
VIII
Total
Std.
III
IV
V
VI
VII
VIII
Total
Comprehension : % Readers (Level 2) who CAN
Answer atleast onequestion
Answer bothquestions
Solve atleast one
wordproblem
Solve bothword
problems
Std.
90.1 79.0 76.7 35.6
94.7 86.9 86.4 55.5
96.8 91.2 91.6 70.9
98.4 94.1 94.3 77.0
98.8 94.0 96.6 85.7
98.9 93.7 95.6 87.8
97.1 91.3 92.1 73.8
64.7
79.2
87.2
93.6
96.2
96.5
97.3
98.8
90.4
KERALA RURAL
ASER 2006 129
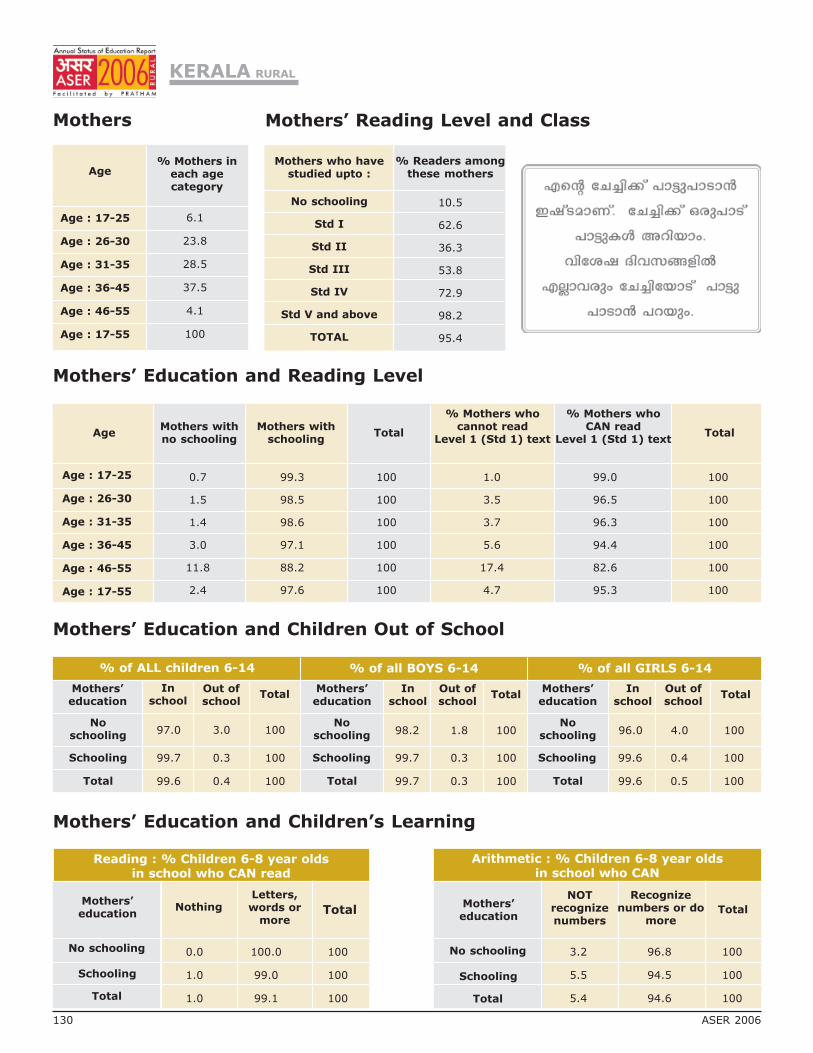
Mothers
Mothers’ Education and Children Out of School
Mothers’ Education and Children’s Learning
Age% Mothers in
each agecategory
Age : 17-25
Age : 26-30
Age : 31-35
Age : 36-45
Age : 46-55
Age : 17-55
% of ALL children 6-14 % of all BOYS 6-14 % of all GIRLS 6-14
Mothers’education
Noschooling
Schooling
Total
Mothers’education
Noschooling
Schooling
Total
Mothers’education
Noschooling
Schooling
Total
Inschool
Out ofschool
TotalIn
schoolOut ofschool
TotalIn
schoolOut ofschool
Total
Mothers’education
No schooling
Schooling
Total
Letters,words or
moreTotal
NOTrecognizenumbers
Recognizenumbers or do
moreTotal
Mothers’education
No schooling
Schooling
Total
Nothing
Mothers’ Education and Reading Level
AgeMothers withno schooling
Mothers withschooling
Total
% Mothers whocannot read
Level 1 (Std 1) text
% Mothers whoCAN read
Level 1 (Std 1) textTotal
Age : 17-25
Age : 26-30
Age : 31-35
Age : 36-45
Age : 46-55
Age : 17-55
KERALA RURAL
6.1
23.8
28.5
37.5
4.1
100
97.0 3.0 100
99.7 0.3 100
99.6 0.4 100
98.2 1.8 100
99.7 0.3 100
99.7 0.3 100
96.0 4.0 100
99.6 0.4 100
99.6 0.5 100
0.0 100.0 100
1.0 99.0 100
1.0 99.1 100
3.2 96.8 100
5.5 94.5 100
5.4 94.6 100
0.7 99.3 100 1.0 99.0 100
1.5 98.5 100 3.5 96.5 100
1.4 98.6 100 3.7 96.3 100
3.0 97.1 100 5.6 94.4 100
11.8 88.2 100 17.4 82.6 100
2.4 97.6 100 4.7 95.3 100
Reading : % Children 6-8 year oldsin school who CAN read
Arithmetic : % Children 6-8 year oldsin school who CAN
130 ASER 2006
Mothers who havestudied upto :
% Readers amongthese mothers
No schooling
Std I
Std II
Std III
Std IV
Std V and above
TOTAL
10.5
62.6
36.3
53.8
72.9
98.2
95.4
Mothers’ Reading Level and Class

Districts
Anganwadior school
Out ofschool
Privateschool
Mothers’Reading
Std 1-2 :Learning levels
Std 3-5 :Learning levels
%Children
(Age 3-5)in
Anganwadior
school
% Children(Age:6-14)Out ofSchool
% Children(Age:6-14)
inPrivateschool
%mothers
whoCAN
READ
% Children(Std 1-2) who
CAN readletters, words
or more
% Children(Std 3-5) who
CAN readLevel 1
(Std 1) textor more
%Children (Std
1-2) whoCAN
recognizenumbersor more
%Children
(Std 3-5) whoCANdo
subtraction ormore
Performance of districts
Kasargod 91.0 0.6 35.4 88.6 98.8 86.0 82.8 84.1
Kannur 77.9 0.2 46.0 96.7 97.6 92.8 88.5 83.8
Wayanad 76.4 0.9 40.3 96.4 98.1 96.7 90.5 85.3
Kozhikode (Calicut) 89.6 0.0 52.3 96.7 98.7 93.2 85.7 84.7
Malappuram 76.0 0.2 36.6 92.2 98.4 83.3 85.8 80.3
Palakkad 86.5 0.9 35.7 90.3 95.0 86.0 78.2 77.6
Thrissur 90.6 0.3 39.9 98.3 98.1 90.7 90.8 85.9
Ernakulam 98.5 0.8 63.6 97.6 99.3 85.4 86.1 74.9
Idukki 92.4 0.3 58.1 96.5 99.3 94.4 85.6 87.0
Kottayam 91.9 0.1 71.0 98.5 100.0 94.4 88.8 88.8
Alappuzha 94.2 0.1 53.6 98.3 99.2 91.8 88.2 86.6
Pathanamthitta 88.0 0.0 58.3 94.7 98.5 93.3 85.4 80.7
Kollam 94.1 0.4 46.4 96.1 100.0 99.0 79.5 82.0
Thiruvananthapuram 92.2 0.7 32.7 93.1 98.7 98.5 81.6 81.4
Total 87.9 0.4 46.8 95.3 98.6 91.2 85.4 82.7
KERALA RURAL
ASER 2006 131

TAMILNADU RURAL
All analysis based on data from 29 out of 29 districts
Enrollment
Age and Class
SCHOOL ENROLLMENT AND OUT OF SCHOOL CHILDREN
% Children in each age groupin different types of schools
% Children out ofschool
Govt. Pvt.Other
(Madarsa + EGS)Not in school (Neverenrolled + drop out)
Total
Age : 7-16 ALL
Age : 7-10 ALL
Age : 7-10 BOYS
Age : 7-10 GIRLS
Age : 11-14 ALL
Age : 11-14 BOYS
Age : 11-14 GIRLS
Age : 15-16 ALL
Age : 15-16 BOYS
Age : 15-16 GIRLS
76.7 18.4 0.1 4.9 100
78.9 20.2 0.1 0.8 100
77.9 21.4 0.0 0.7 100
79.9 19.2 0.1 0.9 100
78.7 17.6 0.1 3.6 100
77.8 18.7 0.1 3.4 100
79.6 16.5 0.1 3.9 100
67.6 16.5 0.1 15.8 100
68.1 17.8 0.2 13.9 100
67.1 15.3 0.0 17.6 100
Young Children
IN BALWADI / ANGANWADI OR IN SCHOOL
% Children in pre-school or school
Age : 3 ALL
Age : 4 ALL
Age : 5 ALL
Age : 6 ALL
In
balw
ad
io
ran
gan
wad
i
In school
Govt. Pvt. Other
Not
goin
gan
yw
here
Total
86.1 0.8 13.1 100
90.3 2.0 7.6 100
45.3 35.5 13.5 0.1 5.7 100
0.5 73.9 24.6 0.1 0.9 100
I
II
III
IV
V
VI
VII
VIII
Std.5 6 7 8 9 10 11 12 13 14 15 16 Total
% Children in each standard by age
AGE BY STANDARD FOR SCHOOL CHILDREN
22.7 70.9 5.6 0.4 0.1 0.4 100
1.1 24.7 64.6 7.6 1.0 0.6 0.4 100
0.3 1.7 21.8 64.5 9.0 1.6 0.5 0.5 100
0.3 2.6 20.3 64.4 9.5 1.5 0.9 0.4 100
0.6 3.0 11.7 71.1 9.4 2.6 0.8 0.9 100
1.0 1.4 12.6 58.1 20.7 4.0 1.3 1.0 100
0.6 1.6 10.7 60.6 19.3 4.0 2.1 1.2 100
1.1 1.1 13.5 59.7 16.3 5.2 3.1 100
132 ASER 2006

Learning Level
Reading : % Children who CAN read
I
II
III
IV
V
VI
VII
VIII
Total
Std. Nothing Letter WordLevel 1(Std 1)
text
Level 2(Std 2)
text
Total
51.1 37.9 9.2 1.0 0.8 100
23.4 39.2 29.1 6.3 2.0 100
10.8 23.8 40.5 16.6 8.4 100
6.9 13.7 32.6 29.2 17.6 100
4.1 7.9 23.6 35.2 29.2 100
3.8 4.7 15.5 32.4 43.6 100
1.7 3.1 9.7 30.1 55.4 100
1.8 1.7 6.4 23.0 67.1 100
12.1 15.6 20.5 22.5 29.4 100
Std.
Arithmetic : % Children who CAN
NothingRecognizenumbers
Subtract Divide Total
I
II
III
IV
V
VI
VII
VIII
Total
74.9 18.7 6.1 0.4 100
47.9 32.4 19.1 0.6 100
24.7 37.8 34.7 2.9 100
14.5 32.6 45.6 7.3 100
9.5 24.4 50.5 15.6 100
6.7 17.4 48.7 27.2 100
3.5 14.2 46.0 36.3 100
2.7 10.0 38.1 49.2 100
21.6 23.0 37.0 18.4 100
Writing : % Children whoCAN correctly write
One simple dictatedsentence
I
II
III
IV
V
VI
VII
VIII
Total
Std.
III
IV
V
VI
VII
VIII
Total
Comprehension : % Readers (Level 2) who CAN
Answer atleast onequestion
Answer bothquestions
Solve atleast one
wordproblem
Solve bothword
problems
Std.
72.8 63.3 51.7 40.6
85.5 74.5 65.5 47.8
92.3 83.8 74.2 55.7
92.4 85.8 78.1 60.9
94.5 89.4 81.5 62.2
96.4 91.4 85.8 70.1
93.0 86.6 79.0 61.7
8.8
22.0
39.1
54.7
67.8
79.0
86.0
89.4
57.7
TAMILNADU RURAL
ASER 2006 133

Mothers
Mothers’ Education and Children Out of School
Mothers’ Education and Children’s Learning
Age% Mothers in
each agecategory
Age : 17-25
Age : 26-30
Age : 31-35
Age : 36-45
Age : 46-55
Age : 17-55
% of ALL children 6-14 % of all BOYS 6-14 % of all GIRLS 6-14
Mothers’education
Noschooling
Schooling
Total
Mothers’education
Noschooling
Schooling
Total
Mothers’education
Noschooling
Schooling
Total
Inschool
Out ofschool
TotalIn
schoolOut ofschool
TotalIn
schoolOut ofschool
Total
Mothers’education
No schooling
Schooling
Total
Letters,words or
moreTotal
NOTrecognizenumbers
Recognizenumbers or do
moreTotal
Mothers’education
No schooling
Schooling
Total
Nothing
Mothers’ Education and Reading Level
AgeMothers withno schooling
Mothers withschooling
Total
% Mothers whocannot read
Level 1 (Std 1) text
% Mothers whoCAN read
Level 1 (Std 1) textTotal
Age : 17-25
Age : 26-30
Age : 31-35
Age : 36-45
Age : 46-55
Age : 17-55
TAMILNADU RURAL
13.5
31.3
29.2
23.1
2.9
100
96.6 3.4 100
98.9 1.1 100
97.9 2.1 100
97.1 2.9 100
98.8 1.2 100
98.1 1.9 100
96.1 3.9 100
99.0 1.0 100
97.8 2.2 100
29.1 70.9 100
22.3 77.7 100
24.7 75.3 100
50.0 50.0 100
42.7 57.3 100
45.3 54.7 100
26.7 73.3 100 38.9 61.1 100
35.2 64.8 100 46.6 53.4 100
43.3 56.7 100 55.6 44.4 100
47.8 52.2 100 59.0 41.0 100
58.1 41.9 100 68.9 31.1 100
40.0 60.0 100 51.7 48.3 100
Reading : % Children 6-8 year oldsin school who CAN read
Arithmetic : % Children 6-8 year oldsin school who CAN
134 ASER 2006
Mothers who havestudied upto :
% Readers amongthese mothers
No schooling
Std I
Std II
Std III
Std IV
Std V and above
TOTAL
0.1
7.3
20.6
33.6
54.6
88.2
48.3
Mothers’ Reading Level and Class

Districts
Anganwadior school
Out ofschool
Privateschool
Mothers’Reading
Std 1-2 :Learning levels
Std 3-5 :Learning levels
%Children
(Age 3-5)in
Anganwadior
school
% Children(Age:6-14)Out ofSchool
% Children(Age:6-14)
inPrivateschool
%mothers
whoCAN
READ
% Children(Std 1-2) who
CAN readletters, words
or more
% Children(Std 3-5) who
CAN readLevel 1
(Std 1) textor more
%Children (Std
1-2) whoCAN
recognizenumbersor more
%Children
(Std 3-5) whoCANdo
subtraction ormore
Performance of districts
Thiruvallur 91.7 0.6 16.8 36.2 63.5 47.4 39.7 51.4
Kancheepuram 85.3 1.0 22.9 44.1 54.9 38.2 44.8 37.4
Vellore 88.8 3.9 14.4 45.0 62.9 49.7 43.1 37.7
Dharmapuri 87.8 4.0 8.0 36.4 51.2 31.1 45.6 40.9
Tiruvannamalai 96.5 2.5 12.2 40.5 74.0 52.4 55.2 26.6
Viluppuram 93.3 3.9 12.8 32.3 56.0 42.7 37.6 38.7
Salem 84.6 1.4 14.7 53.2 61.3 58.5 47.4 58.3
Namakkal 78.2 1.2 22.4 58.5 75.7 74.8 51.1 54.6
Erode 89.0 1.5 12.0 45.0 63.6 40.5 44.3 37.8
The Nilgiris 89.6 0.4 45.1 75.4 43.2 42.4 35.4 42.2
Coimbatore 78.0 1.5 27.4 59.3 57.4 49.6 52.7 53.9
Dindigul 87.9 2.6 27.6 48.9 39.8 31.5 49.0 47.4
Karur 93.4 1.8 11.3 48.4 85.7 69.1 50.4 59.4
Tiruchirappalli 75.4 0.3 23.9 55.2 62.9 43.5 49.5 44.9
Perambalur 83.2 1.1 14.6 48.2 56.6 28.7 34.8 64.8
Ariyalur 92.8 0.1 12.5 41.0 61.7 36.2 59.3 77.2
Cuddalore 92.7 2.0 18.2 46.3 71.9 18.1 56.7 67.4
Nagapattinam 86.3 1.4 20.5 54.7 64.3 25.7 31.3 59.0
Tiruvarur 92.0 1.1 10.6 58.2 60.7 30.4 49.6 70.4
Thanjavur 86.8 2.9 12.4 52.6 58.9 21.1 45.0 73.3
Pudukkottai 100.0 1.9 9.4 50.4 54.6 22.4 39.6 38.9
Sivaganga 93.3 0.4 13.0 47.8 57.9 51.6 78.5 73.3
Madurai 99.3 1.7 24.6 47.7 54.8 29.4 30.7 63.5
Theni 100.0 1.4 39.5 45.6 77.3 40.2 56.0 50.5
Virudhunagar 100.0 2.9 33.4 46.4 82.0 32.8 53.7 85.0
Ramanathapuram 100.0 1.5 18.5 48.0 57.8 28.2 38.0 57.8
Thoothukudi 98.4 2.3 35.9 60.4 62.6 33.2 48.4 70.0
Tirunelveli 99.5 2.0 40.1 55.3 78.0 47.3 47.4 67.4
Kanyakumari 100.0 0.5 40.2 84.9 73.7 48.3 57.9 65.0
Total 90.9 2.1 19.5 48.3 63.1 38.9 46.4 53.0
TAMILNADU RURAL
ASER 2006 135
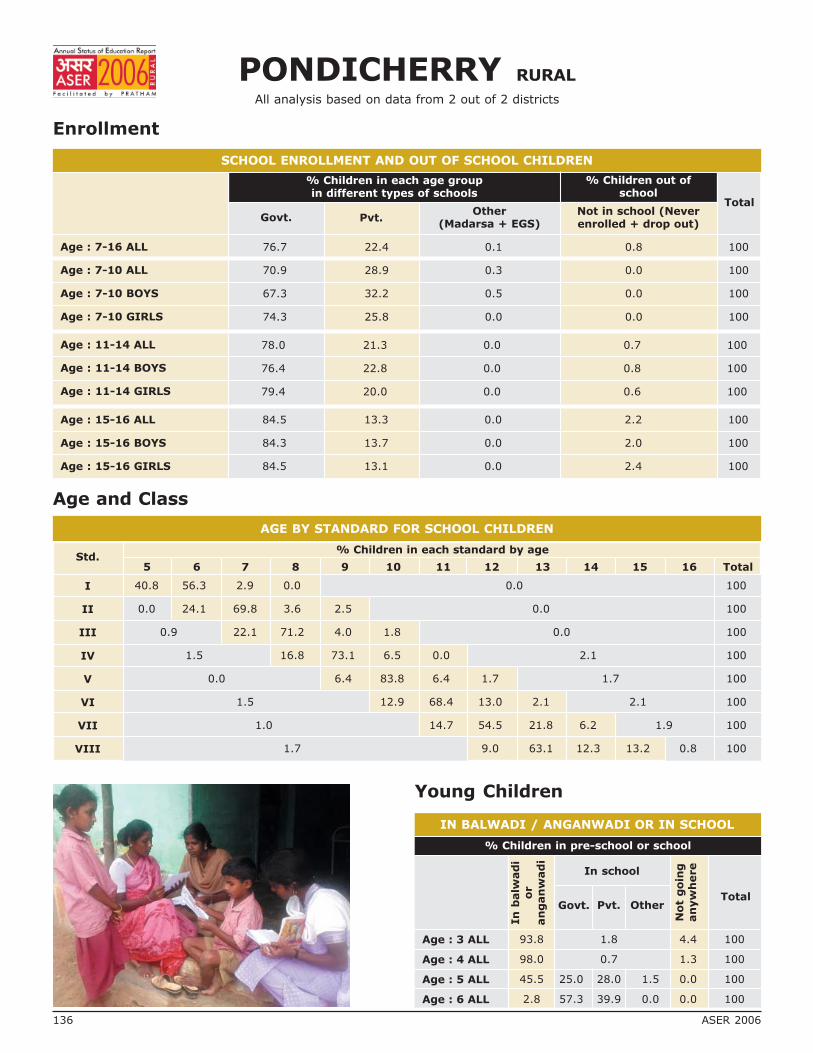
PONDICHERRY RURAL
All analysis based on data from 2 out of 2 districts
Enrollment
Age and Class
SCHOOL ENROLLMENT AND OUT OF SCHOOL CHILDREN
% Children in each age groupin different types of schools
% Children out ofschool
Govt. Pvt.Other
(Madarsa + EGS)Not in school (Neverenrolled + drop out)
Total
Age : 7-16 ALL
Age : 7-10 ALL
Age : 7-10 BOYS
Age : 7-10 GIRLS
Age : 11-14 ALL
Age : 11-14 BOYS
Age : 11-14 GIRLS
Age : 15-16 ALL
Age : 15-16 BOYS
Age : 15-16 GIRLS
76.7 22.4 0.1 0.8 100
70.9 28.9 0.3 0.0 100
67.3 32.2 0.5 0.0 100
74.3 25.8 0.0 0.0 100
78.0 21.3 0.0 0.7 100
76.4 22.8 0.0 0.8 100
79.4 20.0 0.0 0.6 100
84.5 13.3 0.0 2.2 100
84.3 13.7 0.0 2.0 100
84.5 13.1 0.0 2.4 100
Young Children
IN BALWADI / ANGANWADI OR IN SCHOOL
% Children in pre-school or school
Age : 3 ALL
Age : 4 ALL
Age : 5 ALL
Age : 6 ALL
In
balw
ad
io
ran
gan
wad
i
In school
Govt. Pvt. Other
Not
goin
gan
yw
here
Total
93.8 1.8 4.4 100
98.0 0.7 1.3 100
45.5 25.0 28.0 1.5 0.0 100
2.8 57.3 39.9 0.0 0.0 100
I
II
III
IV
V
VI
VII
VIII
Std.5 6 7 8 9 10 11 12 13 14 15 16 Total
% Children in each standard by age
AGE BY STANDARD FOR SCHOOL CHILDREN
40.8 56.3 2.9 0.0 0.0 100
0.0 24.1 69.8 3.6 2.5 0.0 100
0.9 22.1 71.2 4.0 1.8 0.0 100
1.5 16.8 73.1 6.5 0.0 2.1 100
0.0 6.4 83.8 6.4 1.7 1.7 100
1.5 12.9 68.4 13.0 2.1 2.1 100
1.0 14.7 54.5 21.8 6.2 1.9 100
1.7 9.0 63.1 12.3 13.2 0.8 100
136 ASER 2006

Learning Level
Reading : % Children who CAN read
I
II
III
IV
V
VI
VII
VIII
Total
Std. Nothing Letter WordLevel 1(Std 1)
text
Level 2(Std 2)
text
Total
39.7 48.1 10.3 1.8 0.0 100
22.4 34.1 29.8 12.6 1.2 100
16.1 29.8 29.6 19.6 4.9 100
9.5 17.8 28.7 30.9 13.1 100
0.4 8.4 30.5 34.7 26.0 100
0.0 7.6 14.6 39.4 38.5 100
1.5 4.4 11.3 33.1 49.7 100
1.7 2.5 5.8 29.5 60.6 100
10.1 17.6 19.9 26.2 26.2 100
Std.
Arithmetic : % Children who CAN
NothingRecognizenumbers
Subtract Divide Total
I
II
III
IV
V
VI
VII
VIII
Total
62.6 33.7 3.8 0.0 100
29.1 50.6 20.3 0.0 100
22.3 53.6 21.3 2.8 100
13.9 40.1 36.4 9.6 100
0.9 28.0 47.7 23.4 100
4.4 25.9 46.5 23.2 100
2.0 19.9 43.0 35.1 100
0.8 12.2 43.6 43.4 100
14.9 32.0 34.2 18.8 100
Writing : % Children whoCAN correctly write
One simple dictatedsentence
I
II
III
IV
V
VI
VII
VIII
Total
Std.
III
IV
V
VI
VII
VIII
Total
Comprehension : % Readers (Level 2) who CAN
Answer atleast onequestion
Answer bothquestions
Solve atleast one
wordproblem
Solve bothword
problems
Std.
100 100 75.8 0.0
85.9 85.9 71.8 57.6
98.2 96.5 85.7 62.9
96.9 92.4 79.0 61.1
100 88.9 84.4 64.8
97.2 91.6 87.3 65.1
97.4 91.6 84.0 62.9
6.1
18.8
28.9
46.9
63.4
80.3
85.4
88.6
55.1
PONDICHERRY RURAL
ASER 2006 137

Mothers
Mothers’ Education and Children Out of School
Mothers’ Education and Children’s Learning
Age% Mothers in
each agecategory
Age : 17-25
Age : 26-30
Age : 31-35
Age : 36-45
Age : 46-55
Age : 17-55
% of ALL children 6-14 % of all BOYS 6-14 % of all GIRLS 6-14
Mothers’education
Noschooling
Schooling
Total
Mothers’education
Noschooling
Schooling
Total
Mothers’education
Noschooling
Schooling
Total
Inschool
Out ofschool
TotalIn
schoolOut ofschool
TotalIn
schoolOut ofschool
Total
Mothers’education
No schooling
Schooling
Total
Letters,words or
moreTotal
NOTrecognizenumbers
Recognizenumbers or do
moreTotal
Mothers’education
No schooling
Schooling
Total
Nothing
Mothers’ Education and Reading Level
AgeMothers withno schooling
Mothers withschooling
Total
% Mothers whocannot read
Level 1 (Std 1) text
% Mothers whoCAN read
Level 1 (Std 1) textTotal
Age : 17-25
Age : 26-30
Age : 31-35
Age : 36-45
Age : 46-55
Age : 17-55
PONDICHERRY RURAL
11.1
29.0
29.4
27.4
3.0
100
99.4 0.6 100
99.8 0.2 100
99.7 0.3 100
100 0.0 100
99.5 0.5 100
99.6 0.4 100
99.0 1.0 100
100 0.0 100
99.7 0.3 100
31.9 68.1 100
17.4 82.6 100
20.7 79.3 100
45.8 54.2 100
26.8 73.2 100
31.1 69.0 100
11.9 88.1 100 29.9 70.1 100
24.3 75.7 100 35.9 64.1 100
27.2 72.8 100 43.9 56.1 100
41.7 58.3 100 57.0 43.0 100
66.8 33.2 100 70.4 29.6 100
29.8 70.2 100 44.3 55.7 100
Reading : % Children 6-8 year oldsin school who CAN read
Arithmetic : % Children 6-8 year oldsin school who CAN
138 ASER 2006
Mothers who havestudied upto :
% Readers amongthese mothers
No schooling
Std I
Std II
Std III
Std IV
Std V and above
TOTAL
0.3
0.0
18.5
7.4
16.3
86.3
55.6
Mothers’ Reading Level and Class

PONDICHERRY RURAL
Districts
Anganwadior school
Out ofschool
Privateschool
Mothers’Reading
Std 1-2 :Learning levels
Std 3-5 :Learning levels
%Children
(Age 3-5)in
Anganwadior
school
% Children(Age:6-14)Out ofSchool
% Children(Age:6-14)
inPrivateschool
%mothers
whoCAN
READ
% Children(Std 1-2) who
CAN readletters, words
or more
% Children(Std 3-5) who
CAN readLevel 1
(Std 1) textor more
%Children (Std
1-2) whoCAN
recognizenumbersor more
%Children
(Std 3-5) whoCANdo
subtraction ormore
Performance of districts
Pondicherry 98.6 0.3 23.0 46.7 65.1 51.9 38.9 41.8
Karaikal 97.6 0.4 33.8 76.6 76.9 58.7 52.0 58.9
Total 98.3 0.3 26.2 55.7 68.8 54.0 43.4 47.6
ASER 2006 139
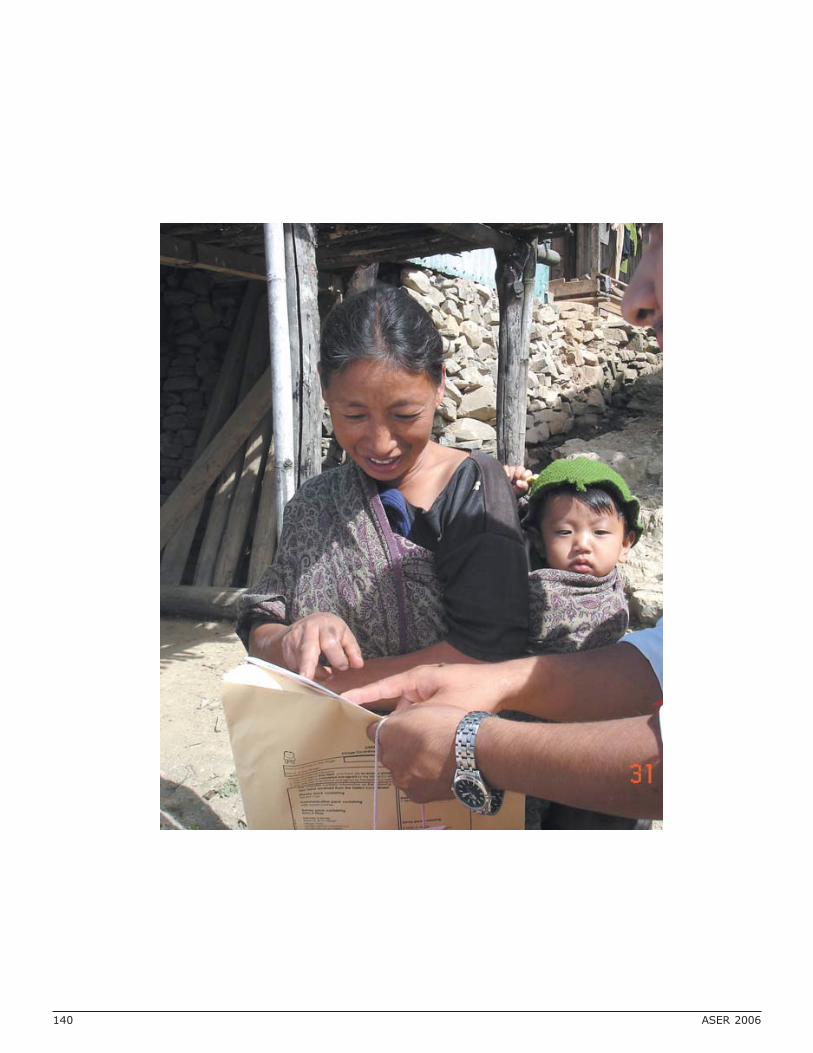
140 ASER 2006

Mizoram
Assam
Meghalaya
Manipur
Nagaland
Arunachal Pradesh
Tripura
ASER 2006 141

MIZORAM RURAL
All analysis based on data from 7 out of 8 districts
Enrollment
Age and Class
SCHOOL ENROLLMENT AND OUT OF SCHOOL CHILDREN
% Children in each age groupin different types of schools
% Children out ofschool
Govt. Pvt.Other
(Madarsa + EGS)Not in school (Neverenrolled + drop out)
Total
Age : 7-16 ALL
Age : 7-10 ALL
Age : 7-10 BOYS
Age : 7-10 GIRLS
Age : 11-14 ALL
Age : 11-14 BOYS
Age : 11-14 GIRLS
Age : 15-16 ALL
Age : 15-16 BOYS
Age : 15-16 GIRLS
73.5 20.2 0.3 6.0 100
71.1 26.0 0.3 2.7 100
70.2 26.9 0.2 2.7 100
71.9 25.0 0.4 2.7 100
77.6 18.1 0.3 4.1 100
79.3 16.9 0.2 3.7 100
75.8 19.3 0.5 4.4 100
70.1 11.3 0.0 18.7 100
71.3 10.3 0.0 18.5 100
68.5 12.6 0.0 18.9 100
I
II
III
IV
V
VI
VII
VIII
Std.5 6 7 8 9 10 11 12 13 14 15 16 Total
% Children in each standard by age
AGE BY STANDARD FOR SCHOOL CHILDREN
10.8 41.6 24.2 11.6 4.1 5.0 2.7 100
1.2 8.6 34.3 30.2 9.4 10.2 2.3 4.0 100
1.5 6.4 22.5 33.5 20.5 7.1 3.3 5.3 100
1.6 3.6 17.0 36.8 17.1 14.0 5.5 4.6 100
1.9 4.6 20.4 22.7 27.1 13.2 5.9 4.1 100
2.0 6.2 13.0 43.1 18.4 14.2 2.3 0.8 100
1.2 2.0 21.0 33.6 30.9 7.2 4.1 100
1.6 6.8 17.1 51.6 15.2 7.8 100
142 ASER 2006
Young Children
IN BALWADI / ANGANWADI OR IN SCHOOL
% Children in pre-school or school
Age : 3 ALL
Age : 4 ALL
Age : 5 ALL
Age : 6 ALL
In
balw
ad
io
ran
gan
wad
i
In school
Govt. Pvt. Other
Not
goin
gan
yw
here
Total
64.0 2.4 33.6 100
80.0 7.6 12.4 100
70.5 10.9 14.0 0.1 4.5 100
14.2 50.2 28.6 0.2 6.8 100
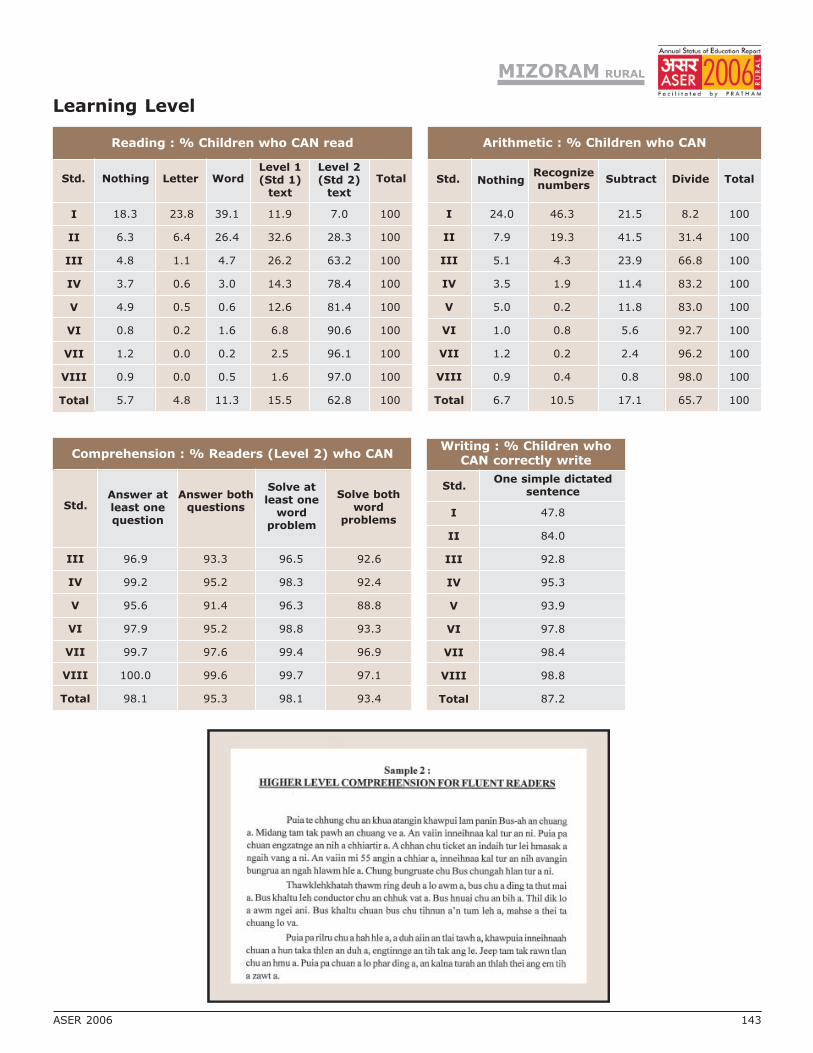
Learning Level
Reading : % Children who CAN read
I
II
III
IV
V
VI
VII
VIII
Total
Std. Nothing Letter WordLevel 1(Std 1)
text
Level 2(Std 2)
text
Total
18.3 23.8 39.1 11.9 7.0 100
6.3 6.4 26.4 32.6 28.3 100
4.8 1.1 4.7 26.2 63.2 100
3.7 0.6 3.0 14.3 78.4 100
4.9 0.5 0.6 12.6 81.4 100
0.8 0.2 1.6 6.8 90.6 100
1.2 0.0 0.2 2.5 96.1 100
0.9 0.0 0.5 1.6 97.0 100
5.7 4.8 11.3 15.5 62.8 100
Std.
Arithmetic : % Children who CAN
NothingRecognizenumbers
Subtract Divide Total
I
II
III
IV
V
VI
VII
VIII
Total
24.0 46.3 21.5 8.2 100
7.9 19.3 41.5 31.4 100
5.1 4.3 23.9 66.8 100
3.5 1.9 11.4 83.2 100
5.0 0.2 11.8 83.0 100
1.0 0.8 5.6 92.7 100
1.2 0.2 2.4 96.2 100
0.9 0.4 0.8 98.0 100
6.7 10.5 17.1 65.7 100
Writing : % Children whoCAN correctly write
One simple dictatedsentence
I
II
III
IV
V
VI
VII
VIII
Total
Std.
III
IV
V
VI
VII
VIII
Total
Comprehension : % Readers (Level 2) who CAN
Answer atleast onequestion
Answer bothquestions
Solve atleast one
wordproblem
Solve bothword
problems
Std.
96.9 93.3 96.5 92.6
99.2 95.2 98.3 92.4
95.6 91.4 96.3 88.8
97.9 95.2 98.8 93.3
99.7 97.6 99.4 96.9
100.0 99.6 99.7 97.1
98.1 95.3 98.1 93.4
47.8
84.0
92.8
95.3
93.9
97.8
98.4
98.8
87.2
MIZORAM RURAL
ASER 2006 143

Mothers
Mothers’ Education and Children Out of School
Mothers’ Education and Children’s Learning
Age% Mothers in
each agecategory
Age : 17-25
Age : 26-30
Age : 31-35
Age : 36-45
Age : 46-55
Age : 17-55
% of ALL children 6-14 % of all BOYS 6-14 % of all GIRLS 6-14
Mothers’education
Noschooling
Schooling
Total
Mothers’education
Noschooling
Schooling
Total
Mothers’education
Noschooling
Schooling
Total
Inschool
Out ofschool
TotalIn
schoolOut ofschool
TotalIn
schoolOut ofschool
Total
Mothers’education
No schooling
Schooling
Total
Letters,words or
moreTotal
NOTrecognizenumbers
Recognizenumbers or do
moreTotal
Mothers’education
No schooling
Schooling
Total
Nothing
Mothers’ Education and Reading Level
AgeMothers withno schooling
Mothers withschooling
Total
% Mothers whocannot read
Level 1 (Std 1) text
% Mothers whoCAN read
Level 1 (Std 1) textTotal
Age : 17-25
Age : 26-30
Age : 31-35
Age : 36-45
Age : 46-55
Age : 17-55
MIZORAM RURAL
18.9
21.8
16.5
30.4
12.4
100
85.8 14.2 100
98.6 1.4 100
96.0 4.0 100
88.0 12.0 100
98.6 1.4 100
96.5 3.5 100
83.6 16.4 100
98.6 1.4 100
95.5 4.5 100
11.1 88.9 100
8.2 91.8 100
8.7 91.3 100
14.6 85.4 100
10.7 89.3 100
11.4 88.6 100
12.2 87.8 100 12.3 87.7 100
13.4 86.6 100 14.6 85.4 00
16.2 83.8 100 16.8 83.2 100
24.7 75.3 100 24.3 75.7 100
35.7 64.3 100 30.3 69.7 100
19.8 80.2 100 19.5 80.5 100
Reading : % Children 6-8 year oldsin school who CAN read
Arithmetic : % Children 6-8 year oldsin school who CAN
144 ASER 2006
Mothers who havestudied upto :
% Readers amongthese mothers
No schooling
Std I
Std II
Std III
Std IV
Std V and above
TOTAL
11.8
63.4
77.3
92.1
97.1
99.1
80.4
Mothers’ Reading Level and Class

Districts
Anganwadior school
Out ofschool
Privateschool
Mothers’Reading
Std 1-2 :Learning levels
Std 3-5 :Learning levels
%Children
(Age 3-5)in
Anganwadior
school
% Children(Age:6-14)Out ofSchool
% Children(Age:6-14)
inPrivateschool
%mothers
whoCAN
READ
% Children(Std 1-2) who
CAN readletters, words
or more
% Children(Std 3-5) who
CAN readLevel 1
(Std 1) textor more
%Children (Std
1-2) whoCAN
recognizenumbersor more
%Children
(Std 3-5) whoCANdo
subtraction ormore
Performance of districts
MIZORAM RURAL
ASER 2006 145
Mamit 89.1 6.0 22.6 72.7 99.3 97.8 90.8 99.2
Kolasib 95.9 1.6 33.3 86.7 68.4 67.0 73.8 76.0
Aizawl 72.4 0.5 38.2 93.6 80.2 81.1 86.3 85.2
Champhai 94.5 2.0 19.6 81.0 89.7 80.5 94.2 95.7
Lunglei 87.8 6.2 14.7 68.7 92.3 86.6 93.5 95.8
Lawngtlai 69.5 5.7 24.2 81.5 84.9 81.8 100.0 100.0
Saiha Data for this district is incomplete
Total 83.8 3.7 23.2 80.5 88.0 84.6 91.7 93.1
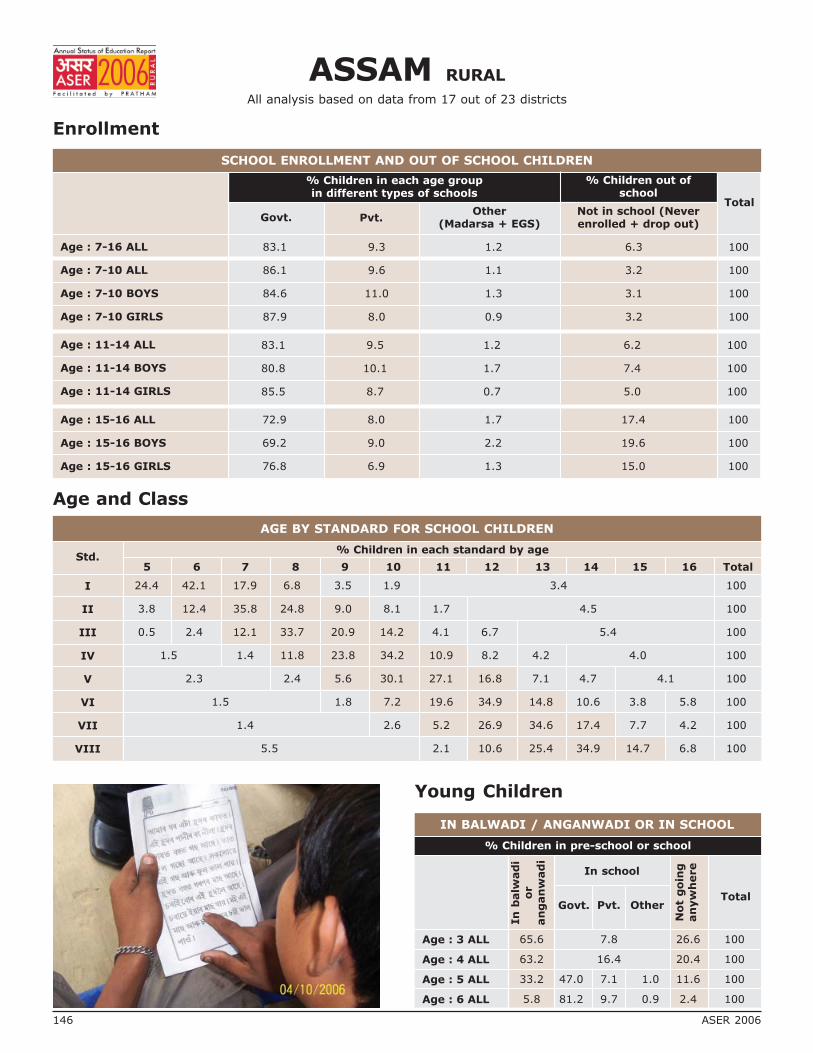
ASSAM RURAL
All analysis based on data from 17 out of 23 districts
Enrollment
Age and Class
SCHOOL ENROLLMENT AND OUT OF SCHOOL CHILDREN
% Children in each age groupin different types of schools
% Children out ofschool
Govt. Pvt.Other
(Madarsa + EGS)Not in school (Neverenrolled + drop out)
Total
Age : 7-16 ALL
Age : 7-10 ALL
Age : 7-10 BOYS
Age : 7-10 GIRLS
Age : 11-14 ALL
Age : 11-14 BOYS
Age : 11-14 GIRLS
Age : 15-16 ALL
Age : 15-16 BOYS
Age : 15-16 GIRLS
83.1 9.3 1.2 6.3 100
86.1 9.6 1.1 3.2 100
84.6 11.0 1.3 3.1 100
87.9 8.0 0.9 3.2 100
83.1 9.5 1.2 6.2 100
80.8 10.1 1.7 7.4 100
85.5 8.7 0.7 5.0 100
72.9 8.0 1.7 17.4 100
69.2 9.0 2.2 19.6 100
76.8 6.9 1.3 15.0 100
Young Children
IN BALWADI / ANGANWADI OR IN SCHOOL
% Children in pre-school or school
Age : 3 ALL
Age : 4 ALL
Age : 5 ALL
Age : 6 ALL
In
balw
ad
io
ran
gan
wad
i
In school
Govt. Pvt. Other
Not
goin
gan
yw
here
Total
65.6 7.8 26.6 100
63.2 16.4 20.4 100
33.2 47.0 7.1 1.0 11.6 100
5.8 81.2 9.7 0.9 2.4 100
I
II
III
IV
V
VI
VII
VIII
Std.5 6 7 8 9 10 11 12 13 14 15 16 Total
% Children in each standard by age
AGE BY STANDARD FOR SCHOOL CHILDREN
24.4 42.1 17.9 6.8 3.5 1.9 3.4 100
3.8 12.4 35.8 24.8 9.0 8.1 1.7 4.5 100
0.5 2.4 12.1 33.7 20.9 14.2 4.1 6.7 5.4 100
1.5 1.4 11.8 23.8 34.2 10.9 8.2 4.2 4.0 100
2.3 2.4 5.6 30.1 27.1 16.8 7.1 4.7 4.1 100
1.5 1.8 7.2 19.6 34.9 14.8 10.6 3.8 5.8 100
1.4 2.6 5.2 26.9 34.6 17.4 7.7 4.2 100
5.5 2.1 10.6 25.4 34.9 14.7 6.8 100
146 ASER 2006
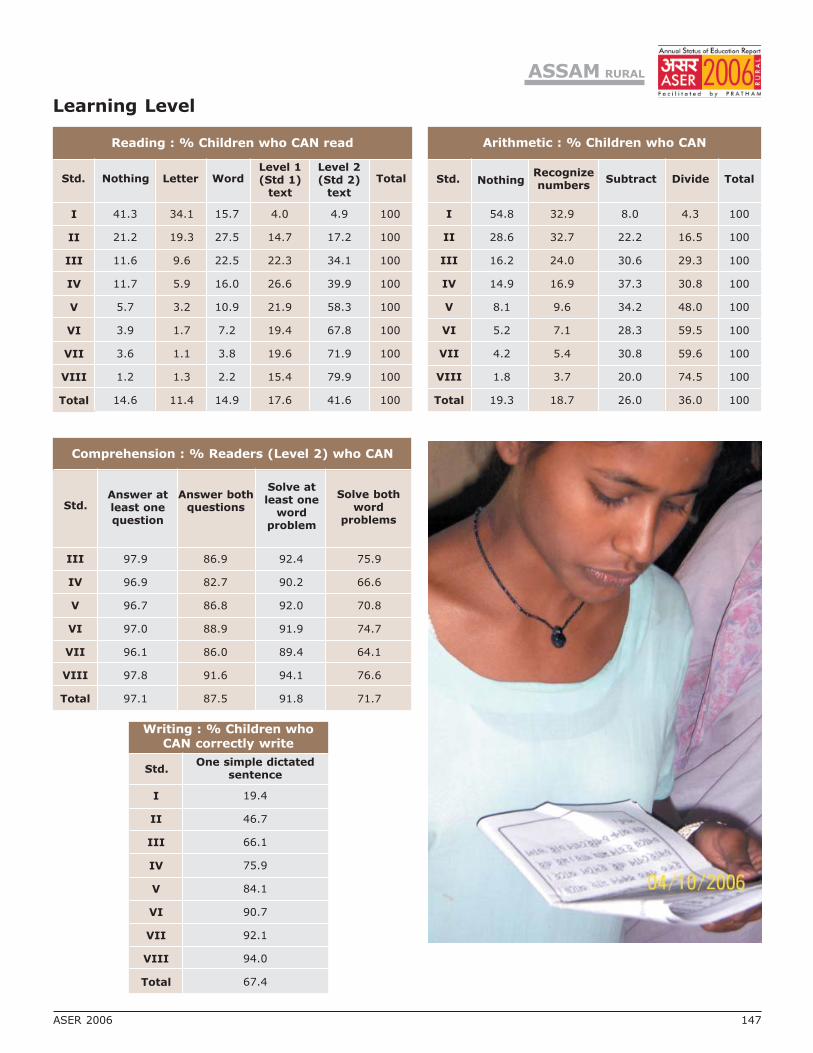
Learning Level
Reading : % Children who CAN read
I
II
III
IV
V
VI
VII
VIII
Total
Std. Nothing Letter WordLevel 1(Std 1)
text
Level 2(Std 2)
text
Total
41.3 34.1 15.7 4.0 4.9 100
21.2 19.3 27.5 14.7 17.2 100
11.6 9.6 22.5 22.3 34.1 100
11.7 5.9 16.0 26.6 39.9 100
5.7 3.2 10.9 21.9 58.3 100
3.9 1.7 7.2 19.4 67.8 100
3.6 1.1 3.8 19.6 71.9 100
1.2 1.3 2.2 15.4 79.9 100
14.6 11.4 14.9 17.6 41.6 100
Std.
Arithmetic : % Children who CAN
NothingRecognizenumbers
Subtract Divide Total
I
II
III
IV
V
VI
VII
VIII
Total
54.8 32.9 8.0 4.3 100
28.6 32.7 22.2 16.5 100
16.2 24.0 30.6 29.3 100
14.9 16.9 37.3 30.8 100
8.1 9.6 34.2 48.0 100
5.2 7.1 28.3 59.5 100
4.2 5.4 30.8 59.6 100
1.8 3.7 20.0 74.5 100
19.3 18.7 26.0 36.0 100
III
IV
V
VI
VII
VIII
Total
Comprehension : % Readers (Level 2) who CAN
Answer atleast onequestion
Answer bothquestions
Solve atleast one
wordproblem
Solve bothword
problems
Std.
97.9 86.9 92.4 75.9
96.9 82.7 90.2 66.6
96.7 86.8 92.0 70.8
97.0 88.9 91.9 74.7
96.1 86.0 89.4 64.1
97.8 91.6 94.1 76.6
97.1 87.5 91.8 71.7
ASSAM RURAL
ASER 2006 147
Writing : % Children whoCAN correctly write
One simple dictatedsentence
I
II
III
IV
V
VI
VII
VIII
Total
Std.
19.4
46.7
66.1
75.9
84.1
90.7
92.1
94.0
67.4

Mothers
Mothers’ Education and Children Out of School
Mothers’ Education and Children’s Learning
Age% Mothers in
each agecategory
Age : 17-25
Age : 26-30
Age : 31-35
Age : 36-45
Age : 46-55
Age : 17-55
% of ALL children 6-14 % of all BOYS 6-14 % of all GIRLS 6-14
Mothers’education
Noschooling
Schooling
Total
Mothers’education
Noschooling
Schooling
Total
Mothers’education
Noschooling
Schooling
Total
Inschool
Out ofschool
TotalIn
schoolOut ofschool
TotalIn
schoolOut ofschool
Total
Mothers’education
No schooling
Schooling
Total
Letters,words or
moreTotal
NOTrecognizenumbers
Recognizenumbers or do
moreTotal
Mothers’education
No schooling
Schooling
Total
Nothing
Mothers’ Education and Reading Level
AgeMothers withno schooling
Mothers withschooling
Total
% Mothers whocannot read
Level 1 (Std 1) text
% Mothers whoCAN read
Level 1 (Std 1) textTotal
Age : 17-25
Age : 26-30
Age : 31-35
Age : 36-45
Age : 46-55
Age : 17-55
ASSAM RURAL
16.2
28.3
24.8
24.7
6.0
100
92.8 7.2 100
98.0 2.0 100
95.7 4.3 100
92.3 7.7 100
97.6 2.4 100
95.2 4.8 100
93.3 6.7 100
98.5 1.6 100
96.1 3.9 100
28.8 71.2 100
22.1 77.9 100
24.9 75.1 100
38.6 61.4 100
28.9 71.1 100
32.9 67.1 100
32.1 67.9 100 34.6 65.4 100
33.4 66.7 100 35.1 64.9 100
41.2 58.8 100 43.8 56.2 100
51.0 49.0 100 52.1 47.9 100
66.9 33.1 100 64.3 35.7 100
41.4 58.6 100 42.7 57.3 100
Reading : % Children 6-8 year oldsin school who CAN read
Arithmetic : % Children 6-8 year oldsin school who CAN
148 ASER 2006
Mothers who havestudied upto :
% Readers amongthese mothers
No schooling
Std I
Std II
Std III
Std IV
Std V and above
TOTAL
1.9
59.1
49.6
58.6
80.1
96.2
56.6
Mothers’ Reading Level and Class
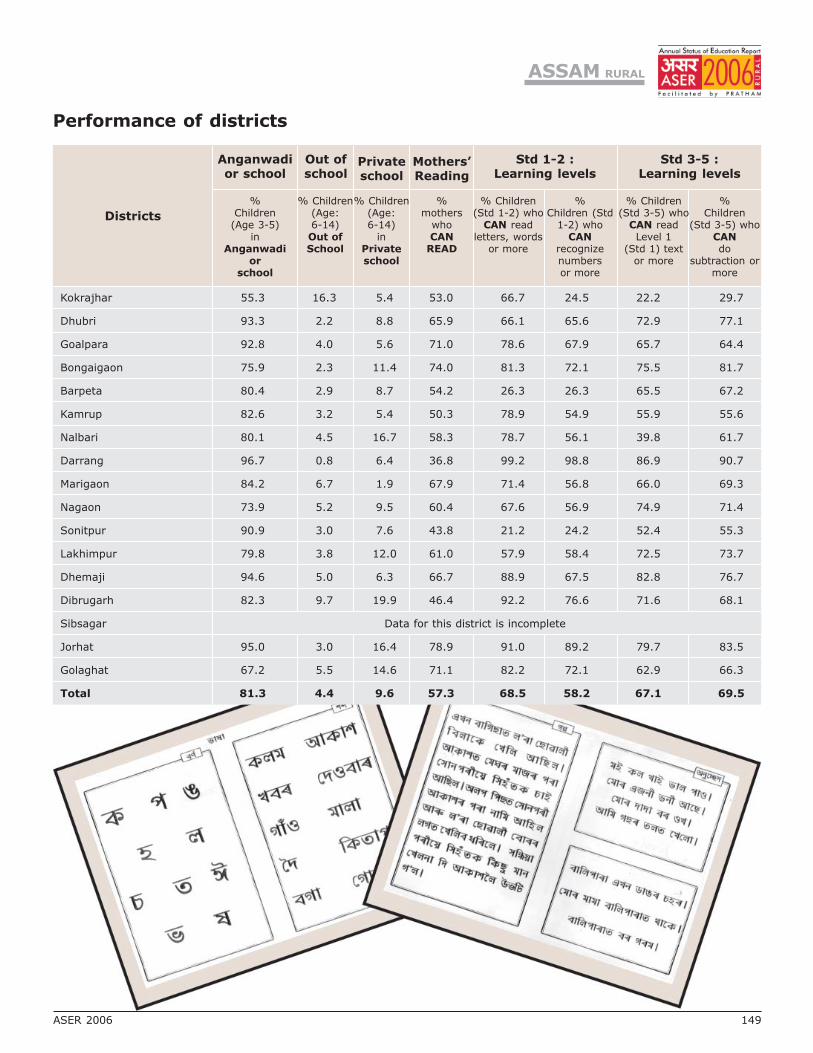
Districts
Performance of districts
ASER 2006 149
Anganwadior school
Out ofschool
Privateschool
Mothers’Reading
Std 1-2 :Learning levels
Std 3-5 :Learning levels
%Children
(Age 3-5)in
Anganwadior
school
% Children(Age:6-14)Out ofSchool
% Children(Age:6-14)
inPrivateschool
%mothers
whoCAN
READ
% Children(Std 1-2) who
CAN readletters, words
or more
% Children(Std 3-5) who
CAN readLevel 1
(Std 1) textor more
%Children (Std
1-2) whoCAN
recognizenumbersor more
%Children
(Std 3-5) whoCANdo
subtraction ormore
ASSAM RURAL
Kokrajhar 55.3 16.3 5.4 53.0 66.7 24.5 22.2 29.7
Dhubri 93.3 2.2 8.8 65.9 66.1 65.6 72.9 77.1
Goalpara 92.8 4.0 5.6 71.0 78.6 67.9 65.7 64.4
Bongaigaon 75.9 2.3 11.4 74.0 81.3 72.1 75.5 81.7
Barpeta 80.4 2.9 8.7 54.2 26.3 26.3 65.5 67.2
Kamrup 82.6 3.2 5.4 50.3 78.9 54.9 55.9 55.6
Nalbari 80.1 4.5 16.7 58.3 78.7 56.1 39.8 61.7
Darrang 96.7 0.8 6.4 36.8 99.2 98.8 86.9 90.7
Marigaon 84.2 6.7 1.9 67.9 71.4 56.8 66.0 69.3
Nagaon 73.9 5.2 9.5 60.4 67.6 56.9 74.9 71.4
Sonitpur 90.9 3.0 7.6 43.8 21.2 24.2 52.4 55.3
Lakhimpur 79.8 3.8 12.0 61.0 57.9 58.4 72.5 73.7
Dhemaji 94.6 5.0 6.3 66.7 88.9 67.5 82.8 76.7
Dibrugarh 82.3 9.7 19.9 46.4 92.2 76.6 71.6 68.1
Sibsagar Data for this district is incomplete
Jorhat 95.0 3.0 16.4 78.9 91.0 89.2 79.7 83.5
Golaghat 67.2 5.5 14.6 71.1 82.2 72.1 62.9 66.3
Total 81.3 4.4 9.6 57.3 68.5 58.2 67.1 69.5
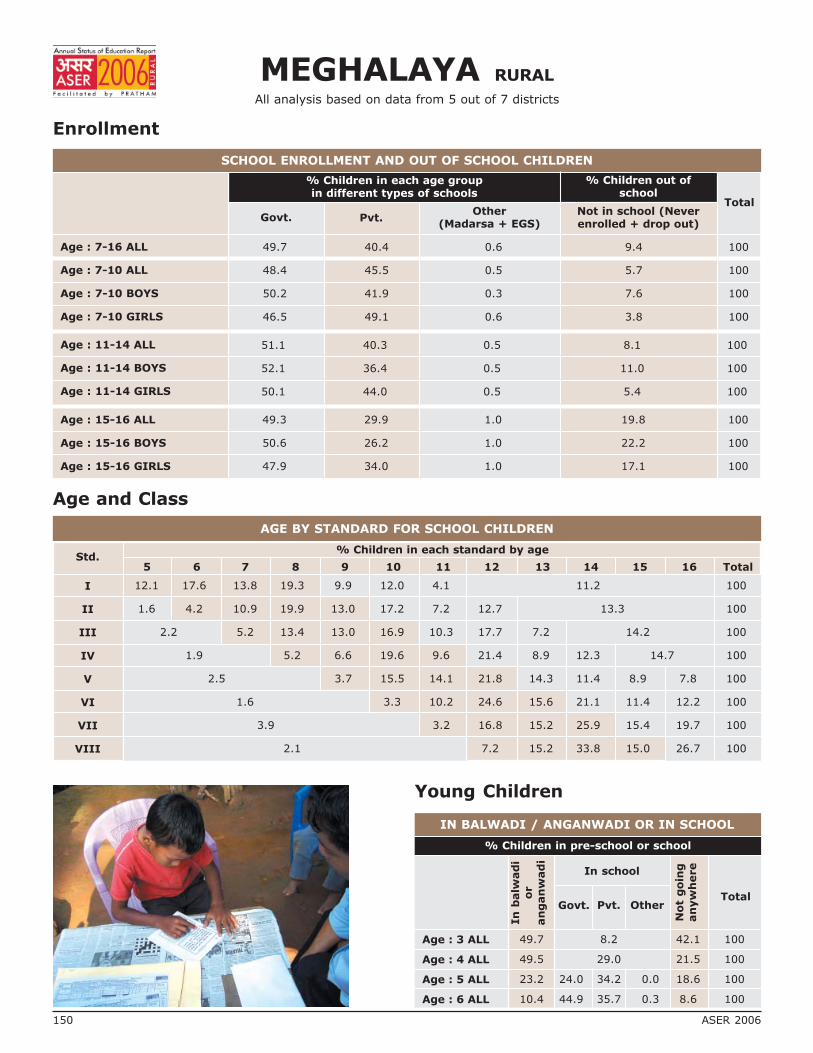
MEGHALAYA RURAL
All analysis based on data from 5 out of 7 districts
Enrollment
Age and Class
SCHOOL ENROLLMENT AND OUT OF SCHOOL CHILDREN
% Children in each age groupin different types of schools
% Children out ofschool
Govt. Pvt.Other
(Madarsa + EGS)Not in school (Neverenrolled + drop out)
Total
Age : 7-16 ALL
Age : 7-10 ALL
Age : 7-10 BOYS
Age : 7-10 GIRLS
Age : 11-14 ALL
Age : 11-14 BOYS
Age : 11-14 GIRLS
Age : 15-16 ALL
Age : 15-16 BOYS
Age : 15-16 GIRLS
49.7 40.4 0.6 9.4 100
48.4 45.5 0.5 5.7 100
50.2 41.9 0.3 7.6 100
46.5 49.1 0.6 3.8 100
51.1 40.3 0.5 8.1 100
52.1 36.4 0.5 11.0 100
50.1 44.0 0.5 5.4 100
49.3 29.9 1.0 19.8 100
50.6 26.2 1.0 22.2 100
47.9 34.0 1.0 17.1 100
Young Children
IN BALWADI / ANGANWADI OR IN SCHOOL
% Children in pre-school or school
Age : 3 ALL
Age : 4 ALL
Age : 5 ALL
Age : 6 ALL
In
balw
ad
io
ran
gan
wad
i
In school
Govt. Pvt. Other
Not
goin
gan
yw
here
Total
49.7 8.2 42.1 100
49.5 29.0 21.5 100
23.2 24.0 34.2 0.0 18.6 100
10.4 44.9 35.7 0.3 8.6 100
I
II
III
IV
V
VI
VII
VIII
Std.5 6 7 8 9 10 11 12 13 14 15 16 Total
% Children in each standard by age
AGE BY STANDARD FOR SCHOOL CHILDREN
12.1 17.6 13.8 19.3 9.9 12.0 4.1 11.2 100
1.6 4.2 10.9 19.9 13.0 17.2 7.2 12.7 13.3 100
2.2 5.2 13.4 13.0 16.9 10.3 17.7 7.2 14.2 100
1.9 5.2 6.6 19.6 9.6 21.4 8.9 12.3 14.7 100
2.5 3.7 15.5 14.1 21.8 14.3 11.4 8.9 7.8 100
1.6 3.3 10.2 24.6 15.6 21.1 11.4 12.2 100
3.9 3.2 16.8 15.2 25.9 15.4 19.7 100
2.1 7.2 15.2 33.8 15.0 26.7 100
150 ASER 2006

Learning Level
Reading : % Children who CAN read
I
II
III
IV
V
VI
VII
VIII
Total
Std. Nothing Letter WordLevel 1(Std 1)
text
Level 2(Std 2)
text
Total
6.9 30.1 39.7 13.1 10.2 100
0.9 10.7 34.8 25.6 27.9 100
0.4 2.0 25.7 28.9 43.1 100
0.9 1.5 4.2 30.1 63.4 100
0.0 1.1 3.3 30.3 65.3 100
0.0 0.6 1.0 14.0 84.4 100
0.0 0.3 1.3 14.4 84.1 100
0.0 0.0 1.1 12.6 86.3 100
2.0 9.8 20.6 21.6 46.1 100
Std.
Arithmetic : % Children who CAN
NothingRecognizenumbers
Subtract Divide Total
I
II
III
IV
V
VI
VII
VIII
Total
9.3 62.6 17.7 10.4 100
1.4 40.5 31.8 26.3 100
1.1 23.6 39.5 35.8 100
1.6 7.7 31.2 59.5 100
0.0 4.3 25.4 70.3 100
0.0 1.1 13.8 85.2 100
0.0 0.6 9.9 89.5 100
0.0 0.6 5.9 93.5 100
2.8 26.6 24.4 46.3 100
Writing : % Children whoCAN correctly write
One simple dictatedsentence
I
II
III
IV
V
VI
VII
VIII
Total
Std.
III
IV
V
VI
VII
VIII
Total
Comprehension : % Readers (Level 2) who CAN
Answer atleast onequestion
Answer bothquestions
Solve atleast one
wordproblem
Solve bothword
problems
Std.
97.6 90.5 84.9 75.7
97.6 93.2 89.7 76.8
96.7 90.9 92.3 80.8
98.9 90.5 84.8 76.8
99.2 95.3 88.4 80.8
100.0 96.6 93.5 89.1
98.2 92.5 88.7 79.5
53.8
76.5
85.8
95.2
97.0
99.5
99.3
100.0
83.0
MEGHALAYA RURAL
ASER 2006 151

Mothers
Mothers’ Education and Children Out of School
Mothers’ Education and Children’s Learning
Age% Mothers in
each agecategory
Age : 17-25
Age : 26-30
Age : 31-35
Age : 36-45
Age : 46-55
Age : 17-55
% of ALL children 6-14 % of all BOYS 6-14 % of all GIRLS 6-14
Mothers’education
Noschooling
Schooling
Total
Mothers’education
Noschooling
Schooling
Total
Mothers’education
Noschooling
Schooling
Total
Inschool
Out ofschool
TotalIn
schoolOut ofschool
TotalIn
schoolOut ofschool
Total
Mothers’education
No schooling
Schooling
Total
Letters,words or
moreTotal
NOTrecognizenumbers
Recognizenumbers or do
moreTotal
Mothers’education
No schooling
Schooling
Total
Nothing
Mothers’ Education and Reading Level
AgeMothers withno schooling
Mothers withschooling
Total
% Mothers whocannot read
Level 1 (Std 1) text
% Mothers whoCAN read
Level 1 (Std 1) textTotal
Age : 17-25
Age : 26-30
Age : 31-35
Age : 36-45
Age : 46-55
Age : 17-55
16.0
21.9
17.9
32.7
11.5
100
91.1 8.9 100
95.9 4.1 100
94.1 5.9 100
89.1 11.0 100
93.9 6.1 100
92.1 7.9 100
93.2 6.8 100
97.9 2.1 100
96.1 3.9 100
9.6 90.4 100
4.4 95.6 100
6.1 93.9 100
13.6 86.4 100
6.3 93.7 100
8.7 91.3 100
31.1 68.9 100 22.0 78.0 100
36.1 63.9 100 25.2 74.8 100
35.5 64.5 100 23.9 76.2 100
41.7 58.3 100 31.5 68.5 100
47.6 52.4 100 42.2 57.8 100
38.3 61.7 100 28.4 71.6 100
MEGHALAYA RURAL
Reading : % Children 6-8 year oldsin school who CAN read
Arithmetic : % Children 6-8 year oldsin school who CAN
152 ASER 2006
Mothers who havestudied upto :
% Readers amongthese mothers
No schooling
Std I
Std II
Std III
Std IV
Std V and above
TOTAL
4.6
72.2
61.3
73.4
86.5
97.1
71.5
Mothers’ Reading Level and Class

Districts
Anganwadior school
Out ofschool
Privateschool
Mothers’Reading
Std 1-2 :Learning levels
Std 3-5 :Learning levels
%Children
(Age 3-5)in
Anganwadior
school
% Children(Age:6-14)Out ofSchool
% Children(Age:6-14)
inPrivateschool
%mothers
whoCAN
READ
% Children(Std 1-2) who
CAN readletters, words
or more
% Children(Std 3-5) who
CAN readLevel 1
(Std 1) textor more
%Children (Std
1-2) whoCAN
recognizenumbersor more
%Children
(Std 3-5) whoCANdo
subtraction ormore
Performance of districts
MEGHALAYA RURAL
ASER 2006 153
West Garo Hills 74.7 10.2 29.4 73.9 98.9 98.1 73.3 67.3
East Garo Hills 68.6 5.4 17.0 74.1 82.9 73.4 70.0 84.9
South Garo Hills 76.1 2.1 21.0 77.6 96.0 96.0 90.8 85.9
East Khasi Hills 78.2 4.7 70.7 72.7 95.2 94.3 95.9 95.8
Jaintia Hills Data for this district is incomplete
Total 74.3 6.9 42.7 71.6 95.4 93.9 84.9 85.6
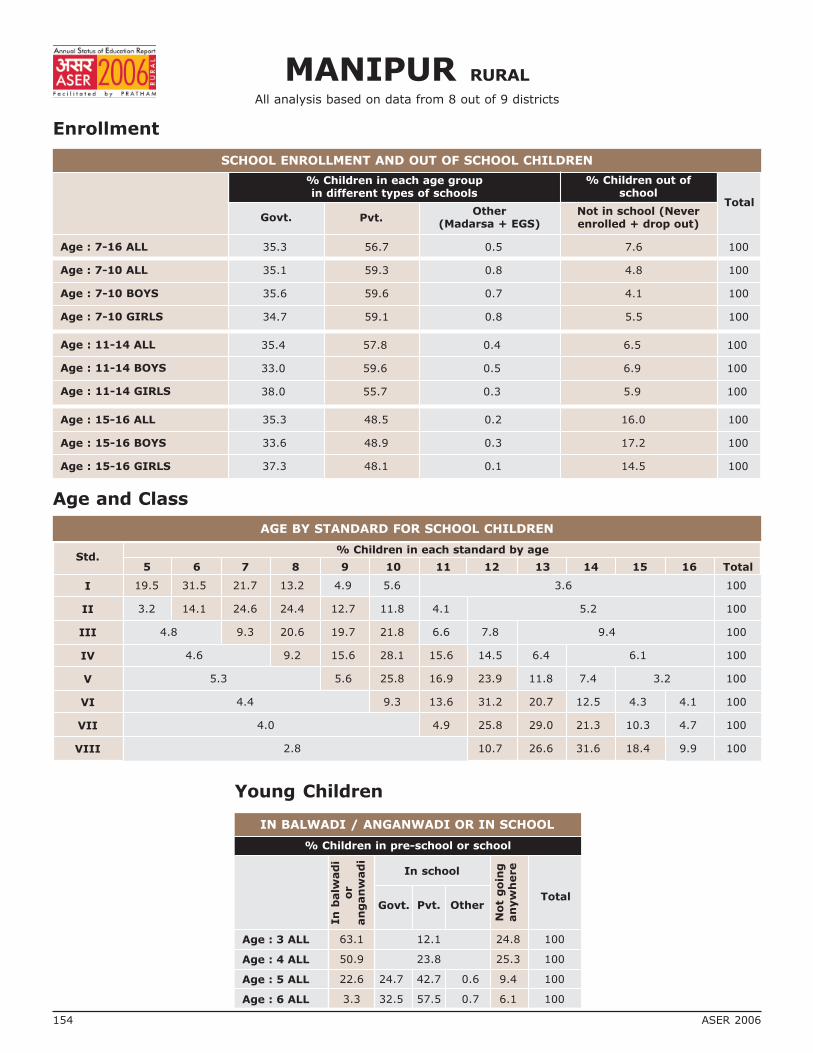
MANIPUR RURAL
All analysis based on data from 8 out of 9 districts
Enrollment
Age and Class
SCHOOL ENROLLMENT AND OUT OF SCHOOL CHILDREN
% Children in each age groupin different types of schools
% Children out ofschool
Govt. Pvt.Other
(Madarsa + EGS)Not in school (Neverenrolled + drop out)
Total
Age : 7-16 ALL
Age : 7-10 ALL
Age : 7-10 BOYS
Age : 7-10 GIRLS
Age : 11-14 ALL
Age : 11-14 BOYS
Age : 11-14 GIRLS
Age : 15-16 ALL
Age : 15-16 BOYS
Age : 15-16 GIRLS
35.3 56.7 0.5 7.6 100
35.1 59.3 0.8 4.8 100
35.6 59.6 0.7 4.1 100
34.7 59.1 0.8 5.5 100
35.4 57.8 0.4 6.5 100
33.0 59.6 0.5 6.9 100
38.0 55.7 0.3 5.9 100
35.3 48.5 0.2 16.0 100
33.6 48.9 0.3 17.2 100
37.3 48.1 0.1 14.5 100
I
II
III
IV
V
VI
VII
VIII
Std.5 6 7 8 9 10 11 12 13 14 15 16 Total
% Children in each standard by age
AGE BY STANDARD FOR SCHOOL CHILDREN
19.5 31.5 21.7 13.2 4.9 5.6 3.6 100
3.2 14.1 24.6 24.4 12.7 11.8 4.1 5.2 100
4.8 9.3 20.6 19.7 21.8 6.6 7.8 9.4 100
4.6 9.2 15.6 28.1 15.6 14.5 6.4 6.1 100
5.3 5.6 25.8 16.9 23.9 11.8 7.4 3.2 100
4.4 9.3 13.6 31.2 20.7 12.5 4.3 4.1 100
4.0 4.9 25.8 29.0 21.3 10.3 4.7 100
2.8 10.7 26.6 31.6 18.4 9.9 100
154 ASER 2006
Young Children
IN BALWADI / ANGANWADI OR IN SCHOOL
% Children in pre-school or school
Age : 3 ALL
Age : 4 ALL
Age : 5 ALL
Age : 6 ALL
In
balw
ad
io
ran
gan
wad
i
In school
Govt. Pvt. Other
Not
goin
gan
yw
here
Total
63.1 12.1 24.8 100
50.9 23.8 25.3 100
22.6 24.7 42.7 0.6 9.4 100
3.3 32.5 57.5 0.7 6.1 100
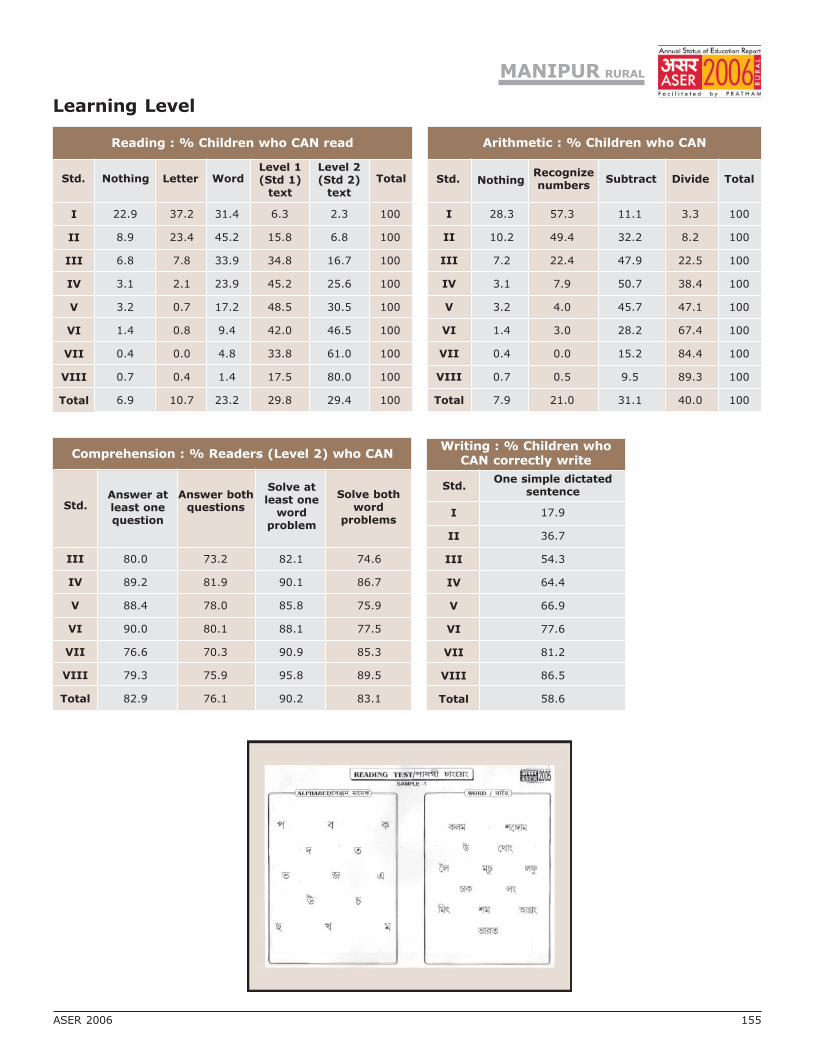
Learning Level
Reading : % Children who CAN read
I
II
III
IV
V
VI
VII
VIII
Total
Std. Nothing Letter WordLevel 1(Std 1)
text
Level 2(Std 2)
text
Total
22.9 37.2 31.4 6.3 2.3 100
8.9 23.4 45.2 15.8 6.8 100
6.8 7.8 33.9 34.8 16.7 100
3.1 2.1 23.9 45.2 25.6 100
3.2 0.7 17.2 48.5 30.5 100
1.4 0.8 9.4 42.0 46.5 100
0.4 0.0 4.8 33.8 61.0 100
0.7 0.4 1.4 17.5 80.0 100
6.9 10.7 23.2 29.8 29.4 100
Std.
Arithmetic : % Children who CAN
NothingRecognizenumbers
Subtract Divide Total
I
II
III
IV
V
VI
VII
VIII
Total
28.3 57.3 11.1 3.3 100
10.2 49.4 32.2 8.2 100
7.2 22.4 47.9 22.5 100
3.1 7.9 50.7 38.4 100
3.2 4.0 45.7 47.1 100
1.4 3.0 28.2 67.4 100
0.4 0.0 15.2 84.4 100
0.7 0.5 9.5 89.3 100
7.9 21.0 31.1 40.0 100
Writing : % Children whoCAN correctly write
One simple dictatedsentence
I
II
III
IV
V
VI
VII
VIII
Total
Std.
III
IV
V
VI
VII
VIII
Total
Comprehension : % Readers (Level 2) who CAN
Answer atleast onequestion
Answer bothquestions
Solve atleast one
wordproblem
Solve bothword
problems
Std.
80.0 73.2 82.1 74.6
89.2 81.9 90.1 86.7
88.4 78.0 85.8 75.9
90.0 80.1 88.1 77.5
76.6 70.3 90.9 85.3
79.3 75.9 95.8 89.5
82.9 76.1 90.2 83.1
17.9
36.7
54.3
64.4
66.9
77.6
81.2
86.5
58.6
MANIPUR RURAL
ASER 2006 155
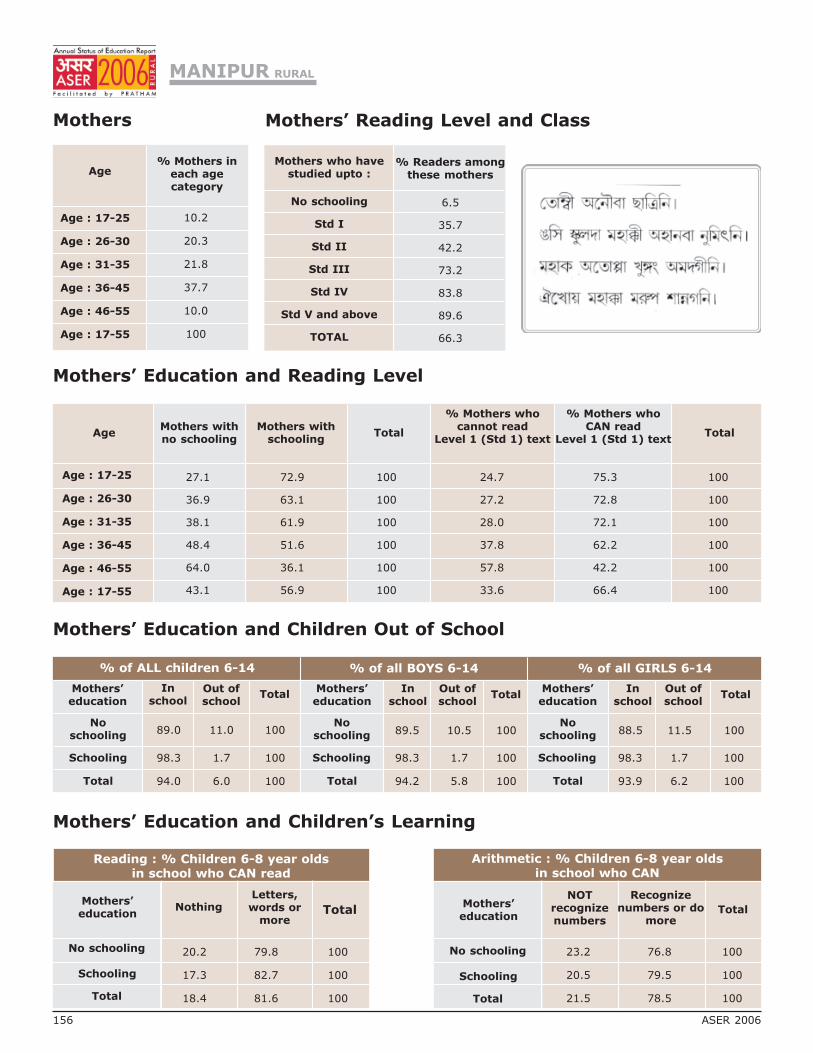
Mothers
Mothers’ Education and Children Out of School
Mothers’ Education and Children’s Learning
Age% Mothers in
each agecategory
Age : 17-25
Age : 26-30
Age : 31-35
Age : 36-45
Age : 46-55
Age : 17-55
% of ALL children 6-14 % of all BOYS 6-14 % of all GIRLS 6-14
Mothers’education
Noschooling
Schooling
Total
Mothers’education
Noschooling
Schooling
Total
Mothers’education
Noschooling
Schooling
Total
Inschool
Out ofschool
TotalIn
schoolOut ofschool
TotalIn
schoolOut ofschool
Total
Mothers’education
No schooling
Schooling
Total
Letters,words or
moreTotal
NOTrecognizenumbers
Recognizenumbers or do
moreTotal
Mothers’education
No schooling
Schooling
Total
Nothing
Mothers’ Education and Reading Level
AgeMothers withno schooling
Mothers withschooling
Total
% Mothers whocannot read
Level 1 (Std 1) text
% Mothers whoCAN read
Level 1 (Std 1) textTotal
Age : 17-25
Age : 26-30
Age : 31-35
Age : 36-45
Age : 46-55
Age : 17-55
MANIPUR RURAL
10.2
20.3
21.8
37.7
10.0
100
89.0 11.0 100
98.3 1.7 100
94.0 6.0 100
89.5 10.5 100
98.3 1.7 100
94.2 5.8 100
88.5 11.5 100
98.3 1.7 100
93.9 6.2 100
20.2 79.8 100
17.3 82.7 100
18.4 81.6 100
23.2 76.8 100
20.5 79.5 100
21.5 78.5 100
27.1 72.9 100 24.7 75.3 100
36.9 63.1 100 27.2 72.8 100
38.1 61.9 100 28.0 72.1 100
48.4 51.6 100 37.8 62.2 100
64.0 36.1 100 57.8 42.2 100
43.1 56.9 100 33.6 66.4 100
Reading : % Children 6-8 year oldsin school who CAN read
Arithmetic : % Children 6-8 year oldsin school who CAN
156 ASER 2006
Mothers who havestudied upto :
% Readers amongthese mothers
No schooling
Std I
Std II
Std III
Std IV
Std V and above
TOTAL
6.5
35.7
42.2
73.2
83.8
89.6
66.3
Mothers’ Reading Level and Class
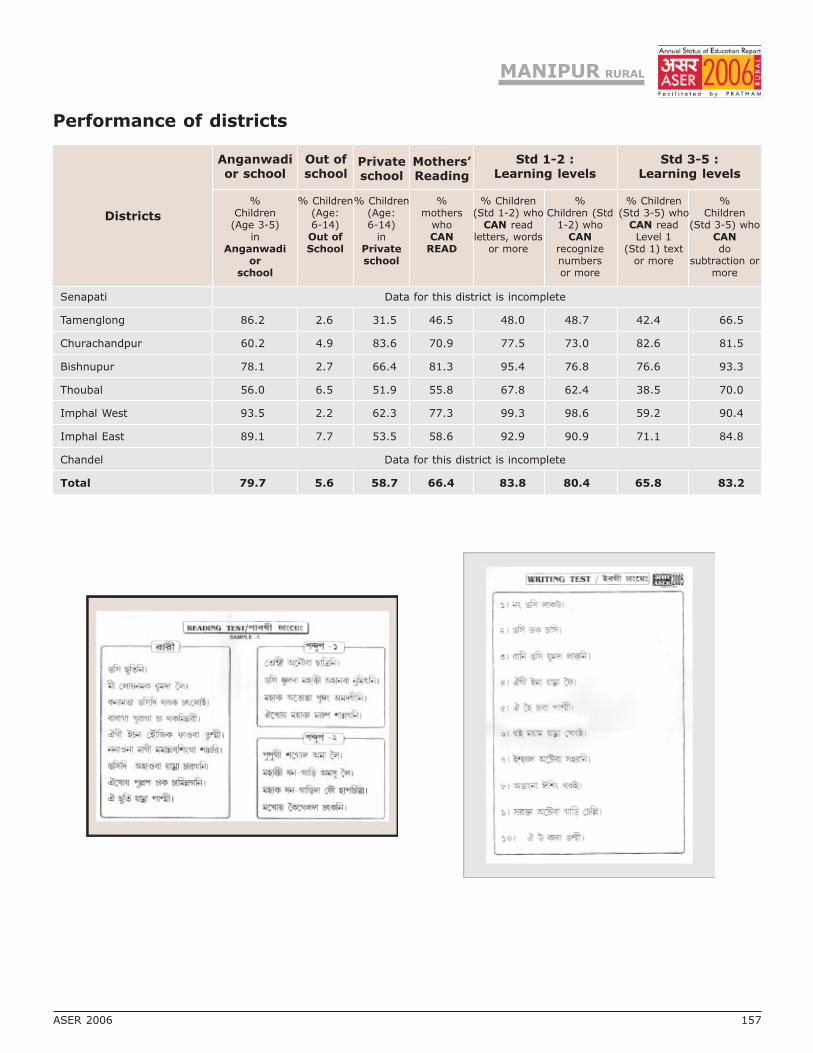
Districts
Anganwadior school
Out ofschool
Privateschool
Mothers’Reading
Std 1-2 :Learning levels
Std 3-5 :Learning levels
%Children
(Age 3-5)in
Anganwadior
school
% Children(Age:6-14)Out ofSchool
% Children(Age:6-14)
inPrivateschool
%mothers
whoCAN
READ
% Children(Std 1-2) who
CAN readletters, words
or more
% Children(Std 3-5) who
CAN readLevel 1
(Std 1) textor more
%Children (Std
1-2) whoCAN
recognizenumbersor more
%Children
(Std 3-5) whoCANdo
subtraction ormore
Performance of districts
MANIPUR RURAL
ASER 2006 157
Senapati Data for this district is incomplete
Tamenglong 86.2 2.6 31.5 46.5 48.0 48.7 42.4 66.5
Churachandpur 60.2 4.9 83.6 70.9 77.5 73.0 82.6 81.5
Bishnupur 78.1 2.7 66.4 81.3 95.4 76.8 76.6 93.3
Thoubal 56.0 6.5 51.9 55.8 67.8 62.4 38.5 70.0
Imphal West 93.5 2.2 62.3 77.3 99.3 98.6 59.2 90.4
Imphal East 89.1 7.7 53.5 58.6 92.9 90.9 71.1 84.8
Chandel Data for this district is incomplete
Total 79.7 5.6 58.7 66.4 83.8 80.4 65.8 83.2

NAGALAND RURAL
All analysis based on data from 10 out of 11 districts
Enrollment
Age and Class
SCHOOL ENROLLMENT AND OUT OF SCHOOL CHILDREN
% Children in each age groupin different types of schools
% Children out ofschool
Govt. Pvt.Other
(Madarsa + EGS)Not in school (Neverenrolled + drop out)
Total
Age : 7-16 ALL
Age : 7-10 ALL
Age : 7-10 BOYS
Age : 7-10 GIRLS
Age : 11-14 ALL
Age : 11-14 BOYS
Age : 11-14 GIRLS
Age : 15-16 ALL
Age : 15-16 BOYS
Age : 15-16 GIRLS
46.0 46.1 0.1 7.8 100
45.1 51.3 0.1 3.5 100
44.6 51.5 0.1 3.8 100
45.7 51.0 0.1 3.2 100
47.3 45.9 0.0 6.8 100
49.2 43.6 0.0 7.2 100
44.7 48.9 0.0 6.4 100
45.0 34.1 0.1 20.8 100
43.9 32.9 0.0 23.2 100
46.6 35.9 0.3 17.2 100
Young Children
IN BALWADI / ANGANWADI OR IN SCHOOL
% Children in pre-school or school
Age : 3 ALL
Age : 4 ALL
Age : 5 ALL
Age : 6 ALL
In
balw
ad
io
ran
gan
wad
i
In school
Govt. Pvt. Other
Not
goin
gan
yw
here
Total
37.5 2.5 60.0 100
74.8 4.7 20.5 100
71.3 12.0 13.0 0.1 3.7 100
30.1 33.1 35.2 0.0 1.7 100
I
II
III
IV
V
VI
VII
VIII
Std.5 6 7 8 9 10 11 12 13 14 15 16 Total
% Children in each standard by age
AGE BY STANDARD FOR SCHOOL CHILDREN
5.1 31.6 44.3 12.0 4.2 2.9 100
0.8 6.3 20.6 39.9 19.0 7.7 5.8 100
0.7 2.5 5.7 22.0 33.7 18.3 7.8 9.4 100
0.7 2.2 5.4 15.9 37.0 12.0 13.5 13.4 100
1.2 3.5 6.0 24.0 26.0 19.5 10.2 9.7 100
0.6 2.9 6.6 11.6 39.6 18.4 12.9 7.3 100
1.2 2.6 3.2 17.1 31.4 26.1 11.0 7.5 100
0.5 0.4 4.2 18.4 37.4 22.8 16.3 100
158 ASER 2006

Learning Level
Reading : % Children who CAN read
I
II
III
IV
V
VI
VII
VIII
Total
Std. Nothing Letter WordLevel 1(Std 1)
text
Level 2(Std 2)
text
Total
4.1 53.8 34.5 5.3 2.3 100
2.3 25.7 48.6 17.0 6.4 100
2.0 11.5 38.3 30.5 17.8 100
0.7 3.0 22.6 38.1 35.7 100
1.0 2.8 20.1 30.9 45.4 100
0.4 2.4 10.5 22.3 64.5 100
0.3 4.1 7.7 17.7 70.2 100
0.1 2.1 4.8 6.4 86.7 100
1.4 13.4 24.3 21.4 39.6 100
Std.
Arithmetic : % Children who CAN
NothingRecognizenumbers
Subtract Divide Total
I
II
III
IV
V
VI
VII
VIII
Total
10.1 81.5 5.6 2.8 100
4.5 70.2 18.6 6.7 100
2.1 45.1 37.0 15.8 100
1.2 15.4 47.7 35.7 100
2.2 11.2 36.2 50.4 100
0.9 6.2 26.6 66.4 100
0.3 3.6 21.5 74.6 100
0.2 1.0 9.9 88.9 100
2.7 30.6 25.8 40.8 100
Writing : % Children whoCAN correctly write
One simple dictatedsentence
I
II
III
IV
V
VI
VII
VIII
Total
Std.
III
IV
V
VI
VII
VIII
Total
Comprehension : % Readers (Level 2) who CAN
Answer atleast onequestion
Answer bothquestions
Solve atleast one
wordproblem
Solve bothword
problems
Std.
74.8 66.8 65.4 54.2
80.5 67.7 63.3 47.1
89.2 78.3 72.2 56.6
91.5 83.0 75.0 63.6
94.8 92.0 89.1 80.1
96.5 93.6 94.6 90.3
90.8 84.1 80.7 70.5
23.0
43.5
66.7
89.8
94.4
96.9
98.6
99.3
75.8
NAGALAND RURAL
ASER 2006 159
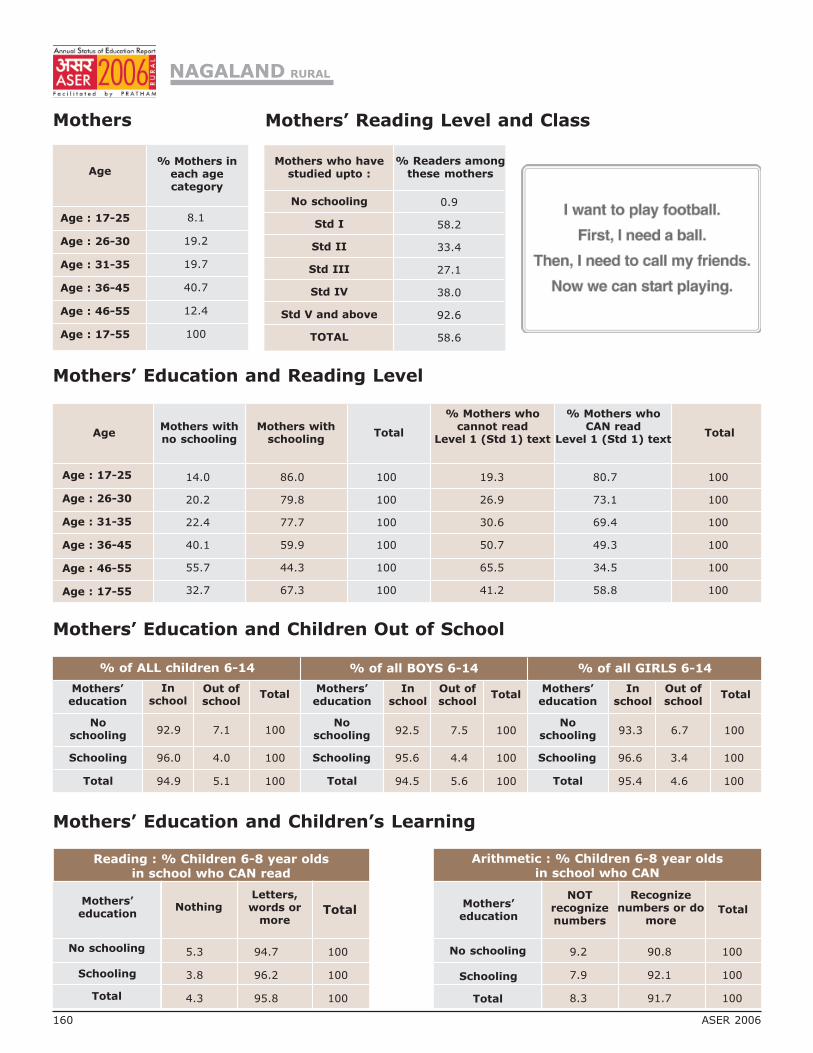
Mothers
Mothers’ Education and Children Out of School
Mothers’ Education and Children’s Learning
Age% Mothers in
each agecategory
Age : 17-25
Age : 26-30
Age : 31-35
Age : 36-45
Age : 46-55
Age : 17-55
% of ALL children 6-14 % of all BOYS 6-14 % of all GIRLS 6-14
Mothers’education
Noschooling
Schooling
Total
Mothers’education
Noschooling
Schooling
Total
Mothers’education
Noschooling
Schooling
Total
Inschool
Out ofschool
TotalIn
schoolOut ofschool
TotalIn
schoolOut ofschool
Total
Mothers’education
No schooling
Schooling
Total
Letters,words or
moreTotal
NOTrecognizenumbers
Recognizenumbers or do
moreTotal
Mothers’education
No schooling
Schooling
Total
Nothing
Mothers’ Education and Reading Level
AgeMothers withno schooling
Mothers withschooling
Total
% Mothers whocannot read
Level 1 (Std 1) text
% Mothers whoCAN read
Level 1 (Std 1) textTotal
Age : 17-25
Age : 26-30
Age : 31-35
Age : 36-45
Age : 46-55
Age : 17-55
NAGALAND RURAL
8.1
19.2
19.7
40.7
12.4
100
92.9 7.1 100
96.0 4.0 100
94.9 5.1 100
92.5 7.5 100
95.6 4.4 100
94.5 5.6 100
93.3 6.7 100
96.6 3.4 100
95.4 4.6 100
5.3 94.7 100
3.8 96.2 100
4.3 95.8 100
9.2 90.8 100
7.9 92.1 100
8.3 91.7 100
14.0 86.0 100 19.3 80.7 100
20.2 79.8 100 26.9 73.1 100
22.4 77.7 100 30.6 69.4 100
40.1 59.9 100 50.7 49.3 100
55.7 44.3 100 65.5 34.5 100
32.7 67.3 100 41.2 58.8 100
Reading : % Children 6-8 year oldsin school who CAN read
Arithmetic : % Children 6-8 year oldsin school who CAN
160 ASER 2006
Mothers who havestudied upto :
% Readers amongthese mothers
No schooling
Std I
Std II
Std III
Std IV
Std V and above
TOTAL
Mothers’ Reading Level and Class
0.9
58.2
33.4
27.1
38.0
92.6
58.6

Districts
Anganwadior school
Out ofschool
Privateschool
Mothers’Reading
Std 1-2 :Learning levels
Std 3-5 :Learning levels
%Children
(Age 3-5)in
Anganwadior
school
% Children(Age:6-14)Out ofSchool
% Children(Age:6-14)
inPrivateschool
%mothers
whoCAN
READ
% Children(Std 1-2) who
CAN readletters, words
or more
% Children(Std 3-5) who
CAN readLevel 1
(Std 1) textor more
%Children (Std
1-2) whoCAN
recognizenumbersor more
%Children
(Std 3-5) whoCANdo
subtraction ormore
Performance of districts
NAGALAND RURAL
ASER 2006 161
Mokokchung 73.5 1.7 54.8 94.6 97.7 97.7 70.2 50.4
Zunheboto 100 0.7 74.1 91.3 98.7 98.6 90.0 93.1
Wokha 89.5 4.7 32.4 68.2 91.9 91.7 67.9 82.5
Dimapur 87.9 1.3 52.4 66.3 100.0 94.9 88.5 91.4
Phek 79.3 15.5 28.2 41.4 95.8 90.2 27.3 70.7
Peren 99.1 0.7 65.5 49.0 98.8 98.8 88.6 84.7
Longleng Data for this district is incomplete
Kiphire 91.7 1.8 45.7 71.0 92.1 91.8 61.4 67.2
Tuensang 50.4 5.9 33.8 40.2 94.8 83.2 59.7 59.9
Kohima 85.2 3.3 60.8 57.1 100.0 98.0 84.2 87.6
Total 79.7 5.0 48.7 58.8 96.9 92.9 65.5 73.5

ARUNACHALPRADESH RURAL
All analysis based on data from 8 out of 13 districts
Enrollment
Age and Class
SCHOOL ENROLLMENT AND OUT OF SCHOOL CHILDREN
% Children in each age groupin different types of schools
% Children out ofschool
Govt. Pvt.Other
(Madarsa + EGS)Not in school (Neverenrolled + drop out)
Total
Age : 7-16 ALL
Age : 7-10 ALL
Age : 7-10 BOYS
Age : 7-10 GIRLS
Age : 11-14 ALL
Age : 11-14 BOYS
Age : 11-14 GIRLS
Age : 15-16 ALL
Age : 15-16 BOYS
Age : 15-16 GIRLS
75.6 13.7 1.0 9.7 100
74.0 17.9 1.5 6.7 100
74.3 19.0 1.5 5.2 100
73.6 16.6 1.5 8.3 100
79.3 11.7 0.7 8.2 100
77.5 14.3 0.6 7.6 100
81.1 9.2 0.9 8.8 100
72.1 8.7 0.2 19.1 100
73.9 7.8 0.2 18.2 100
69.6 9.9 0.2 20.2 100
Young Children
IN BALWADI / ANGANWADI OR IN SCHOOL
% Children in pre-school or school
Age : 3 ALL
Age : 4 ALL
Age : 5 ALL
Age : 6 ALL
In
balw
ad
io
ran
gan
wad
i
In school
Govt. Pvt. Other
Not
goin
gan
yw
here
Total
49.0 6.2 44.8 100
50.1 17.1 32.8 100
26.7 42.5 13.8 0.5 16.5 100
4.9 62.5 19.5 2.5 10.6 100
I
II
III
IV
V
VI
VII
VIII
Std.5 6 7 8 9 10 11 12 13 14 15 16 Total
% Children in each standard by age
AGE BY STANDARD FOR SCHOOL CHILDREN
20.1 32.5 18.4 14.6 5.8 8.6 100
2.7 14.9 23.3 20.9 10.3 15.2 12.7 100
0.8 4.9 12.4 22.3 19.1 16.5 5.6 18.5 100
1.4 2.7 10.4 15.7 26.1 11.1 13.9 18.6 100
2.2 3.0 6.6 26.6 15.9 19.4 7.8 18.5 100
1.5 2.3 9.3 12.8 29.0 17.4 12.5 15.2 100
0.9 3.0 5.0 19.8 25.6 24.7 11.3 9.8 100
1.7 1.8 11.4 19.7 28.5 20.4 16.6 100
162 ASER 2006

Learning Level
Reading : % Children who CAN read
I
II
III
IV
V
VI
VII
VIII
Total
Std. Nothing Letter WordLevel 1(Std 1)
text
Level 2(Std 2)
text
Total
30.8 43.6 18.7 3.7 3.3 100
16.6 29.3 39.5 7.4 7.2 100
10.5 18.0 35.8 19.9 16.0 100
3.6 7.7 23.1 30.1 35.5 100
2.3 3.9 16.6 30.1 47.1 100
0.7 1.6 5.8 25.5 66.4 100
0.4 0.6 3.3 21.6 74.2 100
0.3 0.6 1.4 10.8 86.9 100
10.5 16.7 20.2 17.5 35.1 100
Std.
Arithmetic : % Children who CAN
NothingRecognizenumbers
Subtract Divide Total
I
II
III
IV
V
VI
VII
VIII
Total
44.3 47.1 5.1 3.4 100
21.2 49.4 22.5 7.1 100
12.9 33.2 36.9 17.1 100
4.9 16.9 40.3 37.9 100
3.2 8.4 36.5 51.8 100
1.3 4.4 25.5 68.9 100
1.7 3.3 18.8 76.2 100
1.0 2.3 9.9 86.9 100
14.6 24.8 24.1 36.6 100
Writing : % Children whoCAN correctly write
One simple dictatedsentence
I
II
III
IV
V
VI
VII
VIII
Total
Std.
III
IV
V
VI
VII
VIII
Total
Comprehension : % Readers (Level 2) who CAN
Answer atleast onequestion
Answer bothquestions
Solve atleast one
wordproblem
Solve bothword
problems
Std.
86.7 80.4 81.7 72.7
88.5 84.5 84.5 76.8
90.3 84.0 86.8 78.0
94.5 87.5 90.4 81.0
95.4 88.7 89.7 83.9
97.1 90.3 95.2 89.2
93.2 86.9 89.4 81.7
17.8
35.7
52.0
73.2
85.1
92.5
96.0
96.7
62.4
ARUNACHALPRADESH RURAL
ASER 2006 163
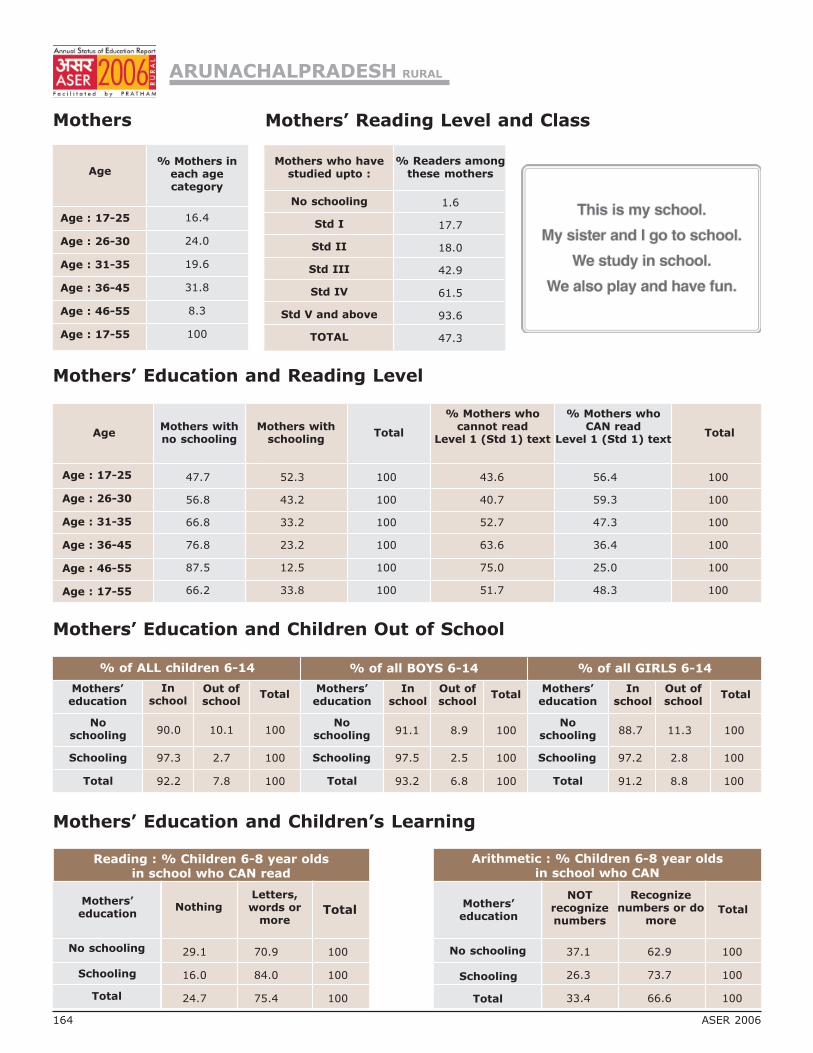
Mothers
Mothers’ Education and Children Out of School
Mothers’ Education and Children’s Learning
Age% Mothers in
each agecategory
Age : 17-25
Age : 26-30
Age : 31-35
Age : 36-45
Age : 46-55
Age : 17-55
% of ALL children 6-14 % of all BOYS 6-14 % of all GIRLS 6-14
Mothers’education
Noschooling
Schooling
Total
Mothers’education
Noschooling
Schooling
Total
Mothers’education
Noschooling
Schooling
Total
Inschool
Out ofschool
TotalIn
schoolOut ofschool
TotalIn
schoolOut ofschool
Total
Mothers’education
No schooling
Schooling
Total
Letters,words or
moreTotal
NOTrecognizenumbers
Recognizenumbers or do
moreTotal
Mothers’education
No schooling
Schooling
Total
Nothing
Mothers’ Education and Reading Level
AgeMothers withno schooling
Mothers withschooling
Total
% Mothers whocannot read
Level 1 (Std 1) text
% Mothers whoCAN read
Level 1 (Std 1) textTotal
Age : 17-25
Age : 26-30
Age : 31-35
Age : 36-45
Age : 46-55
Age : 17-55
ARUNACHALPRADESH RURAL
16.4
24.0
19.6
31.8
8.3
100
90.0 10.1 100
97.3 2.7 100
92.2 7.8 100
91.1 8.9 100
97.5 2.5 100
93.2 6.8 100
88.7 11.3 100
97.2 2.8 100
91.2 8.8 100
29.1 70.9 100
16.0 84.0 100
24.7 75.4 100
37.1 62.9 100
26.3 73.7 100
33.4 66.6 100
47.7 52.3 100 43.6 56.4 100
56.8 43.2 100 40.7 59.3 100
66.8 33.2 100 52.7 47.3 100
76.8 23.2 100 63.6 36.4 100
87.5 12.5 100 75.0 25.0 100
66.2 33.8 100 51.7 48.3 100
Reading : % Children 6-8 year oldsin school who CAN read
Arithmetic : % Children 6-8 year oldsin school who CAN
164 ASER 2006
Mothers who havestudied upto :
% Readers amongthese mothers
No schooling
Std I
Std II
Std III
Std IV
Std V and above
TOTAL
1.6
17.7
18.0
42.9
61.5
93.6
47.3
Mothers’ Reading Level and Class

Districts
Anganwadior school
Out ofschool
Privateschool
Mothers’Reading
Std 1-2 :Learning levels
Std 3-5 :Learning levels
%Children
(Age 3-5)in
Anganwadior
school
% Children(Age:6-14)Out ofSchool
% Children(Age:6-14)
inPrivateschool
%mothers
whoCAN
READ
% Children(Std 1-2) who
CAN readletters, words
or more
% Children(Std 3-5) who
CAN readLevel 1
(Std 1) textor more
%Children (Std
1-2) whoCAN
recognizenumbersor more
%Children
(Std 3-5) whoCANdo
subtraction ormore
Performance of districts
ARUNACHALPRADESH RURAL
ASER 2006 165
Tawang 77.0 12.5 7.0 27.1 79.1 75.5 56.7 73.8
East Kameng Data for this district is incomplete
Papumpare 90.0 3.8 26.7 67.5 97.8 96.3 80.1 84.9
Upper Subansiri 52.8 7.4 11.6 54.7 25.5 24.2 76.3 74.8
East Siang 61.9 4.6 11.7 72.1 95.5 77.5 49.1 71.9
Dibang Valley 77.5 3.0 17.8 89.5 70.6 69.0 79.2 85.9
Lohit 70.1 7.4 11.0 41.8 94.0 79.4 61.7 81.9
Tirap 46.1 11.7 24.7 39.5 73.6 62.0 48.5 61.9
Total 68.7 7.7 15.7 48.3 75.6 66.0 58.7 72.8

TRIPURA RURAL
All analysis based on data from 2 out of 4 districts
Enrollment
Age and Class
SCHOOL ENROLLMENT AND OUT OF SCHOOL CHILDREN
% Children in each age groupin different types of schools
% Children out ofschool
Govt. Pvt.Other
(Madarsa + EGS)Not in school (Neverenrolled + drop out)
Total
Age : 7-16 ALL
Age : 7-10 ALL
Age : 7-10 BOYS
Age : 7-10 GIRLS
Age : 11-14 ALL
Age : 11-14 BOYS
Age : 11-14 GIRLS
Age : 15-16 ALL
Age : 15-16 BOYS
Age : 15-16 GIRLS
87.1 4.1 1.3 7.5 100
88.1 7.7 2.1 2.2 100
86.4 7.7 3.2 2.8 100
90.0 7.7 0.9 1.4 100
89.3 1.6 1.1 8.0 100
88.7 1.3 1.5 8.6 100
90.1 2.1 0.5 7.3 100
80.3 1.5 0.0 18.2 100
76.7 2.2 0.0 21.1 100
84.9 0.6 0.0 14.4 100
Young Children
IN BALWADI / ANGANWADI OR IN SCHOOL
% Children in pre-school or school
Age : 3 ALL
Age : 4 ALL
Age : 5 ALL
Age : 6 ALL
In
balw
ad
io
ran
gan
wad
i
In school
Govt. Pvt. Other
Not
goin
gan
yw
here
Total
53.8 3.2 43.0 100
73.0 5.8 21.3 100
78.5 4.8 5.3 0.8 10.6 100
30.5 52.5 10.7 0.0 6.2 100
I
II
III
IV
V
VI
VII
VIII
Std.5 6 7 8 9 10 11 12 13 14 15 16 Total
% Children in each standard by age
AGE BY STANDARD FOR SCHOOL CHILDREN
2.6 32.7 47.4 12.2 3.2 2.1 0.0 100
0.9 4.8 17.9 44.2 18.3 10.3 2.1 1.5 100
0.0 0.0 2.1 13.8 37.1 30.4 6.9 2.9 6.8 100
0.0 0.6 0.9 13.6 41.5 24.1 11.4 4.9 3.0 100
0.0 0.5 1.0 12.8 34.7 25.6 18.5 5.4 1.6 100
0.0 0.9 4.8 7.0 46.7 16.1 16.1 3.2 5.2 100
1.0 0.6 0.0 13.5 34.2 26.0 16.5 8.2 100
0.0 0.0 11.8 20.4 39.6 16.7 11.6 100

Learning Level
Reading : % Children who CAN read
I
II
III
IV
V
VI
VII
VIII
Total
Std. Nothing Letter WordLevel 1(Std 1)
text
Level 2(Std 2)
text
Total
5.2 24.4 46.2 22.8 1.5 100
4.1 20.1 26.7 43.7 5.4 100
0.0 7.6 26.4 43.3 22.7 100
0.6 2.9 24.8 40.3 31.5 100
0.0 1.6 14.4 35.9 48.0 100
0.0 0.0 11.2 32.6 56.2 100
0.0 0.6 3.1 29.4 66.9 100
0.0 0.0 0.7 14.9 84.4 100
1.5 8.6 21.0 34.4 34.5 100
Std.
Arithmetic : % Children who CAN
NothingRecognizenumbers
Subtract Divide Total
I
II
III
IV
V
VI
VII
VIII
Total
29.0 53.2 14.5 3.3 100
16.2 36.0 36.7 11.1 100
6.1 29.0 42.0 23.0 100
3.3 19.7 41.1 36.0 100
1.1 12.6 42.1 44.2 100
1.0 17.0 36.6 45.5 100
1.7 5.2 36.9 56.2 100
0.0 4.5 21.7 73.8 100
8.4 24.4 34.5 32.7 100
III
IV
V
VI
VII
VIII
Total
Comprehension : % Readers (Level 2) who CAN
Answer atleast onequestion
Answer bothquestions
Solve atleast one
wordproblem
Solve bothword
problems
Std.
100.0 92.8 96.0 84.8
100.0 95.8 95.8 91.6
100.0 96.2 93.2 87.9
100.0 94.9 100.0 93.7
99.1 95.7 93.8 85.8
99.1 97.3 95.4 90.3
99.6 95.7 95.6 89.0
Writing : % Children whoCAN correctly write
One simple dictatedsentence
I
II
III
IV
V
VI
VII
VIII
Total
Std.
53.2
65.7
83.7
89.2
95.9
98.2
98.2
99.2
83.1
TRIPURA RURAL

Mothers
Mothers’ Education and Children Out of School
Mothers’ Education and Children’s Learning
Age% Mothers in
each agecategory
Age : 17-25
Age : 26-30
Age : 31-35
Age : 36-45
Age : 46-55
Age : 17-55
% of ALL children 6-14 % of all BOYS 6-14 % of all GIRLS 6-14
Mothers’education
Noschooling
Schooling
Total
Mothers’education
Noschooling
Schooling
Total
Mothers’education
Noschooling
Schooling
Total
Inschool
Out ofschool
TotalIn
schoolOut ofschool
TotalIn
schoolOut ofschool
Total
Mothers’education
No schooling
Schooling
Total
Letters,words or
moreTotal
NOTrecognizenumbers
Recognizenumbers or do
moreTotal
Mothers’education
No schooling
Schooling
Total
Nothing
Mothers’ Education and Reading Level
AgeMothers withno schooling
Mothers withschooling
Total
% Mothers whocannot read
Level 1 (Std 1) text
% Mothers whoCAN read
Level 1 (Std 1) textTotal
Age : 17-25
Age : 26-30
Age : 31-35
Age : 36-45
Age : 46-55
Age : 17-55
TRIPURA RURAL
12.7
25.2
26.1
30.4
5.7
100
87.6 12.4 100
96.7 3.3 100
95.0 5.0 100
87.4 12.7 100
95.8 4.2 100
94.1 5.9 100
88.0 12.0 100
97.8 2.3 100
96.0 4.0 100
11.9 88.1 100
3.0 97.1 100
4.5 95.5 100
29.6 70.4 100
18.0 82.0 100
20.0 80.0 100
13.8 86.2 100 19.6 80.4 100
11.5 88.5 100 21.6 78.4 100
17.0 83.1 100 21.7 78.3 100
21.0 79.0 100 26.1 73.9 100
39.9 60.1 100 21.1 78.9 100
17.7 82.3 100 22.7 77.3 100
Reading : % Children 6-8 year oldsin school who CAN read
Arithmetic : % Children 6-8 year oldsin school who CAN
Mothers who havestudied upto :
% Readers amongthese mothers
No schooling
Std I
Std II
Std III
Std IV
Std V and above
TOTAL
1.4
45.2
31.6
33.5
68.6
93.8
77.3
Mothers’ Reading Level and Class

Districts
Performance of districts
Anganwadior school
Out ofschool
Privateschool
Mothers’Reading
Std 1-2 :Learning levels
Std 3-5 :Learning levels
%Children
(Age 3-5)in
Anganwadior
school
% Children(Age:6-14)Out ofSchool
% Children(Age:6-14)
inPrivateschool
%mothers
whoCAN
READ
% Children(Std 1-2) who
CAN readletters, words
or more
% Children(Std 3-5) who
CAN readLevel 1
(Std 1) textor more
%Children (Std
1-2) whoCAN
recognizenumbersor more
%Children
(Std 3-5) whoCANdo
subtraction ormore
TRIPURA RURAL
Dhalai 62.8 1.9 5.5 76.0 95.4 79.7 71.7 66.2
North Tripura 82.1 6.7 5.2 78.0 95.5 78.1 74.2 79.8
Total 74.4 5.2 5.3 77.3 95.5 78.5 73.3 75.1

170 ASER 2006

Annexures
ASER 2006 171

Sample
* S
urv
ey c
onducte
d in a
ll A
ssam
dis
tric
ts b
ut
data
available
only
for
16 f
or
this
pro
vis
ional re
port
. Sik
kim
not
surv
eyed.
Sta
teN
o.
of
Dis
tric
tsTota
lD
istr
icts
Tota
lVilla
ges
Tota
lH
ouse-
hold
s
All 3
-5 y
ear
old
All 6
-14 y
ear
old
All 1
5-1
6 y
ear
old
Wom
en
Tota
lw
om
en
surv
eyed
17+
Tota
lnum
ber
of
moth
ers
in
age 1
7-5
5
Tota
lM
ale
Fem
ale
Tota
lM
ale
Fem
ale
Tota
lM
ale
Fem
ale
Jam
mu &
Kashm
ir 1
4 1
3 3
67
7,3
09
2,7
20
1,4
17
1,3
03
13,1
83
7,1
43
6,0
40
2,8
87
1,6
30
1,2
57
12,4
04
6,7
65
Him
achal
Pra
desh
12
12
353
6,8
37
2,5
94
1,3
86
1,2
08
8,9
44
4,6
63
4,2
81
2,0
72
1,0
58
1,0
14
12,5
24
6,1
92
Punja
b 1
8 1
8 5
22
10,7
26
3,2
67
1,8
62
1,4
05
13,3
65
7,5
58
5,8
07
3,1
10
1,7
10
1,4
00
18,2
56
9,7
07
Utt
ara
nchal
13
13
356
7,4
18
3,5
81
1,9
66
1,6
15
10,6
66
5,9
40
4,7
26
2,2
77
1,3
80
897
10,8
50
6,8
29
Hary
ana
20
20
574
11,9
73
5,2
96
3,0
06
2,2
90
17,2
48
9,7
57
7,4
91
3,8
93
2,3
87
1,5
06
20,5
20
11,7
26
Raja
sth
an
32
31
915
18,5
47
9,1
68
5,1
83
3,9
85
30,5
45
17,6
09
12,9
36
6,0
90
4,0
35
2,0
55
28,3
23
18,2
51
UP
69
69
2,0
46
41,4
02
23,6
42
13,0
51
10,5
91
87,6
55
49,6
80
37,9
75
16,0
13
9,5
82
6,4
31
75,2
55
47,4
96
Bih
ar
37
37
1,0
82
22,0
63
20,0
65
10,7
62
9,3
03
53,3
85
30,0
61
23,3
24
6,4
27
4,1
72
2,2
55
40,7
55
29,4
43
Aru
nachal
Pra
desh
13
8 2
09
4,3
51
2,2
02
1,1
51
1,0
51
6,8
98
3,5
52
3,3
46
1,4
46
817
629
5,5
98
3,8
65
Nagala
nd
11
10
261
5,5
16
1,7
99
958
841
8,8
79
5,0
56
3,8
23
1,7
21
1,0
59
662
8,0
96
4,7
09
Manip
ur
9 8
177
3,9
05
1,9
22
935
987
6,4
15
3,2
83
3,1
32
1,2
83
695
588
6,9
72
3,5
24
Miz
ora
m 8
7 1
51
3,1
00
1,4
96
767
729
4,8
69
2,4
46
2,4
23
899
501
398
4,4
66
2,5
54
Tripura
4 2
56
1,1
21
332
174
158
1,2
31
675
556
278
153
125
1,6
42
1,0
02
Meghala
ya
7 5
129
2,4
96
1,3
20
686
634
4,4
53
2,2
29
2,2
24
997
540
457
3,3
23
2,0
08
Assam
* 2
3 1
6 4
72
9,6
16
3,3
60
1,7
44
1,6
16
13,4
80
7,0
43
6,4
37
1,8
19
959
860
13,2
56
8,1
29
West
Bengal
17
16
455
9,1
77
3,9
46
2,1
22
1,8
24
13,2
98
6,9
87
6,3
11
2,2
24
1,1
88
1,0
36
14,6
47
9,4
28
Jhark
hand
22
22
642
12,9
61
8,1
44
4,1
48
3,9
96
24,7
60
13,2
65
11,4
95
3,5
95
2,2
03
1,3
92
20,8
42
14,2
35
Orissa
30
30
886
17,7
42
6,0
89
3,1
98
2,8
91
25,5
31
13,6
00
11,9
31
5,0
57
2,8
33
2,2
24
28,8
99
16,2
08
Chhatt
isgarh
16
16
433
9,0
10
4,3
34
2,1
80
2,1
54
12,5
75
6,3
25
6,2
50
2,6
31
1,3
80
1,2
51
14,2
58
8,6
30
Madhya P
radesh
45
45
1,2
87
25,7
99
12,3
53
6,5
86
5,7
67
44,3
20
25,1
04
19,2
16
6,3
89
3,8
95
2,4
94
40,8
13
25,9
72
Guja
rat
25
25
730
14,9
58
6,4
14
3,7
20
2,6
94
23,7
35
13,8
92
9,8
43
3,8
95
2,4
88
1,4
07
22,7
75
14,7
90
Dam
an &
Diu
2 2
15
1,1
61
526
275
251
2,0
08
1,0
36
972
334
159
175
1,9
46
1,1
75
Dadra
& N
agar
Haveli
1 1
25
609
249
141
108
928
500
428
166
105
61
789
562
Mahara
shtr
a 3
3 3
3 9
73
19,7
54
7,4
75
3,9
71
3,5
04
25,8
33
13,5
30
12,3
03
5,2
25
2,9
14
2,3
11
32,1
41
17,9
97
Andhra
Pra
desh
22
22
605
11,8
61
3,2
19
1,6
95
1,5
24
16,0
12
8,1
85
7,8
27
2,9
02
1,5
96
1,3
06
13,8
33
9,9
75
Karn
ata
ka
27
27
795
16,1
94
5,2
22
2,7
43
2,4
79
20,9
72
10,2
79
10,6
93
3,4
91
1,6
94
1,7
97
28,0
73
15,2
62
Goa
2 2
50
1,0
30
279
164
115
944
452
492
243
134
109
1,6
69
767
Kera
la 1
4 1
4 3
67
7,8
81
2,1
94
1,0
74
1,1
20
9,9
77
4,9
02
5,0
75
1,7
90
836
954
13,0
74
7,3
15
Tam
il N
adu
29
29
830
17,2
88
4,3
89
2,1
99
2,1
90
21,1
94
10,3
58
10,8
36
4,4
48
2,0
93
2,3
55
24,9
80
14,6
40
Pondic
herr
y 2
2 5
3 1
,138
264
128
136
1,1
78
553
625
294
128
166
1,8
95
900
Andam
an &
Nic
obar
2 1
29
575
193
77
116
606
319
287
121
58
63
727
525
To
tal
57
9 5
56
15
,84
5 3
23
,51
8 1
48
,05
4 7
9,4
69
68
,58
5 5
25
,08
7 2
85
,98
2 2
39
,10
5 9
4,0
17
54
,38
2 3
9,6
35
52
3,6
01
32
0,5
81
172 ASER 2006

The purpose of rural ASER 2006 is twofold: (i) to get reliable estimates of the status of children'sschooling and basic learning (reading, writing and math ability) at the district level; and (ii) tomeasure the change in these basic learning and school statistics from last year. In addition to thebasic learning tools that we introduced last year, we have added some higher level tools to thequestionnaire this year. It is also well known that the mother's education level has an importanteffect on the child's educational status as well as learning levels. Therefore, in ASER 2006 we alsohave questions on parents' educational level and the mother will be tested for basic reading.
Since one of the goals of ASER 2006 Rural is to generate estimates of change in learning between2005 and 2006, a panel survey design would provide more efficient estimates of the change. However,given the large sample size of ASER 2005 and cost considerations, we adopted a panel of villagesrather than children. Therefore, ASER 2006 Rural was conducted in all the villages of ASER 2005. Inaddition, we have added 10 villages in each district.
The sampling strategy used generates a representative picture of each district. The aim was tosurvey all rural districts. The estimates obtained are then aggregated to the state and all-India levels.
Since estimates were to be generated at the district level, the minimum sample size calculations hadto start at the district level. The sample size is determined by the following considerations:●●●●● Incidence of what is being measured in the population. Since a survey of learning has never
been done in India, the incidence of what we are trying to measure is unknown in the population1.●●●●● Confidence level of estimates. The standard used is 95%.●●●●● Precision required on either side of the true value. The standard degree of accuracy most
surveys employ is between 5 and 10 per cent. An absolute precision of 5 % along with a 95%confidence level implies that the estimates generated by the survey will be within 5 percentagepoints of the true values with a 95% probability. The precision can also be specified in relativeterms --- a relative precision of 5% means that the estimates will be within 5% of the truevalue. Relative precision requires higher sample sizes.
Sample size calculations can be done in various ways, depending on what assumptions are madeabout the underlying population. With a 50% incidence, 95% confidence level and 5% absoluteprecision, the minimum sample size required in each strata2 is 3843. This derivation assumes thatthe population proportion is normally distributed. On the other hand, a sample size of 384 wouldimply a relative precision of 10%. If we were to require a 5% relative precision, the sample size wouldincrease to 16004. Note that all the sample size calculations require estimating the incidence in thepopulation. In our case, we can get an estimate of the incidence from ASER 2005. However, incidencevaries across different indicators - so incidence of reading ability is different from incidence of dropouts.In addition, we often want to measure things that are not binary for which we need more observations.Given these considerations, the sample size was decided to be 600 households in each district.In each district5, we have 20 villages from ASER 2005 and an additional 10 villages have been addedthis year to the sample, giving us a total of 30 villages per district.
Dr. Wilima Wadhwa
Sample Design of Rural ASER 2006
1 For the rural sector we can use the estimates from ASER 2005 to get an idea of the incidence in the population.
2 Stratification is discussed below.
3 The sample size with absolute precision is given by where z is the standard normal deviate corresponding to 95% probability (=1.96), p is the
incidence in the population (0.5), q=(1-p) and d is the degree of precision required (0.05).
4 The sample size with relative precision is given by where z is the standard normal deviate corresponding to 95% probability (=1.96), p is the
incidence in the population (0.5), q=(1-p) and r is the degree of relative precision required (0.1).
5 Sample size calculations assume simple random sampling. However, simple random sampling is unlikely to be the method of choice in an actual field survey.Therefore, often a “design effect” is added to the sample size. A design effect of 2 would double the sample size. At the district level a 7% precision along with a95% confidence level would imply a sample size of 196, giving us a design effect of approximately two.
z2
pq
d2
z2
q
r2
p
ASER 2006 173

6 Of these 30 villages, 20 are from ASER 2005. They were selected randomly from the same sample frame. The 10 new villages are picked as an independent sample.
7 Probability proportional to size (PPS) is a sampling technique in which the probability of selecting a sampling unit (village, in our case) is proportional to the size of itspopulation. The method works as follows: First, the cumulative population by village calculated. Second, the total household population of the district is divided by thenumber of sampling units (villages) to get the sampling interval (SI). Third, a random number between 1 and the SI is chosen. This is referred to as the random start(RS). The RS denotes the site of the first village to be selected from the cumulated population. Fourth, the following series of numbers is formed: RS; RS+SI; RS+2SI;RS+3SI; …. The villages selected are those for which the cumulative population, contains the numbers in the series.
8 Most large household surveys in India, like the National Sample Survey and the National Family Health Survey also use this two stage design and use PPS to selectvillages in the first stage.
9 In larger villages, the investigators increased the interval according to a rough estimate of the number of households in each part. For instance, if a village had 2000households, each part in the village would have roughly 500 households. Selecting every 5th household would leave out a large chunk of the village un-surveyed. In suchsituations, investigators were asked to increase the interval between selected households.
In each village 20 households are surveyed as in ASER 2005, giving a household sample size of 600per district. National estimates from ASER 2005 put the proportion of children who could not read alevel 1 paragraph at 35%. If we use this as a measure of incidence, then our sample size of 600would imply a relative precision of about 10% and an absolute precision of 3.8% at the district levelto measure the proportion of children who cannot read a simple Level 1 paragraph. Note that at thestate level and at the all-India level the survey has many more observations lending estimates atthose levels much higher levels of precision.
If we had houselists at the district level, the 600 households could be randomly selected. In theabsence of these, a two-stage sample design was adopted. In the first stage, 30 villages were randomlyselected using the village directory of the 2001 census as the sample frame6. In the second stage 20households were randomly selected in each of the 30 selected villages in the first stage.
Villages were selected using the probability proportional to size (PPS) sampling method. This methodallows villages with larger populations to have a higher chance of being selected in the sample. It ismost useful when the sampling units vary considerably in size because it assures that those in largersites have the same probability of getting into the sample as those in smaller sites, and vice verse.7,8
In the selected villages, 20 households are surveyed. Ideally, a complete houselist of the selectedvillage should have been made and 20 households selected randomly from it. However, given timeand resource constraints a procedure for selecting households was adopted that preserved randomnessas much as possible. The field investigators were asked to divide the village into four parts. This wasdone because villages often consist of hamlets and a procedure that randomly selects householdsfrom some central location may miss out households on the periphery of the village. In each of thefour parts, investigators were asked to start at a central location and pick every 5th household in acircular fashion till 5 households were selected. In each selected household, all children in the agegroup of 6-14 were tested.9
The survey provides estimates at the district, state and national levels. In order to aggregate estimatesup from the district level households had to assigned weights - also called inflation factors. Theinflation factor corresponding to a particular household denotes the number of households that thesampled household represents in the population. Given that 600 households are sampled in eachdistrict regardless of the size of the district, a household in a larger district will represent many morehouseholds and, therefore, have a larger weight associated with it than one in a sparsely populateddistrict.
The advantage of using PPS sampling is that the sample is self weighting at the district level. In otherwords, in each district the weight assigned to each of the sampled household turns out to be thesame. This is because, the inflation factor associated with a household is simply the inverse of theprobability of it being selected into the sample times the number of households in the sample. SincePPS sampling ensures that all households have an equal chance of being selected at the district level,
174 ASER 2006
10NSS 55th Round.
the weights associated with households in the same district are the same. Therefore, weighted estimatesare exactly the same as the un-weighted estimates at the district level. However, to get estimates atthe state and national levels, weighted estimates are needed since states have a different number ofdistricts and districts vary by population.
Even though the purpose of the survey is to estimate learning levels among children, the householdwas chosen as the second stage sampling unit. This has a number of advantages. First, children aretested at home rather than in school, allowing all children to be tested rather than just those inschool. Further, testing children in school might create a bias since teachers may encourage testingthe brighter children in class. Second, a household sample will generate an age distribution of childrenwhich can be cross-checked with other data sources, like the census and the NSS. Third, a householdsample makes calculation of the inflation factors easier since the population of children is no longerneeded.
Often household surveys are stratified on various parameters of interest. The reason for stratificationis to get enough observations on entities that have the characteristic that is being studied. Forinstance, the NSS uses a two stage stratified sample for their consumption surveys. In the first stagethe sample is stratified by population and in the second stage households are stratified on the basis oftheir affluence. The reason for doing this is that the purpose of the survey is to generate povertyestimates for which a representative sample must include enough non-affluent households. TheASER survey stratifies the sample by population in the first stage. No stratification was done at thesecond stage. Since the proportion of population in the 6-14 age group is about 22% and the averagehousehold size is about 5,10 a simple random sample at the second stage would yield enough childrenin the sample. Finally, if we were to stratify on households with children in the 6-14 age group, wewould need the population of such households in the village, which is not possible without a completehouselist of the village.
ASER 2006 175
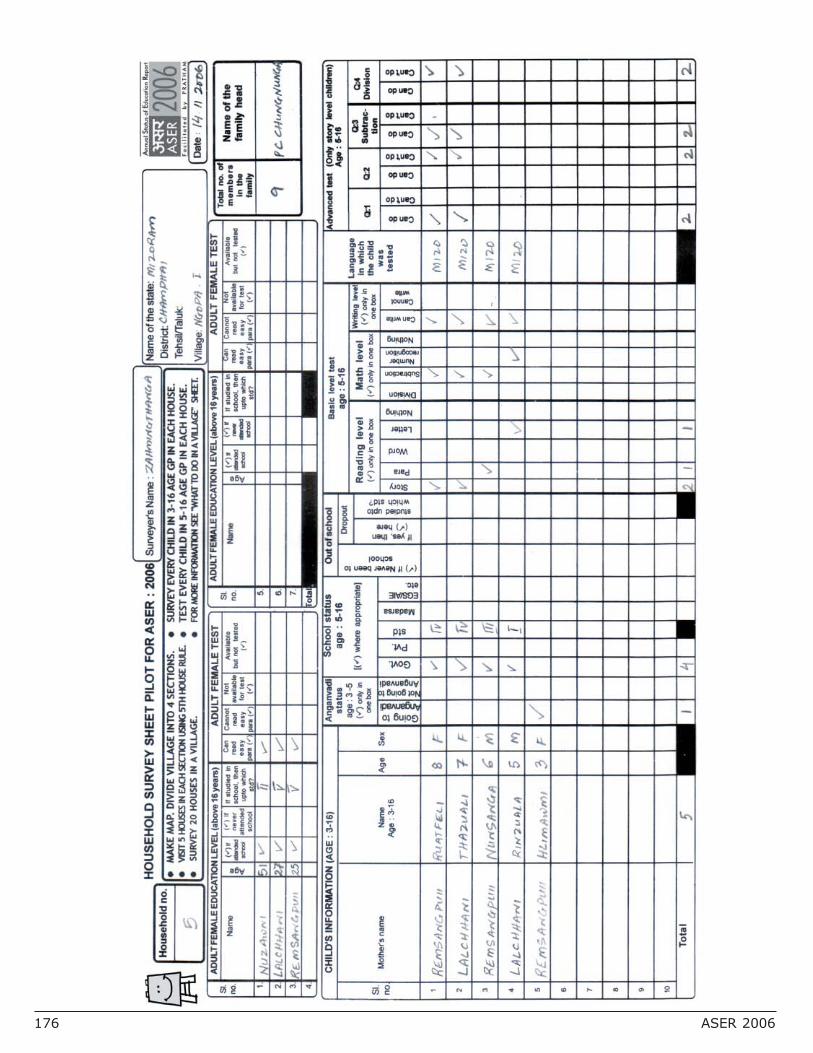
176 ASER 2006

ASER 2006 177
DONORS FOR RS. 2000/- AND ABOVE
Sr. No. Maharashtra1 Boeing International Corporation India Private Ltd.
(A subsidiary of Boeing Company)2 UNICEF3 Sankalp Bahuuddeshiya Prakalp, Ralegaon4 Bharati Shipyard Ltd., Ratanagiri5 Bhagvan Bavankar6 Nutan Mahavidyalaya Vikas Mandal7 Rajashree Sharma8 Samata Bahuuddeshiya Sanshta9 Dharmendra Chavan10 Patrick Martin11 Bhavesh Jain12 734 individuals from various districts supported
ASER by giving Rs. 50 to Rs. 3000 for the survey13 Sanjay Tendolkar14 Ganesh Pai15 Revati Paithankar
Bihar16 UNICEF17 Rukmini Banerji
Jharkhand18 UNICEF
Jammu and Kashmir19 Prof. Amitabh Mattoo, Vice Chancellor, Jammu University20 Dr. V. K. Bhutyal, Dist. Sheep Husbandry Officer, Leh
Haryana21 Reliance Industries Ltd.
Tamil Nadu22 Vibha, U.S.A.23 Deutsche Leasing & The Johanniter, Germany24 Association for India's Development, U.S.A.25 Disha Foundation, Chennai26 R. Ramadurai
Orissa27 277 individuals from various districts supported
ASER by giving Rs. 50 to Rs. 500 for the survey
Andaman & Nicobar28 UNICEF
West Bengal29 Calcutta Foundation
Goa & Dadra & Nagar Haveli30 31 individuals from various districts supported
ASER by giving Rs. 50 to Rs. 2000 for the survey
Karnataka31 Azim Premji Foundation32 Ashok Kamath33 Ajay Abraham George34 Lt. Col. Murthy Rajan35 Suzan Rahaman36 Saraswati Printers37 Raj Printers38 Standard Motors
Uttar Pradesh39 UNICEF
Support in cash and in kind
ASER 2006 was also funded through
grants from:
NOVIBThe Netherlands
Pratham India Education Initiative -
Rohini Nilekani
Pratham UK
Pratham USA
178 ASER 2006


![Delhi RTE Rules - Right To Educationrighttoeducation.in/sites/default/files/Delhi rte rules 2011.pdf · [TO BE PUBLISHED IN PART IV OF DELHI GAZETTE EXTRA-ORDINARY] ... section 38](https://static.documents.pub/doc/80x56/5ac164357f8b9ae45b8d4f6d/delhi-rte-rules-right-to-educa-rte-rules-2011pdfto-be-published-in-part-iv-of.jpg)

