

Asia’s Fashion Jewellery & Accessories Fair – September 2015
Exhibitor Survey Report
2
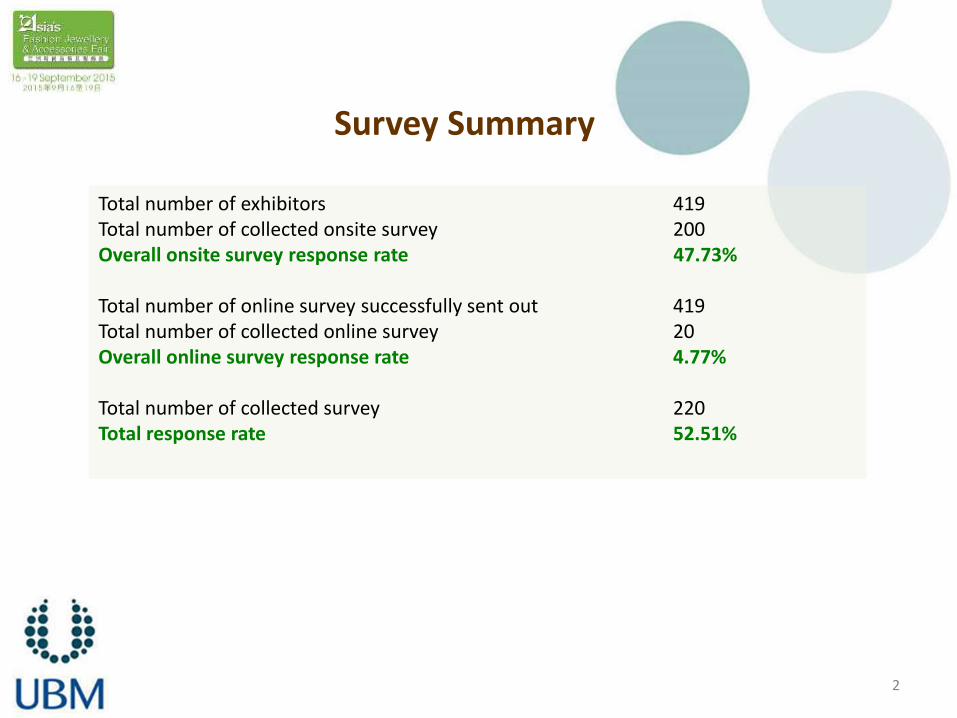
Survey Summary
Total number of exhibitors 419 Total number of collected onsite survey 200 Overall onsite survey response rate 47.73% Total number of online survey successfully sent out 419 Total number of collected online survey 20 Overall online survey response rate 4.77% Total number of collected survey 220 Total response rate 52.51%

3
Group Pavilions
2015 Number of Respondents: 133
45.1%
7.5%
18.8%
6.8%
6.8%
15.0%
0.0% 5.0% 10.0% 15.0% 20.0% 25.0% 30.0% 35.0% 40.0% 45.0% 50.0%
China Pavilion
Korea Pavilion
India Pavilion
Philippines Pavilion
Taiwan Pavilion
“Stainless Steel Jewellery” Pavilion

4
Nature of Business(es)
2015 Number of Respondents: 217 Number of Respondents: 184 2014
84.3%
3.2%
49.8%
18.4%
1.4%
3.7%
0.5%
12.0%
0.9%
0.5%
0.5%
86.4%
6.5%
48.4%
14.1%
1.6%
2.2%
0.0%
8.2%
0.0%
0.0%
0.5%
0% 10% 20% 30% 40% 50% 60% 70% 80% 90% 100%
Manufacturer/Supplier
Importer
Exporter
Wholesaler
Buying Agent
Retailer
Department / Chain Store
Fashion Jewellery / Accessories Designer
Mail Order-House / E-Tailer
Related Institute / Association
Publication
2014
2015

5
1. Is your company a first-time participant in this exhibition?
2015 Number of Respondents: 215 Number of Respondents: 187 2014
Yes, 6%
No, 94%
Yes, 8.8%
No, 91.2%

6
2. Overall, how would you rate your satisfaction with your experience at Asia’s Fashion Jewellery & Accessories Fair – September? (0 = Extremely dissatisfied, 10 = Extremely satisfied)
2015 Number of Respondents: 219 Number of Respondents: 175 2014
Average Rating 2015
5.44 Average Rating
2014
6.6*
2.74%
2.28%
5.48%
13.70%
8.22%
18.26%
12.79%
16.89%
11.42%
3.20%
5.02% 3.4%
1.1%
6.3%
4.0%
22.9%
20.6%
17.1% 18.9%
2.3% 3.4%
0%
5%
10%
15%
20%
25%
0 1 2 3 4 5 6 7 8 9 10
2015
2014
*Correspond to UBM Asia’s New Exhibitor/Visitor Survey includes adjustments in rating scale to comply with UBM Global standards, the rating system transformed from the scale of 1-10 to 0-10. In order to use it for comparison, the 2014 average rating is multiply by (11/10).

7
3. How likely would you be to participate in Asia’s Fashion Jewellery & Accessories Fair – September again in the future? (0 = Not at all likely, 10 = Extremely likely)
2015 Number of Respondents: 219
Average Rating 2015
6.52
1.37% 3.20%
3.65%
5.94%
5.48%
18.72%
7.76%
13.24%
16.44%
4.57%
19.63%
0%
5%
10%
15%
20%
25%
0 1 2 3 4 5 6 7 8 9 10
• More than 60% respondents gave a rating between 6 to 10.

8
4. How likely are you to recommend Asia’s Fashion Jewellery & Accessories Fair – September to a friend or colleague? (0 = Not at all likely, 10 = Extremely likely)
2015 Number of Respondents: 217
Average Rating 2015
5.81
5.1%
2.3%
4.1%
9.7%
4.6%
20.3%
9.2%
15.2% 15.7%
3.7%
10.1%
0%
5%
10%
15%
20%
25%
0 1 2 3 4 5 6 7 8 9 10
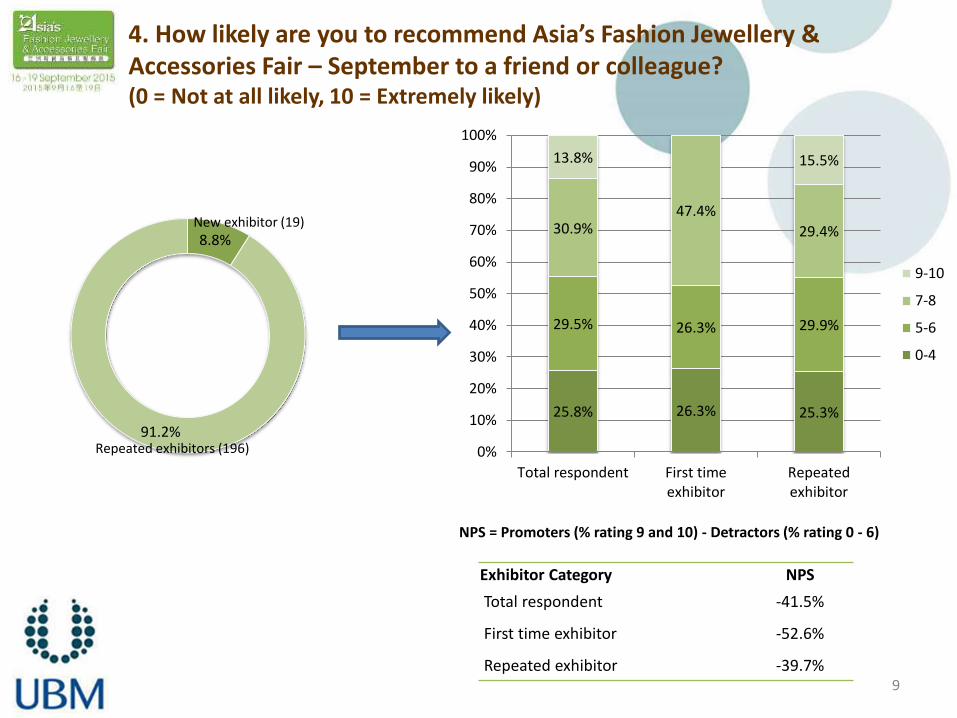
4. How likely are you to recommend Asia’s Fashion Jewellery & Accessories Fair – September to a friend or colleague? (0 = Not at all likely, 10 = Extremely likely)
NPS = Promoters (% rating 9 and 10) - Detractors (% rating 0 - 6)
8.8%
91.2%
New exhibitor (19)
Repeated exhibitors (196)
25.8% 26.3% 25.3%
29.5% 26.3% 29.9%
30.9% 47.4%
29.4%
13.8% 15.5%
0%
10%
20%
30%
40%
50%
60%
70%
80%
90%
100%
Total respondent First timeexhibitor
Repeatedexhibitor
9-10
7-8
5-6
0-4
Exhibitor Category NPS
Total respondent -41.5%
First time exhibitor -52.6%
Repeated exhibitor -39.7% 9

10
5. How did you learn about this exhibition?
2015 Number of Respondents: 199 Number of Respondents: 161 2014
17.6%
13.1%
22.1%
15.6%
33.7%
6.0%
11.6%
20.50%
16.10%
25.50%
16.80%
30.40%
9.30%
0% 5% 10% 15% 20% 25% 30% 35% 40%
Advertisement
Organiser's printed mail
Organiser's email
Organiser's website
Word of mouth / Referral from industry friend
At other exhibitions
Others
2014
2015
• At other exhibition: March fair • Others: long time exhibitors and members of the EPCH

11
5.1 How did you learn about this exhibition?
2015 Number of Respondents: 11 Number of Respondents: 32 2014
90.9%
18.2%
78.10%
18.80%
6.20%
0% 10% 20% 30% 40% 50% 60% 70% 80% 90% 100%
Trade publications
Mass media
Outdoor advertising
2014
2015

12
6. My top 3 markets (countries) currently are:
2015 Number of Respondents: 203
129
39 37 33 30 28
24 17
10
0
20
40
60
80
100
120
140
USA Australia UK Germany Spain Japan Italy France Canada
• Responses from Belgium, Brazil, China, Finland, Korea, Malaysia, Mexico, Morocco, Netherlands, the Philippines, Poland, Portugal, South Africa, Sweden, Switzerland, Thailand, Hong Kong, Taiwan, UAE were less than 10 respondents that not shown in the above chart.
• Other invalid responses include “Global”, “Asia”, “Asia Pacific”, “Central America”, “South America”, “Middle East”, “Europe”

13
7. My target markets (countries) are:
2015 Number of Respondents: 194
91
18 16 14 12 12 10 10
0
10
20
30
40
50
60
70
80
90
100
USA Germany France Australia Italy Russia UK Japan
• Responses from Belgium, Brazil, Canada, China, India, Mexico, South Africa, Spain, Switzerland, and Turkey were less than 10 respondents that no shown in the above chart.
• Other invalid responses include “Global”, “Europe”, “East Asia”, “South America”, “Middle East”

14
8. To what extent have your objectives for exhibiting in this exhibition been achieved?
2015 Number of Respondents: 215
5.1%
58.9%
16.7%
20.0%
33.0%
22.8%
20.6%
19.5%
13.6%
19.5%
12.1%
15.3%
14.4%
11.2%
33.0%
13.6%
25.6%
21.4%
15.8%
18.6%
15.4%
24.7%
8.4%
24.7%
28.4%
21.4%
27.0%
29.4%
8.4%
2.3%
7.9%
10.7%
9.3%
13.0%
16.4%
9.3%
3.3%
5.6%
7.4%
5.1%
4.2%
7.0%
0% 10% 20% 30% 40% 50% 60% 70% 80% 90% 100%
Find new buyers
Find franchisers partners / agents
Explore new markets
Launch new products
Brand-building
Collect market information
Consolidate contacts with buyers/ business partners
0 (N/A) 1 (Did not achieve at all) 2 3 4 5 (Fully achieve)

15
2015 Number of Respondents: 215
Combining responses of “Rating 5” and “Rating 4” *
8.1 To what extent have your objectives for exhibiting in this exhibition been achieved?
17.7%
5.6%
13.5%
18.1%
14.4%
17.2%
23.4%
0% 5% 10% 15% 20% 25% 30%
Find new buyers
Find franchisers partners / agents
Explore new markets
Launch new products
Brand-building
Collect market information
Consolidate contacts with buyers/ business partners

16
Number of Respondents: 183 2014
2014 To what extent have your objectives for exhibiting in this exhibition been achieved?
26.50%
34.40%
3.50%
4.30%
14.90%
6.40%
5.40%
25.20%
24.70%
14.50%
9.30%
13.00%
10.80%
8.10%
25.80%
24.70%
39.90%
29.80%
27.90%
25.50%
26.20%
18.70%
15.00%
37.60%
48.40%
37.70%
52.90%
53.00%
3.90%
1.30%
4.60%
8.10%
6.50%
4.50%
7.40%
0% 10% 20% 30% 40% 50% 60% 70% 80% 90% 100%
Seek new buyers
Seek franchise partners/agents
Explore new markets
Launch new products
Brand Building
Collect market information
Consolidate contacts with buyers/business partners
Not applicable Did not achieve at all Not quite achieved Fairly well achieved Fully achieved

17
9. To what extent are you satisfied with the exhibition in the following aspects?
2015 Number of Respondents: 215
5.1%
6.0%
4.2%
10.2%
9.8%
7.5%
12.6%
30.7%
11.2%
17.3%
18.6%
12.6%
8.4%
7.9%
11.7%
9.8%
7.4%
7.0%
22.9%
23.3%
17.2%
7.9%
8.8%
7.9%
7.9%
4.2%
8.8%
35.5%
32.1%
35.8%
30.2%
30.2%
31.8%
32.6%
27.4%
32.6%
11.2%
13.5%
19.1%
29.3%
29.8%
27.6%
25.6%
18.6%
26.5%
7.9%
6.5%
11.2%
14.0%
13.5%
13.6%
11.6%
11.6%
14.0%
0% 10% 20% 30% 40% 50% 60% 70% 80% 90% 100%
Business opportunities
Visitor traffic
Visitor quality
Pre-show service of organiser
Onsite service of organiser
Facilities and services of the exhibition centre
Official stand contractor(s)
Official forwarding agent(s)
Move-in and move-out arrangement
0 (N/A) 1 (Not satisfied at all) 2 3 4 5 (Extremely satisfied)

18
2015 Number of Respondents: 215
Combining responses of “Rating 5” and “Rating 4” *
9.1 To what extent are you satisfied with the exhibition in the following aspects?
19.1%
20.0%
30.3%
43.3%
43.3%
41.2%
37.2%
30.2%
40.5%
0% 5% 10% 15% 20% 25% 30% 35% 40% 45% 50%
Business opportunities
Visitor traffic
Visitor quality
Pre-show service of organiser
Onsite service of organiser
Facilities and services of the exhibition centre
Official stand contractor(s)
Official forwarding agent(s)
Move-in and move-out arrangement

19
Number of Respondents: 177 2014
2014 To what extent are you satisfied with the exhibition in the following aspects?
4.10%
12.10%
3.50%
4.20%
4.80%
5.40%
5.60%
5.40%
3.20%
40.70%
44.50%
28.10%
14.90%
13.30%
19.80%
21.00%
12.20%
12.00%
48.80%
38.70%
60.80%
70.20%
71.10%
65.30%
64.80%
73.00%
74.70%
6.40%
4.60%
7.60%
10.70%
10.80%
9.60%
8.60%
9.50%
10.10%
0% 10% 20% 30% 40% 50% 60% 70% 80% 90% 100%
Business opportunities
Visitor traffic
Visitor quality
Pre-show service of organiser
Onsite service of organiser
Facilities and services of the exhibition centre
Official stand contractors
Official forwarding agent(s)
Move-in and move-out arrangement
Not satisfied at all Not quite satisfied Quite satisfied Extremely satisfied
20
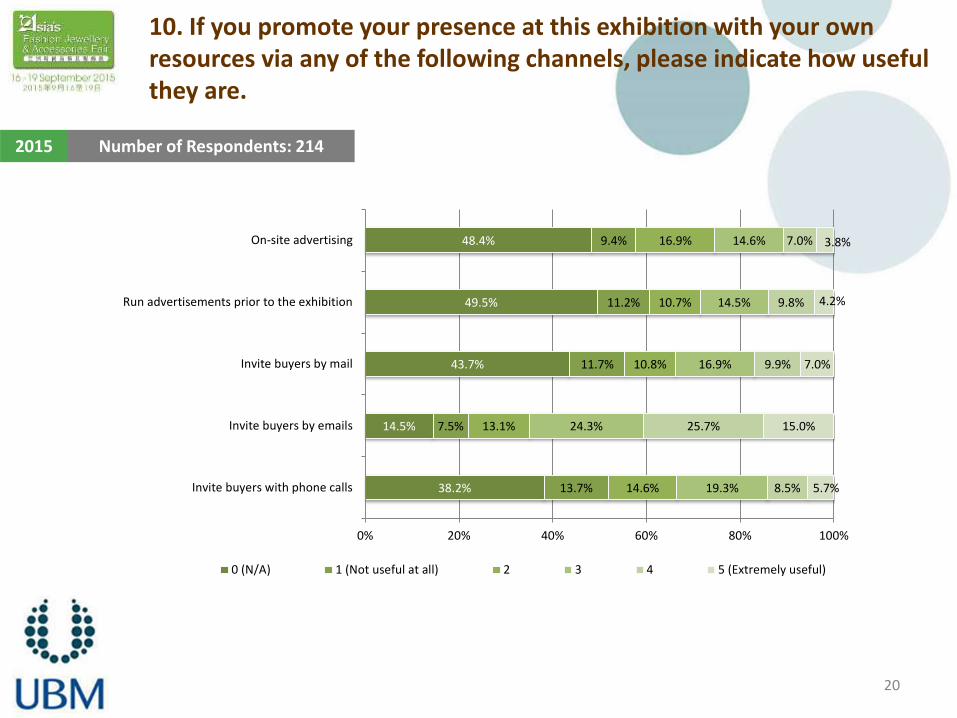
10. If you promote your presence at this exhibition with your own resources via any of the following channels, please indicate how useful they are.
2015 Number of Respondents: 214
38.2%
14.5%
43.7%
49.5%
48.4%
13.7%
7.5%
11.7%
11.2%
9.4%
14.6%
13.1%
10.8%
10.7%
16.9%
19.3%
24.3%
16.9%
14.5%
14.6%
8.5%
25.7%
9.9%
9.8%
7.0%
5.7%
15.0%
7.0%
4.2%
3.8%
0% 20% 40% 60% 80% 100%
Invite buyers with phone calls
Invite buyers by emails
Invite buyers by mail
Run advertisements prior to the exhibition
On-site advertising
0 (N/A) 1 (Not useful at all) 2 3 4 5 (Extremely useful)

21
11. Please select the exhibition(s) that you rate most important for your company.
2015 Number of Respondents: 200 Number of Respondents: 170 2014
7.0%
5.5%
11.5%
51.5%
2.0%
2.5%
67.5%
6.0%
2.4%
3.5%
52.4%
1.8%
1.2%
54.1%
12.4%
5.3%
0.0% 10.0% 20.0% 30.0% 40.0% 50.0% 60.0% 70.0% 80.0%
Macef, Italy (Jan)
Eclat de Mode/ Bijorhca, France (Jan)
Indian Handicrafts & Gifts Fair (Feb)
3FJ
Manila F.A.M.E., the Philippines (Mar)
EuroBijoux & Accessories, Spain (May)
9FJ
Indian Handicrafts & Gifts Fair (Sep)
Other exhibition 2014
2015
• Other exhibitions mentioned by respondents are: Global Sources, Canton fair

22
12. What are your plans for participating in this exhibition next year?
2015 Number of Respondents: 202 Number of Respondents: 169 2014
74.3%
82.2%
22.8%
14.8%
3.0%
3.0%
0% 10% 20% 30% 40% 50% 60% 70% 80% 90% 100%
2015
2014
Will participate
May participate
Will not participate
Preferences between booth sizes [Based on exhibitors who will participate the next edition]
22.2% 24.0%
69.4% 68.2%
8.3% 7.8%
0%
10%
20%
30%
40%
50%
60%
70%
80%
2015 2014
Larger booth size
Same booth size
Smaller booth size


