
FACULTY OF TECHNOLOGY
ASSESSING WATER RESOURCES SUSTAINABILITY IN MIDDLE EAST AND NORTH AFRICA
Anushree Das
ENVIRONMENTAL ENGINEERING DEGREE PROGRAMME
Master’s thesis
JUNE 2020

ABSTRACT
ASSESSING WATER RESOURCES SUSTAINABILITY IN MIDDLE EAST AND NORTH AFRICA
ANUSHREE DAS
University of Oulu, Environmental Engineering Degree Programme
Master’s thesis 2020, pp:62.
Supervisors: Ali Torabi Haghighi, Nizar Abou Zaki
The Middle East and North Africa (MENA) areas are the driest regions with the most water rare districts on the planet, with a territorial yearly normal of 1,200 cubic meters for every individual (world normal is near 7,000). And also, population and poverty are increasing at an alarming rate, increasing the demand for food, water assets are ending up progressively rare, desertification is a general natural issue, Desalination is an abuse of water assets in the Middle East. The shortages of water are compounded by the degradation of the quality of water. Over-abstraction of groundwater is always meet with high water stress. While farming and the countryside economy are imperative components in the MENA nations, the general commitment of farming to by and large GDP in most nations is low and has been declining. Raising water efficiency in light of the new evapotranspiration (ET) water the board worldview requests something other than changes in water system innovation. It requires coordinated consideration to improving specialized, agronomic, and the executives’ measures. Water User Associations (WUAs) incredibly encourage the usage of coordinated measures. Utilizing satellite remote detecting advances, organizers, and arrangement producers can make progressively powerful choices to guarantee a steady supply of water for sustenance and the earth.
Keywords: Renewable water resources, Agricultural Scenarios, Water demand and uses.

FOREWORD
This Master’s thesis has been carries out at University of Oulu, Finland in partial
fulfillment for the degree towards master’s degree Programme in Environmental
Engineering from University of Oulu, Finland. First of all, I would like to thank Ali
Torabi Haghighi for supervising this thesis and his excellent guidance to finalize this
work. I would also like to thank my second supervisor Nizar Abou Zaki for his useful
comments. Without their support, guidance, encouragement, and advices during
each step of this work, it was not possible for me to complete this work alone.
I would not be able to say ‘Thanks’ to my husband, parents and my beloved
brother. Their love, prayers, and kindness for me are beyond limitations. At the end
I would like to dedicate this intellectual effort to my father ‘Nitai Das’ and my husband
‘Palash Saha’.
Oulu, JUNE 2020
Anushree Das

TABLE OF CONTENTS
ABSTRACT
FOREWORDS
TABLE OF CONTENTS
LIST OF ABBREVIATIONS
1 INTRODUCTION .................................................................................................. 8
2 LITERATURE REVIEW ....................................................................................... 12
2.1 Water Resources .......................................................................................... 12
2.1.1 Renewable Freshwater .......................................................................... 13
2.1.2 Transboundary waters ............................................................................ 15
2.1.3 Dams ...................................................................................................... 15
2.1.4 Non-conventional water sources ............................................................ 16
2.1.5 Groundwater resources .......................................................................... 16
2.2 Withdrawal of water ...................................................................................... 19
2.3 Scarcity of water ........................................................................................... 22
2.4 Agricultural overview in MENA countries ...................................................... 23
2.4.1 Major systems of farming ....................................................................... 23
2.4.1.1 The system of irrigated farming ........................................................ 23
2.4.1.2 Rainfed and Highland mixed farming system ................................... 25
2.4.1.3 The farming system of dryland mixed and sparse (arid) and urban based ........................................................................................................... 25
2.4.2 Water management and Irrigation .......................................................... 26
3 STUDY AREA ..................................................................................................... 27
3.1 Geography and climate ................................................................................ 27
3.2 Economy and population .............................................................................. 28
3.3 Water resources status ................................................................................. 30
3.4 Water quality ................................................................................................. 32
4 METHODOLOGY ............................................................................................... 34
4.1 Country Classification Framework ................................................................ 34
4.2 Calculation of Crop water demand ............................................................... 35
4.3 Agriculture Development Scenarios .............................................................. 37
5 RESULT .............................................................................................................. 41
5.1 Country Classification ................................................................................... 41

5.2 Crop water demand along the study area ..................................................... 45
5.3 Agricultural water scenarios .......................................................................... 46
6 DISCUSSION ..................................................................................................... 50
6.1 Rapid population growth, Poverty, and consumption of water ...................... 50
6.2 Water and Unsustainability ........................................................................... 51
6.3 Agriculture and Water situation ..................................................................... 52
7 CONCLUSION .................................................................................................... 55
8 REFERENCES ................................................................................................... 57

LIST OF ABBREVIATION
ACU Agricultural Cooperative Authority
AIC Agricultural Information Center
AL Algeria
ADD Agricultural Development Department
AREA Agriculture Research and Extension Authority
BH Bahrain
CWD Current Agricultural Water Withdrawal
DAWR Department of Agriculture and Water Resources
DOE Department of the Environment
EG Egypt
EPA Environmental Public Authority
FAO Food and Agricultural Organization
GDI General Directorate of Irrigation
GDP Gross Domestic Product
GWA General Water Authority
GRWA General Rural Water Authority
IWA Irrigation Water Demand
IR Iran
IQ Iraq
IL Israel
JO Jordan
KW Kuwait
LB Lebanon
LY Libya
MA Morocco
MCM Million Cubic Meters
MENA Middle East and North Africa
MEW Ministry of Electricity and Water
MLA Ministry of Local Administration
MMAA Ministry of Municipal Affairs and Agriculture
MOA Ministry of Agriculture
MOH Ministry of Health
MOMRA Ministry of Municipal and Rural Affairs
MOAW Ministry of Agriculture and Water
MOP Ministry of Planning
MOWE Ministry of Water and Electricity
MPW Ministry of Public Works
MWE Ministry of Water and Environment
MWI Ministry of Water and Irrigation
NIA National Irrigation Authority
NWRA National Water Resources Authority
NWD New Water Demand
OM Oman
QA Qatar
RDA Regional Development Authorities
RSW Renewable Surface Water
SA Saudi Arabia
SWCC Saline Water Conversion Cooperation
TN Tunisia
TR Turkey
UAE United Arab Emirates
WB World Bank
WMCC Water Management Coordination Committee
WWTP Wastewater Treatment Plants

8
1 INTRODUCTION
The Middle East and North Africa (MENA) is actually a regional group of countries
characterized by primarily its culture and history, and covered Africa, Asia and
Europe Territories. Most of the countries of MENA region experiencing very rapid
population expansion and the over the past half century the region’s population has
already quadrupled. For extreme aridity, the population in many regions is allocated
very unevenly along with countries and also within them. The relative water
availability determines the population density and distribution. However, the MENA
countries vary significantly in economic, resources, geographical size, standard of
living and population. In the MENA region rural economy and agriculture is a major
activity in relation with the people’s number it employs, and it provides a large part
of GDP in many MENA countries (Khater 2009).
In MENA region most of the countries fall under semiarid and arid climatic conditions.
Decades ago, the region mostly ran out of resources of renewable freshwater in
feeling that it been incapable to meet up its requirement for food from the available
freshwater resources within its boundaries (Qadir et al. 2009). The MENA region
covers 6 percent of the total current world population, but the amount of world’s
freshwater resources is only about 1 percent (The conservation 2018). In the MENA
region the countries mostly depend on the seasonal rainfall, they have only some
rivers, and some of the rivers contain runoff from another countries, depend on
fragile, aquifers. The amount of annual renewable water resources in MENA
countries is somewhat equivalent to 1.42 percent of the whole world’s annual water
resources (The conservation 2018)). In several MENA countries the water
withdrawals have already exceed and in some other countries the water condition is
at limit or very soon will be. It I clear that the scarcity of water will stay dominant
nation in MENA region. The main causes of the water quality degradation are
pesticides and fertilizer contamination, industrial and municipal wastewater dumping
into waterbodies, deposits of solid waste along the banks of river, saline intrusions
in aquifer systems and these also affecting the resources productivity, the quality of
life and public health. In the MENA region water shortages compounded by pollution

9
and degradation of water quality (Baconi 2018). In MENA region groundwater can
be found in several aquifers system many major aquifers are shared among two or
more MENA countries because these countries have the same geologic history and
some of the hydrogeological units are vertically interconnected. With very little or no
surface water resources, most of the MENA countries depend substantially on
groundwater to meet up their water demands. At present, the groundwater
contribution in MENA region is about 42% and 55% water’s main source is
groundwater abstraction. In some region the groundwater abstraction level has
already exceeded the normal level of annual groundwater recharge (Baconi 2018).
The countries which are surplus with water supply are mainly based on the flows of
surface water (Syria, Iran, Egypt, Lebanon), but the countries that are based on
groundwater resources have considerably higher stress of water at present-day. The
MENA region’s growing and large population, though, in Egypt the aggregate supply
of water will become ever more constrained (an estimation in 2025, 591 m3
/capita/year) contrasted along with Iraq (2300 m3 /capita/year) (Sowers 2010).
Assuming there is no change in the availability of water, the growth of population in
MENA region for 2025 will rise the water stress, as the availability of water is
projected to decline per capita in range of 35 percent to 75 percent (Sowers 2010).
The high-water stresses and the water scarcity are met up with depletion of
groundwater and causing groundwater mining. Bahrain is challenging a severe water
crisis, and the most important limiting element in future freshwater supplies
availability is contamination by means of saline water, because of excessive
withdrawal of water from aquifer system. Increasing the amount of cultivated land
around and in Oases in Egypt caused a remarkable decline in groundwater table
also decline of spontaneously flowing wells. This type of project needs supply of
extra water by pumping for irrigation. Increasing costs of pumping are under-mining
the existing economic viability as well as the projected schemes of irrigation. In Libya
coastal aquifers over-exploitation caused seawater intrusion and water quality
deterioration along the coast (Tropp 2016). In Saudi Arab development of agriculture
resulted more than 35% depletion of non-renewable ground water resources
(Denicola et al. 2015). In Yemen, the abstraction from aquifers named Wadi go
beyond the renewable recharge. This type of overdraft creates aquifers extremely

10
unsustainable for future advancement. In Tunisia, seawater intrusion caused by the
exploitation of shallow coastal aquifers and pushed cultivators to deepen wells and
modify the equipment of pumping (Atlantic council 2019). In these ways, the
resources of groundwater in MENA region are seriously over-exploited. This type of
over-exploitation can cause further destruction of groundwater reserves through
leaking pollutants and saline intrusion (Tropp 2016).
In MENA region agriculture is the most dominant consumer of water. Among several
sectors of water-use in MENA region the growing competition for the water with
good-quality has decreased the allocation of freshwater to agriculture (Bahri 2008).
The water that carried away from agriculture redirected to some non-agricultural
utilizes. In MENA region the produces wastewater volume from these utilizes has
risen with urbanization, population, economic development, enhanced living
conditions and rising in foreseeable future. The productive use of increased
generated wastewater in agriculture has also increased because most of time
farmers do not have the reliable alternative water sources for irrigation (Keraita et al.
2008). Though irrigation along with treated wastewater in MENA countries requires
to be a frequent practice, greater amounts of inadequately or untreated treated
wastewater are now utilized in agriculture. These practice of using treated
wastewater also helping to increase the concerns for public health protection and
also the environment. In MENA region there are inter-related and complex many
issues which support the lack of progress and investment in the sector of agriculture.
Investments in MENA agricultural farms however need advancements in policies,
market access, strategies, institution, and infrastructure (Keraita et al. 2008).
The main objective of this study is to create an index intended for categorizing the
MENA countries based on availability of arable land resources and their renewable
resources. the water resources availability will be compared then with the demand
of water required to expand the area for cultivation. It is really very important to
mention that in this study there will be the only assessment of the availability of
renewable resources to sustainably cover up the grown demand of water for
agriculture, by setting apart other factors of agriculture that also limit the sector. The
main theories are this index will theoretically map the development of potential

11
agricultural by taking into consideration the supply of water as a main part to allow
the enlargement of agricultural cultivation in MENA region.

12
2 LITERATURE REVIEW
North Africa and the Middle East is a local embodying about 22 (Twenty-Two)
countries in the North America and Middle East. The Middle East and North America
(MENA) area sometimes is known as the Greater Middle East or as the Arab World.
In general, 19 (Nineteen) countries are included as the part of MENA countries.
Sometimes 16 (sixteen) countries are included as part of the MENA. But It is
important to say that there is no such a standardized list of the countries which are
included in the MENA area. Generally, it involves the region from the Morocco (the
Northwest Africa) to the Iran (Southeast Asia) and down to the Sudan (Africa).
Typically, the following countries are included in the MENA: Bahrain, Algeria, Iran,
Egypt, Iraq, Jordan, Israel, Lebanon, Kuwait, Libya, Oman, Morocco, Saudi Arabia,
Qatar, Tunisia, United Arab Emirates and Yemen. Sudan and Ethiopia are also
included sometimes (FAO 2018).
In total 6.56 million square km or about 5% of the global surfaced landmass are
included as the part of the Middle East region. From the entire 18 countries about 71
percent of this region is represented by the tree largest countries (Turkey, Iran and
Saudi Arabia). On the other hand, the smallest 7 (Palestinian, Bahrain, Qatar,
Lebanon, Israel, Kuwait and Armenia) represent only 1.5 percent (FAO 2018). The
complete region of the Africa is about 30 million square kilometers or about 22
percent of the globe’s surfaced landmass. In general, the total 5 largest countries (
Algeria, Congo, Sudan Libya and Chad) stand for 34 % of this region, on the other
hand, 5 smallest countries (all are islands: Comoros, Cape Verde, Sao Tome,
Mauritius, Seychelles and Principe) represent a little more than the 3% (FAO 2018).
2.1 Water Resources
‘Water’, entirely all forms of lifecycle really need it. For the development of
sustainable socioeconomic the freshwater reliable supply is a pre-requirement and
also for human prosperity and sociopolitical stability. The MENA areas are widely
known as the most water scare areas in the globe, with per capita the amount of

13
actual renewable resources is about 1,120 m3/year, and this amount is far
underneath than the water safety threshold of 1750 m3 (World Bank 2018).
Additionally, the MENA countries always uses more water resources what it obtains
every year and more water resources than the renewable water resources. The
freshwater resources in MENA countries are below huge pressure and also facing
significant dangers to the sustainability because of increased population,
overexploitation. 12 out of the globe’s 15 water scare countries are in this area and
the situation is getting worsen gradually, it is been projected that in future the water
availability will be dropped significantly in those countries (Michel et al. 2018).
2.1.1 Renewable Freshwater
The availability of the freshwater in these areas is significantly low compare to the
other countries, the problem happens where the water is available at the nationwide,
but it is highly flexible in space and time. According to the world bank (2007), the
areas are facing vulnerability mainly include Morocco, Tunisia, Lebanon. Mainly
hyper-aridity happens in where the renewable water resource are significantly low,
as listed Bahrain, Libya, Kuwait, Qatar, Oman, Saudi Arabia, Israel, Yemen, and
United Arab Emirates.
In MENA region the renewable average annual water resources is about 591,000
Mm3. It is equal to some 1.41 percentage of the whole world’s renewable annual
water resources. About 37 percent (222,000 Mm3) of this water is provided by the
region’s outsides river flows (Miller 2015). There are also some non-renewable
substantial groundwater resources, besides renewable groundwater and surface
water and in MENA region countries also have varying right to use unlimited
seawater and brackish water. The following Table 1 represents the MENA countries
renewable water resources:

14
Table 1: The Renewable water resources in MENA countries.
Country Renewable water resources Availability of water resources
annually ((km3) (m3/year per capita)
1950 2018 2025
Saudi Arab 2.90 813 123 76
Turkey 147.52 6987 2256 1936
Iran 73.55 4432 1198 787
Israel 3.23 2434 510 345
UAE 0.37 2973 87 69
Iraq 121 - 4980 2983
Oman 1.1 2258 453 198
Qatar 0.2 1031 21.98 12
Kuwait 0.19 1287 85 62
Lebanon 3.60 2365 989 765
Jordan 0.87 578 140 61
Bahrain 0.21 - 178 144
Algeria 14.91 1698 455 343
Libya 0.84 763 153 96
Yemen 5.30 982 238 198
Tunisia 4.20 1207 435 386
Egypt 69.34 3276 1100 756
Morocco 30.75 3423 1138 791
Source: UNESCO (2020), ESCWA, World Bank (2020), World Resources Institute
(2019).
In 2018, more than 60 percent of countries in MENA region tries had supply per
capita a smaller amount than 1000 m3/year. For MENA countries, it is projected that
in 2025, the supply in per capita will be 683 m3/year which is equal to only 12 percent
of the whole world (World Bank 2020). And the main reason behind this is the high
15
population growth. Many countries like Jordan, Yemen, Israel, and Algeria tries to
mine the groundwater resources. And obviously, it is not possible to use the non-
renewable water resources indefinitely. But mining is often risky due to connections
with the flows of river may disturb the surface supplies and may decline the water
tables and for this saline intrusion may cause from sea or brackish water (Kather
2009).
2.1.2 Transboundary waters
In the Middle East the major transboundary rivers are the Kura-Araks which flows to
the Caspian Sea, the Euphrates-Tigris which flows to the Persian Gulf, The Asi-
Orontes which flows to the Mediterranean Sea, and the Jordan that flows to the Dead
Sea. In the Middle East region these transboundary river basins cover up 17% of the
total area (AQUASTAT 2008). There is also one type of basin named endorheic basin
which is that type of basin that doesn’t have any outflow to sea, produced by together
dominant geological structural conditions and the aridity of climate. It is one of the
most important hydrography characteristics of Middle East region. This types of
basin either structural, which is entirely closed basins encircled by constant
watershed line (exist in Turkey and Iran) or functional, where the basins are open or
exoreic but local outflow certainly not goes to the Sea (located in United Arab
Emirates and Saudi Arabia). In Africa the major transboundary river basin is: Lake
Chad, Congo, Nile, Orange, Zambezi, Niger, Limpopo, Senegal, and Volta. These
river basins cover half of entire area of continent but in North Africa Nile is the only
one river basin. The water is shared among several countries and operated by the
basin organization which group together some or all of states contained one basin
(AQUASTAT 2008).
2.1.3 Dams
The total capacity of dam in Africa is about 799 km3, of which 728 km3 connects 53
largest dams’ capacity which are built in 22 river basins. In the Southern region of
Africa more than half of total dams are situated and in North Africa the dam capacity

16
is only about 24%. In North Africa one big capacity dam named Aswan on Nile river
is constructed in Egypt and the capacity of that dam is 162 km3 (Kfouri 2019). In
Middle East the total dam capacity is 871 km3. Iraq, Turkey, and Syria include more
than 93% of total capacity of dam and most of this on the basin of Euphrates-Tigris.
There are 12 dams which have capacity more than 5 km3 in Middle East and most
of these dams are on the basin of Euphrates-Tigris except The Atinkaya and Hirfanli
is constructed on the basin of Black Sea in Turkey (Kfouri 2019).
2.1.4 Non-conventional water sources
In dry countries mainly reuse of water desalination and treated wastewater take
place seeking to expand their much-limited resources. Libya, Egypt, Morocco,
Tunisia, Algeria are the main countries performing desalination process in reducing
production order. In some countries they also lunched irrigation projects specially in
peri-urban and urban agriculture which use treated wastewater. In Middle East the
amount of reused treated wastewater is 2672 million m3/year. Among the countries
Turkey used 39% of the treated wastewater, followed by Syria, Israel, and United
Arab Emirates with 22%, 11% and 9% (Qadir 2017). The total amount of reused
desalinated water is 3326 million m3/year in the Middle East. United Arab Emirates,
Saudi Arabia and Kuwait are the largest consumers of desalinated water and around
78% of the total Middle East region. 1043 million m3 water is used annually by Saudi
Arabia, United Arab Emirates uses 961 million m3 and Kuwait uses 432 million m3
(Qadir 2017).
2.1.5 Groundwater resources
In MENA region the groundwater system is located with several aquifers systems
together with storage capacity and yield characteristics which depend on areal extent
and hydrogeologic and hydrologic properties of each aquifers. Most of the time the
aquifers systems are of either calcareous facies and/or sandy. And also, alluvium
deposits and unconsolidated alongside volcanic deposits exist in MENA region. The
formation of water bearing is naturally recharged or non-renewable type or of fossil,

17
according to the hydrologic viewpoint. Naturally recharged most of the aquifers are
somewhat replenished because of the limited rates of precipitation prevailing in
MENA region (Lezzaik 2018).
The MENA region’s geological history dates back more than five hundred million
years BP (Pre-Cambrian). The rock of the basement is exposed in big surfaces in
MENA region, mainly in west and south of Algeria, Libya’s southern part, east of
Egypt and thus forming the African Shield. Along the Red Sea coast, it is also
revealed Arabian Shield’s forming. Three hundred million years ago during the
Paleozoic, on the basement rock very thick layers of sandstones and sand were
deposited and that one was suitable for storage of groundwater (MWRI 2015). Extra
layers of Nubian sandstone and sand covered a huge surface from Libya and Egypt’s
Western Desert to North Sudan during the period of Mesozoic. Again, some low
permeable limestone’s thick layers deposited around 120 million years BP ago in the
Arabian Peninsula. In the Quaternary (Recent and Pleistocene) and Tertiary,
contrasting series of sand and calcareous rocks deposited in several areas creating
Al-Hamada in Morocco and Algeria, altogether with limestone in Iraq and Egypt. The
Atlas region actually belongs to Mediterranean region and described by formation
wherever other rocks and clays, such as dolomites and calcareous rocks belonging
to lower Jurassic, is dominant. These types of formations can find in high plateaus
in Algeria and Morocco and in Upper Atlas in Tunisia (MWRI 2015).
The similar rock unit often form producing aquifers in MENA region’s two or more
states because of that geologic history similarity. This is the main reason that the
following aquifers are shared in two or more MENA region’s countries (MEDD 2018):
• The Paleogene aquifer in Arabian Peninsula
• The Nubian Sandstone in North African countries and Egypt
• The Basalt aquifer in Jordan and Syria
• The Grand Erjs in Morocco, Tunisia and Algeria
Many hydrogeological units are vertically also interconnected in MENA region.
The majority people of the MENA regions depend on significantly on the amount of
groundwater to meet up the growing demands of water with no or little surface water

18
resources. The following table (Table 2) represents an estimation of annual average
groundwater withdrawal and recharge. The dependency of regions on groundwater
is stated as of ratio of withdrawal of groundwater in relation with recharge of annual
groundwater along with ratio of withdrawals of groundwater to total water demand in
2018.

19
Table 2: The Groundwater Resources in MENA countries.
Country Average annual recharge Withdrawal of annual groundwater
of groundwater (km3) Total amount Recharge Demand 2018
(km3) (%) (%)
Saudi Arab 3.90 15.10 395 86.88
Turkey 21.00 8.10 39 22.12
Iran 43.00 30.00 71 42.32
Israel 0.55 1.35 251 73.32
UAE 0.15 0.89 689 78.92
Iraq 15.00 0.32 2.5 0.82
Oman 1.21 1.76 176 90.32
Qatar 0.056 0.71 222 75
Kuwait 0.22 0.40 191 69.91
Lebanon 0.76 0.33 45 18.00
Jordan 0.44 0.67 171 52.57
Bahrain 0.11 0.29 267 92.42
Algeria 1.81 2.99 178 65.11
Libya 0.79 3.74 587 97.22
Yemen 1.55 1.43 98 64.40
Tunisia 4.32 1.69 39.50 60.76
Egypt 5.32 4.56 92 7.13
Morocco 9.19 2.88 34 25.22
Source: UNESCO (2020), ESCWA (2020), World Resource Institute (2019).
2.2 Withdrawal of water
The following table (Table 3) represents the annual water withdrawals by sector-wise
in MENA region’s countries. Even Though the use of domestic water per capita in
developed countries can go beyond 155 m3/year, to maintain the health of human a

20
reasonable supply may be per capita 45-85 m3/year. It is estimated that, by 2025,
there are five MENA countries which will hardly cover the basic needs of human if
the renewable resources are completely mobilized (Mualla 2018). Elsewhere, the
supply of renewable resources would even exceed the basic requirements of human
by varying the amounts.
Table 3: The water withdrawal by sector in MENA region.
Country The amount of total Annual water withdrawal
water (km3) Industry Domestic Agriculture
Saudi Arab 18.00 1.0 9.0 90.0
Turkey 36.60 11.0 16.0 73.0
Iran 71.02 2.0 7.0 91.0
Israel 1.73 9.0 31.0 60.0
UAE 2.13 10.0 27.0 63.0
Iraq 43.81 6.0 3.5 90.5
Oman 1.33 4.0 6.0 90.0
Qatar 21.98 4.14 1.48 94.38
Kuwait 0.55 2.0 38 60.0
Lebanon 1.32 5.5 29.5 65.0
Jordan 0.99 4.1 23.4 72.5
Bahrain 0.33 4.5 33 62.5
Algeria 4.79 17.3 26.6 56.1
Libya 3.88 5.1 9.9 85.0
Yemen 2.97 1.0 7.7 91.3
Tunisia 2.77 4.4 16.4 79.2
Egypt 64.67 8.8 7.6 83.6
Morocco 12.36 3.3 6.1 90.6
Source: World Bank, World Development Indicators Database and ESCWA (2019), World Resources Institute (2019).

21
However, in the MENA region not all the supplies of renewable water based on their
variability and location can be mobilized at satisfactory cost. Actually, the amount of
economically accessible water is very much lower than the mentioned estimates.
The largest user by irrigation, perhaps more than 85% of total usage region wide
(Tolba 2017). Although, the water is mainly utilized for irrigation, the demand is
expanding for water in urban areas rapidly. Most of the MENA regions are highly
urbanized and the demand of industrial and domestic share is so much higher than
the other parts of most of the developing world.
In MENA region most of the countries can be classifies as middle income and urban
population percentage that has safe and sound drinking water access is almost close
to 100%. In contrast, only 66% of the rural areas people have the safe access of
drinking water. Despite attempts to slow the growth rates of population in the MENA
region, projected upcoming growth rates is still very high by the standards of world.
In urban areas it is projected that the proportion is about to increase 60% to 70%
and for this in urban areas renewable water supplies share need to increase from
10% to more than 20% by maintain the overall present use rates (MRMEWR 2016).
The expanded efficiency in reallocation and irrigation could provide enough
renewable water to meet up the demands in most of the countries of MENA region.
But it is really difficult to reallocate from irrigation because of the involved costs, but
most of the MENA countries continue financing the new supplies even as preserving
allocations to comparatively very low-return agriculture (MRMEWR 2016).
In several MENA countries water withdrawals have already been surpass renewable
supplies: Yemen and Libya. Other countries seem to be essentially at the maximum
or almost immediately will be: Israel, Egypt and Jordan. Some countries deal with
severe regional shortages even if they are overall in surplus. And it is really
expensive the use of local mobilizing surpluses because the costs of transfer and
due to physical and social strains, the full mobilization is always impracticable (Qadir
2017).

22
2.3 Scarcity of water
In semi-arid and arid countries of MENA region the water scarcity is a most important
constraint. All available resources on water, in many MENA countries, that can be
utilized for economic reasons, have now been established or in procedure of
development (Irin 2015). The overall potential analysis concentrating on water
withdrawals estimation as contrasted to total amount of available water resources
(commonly called the index of water stress) specifies that more than 75% of MENA
region’s countries are categorized under very high-water stress. And the more
crucial matter is that availability of current per-capita water has dropped lower than
the line of certain water shortage of 500 m3/year in more than 50% of the MENA
countries. Moreover, it is estimated that by the year of 2025, more than 80% of the
MENA countries will crossed the threshold of water poverty. It is clear that, the
scarcity of water will stay the most dominant state in the countries of MENA region
(Irin 2015).
23
2.4 Agricultural overview in MENA countries
2.4.1 Major systems of farming
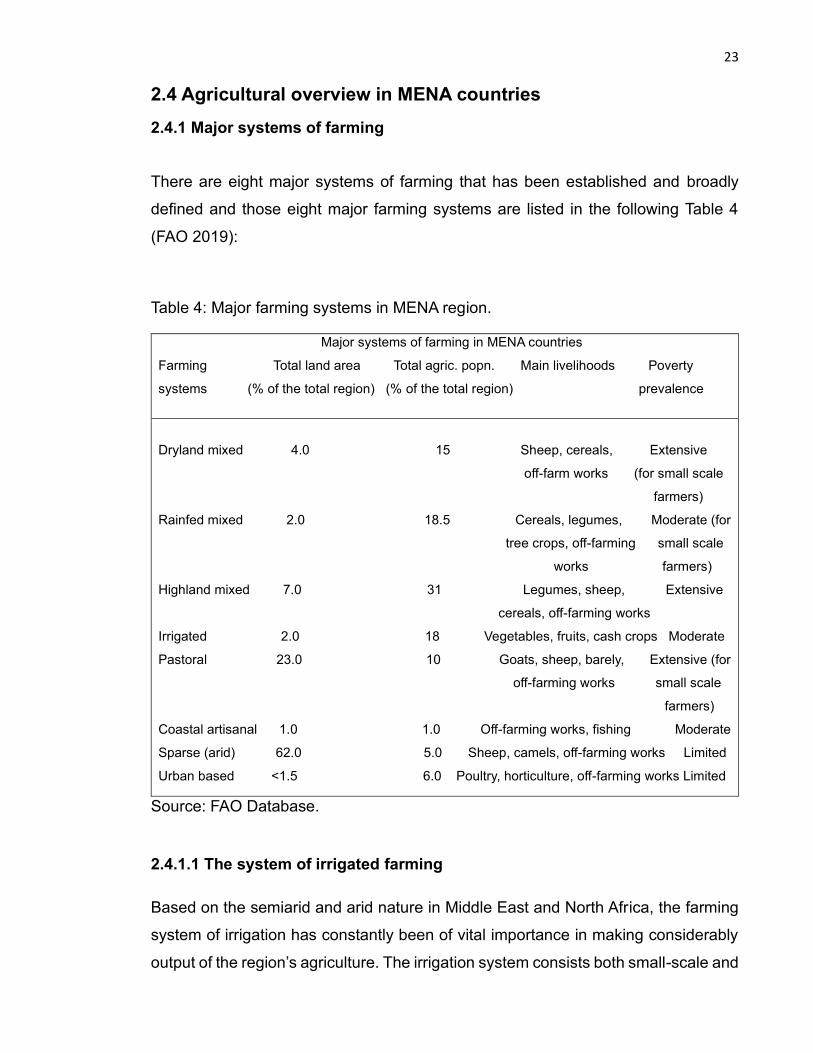
There are eight major systems of farming that has been established and broadly
defined and those eight major farming systems are listed in the following Table 4
(FAO 2019):
Table 4: Major farming systems in MENA region.
Major systems of farming in MENA countries
Farming Total land area Total agric. popn. Main livelihoods Poverty
systems (% of the total region) (% of the total region) prevalence
Dryland mixed 4.0 15 Sheep, cereals, Extensive
off-farm works (for small scale
farmers)
Rainfed mixed 2.0 18.5 Cereals, legumes, Moderate (for
tree crops, off-farming small scale
works farmers)
Highland mixed 7.0 31 Legumes, sheep, Extensive
cereals, off-farming works
Irrigated 2.0 18 Vegetables, fruits, cash crops Moderate
Pastoral 23.0 10 Goats, sheep, barely, Extensive (for
off-farming works small scale
farmers)
Coastal artisanal 1.0 1.0 Off-farming works, fishing Moderate
Sparse (arid) 62.0 5.0 Sheep, camels, off-farming works Limited
Urban based <1.5 6.0 Poultry, horticulture, off-farming works Limited
Source: FAO Database.
2.4.1.1 The system of irrigated farming
Based on the semiarid and arid nature in Middle East and North Africa, the farming
system of irrigation has constantly been of vital importance in making considerably
output of the region’s agriculture. The irrigation system consists both small-scale and

24
large-scale systems. The system of large-scale irrigation consists an agricultural
total population of approximately 16.0 million3 and about 8.3 million ha of irrigated
farming land: causing the densities of high population and actually very small sizes
farms. Poverty prevalence is moderate within both sub-systems (Elhadj 2018).
The large-scale irrigation (Sub-system) areas primarily linked to the water resources
of perennial surface, like Euphrates valleys and Nile, but traditional qanat and karez
systems intensification also preceded to the development of the irrigates areas of
large-scale system wherever the amount of water (sub-surface) is plentiful. Recently,
the accessibility of pumping technologies and deep drilling has allowed the
development of new-found areas drawing the subterranean aquifers. The schemes
of large-scale systems are found within all zones and involve export cropping and
high-value cash, fruit cropping and intensive vegetables (CEDARE 2016). The water
uses patterns vary significantly but, all over the region, centralized managing
systems and the inappropriate water pricing policies have caused that the water is
rarely used efficiently. Considerable environmental and economic externalities have
arisen from extreme utilization of aquifers of non-recharged while, the application of
excessive irrigation water has caused in increasing soil salinization, the groundwater
table problems (CEDARE 2016).
The small-scale sub-system irrigation also happens across the whole region widely
but not the same as important as system of larger schemes because of involved
people numbers, or in food amount and the other produced crops, and in remote and
arid mountain areas it is a major element for many people survival (Elhadj 2018).
Along the tiny perennial streams this type of sub-systems typically develops, or
where the spate irrigation and flood is feasible. Sometimes it additionally draws on
boreholes and shallow aquifers, even though these hardly penetrate to depths
perceived in the schemes of large-scale systems. Within the system of small-scale
irrigation vegetables, fodder and mixed cereals are the major grown crops. These
land areas also deliver vital focal spots for activity of socio-economic, but extreme
local communities’ competition for constrained water resources among other users
and rural farmers is developing progressively more evident (Elhadj 2018).

25
2.4.1.2 Rainfed and Highland mixed farming system
The farming system of rainfed mixed covers 18% of the total agricultural population
although occupies 2% of the total land area and this resulting extreme high
population densities. 14 million ha land is cultivated area, involving vines and tree
crops. Although the system is principally rainfed, an expanding area is profiting from
the accessibility of pumping and new drilling technologies, that made it feasible to
make use of supplemental winter irrigation (FAO 2018). The farming system of
highland mixed contains land area of 74 million ha but this is not the important
system in terms of number of population because in agriculture nearly 27 million
people engaged. The land area for cultivation is about 22 million ha. It comprises
two, sometimes sub-systems overlapped. The first one is led by rainfed legume and
cereal cropping, olives and fruits on terraces, with vines and the second one primarily
based on livestock raising on managed communally lands (ICARDA 2011).
2.4.1.3 The farming system of dryland mixed and sparse (arid) and urban based
The agricultural population of dryland mixed farming system is 13 million and the
total cultivated land area is 17 million ha. The sizes of farms are larger, and the
density of population is also lower than the main other arable systems. But here the
drought risk is so high and the considerable insecurity for foods exists (MOA 2016).
The farming system of sparse (arid) covers 60% of the total region and comprises
the vast zones of desert. The agricultural population is about 5% of the region’s
people and 1.2 million ha land is used as irrigated cropland to produce fodder,
vegetables, dates, and palms. A small population throughout the region nearly
people of 6 million are involved in livestock products and horticulture production –
notably poultry, vegetables, and fruits (MOA 2016).

26
2.4.2 Water management and Irrigation
Actually ‘’the area underneath the water management’’ refers to those area where
water except direct rainfall utilized for the agricultural production. And the word
‘’irrigation’’ represents to those areas which are equipped to provide the water to
crops. In MENA region the countries make distinction between the areas underneath
irrigation, sometimes that one is the summation of partial/full control irrigation zones,
equipped lowlands, spate irrigation, and the other forms of management of water,
that actually are non-equipped lowlands. And it is difficult the distinction between
water management and irrigation. In MENA countries, in calculating the available
water for irrigation, some of the countries consider only renewable water resources
(surface water and ground water) such as Syria and Lebanon, on the other hand
some of the arid countries depend on non-conventional or fossil water sources such
as Saudi Arab, Turkey, Jordan, Bahrain. In Iran, the biggest irrigation potential is
centered, depend only on the renewable water resources (FAO 2017). United Arab
Emirates and Syria assess that the irrigation potential is much lower than equipped
irrigation area at present. The reason behind this may be the ever-increasing water
demand for industrial and domestic purposes, depletion of groundwater and low
availability of water of non-conventional sources. In Middle East region the irrigation
potential is about 18.8 million ha and the area equipped intended for irrigation is
about 23.5 million ha. But more than 72% area is concentrated for irrigation in Iran,
in Iraq 16%, and in Turkey 21%. Partial/full control irrigation covers 23.3 million ha
in Middle East region (Berndtsson 2016). 15.5. million ha area are under water
management in Africa where more than 41% of the area that are under water
management is concentrated in Northern Africa. 55% of the irrigation area in
concentrated in Egypt (IDS 2019). In North Africa mainly Spate irrigation is used.
Algeria use both ground water and surface water with some other sources of water
and on the other hand Libya, Tunisia and Egypt began using treated wastewater.
Surface water is the main source for irrigation in MENA region (IDS 2019).

27
3 STUDY AREA
3.1 Geography and climate
Climate and geography not only the main determinants of the availability of water
and accessibility, also helps to exert the constraints on the agricultural productions.
The MENA regions endures and enjoys various climatic conditions. The following
Figure 1 represent the MENA region:
Figure 1: MENA region.
The economics always must manage the problematic combination of very high and
low annual precipitation. Rainfall occurs generally during winter and the dry period
of the summer lasts for 6-9 months (FAO 2018). The land of the MENA regions is
divided as arid, semi-arid and hyper-arid (MWRI 2015). Based on the climatic and
geographical conditions the MENA regions can be arranged into four areas. Table 5
describes the climatic and geographic characteristics and agricultural overview of
the sub-regions identified.

28
Table 5: The MENA Region’s geography, climate and agricultural overview.
Countries Climate The total Area of The total The total
Area (km2) cultivable cultivated cultivated
land area area
(Thousand ha) (Thousand ha) (% of the total
Cultivated area)
Arabian KW, BH, QA Hyper-arid 32000380 59879 2846 6% Peninsula SA, OM, YE, and Arid UA Near East JO, IL, IQ, Semi-arid 1644050 48605 38990 87% LB, TR, SY and Arid Iran IR Semi-arid 1834240 52023 19371 38% and Arid North Africa EG, AZ, Hyper-arid 5843980 66542 29139 45% MA, LY, TN (south), semi -arid (north), Arid
Source: WRI 2015 and FAO 2015; 2012.
3.2 Economy and population
The population of the MENA regions is nearly now 500 million, the population
increases annually an average 2.1 percent from 2004 to 2016 where the world
average rate is increasing 1.2 percent per year and this is the fastest rates in the
world. Egypt, Turkey and Iran are the most populated countries and cover more than
50 percent of the total population of the regions. 73 percent of the total population is
urbanized (World Bank 2016).
Income rate in MENA regions is rising, over the last 10 years it grows annually 2.6
percent and reaching average of $7,600 in 2016 per capita. In 2016, United Arab
Emirates stated that the highest income is $59,885 per capita whereas the lowest
income rate was in Yemen and the income rate was $1,135 per capita. The total
region’s GDP was about 5.2 percent of the economy of the world’s where the top
spot occupied by turkey and then Saudi Arabia and Iran (World Bank 2016). The
following Table 6 represents the population and economic overview in MENA
countries:

29
Table 6: Profile of economic and population growth in MENA region.
Country GDP in Average annual Projected Population Average annual Projected
2018 GDP change, annual-average in 2018 population growth, annual
(billions % (2004-2015) GDP growth, (millions) % (2004-2015) population
of $US) % (2015-2024) growth
% (2015-2024)
Saudi Arabia 648 6.3 4.6 26.8 2.1 1.1
Turkey 855 4.9 4.8 80.3 2.3 1.3
Iran 432 3.4 3.3 79.3 1.8 1.3
Israel 279 4.5 3.9 7.5 1.9 1.6
UAE 339 4.1 4.5 5.5 4.1 2.5
Iraq 186 11.2 6.7 31.8 2.9 2.3
Oman 72 5.4 4.5 3.2 2.6 2.3
Qatar 191.4 7.9 2.5 2.8 2.1 1.6
Kuwait 154 4.5 2.9 2.6 2.9 1.3
Lebanon 45 5.4 3.3 4.2 1.7 0.4
Jordan 33 5.6 4.6 6.5 2.9 1.7
Bahrain 41 5.3 3.3 1.7 4.9 1.6
Algeria 187 3.1 3.8 39.1 1.7 1.9
Libya 61 7.0 8.9 6.0 2.2 1.9
Yemen 31 1.9 3.2 24.9 2.9 2.2
Tunisia 45 4.0 4.5 10.8 1.6 0.9
Egypt 256 4.6 4.3 85.2 3.1 1.6
Morocco 112 4.4 4.2 31.9 1.8 0.8
Source: WWDP (World Water Development Report) 2017, World Bank (2020).
Poverty is not as acute in the MENA region as in many other regions of the world,
more than 40 million people survive per day on less than $2. The poverty associate’s
15 percent of the overall population according to this measurement and it is around

30
50 percent for Yemen (World Bank 2014). Unemployment in the MENA regions is
still a major problem with an increasing population and very limited economic
divergence (Akhtar et al. 2017). The unemployment rate is nearly 18 percent in
Tunisia and Yemen while the unemployment rate is less than 5 percent in UAE and
Kuwait (ILO 2013).
3.3 Water resources status
In the MENA region most of the countries facing very minimal water usage efficiency
combines with scarcity of water. The efficiency of water use is about 40% according
to FAO (2012). The countries like Bahrain, Libya, United Arab Emirates, Jordan and
Kuwait experiencing Extreme water scarcity situation according to World Water
Development Report (WWDR 2014). WWDR ranked 182 countries based on the
annual per capita availability of total renewable water resources and the more than
half MENA region’s countries categorized in the lowest possible 10%. The actual
cause behind this most of the renewable water resources are in use and many MENA
regions countries using their non-renewable water resources for their industrial,
agricultural and domestic purposes (FAO 2014). The following Table 7 represent the
water status in MENA countries:

31
Table 7: Present status of water in the MENA countries.
Region/Country The amount of Surface water: Ground water: Total renewable
the total internal internally produced internally produced water resources
renewable water (km3/yr) (km3/yr) per capita (m3/yr)
resources (km3/yr)
Saudi Arabia 2.90 2.35 1.98 119
Turkey 147.52 4.9 3.8 80.3
Iran 73.55 98.50 50.01 1966
Israel 3.23 0.29 0.60 281
UAE 0.37 0.18 0.10 59
Iraq 121 36.00 1.25 3299
Oman 1.1 0.95 0.82 391
Qatar 0.89 0.01 0.56 21.22
Kuwait 0.19 0.00 0.02 11
Lebanon 3.60 98.34 50.41 1330
Jordan 0.87 0.39 0.49 181
Bahrain 0.21 0.008 0.00 183
Algeria 14.91 14.00 1.81 481
Libya 0.84 0.31 0.49 115
Yemen 5.30 3.99 1.62 230
Tunisia 4.20 3.12 1.51 485
Egypt 69.34 0.62 1.29 862
Morocco 30.75 21.00 11.00 991
Source: WWDP (World Water Development Report) 2017, World Bank (2020).
The countries like Israel and Jordan according to FAO are over-exploiting the water
resources between 20% and 10%. Because of this the levels of water are dropping,
the resources of groundwater being mined, intrusion of saltwater and salinization are
appearing, and the supply of domestic water does not meet the quality standard. In

32
many countries of the region the real situations are even worse. The withdrawals of
fossil groundwater for irrigation has far exceed that the total renewable resources in
some of the MENA region’s countries like Bahrain, Yemen, Qatar Kuwait, and Libya.
The reduces river flows and the falling of groundwater tables will not impact only the
economic and social dynamics but will also reduce services and goods of
ecosystems and close the river systems. Because of the extreme scarcity of water,
in the region most of the countries will find that it is really challenging to cope with
the increased demand of water as well as from downstream and upstream countries.
3.4 Water quality
Between the water quality and quantity, a critical and direct link exists because of
the water scarcity. In MENA the water quality comprehensive data is not available,
the studies of World Bank revealed that water quality deteriorating becoming the
most serious issue in most of the MENA countries. Although the trustworthy
comparative information is not actually available, several examples of problems of
water quality are quoted. Dumping the industrial and municipal wastewater into lakes
and rivers, the deposits of solid water along riverbanks, from unsanitary landfills the
uncontrolled seepage, contamination because of excessive use of fertilizers are the
main cause of freshwater resources degradation and enforce health risks. The
following reasons are the principal sources of pollution (Sowers et al. 2015)
➢ Leaching from badly functioning and maintained cesspools, washing of waste
and fecal matter into water bodies, untreated municipal waste and wastewater
➢ Discharge of municipal sewer system directly into water systems, untreated
industrial waste and wastewater
➢ Runoff and seepage of non-biodegradable pesticides and fertilizers
➢ Runoff and seepage from unhygienic and dirty landfills where the most the
solid waste of the regions dumped
Contamination from these sources continuously declining the quality of water and
affecting the resources productivity, public health and most importantly the quality of

33
people’s life (MEDD 2009). Groundwater seldom actually regenerates after
contamination and although in some extent rivers are self-cleansing, declining
quality raises the costs of treatment to users of downstream and may prohibit reuse
of some purposes. In several countries one of the critical issues is intrusion of
seawater into coastal aquifers and secondary salinity and waterlogging are the
widespread challenges in most of the irrigated areas. Consequently, in the MENA
region water shortages are compounded by pollution and the degradation of quality
of water (MEDD 2018).

34
4 METHODOLOGY
4.1 Country Classification Framework
The renewable water resources consist of groundwater and surface. When the
agricultural water requirement is less than the rate of renewability then it is
considered sustainable water usage. For assessing the potential for future
agriculture, a variable known as the new agricultural water demand (NWD) is specified
(Abou Zaki et al. 2018). This variable comprises of the sum of irrigation water
demand (IWD) and current agricultural water withdrawal (CWD), as follows:
NWD = IWD + CWD (1)
Here, Irrigation water demand (IWD) indicates the amount of increased water
utilization volume which is needed to expand the farmed area, as well as both rain-
fed and irrigated areas and current agricultural water withdrawal (CWD) represents
the current water expenditure in every single country. For the comparison of new
water demand (NWD), groundwater resources (RGW) and the renewable surface water
(RSW) for every country, an index (Table 8) was utilized for the classification of the
chosen countries based on the available renewable resources and calculated
increase. The estimation of groundwater resources (RGW) and renewable surface
water (RSW) based on the available FAO data. The countries are classified into six
classes (I-VI) based on the cultivable area for development and accessible water
resources (Abou Zaki et al. 2018).

35
Table 8: Country Classification.
Source: Abou Zaki et al. 2018
To assess the accessibility of every source compared to the requirement, NWD was
compared to both RGW and RSW in the classification. The countries which are belong
to class I, it is possible to farm all cultivable area utilizing either two water resources
(RSW and RGW), because both sources are greater than NWD. Class VI represents the
worst condition where the both water sources (RSW and RGW) are lower than current
water demand (CWD). The water resources are in an unsustainable situation and
some reforms are required to stabilize the current demand for the countries belong
to the class VI. The rest of the classes (II, III, IV and V) indicates sustainable
conditions NWD is lower than RSW, RGW, or their sum (Abou Zaki et al. 2018).
4.2 Calculation of Crop water demand
The amount of water which is essential to meet the rate of evapotranspiration for
thrive of crops is known as water demand of crops. The amount of water which is
lost through the plant leaves as well as to atmosphere is known as the rate of
evapotranspiration. The water demand of crop always refers some optimal
condition under which crops grown and those are:

36
• Actively growing
• Shading completely the ground
• Diseases free
• A uniform crop
• Favorable conditions of soil
Under the given environment the crop thus reaches its full production. It is essential
to assess the water demand of the crops planned to be grown-up.
Here I am going the use CLIMWAT 2.0 (Figure 2) and CROPWAT 8.0 (Figure 3).
CLIMWAT 2.0 is a database of climatic parameter that is used in together with the
CROPWAT 8.0 program. CROPWAT 8.0 which is a decision support apparatus
established by the Water and Land Development Division of FAO. CROPWAT 8.0
for Windows is a PC program for the count of harvest water prerequisites and water
system necessities dependent on soil, atmosphere and yield information. Moreover,
the program permits the advancement of water system plans for various
administration conditions and the estimation of plan water supply for fluctuating yield
designs. CROPWAT 8.0 can likewise be utilized to assess planters' water system
prepares and to evaluate crop performance under both rainfed and inundated
conditions.
Figure 2: Using CLIMWAT 2.0

37
Figure 3: Using CROPWAT 8.0
For this analysis I have chosen three different types of crops as follows:
• Rice
• Sugarcane
• Sorghum
The reasons behind to choose these crops grown in significant quantities in the study
area and all the data which are needed for the calculation are available.
4.3 Agriculture Development Scenarios
For this analysis, the cultivated area was divided between irrigated and rain-fed area
in the selected countries. Depending on the climate Zones and the amount of
precipitation the percentage area of each one varies. We consider that it is possible
to increase the cultivable area by expanding the irrigated, rain-fed or combined
irrigated rain-fed area. Different production rates and water consumption are
required for various farming irrigation methods. This analysis assumed water
consumption variation, depending on the various irrigation schemes formed. For this

38
analysis, I have clustered two main categories of rain-fed and irrigated farming
schemes. I have considered the total cultivable land area (ATotal), as follows (Abou
Zaki et al. 2018):
ATotal = ARF + AIR + APC (2)
Here,
ARF = The current cultivated rain-fed area
AIR = The current cultivated irrigated area
APC = The potential cultivable area
It is possible to increase the potential cultivable land area by increasing the rain-fed
or irrigated area with several water intakes rates (Figure 4).
Figure 4: For evaluating the possibility for expanding cultivable area the three
scenarios used. In scenario 1, ARF = 0 and in scenario 3, AIR = 0
Source: Abou Zaki et al. 2018
For assessing the possibility of every country to cover the demand of agriculture
water three different scenarios of agricultural development are developed. The basis
of the scenarios is the demand of water of various irrigation schemes, water

39
consumption variation, and assume that the cultivable land area may be extended
by either irrigated, rain-fed or combination of both water supply system. ATotal in
subdivided into new irrigated (NAIR) and new rain-fed (NARF) in every scenario.
Depending on the irrigation methods that are applied to farm the cultivable land area,
NAIR and NARF varied between three different scenarios by the area (Abou Zaki et
al. 2018).
Scenario 1
In a country all the potential cultivable land Area APC is outfitted for irrigated
agriculture. In this scenario, the area of the current rain-fed farmed will stay
unchanged, as follows:
NAIR = APC (3)
ATotal = ARF + NAIR (4)
Scenario 2
The all cultivable area is partly rain fed (B ratio) and partly irrigated (A ratio). The (A)
and (B) ratios are calculated from the available database of FAO from the currently
rain-fed and irrigated ratios. I assume that in each country it is possible by the current
farming methods to expand comparably to cover up the area of total potential.
A = AIR
ARF+AIR (5)
B = ARF
ARF+AIR (6)
NAIR = (A) × APC (7)
NARF = (B) × APC (8)
ATotal = ARF + AIR + NAIR + NARF (9)

40
Scenario 3
By using only rain-fed agriculture the total potential cultivable land is farmed. The
irrigated area will then unchanged, as follows:
NARF = APC (10)
ATotal = AIR + NARF (11)
For each scenario the new water demand can be calculated, as follows:
IRGWD = CWDIR
AIR (12)
REWD = CWDRF
ARF (13)
NWD = CWD +(RFWD) × (NARF) + (IRGWD) × (NAIR) (14)
Here,
NWD = New water demand for irrigation (m3)
CWD = Current water demand (m3)
CWDIR = Current water demand for irrigation (m3)
RFWD = Annual mean water depth needed for one rain-fed hectare (m)
IRGWD = Mean annual depth of water needed for one irrigated hectare (m)
AIR = Current irrigated area
ARF = Current rain-fed area

41
5 RESULT
5.1 Country Classification
The countries are classified into VI groups. Among those the class VI countries are
thus in an unsustainable condition with regards to water resources, and reforms are
needed to balance the current demand and renewal ratio. The other classes (II, III,
IV, and V) represent sustainable conditions, with RSW, RGW, or their sum being
greater than NWD. Data has been collected from FAO website and classified the
countries according to the methodology. The following map (Figure 5) represents the
current condition of the MENA countries.
Figure 5: Country classification map of MENA countries.
From the above map it can summarize that many countries of MENA region are now
in unsustainable condition. There are only two countries in category I (The countries
which are most sustainable condition according to the classification) and those
countries are Turkey and Lebanon.
42
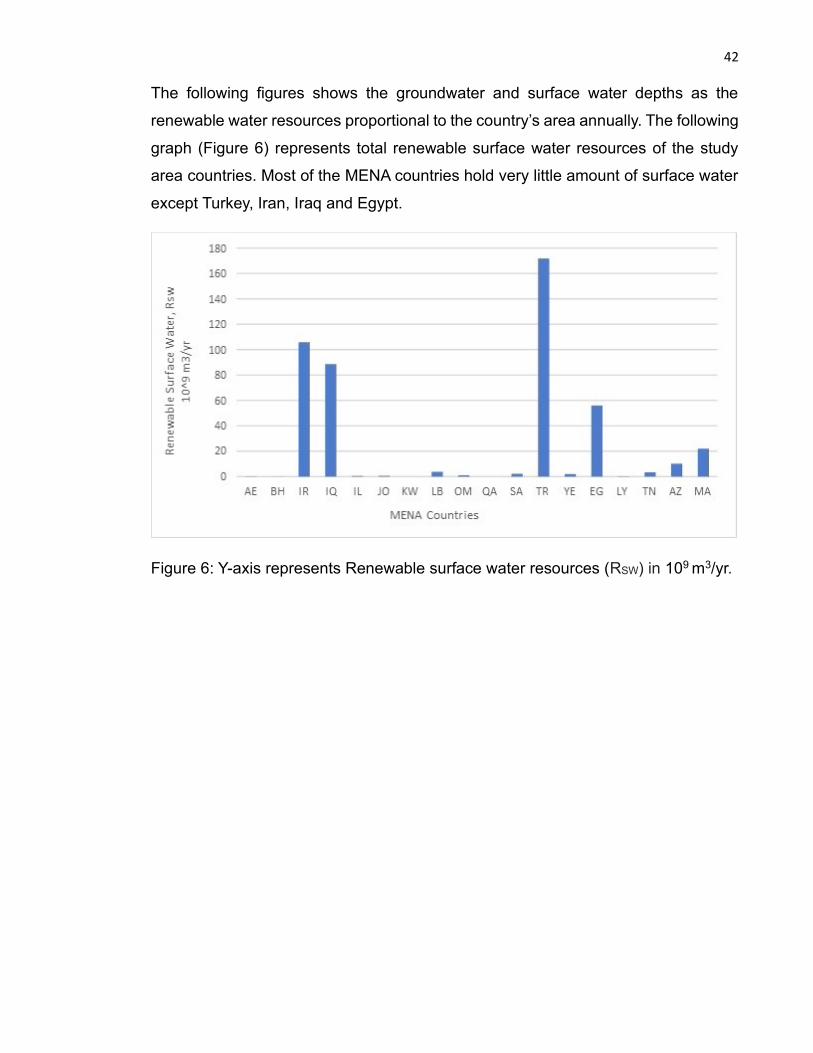
The following figures shows the groundwater and surface water depths as the
renewable water resources proportional to the country’s area annually. The following
graph (Figure 6) represents total renewable surface water resources of the study
area countries. Most of the MENA countries hold very little amount of surface water
except Turkey, Iran, Iraq and Egypt.
Figure 6: Y-axis represents Renewable surface water resources (RSW) in 109 m3/yr.

43
This graph (Figure 7) represents the total renewable groundwater resources of the
MENA countries. From this graph it can clearly conclude that most of the MENA
countries contain lower amount of groundwater resources except Turkey and Iran.
Figure 7: Y-axis represents Renewable groundwater resources (RGW) in 109 m3/yr.
The following graph (Figure 8) represents total irrigation water demand of the studied
countries and it is significant that the irrigation water demand is so high in Iran, Iraq,
Saudi Arab, Turkey, Egypt among to the other countries.
Figure 8: Y-axis represents Irrigation water demand (IWD) in 109 m3/yr.
44
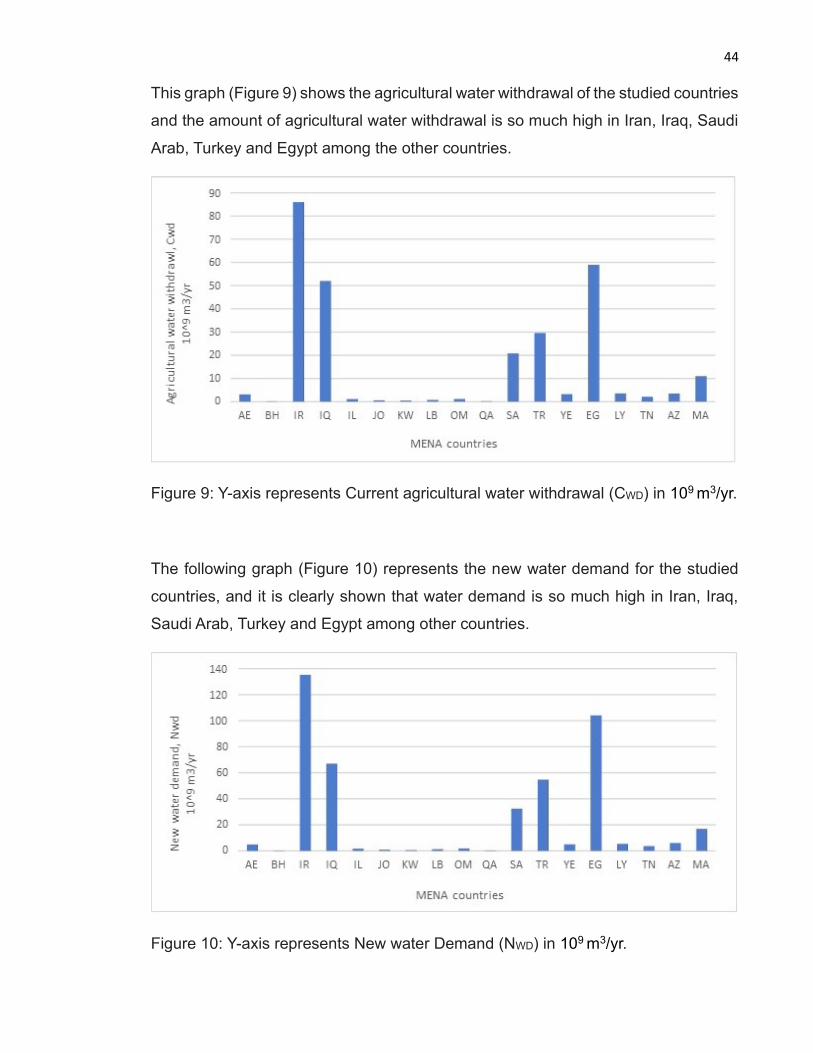
This graph (Figure 9) shows the agricultural water withdrawal of the studied countries
and the amount of agricultural water withdrawal is so much high in Iran, Iraq, Saudi
Arab, Turkey and Egypt among the other countries.
Figure 9: Y-axis represents Current agricultural water withdrawal (CWD) in 109 m3/yr.
The following graph (Figure 10) represents the new water demand for the studied
countries, and it is clearly shown that water demand is so much high in Iran, Iraq,
Saudi Arab, Turkey and Egypt among other countries.
Figure 10: Y-axis represents New water Demand (NWD) in 109 m3/yr.

45
5.2 Crop water demand along the study area
These are the calculated crop water demand (Table 9). I have chosen the following
crops because these crops grown in significant quantities in study area. Data has
been collected from FAO website.
Table 9: Crop water demand.
Countries Crops Name
Name Rice Sugarcane Sorghum ETc Eff. Rain Irr. Req ETc Eff. Rain Irr. Req ETc Eff. Rain Irr. Req mm/dc mm/dec mm/dec mm/dec mm/dec mm/dec mm/dec mm/dec mm/dec (season) (season) (season) (season) (season) (season) (season) (season) (season)
AE 1243.7 148.7 1371.3 2483.3 440.6 2036.7 734 140.8 582
BH 1125.7 142.6 1242.1 2219.5 446.8 1772.9 686.6 150.2 534.6
IR 1234.5 151.2 1352.8 2396.9 451.5 1911.6 761.1 155.4 609
IQ 977 150.5 1056.8 1905.7 438.2 1432.9 591.6 144.1 439.6
IL 881.3 142.4 961.1 1653 441.1 1179.9 520.8 149.8 368.7
JO 714.3 147.8 802.6 1355.6 430.1 887.3 408.8 157.9 256.8
KW 1617 146.7 1734.5 3110.1 428.5 2625.3 1064.1 152.5 912.1
LB 690.5 155.1 772.7 1387.1 437.4 923.3 418.3 144.4 266.3
OM 1128.3 153.2 1255.6 2156.6 443.3 1669.8 656 133.9 504
QA 1439.4 152.4 1563.3 2656.1 449.7 2168.4 904.5 1498 752.4
SA 745.2 143.1 827.2 1472.6 431.4 1000.6 409.2 154.8 257.1
TR 550.6 140.6 632.5 1061 440.9 603.1 346.5 151.5 194.5
YE 905 139.1 1028.7 2008.4 399.1 1529.7 489.2 137.7 337.2
EG 894.2 147.9 975.1 1742.4 450.7 1266.9 529 149.3 377 TN 474.3 148.3 1057.3 1930.3 412.2 1453.5 580 147.2 428
AZ 861.6 157.7 942 1671.7 398.3 1198.2 500.9 130.3 348.9
MA 851 143.6 931.4 1662.9 429.6 1189.1 500.8 139.1 348.7

46
According to the calculated crop water demand (Table 9) it is clear that the crop
water demand is really so high in relation with the other variables for all of the
different types of crops. Almost all of the MENA countries are actually so dry and
there is not enough rainfall to cover the water demand of crops.
5.3 Agricultural water scenarios
Most of the MENA countries lacked the water resources, of both ground water and
surface water for completely farming their total potential area of cultivable land by
using the system of irrigation. Only Lebanon doesn’t have the limitations on either
surface water or ground water in any of the three agricultural scenarios analyzed.
Except Lebanon none of the MENA countries have enough the groundwater or
surface water resources to expand the total potential area of cultivable land by
utilizing current situation. For each scenarios the calculated new water demand is
shown below:

47
Figures 11: New water demand for different agricultural scenarios. Here, T –
available total renewable water resources; S – renewable annual surface water; G –
renewable annual ground water; C – annual current water consumption (includes
industrial, domestic, irrigation); SC1 – water consumption in scenario 1; SC2- water
consumption in scenario 2; SC3 – water consumption in scenario 3. The water
volume represented with Y-axis in 109 m3.

48
According to Figures 11, In scenario 1, only Lebanon has available groundwater of
surface water to reach the new water demand and thus Lebanon belong to the Class
I. The water withdrawal for irrigation in most of the MENA countries annually varied
from 1 to 86 (10^9 m3/year), clearly showed in figure 9 and that’s why it’s might not
be possible to meet the new water demand for farming with the present renewable
water resources. Most of the MENA countries belong to the same situation. Many of
the MENA countries (e.g. Iran, Iraq, Lebanon, Turkey) can only cultivate some part
of their potential area and some countries (e.g. Oman, Tunisia) already overused
most of the water for irrigation. The countries (e.g. Yemen, Jordan, Kuwait, Qatar,
Bahrain, Israel, Egypt, Algeria, Saudi Arab, United Arab Emirates) have only little
amount of surface water and ground water and that’s why it’s not possible to increase
the farm area. These countries need the large-scale projects for irrigation supported
by the local government and supported by the legislation and largescale investment.
Some of the schemes recently been slowing down in MENA countries, as they
confronted with institutional and technological difficulties that have limited returns for
agricultural farmers. This type of large-scale projects for irrigation are highly suitable
along the major rivers (e.g. Nile) in the dryland. And the project development cost
may be will very high, government commitment for long-term projects and it may
bring great economic revenue. But this type of agricultural projects schemes will only
focus on crops which are profitable and have the market access. Plans must be set
for long-term projects which will provide maintenance, infrastructure, and will also
improve the agricultural farmer’s knowledge.
In scenario 2, farming the total cultivable area was believed by utilizing the similar
percentage on a much wider scale, referring to the ratio of total irrigated area of the
cultivated total area (Equation 9). In this scenario, none of the MENA countries could
depend on groundwater or either surface water except Lebanon. Here, expanding
the projects of low-cost irrigation can improved hectare yields. This type of projects
has continually been popular along the rivers in the MENA countries whereby using
the techniques of basic pump water is lifted and it then irrigates tiny farms especially
on the bank of the rivers. To increase the exploitation of the groundwater and surface
water resources the introduction of electric pumps and small diesel will be so much
helpful in increasing this small irrigation projects. These market-oriented goods and

49
low-cost products can boost up the economic revenue and the productivity on small
hold agricultural farmers. Small irrigation community-based projects with some
external assistance can develop the scheme of irrigation for many smaller local
farms. By taking the advantages of the river ban areas and the system of flood
recession can also boost farmed areas and the soil moisture usage. If the
partnership between the external agencies and the local farmers assist with
technological support and funding, then the small community-based irrigation
projects can act effectively.
In scenario 3, the situation is also same for all the MENA countries like scenario 1
and 2. It’s not possible by expanding the nationwide irrigation method to meet the
demand of water supply by utilizing only the available water resources. In MENA
countries agricultural farmers have limited skills, knowledge, financial resources and
they lack to adopt the technological changes and the development of farming
(Droogers et al. 2017). As direct rainfall is the principal thing for faming here, the
sensitivity of drought can be decreased, by runoff controlling and soil moisture
concentration around the roots of plants the productivity can be increased. There is
one technique called plant pits that used to enrich the moisture of soil (Abou Zaki et
al. 2018). Management of soil fertility, rotation of crops, increasing uptake of plant
water, and controlling of pest and some also other techniques used to boost the
agricultural productivity on rain-fed farming. To overcome the periods of drought the
techniques of water management and harvesting of water have helped the farmers
a lot, also expand the yields, and for supplementary irrigation provide water.

50
6 DISCUSSION
6.1 Rapid population growth, Poverty, and consumption of water
The population of the region during the period 2000-2030, is expected to nearly
double from the present population of 296 million. This will create a significant
negative impact in MENA areas with vulnerable soils or fragile soils and the sloping
lands and the most importantly water resources. The population of major centers of
the MENA areas are going to suffer from different forms of shortage of water and
environmental degradation (FAO 2018).
In 2018, The Report Poverty and Shared Prosperity; Piecing Together the Poverty
Puzzle, released by the World Bank in which it includes the regional and global
estimations of poverty, there are two main reasons for MENA stood out. Firstly, the
rate of extreme poverty is only increased in MENA region between 2010 and 2015.
The rate of extreme poverty increased to 5 percent in 2015 from 2.7 percent in 2010,
almost doubling the extreme poor numbers to nearly 18.8 million who are living on a
lesser amount than 1.90 dollar per day (World Bank 2018). Secondly, after several
years the regional estimates were first time reported for MENA regions of issues and
the availability of poor data. In Syria extreme poverty increased to more than 20
percent from almost zero and the rate of extreme poverty increased more than
doubles in Yemen which reach about 41 percent in 2015 (World Bank 2020). Most
of the MENA countries is now facing a serios economic problem and that is
unemployment. The low rates of economic growth related with the higher rate of
population growth, the average unemployment rate is 14% in MENA countries and
this is the higher rate than in many other developing countries. Among both adults
and youth, the unemployment rate is higher in MENA countries, comparing to other
developing countries. More than 60% youth are unemployed in Syria and Egypt. For
people aged 20-24, the unemployment rate is higher more than 3 times than the
people aged above 40 (World Bank 2007). Most of the MENA countries is highly
urbanized, with the population of 57% in the urban areas. Lebanon and Jordan with
the 80% urbanization rates ate the countries of most urbanized.
51
Because of the high population growth and the water scarcity for climate related
issues the MENA has become the greatest water scarce region where the population
nearly 60 percent don’t have any access or has little access to drinkable water (World
Economic Forum 2020). The gross domestic product about 70 percent of the regions
is subjected to very high or high - water stress, and that is extreme in compared to
the average of global rate which is only 22 percent (World Economic Forum 2020).
In MENA region the largest water scarcity per capita with an availability of average
water of smaller amount than 300 m3/capita/year. In the future this condition will turn
out to be more sever because of rising population and global warming. It is also
projected that by 2050, the 14 MENA countries among 21 countries will have fewer
amount renewable water resources than 200 m3/capita/year. In MENA countries the
amount of total current water demand now exceeds by nearly 20 percent than the
available natural water supplies (Mualla 2018).
According to result of this study it is also clear that the water demand is highly
increasing in most of the MENA countries (e.g. Iran, Iraq, Saudi Arab, Turkey and
Egypt) and that’s why they are facing the serious water scarcity problems.
6.2 Water and Unsustainability
In the world the Middle East and North Africa (MENA) is the most water-scarce
region, where 60% or more than that number of people doesn’t have any access or
has very little access to drinkable water resources. More than 70 percent Gross
domestic product (GDP) of the MENA region’s is exposed to very high or high water
stress, while the worldwide average is about 22 percent (World economic forum
2020). The Middle East and North Africa (MENA) is a well-known hotspot for
unsustainable uses of water and unsustainable consumption of water. The
overspending of water resources or the unsustainable uses of water in MENA region
is mostly driven by irrigated areas expansion, uses of water for irrigation and
reduction in the availability of surface water. From unsustainable water resources
about more than 30% water consumption is supplied for water consumption (World
Bank 2018). It is too difficult to conserve the available renewable water resources
and reverse the existing trends of using water resources because the demand of
52
water is highly increasing. Before 1997, the irrigated area and the consumption of
water resources were equivalent to the available renewable water resources in
MENA region, but after that year the water uses exceeded than the amount of
available renewable water. After the year 1997, for irrigation the source of water for
new cultivated area was mainly the groundwater and thus the available groundwater
were depleted. This causes significant cultivated area reduction after 2006, because
of water resources unavailability in MENA region. That dry period changed cultivated
area from rainfed to irrigated and that result a tipping fact where the water demand
surpassed the potential for available renewable resources and also the sustainable
level of renewable water resources. The continuous decrease in river flow and
significant groundwater level depletion confirms that this unsustainability is actually
in use of renewable water resources in MENA region. In MENA region the practice
of intensive agricultural cultivation has resulted the degradation of water levels in
major lakes (e.g. Urima, Hamoun) in Iran. (Torabi Haghighi et al. 2020). The
depletion of groundwater level because of overexploitation also limits the interaction
between groundwater and surface water and in this way reducing the recharge of
wetlands. With a continuous depletion rate about annually 0.6 meters, the level of
groundwater table decreased about 50 meters in many aquifers in MENA regions
(Abou Zaki et al. 2020). In Middle East and North Africa, the surface water is already
overexploited and, in some countries, (e.g. Egypt, Iraq) with over abstraction of
surface water compromising 20%-50% of the requirement of environmental flow. The
withdrawals of excessive surface water have reduced the flows in Jordan river basin
and also degraded ecological status of rivers. Some MENA countries (e.g. Iraq,
Turkey) has transformed the regime of river’s flow by exploitation and uncoordinated
and rapid development and also causes 45%-50% decrease in river’s flow that
reaches to the downstream river in Iraq (World Bank 2018).
6.3 Agriculture and Water situation
This study tries to represent an effort to assess the availability of future and current
cultivable area in some selected MENA countries, with regards to future and current
capacity of groundwater and surface water in every country. The MENA countries

53
contains 1.4% of the global water resources and the availability of freshwater in 50%
per capita is below 500 m3/yr. The main source of water is ground water in 54% of
countries of MENA. The analysis showed that, some of the MENA countries already
using more than 100% of their natural resources (e.g. Oman), Egypt is consuming
92%, Tunisia is using 85%, and also the current demand of agricultural water is also
so much high than groundwater and surface water resources available. The MENA
counties contains vary little amount of both water resources. Depending on the cost
of exploitation and resources availability, irrigation source percentage varies within
the MENA countries. To meet the calculated new water demand, searching for new
water resources needed.
The current consumption of water is more than 85% in some MENA countries (e.g.
Tunisia, Libya, Yemen, Egypt) and in Oman the water consumption ratio is more than
100% and this is so high consumption rates compared to the available quantity of
water resources. It is important to maintain the renewable water resources
sustainability when expanding the farming areas in each MENA countries. It will help
to prevent the negative effects on both society and ecology. Our method showed
satisfactory evaluation at national level but there may be some issues at local level
to be challenged. In all the scenarios, where based on the existing scheme of water
supply the current area of potential cultivable land was expanded, the new calculated
water requirement was so high to maintain the conditions the natural rechange on a
national scale. Only Lebanon has the available groundwater and surface water to
meet the demand in different sectors.
The management of agricultural water are in priority already in MENA countries, and
through large plot commercialization the expansion of agricultural land areas takes
place, and by also subsistence farming. To improve the cropped rain-fed areas the
main issue is to manage the soil moisture where motorized pumps and manual
spread helps to soil moisture maintaining and to promote low-cost irrigation (Abou
Zaki et al. 2018). To increase the irrigation projects of small community-based,
schemes of communal pump and the flood recession also helps on a small scale.
Big infrastructure projects, like construction of weirs or dams, surface channels and
piped irrigation could meet demand of future for irrigation plans on larger scale in
some of the MENA countries (e.g. Turkey, Iran, Iraq, Lebanon, Egypt).
54
The management planning for current irrigated water resources and the current data
collection could not cover up all the water use aspects in MENA regions. There is
still lacking in the collection of data, especially about the situation of current aquifers
and the recharge rates of ground water. In some cases, the FAO data contains model
estimates and values. The providing data can varies within countries and are the
national averages, especially within various climate zones countries. However, the
calculations and the data can be used to get the general conclusion about the
availability of water and land in the selected MENA countries.
55
7 CONCLUSION
The Middle east and North Africa are suffering several environmental risks lately.
Renewable water resources are actually becoming progressively scarce and the
factors behind this is lack of existence of proper amount of resources of water and
the poor management of water resources. In MENA countries the desertification is
now-a-days an extensive environmental problem, and the overgrazing and
unsustainable practices of agriculture is the main cause of this. In this region 86%
water is used in agriculture sector. Yemen, Jordan are facing severe water shortage.
Because of groundwater shortage in Jordan the water cost has increased 35% in
last ten years. In Yemen, more than 30% population don’t have the access to daily
food needs. In United Arab Emirates, the water table has fell for the last 30 years
about 1 meter/year (The water project 2018). In MNEA region the overuse of
desalination plant for water resources is also a serious problem. Although those
desalination plants help to produce the water that are needed for the MENA region,
but they can create problems for environment and for human health. Economic
growth and rapid population, water supplies sharing across the borders, and the
climate change effects including rainfall declining, droughts and the much high
evaporation rates significantly affected the water supplies systems in MENA region
(Arab regional report 2018).
The current research has demonstrated the present water resources scenario and
future and present water demand for agricultural sector in MENA region countries
throughout the utilization of water resources that are available in the MENA region
countries. The analysis considered equally small farming and large commercial for
increasing the production agricultural products in the studied MENA countries. The
scenarios of water demand, availability of resources, and the increasing of water
exploitation were reviewed on national level. The results revealed that, many of the
MENA countries (e.g. Lebanon, Iran, Iraq, Egypt, Turkey) could increase their
cultivable area, based on establishing some extra technological methods. Most of
the MENA countries does not have the sufficient groundwater or surface water.
However, each of the country needed to be considered as individual case, when
producing management plans for water resources for future. The volume may be

56
comparatively estimated of renewable groundwater and surface water resources,
but the increasing cost of exploitation in every source needed to be considered. It is
clear that only depending on the groundwater and surface water resources it’s not
possible to meet the future demands of water, even when thinking their significant
abundance.
The scenario along with greatest economic returns, provided used groundwater and
surface water percentage, should be selected. For future development, the
recommendation should also consider farmer’s livelihood, economic sustainability,
and most important economic growth for long-term. Expanding the area of
agricultural land on countryside scale is also related to many more constrained
issues than ones reviewed in this paper. It is admitted that, in the agricultural sector
the major developments are directly associated with the ability of society to improve
legislations and the plans for water management. This research paper aspires to
represent a baseline intended for comparison of renewable water resources and
agricultural land availability in MENA region countries, as a prerequisite for
agricultural sector expansion with the manner of sustainability.
In MENA region the problem of water resources is the most complex, urgent, and
intractable than any other state of the world. It is noted that MENA’s declining water
resources are a great threat for the economic growth in the mentioned regions. The
government and the water users call the immediate actions for the critical situation.
Usually the fragmented supply-oriented method for developing water definitely give
way to unify the water resource management. Opportunities and challenges for
unifying water resource management normally includes alteration of the recent
planning exercises to represent the treatment of the water as an economic
development and implementation of a complete policy outline, united along with the
decentralized administration and also the delivery structures. It can be a partial or
sometimes completely new substitute to investment in the innovative supply for
improving existing management supplies. The one significant approach to enhance
the availability of water supply in the area can be the management of usual
groundwater renew and improvement of magnitude through the means of artificial.

57
8 REFERENCES
Abou Zaki N., Torabi Haghighi A., Rossi P.M., Xenarios S. and Klove B., 2018. An
index-based approach to assess the water availability for irrigated agriculture in Sub-
saharan Africa. Water. 10(7): 5-6.
Abou Zaki N., Torabi Haghighi A., Rossi P.M., Bakhshaee A., J. Tourian M., and
Klove B., 2020. Evaluating impacts of irrigation and Drought on River, Groundwater
and a Terminal Wetland in Zayanderud Basin, Iran. 12(5): 1302.
Akhtar., Bolle M.J., Rebecca M., 2017. U.S. Trade and Investment in the Middle east
and North Africa: Overview and Issues for Congress. CRS Report to congress
R42153. Washington: Congressional Research Service.
Allan JA., 2001. The Middle East water question: hydro politics and the global
economy. I.B. Tauris, London.
AQUASTAT, 2008. Country Fact Sheet: Iran. FAO's global information system on
water and agriculture. Available at:
http://www.fao.org/nr/water/aquastat/countries_regions/QAT/.
Arab Regional Report, 2018. Regional Process Commission. Region: Arab.
Available at:
file:///C:/Users/Palash%20Saha/Downloads/Arab%20Regional%20Report%20for%
208th%20Forum%20-%20Pre-Forum%20v14M.pdf. Accessed on: 19.05.2020.
Atlantic Council, 2019. In the face of climate change: Challenges of water scarcity
and security in MENA. Available at:
https://www.atlanticcouncil.org/blogs/menasource/in-the-face-of-climate-change-
challenges-of-water-scarcity-and-security-in-mena/. Accessed on: 03.06.2020.
Bahri A., 2009. Case studies in Middle Eastern and North African countries. In:
Jimenez B, Asano T (EDS). Water reuse: an international survey of current practice,
issues and needs. IWA, London, pp 27-47.
Berndtsson R., Jebari S., Hashemi H., 2016. Traditional irrigation techniques in
MENA with a focus on Tunisia. ISSN: 0262-6667.

58
Baconi T, 2018. Testing the water: How water scarcity could destabilize the Middle
East and North Africa. Available at:
https://www.ecfr.eu/publications/summary/how_water_scarcity_could_destabilise_t
he_middle_east_and_north_africa. Accessed on: 19.05.2020.
BM, 2014. World Development indicators. World Data Bank. World Bank.
Crawford A., Brown O., 2009. Rising temperatures, rising tension climate change
and the risk of violent conflict in the Middle East. International Institute for
Sustainable Development.
Center for Environment and Development in the Arab World (CEDARE), 2016.
Status of integrated water resources management in the Arab region. UNDP and the
Arab Water Council, Cario.
Denicola E., Aburizaiza O.S., Siddique A., Khwaja H., 2015. Climate change and
water scarcity: The case of Saudi Arabia. Annals of Global Health. Volume 81, Issue
3, pages 342-353.
Droogers P., Immerzeel W., Terink W., 2017. Water resources trends in Middle Esat
and North Africa towards 2050. Hydrol. Earth Syst. Sci., 16, 3101-3114, 2017.
Elhadj E., 2018. Saudi Arabia’s agricultural project: from dust to dust. Middle Ease
Rev Int Aff 12(2):29-37.
Economic and Social Commission for Western Asia (ESCWA), 2020. Available at:
https://www.unescwa.org/. Accessed on: 20.12.2019.
FAO, 2017. Improvement of irrigation water management in the kingdom of Saudi
Arabia. UTFN/SAU/011/SAU.
FAO, 2009, Irrigation in the Middle East Region in Figures, FAO, Rome, p.355; DSL,
Land and Water resources. Available at: http://en.dsi.gov.tr/land-water-resource.
Accessed on: 23.12.2020.
FAO, 2009; Comair, F., 2009. Water Management and Hydro diplomacy in Lebanon.
Notre Dame University Press, Zouk Mikayel. Ministry of the Environment, 2011.

59
FAO, 2018. GIEWS Country Brief. Food and Agriculture Organization of the United
Nations. Rome.
FAO, 2014. Water stress. AQUASTAT infographic. Food and Agriculture
Organization of the United Nations, Rome.
Food and Agriculture Organization of the United Nations, 2009. Synthesis Report:
Groundwater Management in Iran.
Food and Agriculture Organization, 2008. Irrigation in the Middle East Region in
Figures – Aquastat Survey. Available at:
www.fao.org/nr/water/aquastat/countries_regions/irq/IRQ-CP_eng.pdf. Accessed
on: 17.01.2020.
GDRS (General Directorate of Rural Services), 2003. Soil and water resources of
Turkey and desertification (Turkiye Toprak ve Su Kaynaklari ve Collesme).
ICARDA and AusAID. 2011. Water and agriculture in Egypt. International Center for
Agricultural Research in the Dry Areas and Australian Government.
IDS, 2019. Irrigation in Middle East and North Africa Region. Available at:
https://www.eldis.org/document/A45599 . Accessed on: 03.06.2020.
IRIN, 2015. Yemen: Focus on water shortage. IRINnews.org, Sana 2005-02-17.
Khater A., 2009. Intensive groundwater use in the Middle East and North Africa.
Keraita BN., Drechsel P., Jimenez B., 2008. Extent and implications of agricultural
reuse of untreated, partly treated and diluted wastewater in developing countries.
CAB Reviews: Perspectives in Agriculture, Veterinary Science, Nutrition and Natural
Resources 3(0580: 1-15.
Kfouri C., Mantovani P., Jeuland M., 2019. Water reuse in the MENA region:
constrains, experiences and policy recommendations.
Lezzaik K., Milewski A., 2018. A quantitative assessment of groundwater resources
in the Middle Esat and North Africa region. Hydrology Journal 26, 251-266.

60
Michel D., Pandya A., Hasnain S.I., 2018. Water challanges and cooperative
response in the Middle East and North Africa. 2018 U.S. – Islamic World Forum
Papers.
Miller, 2015. Reviews of water resources and desalination technologies. Sandia
National Laboratories, Albuquerque, NM.
Ministry of Agriculture (MOA), 2016. The national strategy for agricultural
development.
Ministry of Water and Irrigation (MWI), 2015. Wastewater reuse. Water demand
management forum. 35 pp.
MEDD, 2018. State of the Environment Report 2009. Ministry of Environment and
Sustainable Development, Tunis.
Mualla, W., 2018. Water Demand Management Is a Must Mena Countries…. But Is
It Enough?
MWRI, 2015. Ministry of Water Resources and Irrigation.
MOEW (Ministry of Environment and Water), 2006. United Arab Emirates: National
report. Report submitted to the International Conference on Agrarian Reform and
Rural Development.
Qadir M., Bahri A., Sato T., 2016. Wastewater production, treatment and irrigation in
Middle East and North Africa. Irrig Drainage Syst 24:37-51.
Qadir M., Sharma BR., Karajeh F., 2017. Non-conventional water resources and
opportunities for water augmentation to achieve food security in water scarce
countries. Agric Water Manag 87:2-22.
Richards A., 2002. Coping with water scarcity: the governance challenge. Institute
on Global Conflict and Cooperation, Policy Papers.
http://repositories.cdlib.org/igcc/PP/PP54. Accessed on: 04.04.2020.
Smit B, Wandel J., 2006. Adaptation, adaptive capacity and vulnerability. Glob
Environ Change 16:282-292.

61
Sowers J., Vengosh A., Weinthal E., 2015. Climate Change, Water resources, and
the politics of adaptation in the Middle East and North Africa. Climatic Change
104:559-627.
The conservation, 2018. A worsening water crisis in North Africa and the Middle
East. Available at: https://theconversation.com/a-worsening-water-crisis-in-north-
africa-and-the-middle-east-83197. Accessed on 20.05.2020.
The water projects, 2018. Water in crisis in Middle East. Available at:
https://thewaterproject.org/water-crisis/water-in-crisis-middle-east . Accessed on:
19.05.2020.
Torabi Haghighi A., Abou Zaki N., Rossi PM., Noori R., Saremi H., Akbar
Hekmatzadeh A., and Klove B., 2020. Unsustainability Syndrome – From
Meteorological to Agricultural Drought in Arid and Semi-Arid Regions. Water. 12(3):
838.
Tolba MK., Saab N., 2017. Arab public opinion and the environment conference
report of 18 country survey. Available at:
http://www.afedonline.org/en/inner.aspx?contentID=88. Accessed on: 12.02.2020
Tropp H, 2016. Water scarcity challenges in the Middle East and North Africa
(MENA). Human Development Report 2016 – Water for Human Development.
UN-Habitat, State of the World’s Cities 2004/05., 2004. Trends in Middle East &
North Africa. Nairobi.
UNDP, 2010. Water supply and sanitation in Libya: gap analysis, national needs
assessment and UNFP interventions. United Nations Development Programme.
New York.
United Nations Development Programme, 2015. 'About Iraq'. Available at:
www.iq.undp.org/content/iraq/en/home/countryinfo.html. Accessed on: 02.02.2020.
USAID, 2011. Integrated water resource management II. Annual Report Rev. 1 Year
2 (January-December 2010). United States Agency for International Development.

62
World Economic Forum, 2020. Water scarcity is a growing problem across the
Middle East. Is this how we solve it? Available at:
https://www.weforum.org/agenda/2019/03/water-scarcity-is-a-growing-problem-
across-the-middle-east-is-this-how-we-solve-it/ Accessed on: 21.10.2019.
World Bank Group, 2015. Iran Outlook. Available at:
https://www.worldbank.org/en/country/iran/overview. Accessed on: 12.03.2020.
World Bank Group, 2018. Beyond Scarcity. Water security in the Middle East and
North Africa. 1818 H Street NW, Washington, DC 20433.
World Resource Institute, 2020. Available at: https://www.wri.org/. Accessed on:
12.01.2020.
World Water Development Report (WWDR), 2014. Water for people, Water for Life.
UNESCO and Berghahn, Paris.
World Bank, 2007. Climate change, irrigation and Israeli agriculture: Will warming be
harmful? Policy Research Working Paper 4135.


