

2019
A regional collaboration of
Lee County,
City of Fort Myers,
City of Cape Coral,
Housing Authority of the City of Fort
Myers, and
Lee County Housing Authority
Assessment of Fair Housing
Assessment of Fair Housing Tool
Table of Contents
I. Cover Sheet
II. Executive Summary
III. Community Participation Process
IV. Assessment of Past Goals and Actions
V. Fair Housing Analysis
A. Demographic Summary
B. General Issues
i. Segregation/Integration
ii. Racially or Ethnically Concentrated Areas of Poverty (R/ECAPs)
iii. Disparities in Access to Opportunity
iv. Disproportionate Housing Needs
C. Publicly Supported Housing Analysis
D. Disability and Access Analysis
E. Fair Housing Enforcement, Outreach Capacity, and Resources Analysis
VI. Fair Housing Goals and Priorities
VII. Appendices and Instructions
A. Instructions
B. Appendix A – HUD-Provided Maps
C. Appendix B – HUD-Provided Tables
D. Appendix C – Descriptions of Potential Contributing Factors

I. Cover Sheet
1. Submission date: January 1, 2019
2. Submitter name: Lee County
3. Type of submission (e.g., single program participant, joint submission): Regional
4. Type of program participant(s) (e.g., consolidated plan participant, PHA):
Consolidated Plan Participant (3), PHA (2)
5. For PHAs, Jurisdiction in which the program participant is located: Lee County
6. Submitter members (if applicable):
Amy Yearsley
City of Cape Coral
1015 Cultural Park Boulevard
Cape Coral, FL 33990
Sharon Rozier
City of Fort Myers
1825 Hendry Street
Fort Myers, FL 33901
Sherri Campanale
Housing Authority of the City of Fort Myers
4224 Renaissance Preserve Way
Fort Myers, FL 33916
Sherri Campanale
Lee County Housing Authority
14170 Warner Circle
Fort Myers, FL 33903
7. Lead submitter contact information:
Jeannie Sutton
Lee County Human and Veteran Services
2440 Thomson Street
Fort Myers, FL 33901
8. Period covered by this assessment: January 1, 2019 – January 1, 2024
9. Initial, amended, or renewal AFH: Initial
10. To the best of its knowledge and belief, the statements and information contained herein are true,
accurate, and complete and the program participant has developed this AFH in compliance with
the requirements of 24 C.F.R. §§ 5.150-5.180 or comparable replacement regulations of the
Department of Housing and Urban Development;
11. The program participant will take meaningful actions to further the goals identified in its AFH
conducted in accordance with the requirements in §§ 5.150 through 5.180 and 24 C.F.R. §§
91.225(a)(1), 91.325(a)(1), 91.425(a)(1), 570.487(b)(1), 570.601, 903.7(o), and 903.15(d), as
applicable.

*** (Print Name) (Program Participant/Title) (Signature) (date)
***(Print Name) (Program Participant/Title) (Signature) (date)
***(Print Name) (Program Participant/Title) (Signature) (date)
Comments
1
II. Executive Summary
1. Summarize the fair housing issues, significant contributing factors, and goals. Also
include an overview of the process and analysis used to reach the goals.
III. Community Participation Process
1. Describe outreach activities undertaken to encourage and broaden meaningful
community participation in the AFH process, including the types of outreach
activities and dates of public hearings or meetings. Identify media outlets used and
include a description of efforts made to reach the public, including those representing
populations that are typically underrepresented in the planning process such as
persons who reside in areas identified as R/ECAPs, persons who are limited English
proficient (LEP), and persons with disabilities. Briefly explain how these
communications were designed to reach the broadest audience possible. For PHAs,
identify your meetings with the Resident Advisory Board and other resident outreach.
2. Provide a list of organizations consulted during the community participation process.
3. Describe whether the outreach activities elicited broad community participation
during the development of the AFH. If there was low participation, or low
participation among particular protected class groups, what additional steps might
improve or increase community participation in the future, including overall
participation or among specific protected class groups?
4. Summarize all comments obtained in the community participation process. Include a
summary of any comments or views not accepted and the reasons why.

IV. Assessment of Past Goals, Actions and Strategies
1. Indicate what fair housing goals were selected by program participant(s) in recent Analyses
of Impediments, Assessments of Fair Housing, or other relevant planning documents:
a. Discuss what progress has been made toward the achievement of fair housing goals.
Lee County, in collaboration with the cities of Cape Coral and Fort Myers, identified seven
regional impediments, and five local impediments to fair housing in the 2015/2016 Analysis of
Impediments. Each regional impediment was assigned a goal and various strategies for meeting
recommended benchmarks. Regional goals selected aim to:
1. Reduce incidence of discrimination in the sale or rental of housing.
2. Increase racial and ethnic minority’s access to home financing.
3. Improve regional transportation.
4. Affirmatively further fair housing program in the County.
5. Improve housing accessibility for persons with disabilities.
6. Improve LEP persons’ access to fair housing information.
7. Ensure that the members of protected classes are represented on local planning/zoning
boards.
In addition to the identification of regional goals, each jurisdiction established local goals.
Lee County Local Goal – Ensure that local zoning ordinances are in compliance with the Fair
Housing Act.
City of Fort Myers Local Goal – Affirmatively further fair housing in the City of Fort Myers
and ensure that local zoning ordinances are in compliance with the fair housing act.
City of Cape Coral Local Goal - Affirmatively further fair housing in the City of Cape Coral
and ensure that local zoning ordinances are in compliance with the fair housing act.
In an effort to take measurable action toward accomplishing each goal, specific strategies and
benchmarks were measured and reported on quarterly. Accomplishments reported for each goal are
detailed below.
Reduce incidence of discrimination in the sale or rental of housing.
Lee County Human and Veteran Services (HVS) ensured ease of access of fair housing
information to the public both via their website and in print at various public contact
points, such as libraries and community centers. Additionally, Lee County continuously
ensures that all relevant documents and publications are available in English and Spanish,
and feature the fair housing logo.
Lee County administered a contract for the 2015/2016 program year with Florida Rural
Legal Services to provide fair housing education and assist in the organization of a regional
fair housing workshop, held during National Fair Housing month in April. The workshop,
hosted by the Housing Authority of the City of Fort Myers, was attended by representatives
from the regional jurisdictions, local residents, property owners, and realtors.
Lee County HVS distributed fair housing information packages to property owners that
rent to low income residents throughout the County. A housing resource coordinator has
also been hired to actively engage property owners.
Increase racial and ethnic minority’s access to home financing.

The City of Cape Coral maintains lender guidelines for participation in the City's CDBG,
NSP, SHIP programs.
Lee County HVS has conducted several strategic outreach events which included
distribution of program and fair housing marketing materials. In addition, HVS offers
financial literacy training funded by a Florida Attorney General’s office grant, and budget
clinic taught by staff of the University of Florida Extension Services office.
Improve regional transportation.
The City of Cape Coral's minibus, funded by CDBG funds, provides transit to disabled
individuals within the City.
Job Access and Reverse Commute (JARC) and New Freedom programs were discontinued
by the Federal Transit Administration (FTA), however, Lee County continues to provide
general funds and local matches to social service agencies that received FTA Section 5310
Enhanced Mobility for Seniors & Individuals with disabilities pass through to the state of
Florida Department of Transportation.
Affirmatively further fair housing program in the County.
The Housing Authority of the City of Fort Myers, along with Lee County HVS, the City of
Fort Myers and the City of Cape Coral, hosted the Southwest Florida Annual Fair Housing
Summit on April 6, 2016, at the Dr. Carrie Robinson Community Center in Fort Myers.
The Summit featured guest speakers Mr. Aaron Levine, from the HUD Miami Field
Office, and Attorney Yohance Pettis, from Tampa based U.S. Attorney’s Office. Mr.
Levine gave an in-depth presentation about the Fair Housing Act, and discussed best
practices for property managers and owners. Attorney Pettis presented information
regarding the U.S. Attorney’s Office and Fair Housing services that are available to our
community.
Residents entering public housing programs are required to attend New Resident
Orientation, which is held monthly and offered in Spanish every other month. The
orientation details fair housing protections and informs news residents of their right to fair
housing.
Lee County distributes a Fair Housing Accomplishments log to responsible stakeholders
quarterly to ensure that measurable actions are being taken to affirmatively further fair
housing in Lee County.
Improve housing accessibility for persons with disabilities.
The City of Cape Coral and Lee County prioritize special needs clients in their Community
Development Block Grant (CDBG) and State Housing Initiate Partnership
(SHIP) funded owner occupied rehabilitation programs.
All jurisdictions ensure that reasonable accommodation information is clearly displayed in
public facilities and on public notices.
All jurisdictions ensure that newly constructed properties meet Universal Design
requirements.
Improve LEP persons’ access to fair housing information.
Lee County HVS has conducted several strategic outreach events, which included
distribution of program materials and fair housing marketing materials to LEP persons.
HVS offers financial literacy training funded by a Florida Attorney General’s office grant,
and budget clinic taught by staff of the University of Florida Extension Services office.

The City of Cape Coral and Lee County websites have a one-click translation feature,
which offers translation of all web content into a multitude of languages.
Lee County HVS reviewed and updated their Language Access Plan (LAP) for Persons
with Limited English Proficiency. The updates include the addition of an annual
monitoring plan that ensures staff is properly trained on LEP procedures.
The City of Cape Coral is in the process of rewriting their existing Title IV Plan, which
includes their LAP.
Ensure that the members of protected classes are represented on local planning/zoning
boards.
Lee County conducted a survey of the demographics of members of the Lee County
Zoning Board. Results were compiled and information was conveyed to elected officials
regarding the importance of diversity.
Progress has also been made toward the accomplishment of local fair housing goals. Lee County
collaborated with the City of Sanibel to amend their zoning ordinance, which established an
excessive separation distance requirement for assisted living, foster family homes, and residential
childcare facilities. The ordinance was revised in May 2015. The City of Cape Coral has
established a process for ensuring that group homes are properly reviewed in accordance with State
Law and Florida Building Code requirements. Additional, the City of Cape Coral has produced a
draft Fair Housing Ordinance that will be brought before their board for adoption in the near future.
b. Discuss how successful in achieving past goals, and/or how it has fallen short of
achieving those goals (including potentially harmful unintended consequences).
Overall, the progress made toward current fair housing goals has been significant. Collaboration
between entitlement jurisdictions has played a significant role in accomplishing fair housing goals.
The implementation of the Fair Housing Accomplishments Report, which is emailed quarterly to
stakeholders, has proved a useful tool in keeping responsible agencies mindful of the actions
necessary to affirmatively further fair housing. Throughout the development and execution of the
Assessment of Fair Housing that collaboration and accountability has continued. The Housing
Authority of the City of Fort Myers and the Lee County Housing Authority, the local Public
Housing Authorities (PHAs), have also been involved in the planning and development of new fair
housing goals and strategies. PHA involvement has been instrumental to ensure that residents most
vulnerable to discrimination are aware of their rights. Partnerships between community
stakeholders and housing developers have made Lee County successful in determining fair housing
goals and addressing impediments.
There have been some short falls in actions taken to accomplish the established goals. Little
progress has been made toward the goals of improving regional transportation. Public
transportation continues to be an ongoing concern in Lee County. The discontinuation of Job
Access and Reverse Commute (JARC) and New Freedom programs formerly funded by the
Federal Transit Administration (FTA) limited the resources available to accomplish established
goals. Lee County continues to provide general funds and local matches to social service agencies
that received FTA Section 5310 Enhanced Mobility for Seniors & Individuals with disabilities pass
through to the State of Florida Department of Transportation. Lee Tran, the local public
transportation provider, has also developed additional transportation options, as part of the 10 year
Transit Development Plan and the 2035 Visions Plan.

The Lee County Transit Development Plan can be viewed here:
https://www.leegov.com/leetran/Documents/LeeTran%20TDP%20Final%20Report%2010-13-
16.pdf
Additional actions can also be taken toward reducing incidences of discrimination in the sale or
rental of housing through coordinating and conducting comprehensive countywide random testing
on a regular basis to identify issues, trends, and problem properties. Feasibility studies and the
development of testing methods must be completed prior to any scheduling of testing. Lee County
did explore the options of the Department of Justice completing testing, but the partnership was
never fully developed.
Locally, additional actions can be taken toward adopting a fair housing ordinance within the City
of Cape Coral. The City of Cape Coral, has been working toward this goal
NEED CITY OF CAPE CORAL TO COMPLETE.
The City of Fort Myers could also take additional actions toward the development and adoption of
administrative procedures for processing group home requests that comply with the Fair Housing
Act. NEED CITY OF FORT MYERS TO COMPLETE.
As Lee County has collaboratively worked to accomplishing fair housing goals, there have
been some unintended consequences. OR As Lee County has collaboratively worked to
accomplishing fair housing goals, there have not been any unintended consequences.
Discrimination due to implementation of disability preference in OOR programs?
Discrimination due to change in policy re: group home separation in Sanibel
c. Discuss any additional policies, actions, or steps that the program participant could
take to achieve past goals, or mitigate the problems it has experienced.
As transportation is a significant issue within our community, additional policies and actions
should be implemented to ensure that development occurs in the most vulnerable areas first. In
addition to ensure adequate access to transportation, all jurisdictions should implement additional
actions to educate private land owners and realtors about fair housing laws to ensure that all
persons have equal access to housing in Lee County. Some specific examples of these actions
include:
1. Contracting with a Fair Housing Service Provider that proactively seeks opportunities to
provide fair housing presentations and marketing materials to private landowners,
neighborhood associations, realtors, and property managers.
2. Conducting an annual fair housing summit, which is broadly advertised and attended by all
members of the community that provide housing.
3. Collaborating with Lee Tran to gather detailed information on transportation needs
throughout low-income areas of Lee County and develop a transportation development
plan to address those needs.
4. MORE
d. Discuss how the experience of program participant(s) with past goals has
influenced the selection of current goals.
V. Fair Housing Analysis
A. Demographic Summary
1. Describe demographic patterns in the jurisdiction and region, and describe trends over time
(since 1990). (Racial/ethnic populations; national origin populations, including any
limited English proficient populations; individuals with disabilities by disability type;
and families with children.)
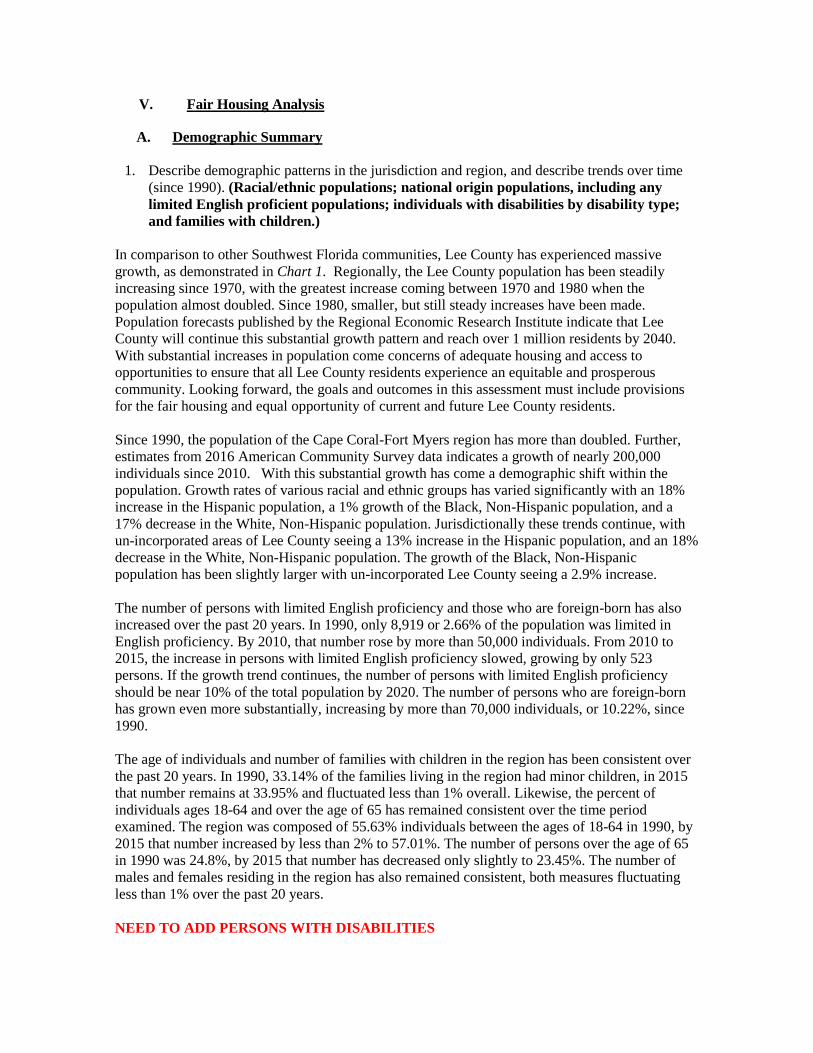
In comparison to other Southwest Florida communities, Lee County has experienced massive
growth, as demonstrated in Chart 1. Regionally, the Lee County population has been steadily
increasing since 1970, with the greatest increase coming between 1970 and 1980 when the
population almost doubled. Since 1980, smaller, but still steady increases have been made.
Population forecasts published by the Regional Economic Research Institute indicate that Lee
County will continue this substantial growth pattern and reach over 1 million residents by 2040.
With substantial increases in population come concerns of adequate housing and access to
opportunities to ensure that all Lee County residents experience an equitable and prosperous
community. Looking forward, the goals and outcomes in this assessment must include provisions
for the fair housing and equal opportunity of current and future Lee County residents.
Since 1990, the population of the Cape Coral-Fort Myers region has more than doubled. Further,
estimates from 2016 American Community Survey data indicates a growth of nearly 200,000
individuals since 2010. With this substantial growth has come a demographic shift within the
population. Growth rates of various racial and ethnic groups has varied significantly with an 18%
increase in the Hispanic population, a 1% growth of the Black, Non-Hispanic population, and a
17% decrease in the White, Non-Hispanic population. Jurisdictionally these trends continue, with
un-incorporated areas of Lee County seeing a 13% increase in the Hispanic population, and an 18%
decrease in the White, Non-Hispanic population. The growth of the Black, Non-Hispanic
population has been slightly larger with un-incorporated Lee County seeing a 2.9% increase.
The number of persons with limited English proficiency and those who are foreign-born has also
increased over the past 20 years. In 1990, only 8,919 or 2.66% of the population was limited in
English proficiency. By 2010, that number rose by more than 50,000 individuals. From 2010 to
2015, the increase in persons with limited English proficiency slowed, growing by only 523
persons. If the growth trend continues, the number of persons with limited English proficiency
should be near 10% of the total population by 2020. The number of persons who are foreign-born
has grown even more substantially, increasing by more than 70,000 individuals, or 10.22%, since
1990.
The age of individuals and number of families with children in the region has been consistent over
the past 20 years. In 1990, 33.14% of the families living in the region had minor children, in 2015
that number remains at 33.95% and fluctuated less than 1% overall. Likewise, the percent of
individuals ages 18-64 and over the age of 65 has remained consistent over the time period
examined. The region was composed of 55.63% individuals between the ages of 18-64 in 1990, by
2015 that number increased by less than 2% to 57.01%. The number of persons over the age of 65
in 1990 was 24.8%, by 2015 that number has decreased only slightly to 23.45%. The number of
males and females residing in the region has also remained consistent, both measures fluctuating
less than 1% over the past 20 years.
NEED TO ADD PERSONS WITH DISABILITIES

For question (1), refer to Tables 1 and 2, which present demographic summary data for the jurisdiction and
region. The demographics analyzed must include an overview of: racial/ethnic populations; national origin
populations, including any limited English proficient populations; individuals with disabilities by disability type;
and families with children.

B. General Issues
i. Segregation/Integration
1. Analysis
a. Describe and compare segregation levels in the jurisdiction and region. Identify
the racial/ethnic groups that experience the highest levels of segregation.
HUD provides data regarding the degree to which two groups are evenly distributed across
our region. This data is represented by a Dissimilarity Index ranging from 0 to 100. Index
values between 0 and 30 indicate low segregation, and values between 55 and 100 indicate
high levels of segregation. For the Cape Coral–Fort Myers Region the HUD data indicates
that segregation of Black and White populations is the highest in the region with a current
index of 63.39. Segregation within Hispanic/White and Non-White/White population’s
remains moderate, while segregation within Asian or Pacific Islander and White
populations is the lowest in the region. Segregation among all population groups has
increase slightly since 2010.
Data Source: HUD Table 3 – Racial/Ethnic Dissimilarity Trends –
https://egis.hud.gov/Affht/
20.0025.0030.0035.0040.0045.0050.0055.0060.0065.0070.0075.0080.00
1 9 9 0 T R E N D 2 0 0 0 T R E N D 2 0 1 0 T R E N D C U R R E N T
CAPE CORAL FORT-MYERS REGION
Non-White/White Black/White Hispanic/White Asian or Pacific Islander/White

Similar to regional trends, the dissimilarity index for the Lee County Jurisdiction indicates
the highest level of segregation remains among Black and White populations. Segregation
among Non-White/White and Hispanic/White populations is moderate, has been steadily
increasing since 2010. Segregation among Asian or Pacific Islander/White populations
remains low in comparison to other groups in the jurisdiction.
Data Source: HUD Table 3 – Racial/Ethnic Dissimilarity Trends –
https://egis.hud.gov/Affht/
Segregation among all population groups in the City of Fort Myers Jurisdiction has
remained fairly level since 2010. Still, the highest segregation levels can be found between
Black and White populations. Segregation within Non-White/White and Hispanic/White
populations remains moderate. Segregation within Asian or Pacific Islander and White
populations has risen by more than 27%, the most significant change since 2010 among all
populations. Segregation levels for Black/White, Non-White/White, and Hispanic/White
populations in the City of Fort Myers are higher than in the other jurisdictions.
Data Source: HUD Table 3 – Racial/Ethnic Dissimilarity Trends –
https://egis.hud.gov/Affht/
20.0025.0030.0035.0040.0045.0050.0055.0060.0065.0070.00
1 9 9 0 T R E N D 2 0 0 0 T R E N D 2 0 1 0 T R E N D C U R R E N T
LEE COUNTY JURISDICTION
Non-White/White Black/White Hispanic/White Asian or Pacific Islander/White
10.0015.0020.0025.0030.0035.0040.0045.0050.0055.0060.0065.0070.0075.0080.00
1 9 9 0 T R E N D 2 0 0 0 T R E N D 2 0 1 0 T R E N D C U R R E N T
CITY OF FORT MYERS JURISDICTION
Non-White/White Black/White Hispanic/White Asian or Pacific Islander/White

Similar to the Cape Coral- Fort Myers Region and the other jurisdictions the City of Cape
Coral’s Jurisdiction also has the highest levels of segregation among Black/White
populations, which has a dissimilarity index of 27.05. In contract, the Cape Coral
Jurisdiction has the lowest segregation levels in the region. The dissimilarity indexes for all
populations in Cape Coral are below 39, indicating that segregation is low. Also different
from the region, is the level of segregation for Asian or Pacific Islander/White populations
in Cape Coral. The level of segregation for this population is slightly higher than that of
Non-White/White and Hispanic/White populations.
Data Source: HUD Table 3 – Racial/Ethnic Dissimilarity Trends –
https://egis.hud.gov/Affht/
Each jurisdiction indicates the highest levels of segregation within Black and White
populations. The highest levels of segregation can be found in the City of Fort Myers
Jurisdiction and the lowest in the City of Cape Coral Jurisdiction.
10.00
15.00
20.00
25.00
30.00
1 9 9 0 T R E N D 2 0 0 0 T R E N D 2 0 1 0 T R E N D C U R R E N T
CITY OF CAPE CORAL JURISDICTION
Non-White/White Black/White Hispanic/White Asian or Pacific Islander/White

b. Identify areas in the jurisdiction and region with relatively high segregation and
integration by race/ethnicity, national origin, or LEP group, and indicate the
predominant groups living in each area.
Areas of High Segregation Based on Race/Ethnicity
HUD Map 1 indicates areas of population by race and ethnicity throughout the region and
Lee County Jurisdiction. The map displays some integration among populations of White,
Non-Hispanic, Black, Non-Hispanic, and Hispanic populations in the Lehigh Acres area.
The western portion of Lehigh Acres, between Lee Blvd and SR82 is slightly less
integrated, but still more integrated than other areas of the region. There is significant
segregation of the Hispanic population group in the Pine Manor area as well as a small
portion of the Tice area along Palm Beach Blvd. between Tice and Billy Creek, near I-75.
Additional areas of segregation can be found in the already identified R/ECAP areas near
Billy Creek, Dunbar, and Lehigh Acres. These areas feature significantly segregated
populations of Black, Non-Hispanic and Hispanic persons. There is a limited number of
Black, Non-Hispanic persons throughout the remainder of Lee County, although these
other areas are fairly integrated with representation from Hispanic and White, Non-
Hispanic populations.
HUD Map 1 indicates that the White and Hispanic populations in the Cape Coral
Jurisdiction are fairly integrated. There are also no clearly concentrated areas of Black
populations or R/ECAP areas. Asian/Pacific Islander and Multi-Racial Populations, both
Non-Hispanic, are also fairly evenly distributed throughout Cape Coral’s geographic area.
The City of Fort Myers Jurisdiction contain several areas where Black and Hispanic
populations are clearly segregated from the White populations. Three of these areas are
already identified as R/ECAPs. In addition to these R/ECAPS, there is a high concentration
of Hispanic and Black populations East of the Cleveland Ave. corridor North of Colonial
Blvd, as indicated in the HUD Map 1-FM below.


Areas of High Segregation Based on National Origin HUD Map 3 provides National Origin data and indicates several concentrated areas of
populations from Cuba, Mexico, Guatemala, and Haiti. Two large areas of Cuban national
origin can be found in the Cape Coral and Lehigh Acres areas. The Cape Coral area of
Cuban national origin is only slightly integrated with persons of Canadian origin. The
Lehigh Acres area of Cuban origin in more integrated with persons of Mexican and Haitian
origin. The northeastern area of Cape Coral has a high concentration of persons of Mexican
origin, as does portions of the City of Fort Myers and Lehigh Acres. As previously
mentioned the Mexican population in Lehigh Acres is mostly integrated with the Cuban
and Haitian populations in that area. The Mexican populations in Tice, Fort Myers Shores,
and Pine Manor are less integrated with persons of other origins. There is a significant
concentration of Haitians in the R/ECAP areas in the City of Fort Myers. Other Canadian,
Mexican, and Haitian populations can be found along McGregor Blvd, Bonita Springs, and
in San Carlos Park north of Estero. There are definite areas of concentration of Cuban,
Canadian, Mexican, and Haitian populations throughout the County, but these areas are fair
evenly distributed around the region.
HUD Map 3 illustrates the areas of high Cuban concentration within the Cape Coral
Jurisdiction. These areas are situated within the census blocks East and West of Santa
Barbara Blvd N.. Each of the Census Blocks in this feature greater than 60% Cuban
populations. Most other block groups throughout Cape Coral’s Jurisdiction consist of
greater than 30% Cuban populations, with some representation from German, Mexican,
Guatemalan, and Dominican populations scattered in no specific pattern.
The City of Fort Myers Jurisdiction features several areas of high segregation based on
National Origin, as indicated on HUD Map 3-FM. A significant concentration of
Brazilian, Cuban and Haitian Populations can be identified south of the Dunbar R/ECAP
area.
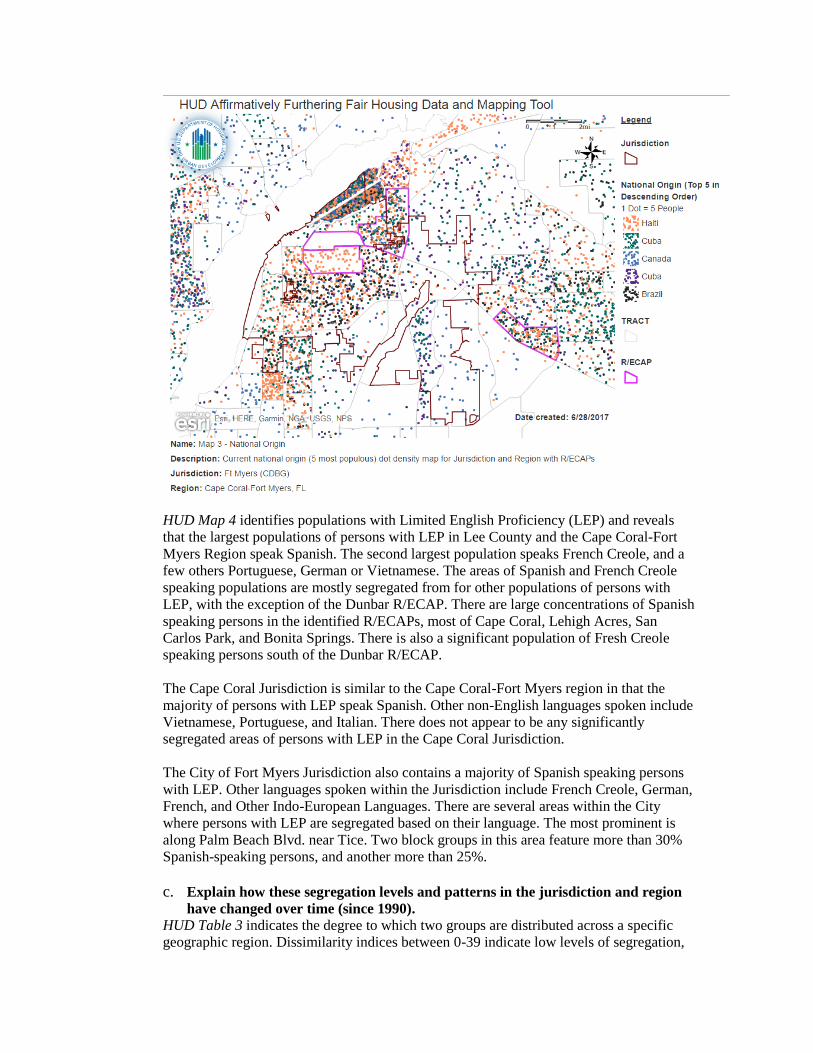
HUD Map 4 identifies populations with Limited English Proficiency (LEP) and reveals
that the largest populations of persons with LEP in Lee County and the Cape Coral-Fort
Myers Region speak Spanish. The second largest population speaks French Creole, and a
few others Portuguese, German or Vietnamese. The areas of Spanish and French Creole
speaking populations are mostly segregated from for other populations of persons with
LEP, with the exception of the Dunbar R/ECAP. There are large concentrations of Spanish
speaking persons in the identified R/ECAPs, most of Cape Coral, Lehigh Acres, San
Carlos Park, and Bonita Springs. There is also a significant population of Fresh Creole
speaking persons south of the Dunbar R/ECAP.
The Cape Coral Jurisdiction is similar to the Cape Coral-Fort Myers region in that the
majority of persons with LEP speak Spanish. Other non-English languages spoken include
Vietnamese, Portuguese, and Italian. There does not appear to be any significantly
segregated areas of persons with LEP in the Cape Coral Jurisdiction.
The City of Fort Myers Jurisdiction also contains a majority of Spanish speaking persons
with LEP. Other languages spoken within the Jurisdiction include French Creole, German,
French, and Other Indo-European Languages. There are several areas within the City
where persons with LEP are segregated based on their language. The most prominent is
along Palm Beach Blvd. near Tice. Two block groups in this area feature more than 30%
Spanish-speaking persons, and another more than 25%.
c. Explain how these segregation levels and patterns in the jurisdiction and region
have changed over time (since 1990).
HUD Table 3 indicates the degree to which two groups are distributed across a specific
geographic region. Dissimilarity indices between 0-39 indicate low levels of segregation,
values of 40-54 indicate moderate segregation, and values of 55-100 indicate high levels of
segregation. (AFFHT Instructions)
In 1990, the segregation of Black and White populations was high, with a dissimilarity
index of 77.08. In comparison, the segregation of Non-White and White populations was
only 53.68, indicating that, like the present, Black populations experienced the greatest
levels of segregation in 1990. In 2000, those indices reduced to 68.02 and 46.03,
respectively. Even further reduction in 2010 indicates that Black population is becoming
slightly more integrated with the White population throughout the region.
With the steady increase in integration for the Black population, the Cape Coral – Fort
Myers region experienced increased segregation among Hispanic, Asian or Pacific
Islander, and White populations. This regional increase is largely due to the dramatic influx
of Hispanic persons into the region. Despite this increase, segregation among all
populations has steadily decreased over the past 20 years.
HUD Table 3 also indicates the racial and ethnic dissimilarity trends within the Lee County
jurisdiction. In 1990, Lee County saw high levels in segregation among Black and White
populations, with a dissimilarity index of 67.76. Jurisdictionally, however the integration
of the Black population has been smaller than that of the region, with a reduction of only
2.7 between 2000 and 2010.
All other measured races and ethnicities have seen an increase in levels of segregation at
the jurisdiction level from 1990 to 2010. In 1990 the dissimilarity index for Non-White and
White populations was 44.74, in 2000 the index increased to 45.15, and again in 2010 to
51.49. The Asian or Pacific Islander and White segregation has also increased since 1990,
from an index of 24.95 to 35.13 in 2010. The 1990 index for Hispanic and White
populations was 36.89, increasing in 2000 to 44.39, and again in 2010 to 52.27. Hispanic
and White segregation levels have had the greatest increase over the past 20 years. This
increase can be partially attributed to the 14% increase in the total Hispanic population
within the County over the past 20 years.
HUD Map 2, which features demographic data from 1990, indicates that the whole of Lee
County was primarily White, Non-Hispanic. There is was a large concentration of Black,
Non-Hispanics persons in the Tice area within the City of Fort Myers, along Palm Beach
Blvd, the same area had been designated as a R/ECAP at that time. Demographic data from
2000 indicates a slight growth in the Hispanic population in the Lehigh Acres, Bonita
Springs, and Cape Coral areas. The Black, Non-Hispanic R/ECAP area expanded slightly
from 1990 to 2000. Demographic data from 2010 shows a significant increase in the
Hispanic population throughout the county, but largely in the Lehigh Acres, Bonita
Springs, and Cape Coral areas. The previously identified R/ECAP is slightly smaller in
area, and includes a significant increase in the Hispanic population. There is also
significant growth in the Black, Non-Hispanic population in the Lehigh Acres area.
d. Consider and describe the location of owner and renter occupied housing in the
jurisdiction and region in determining whether such housing is located in
segregated or integrated areas, and describe trends over time.
Regionally, between 30% and 50% of the available housing units are renter occupied. A
few areas have renter occupied units in greater volume, some as many as 70%-89.99%.
The most highly concentrated areas of renter occupied units exceed 90%. As displayed on

Local Map 1, there are several areas of the region, which are 90% or more renter occupied
dwellings. Many of these areas lie within the City of Fort Myers jurisdiction. The others
that lie within the Lee County jurisdiction are described below.
One area highly concentrated with scattered sight rentals is in the Lehigh Acres R/ECAP,
north of 82, south of Lee Blvd. and west of Gunnery Rd. This area of single-family renter
occupied homes was identified above as having a high concentration of Black, Non-
Hispanic and Hispanic Populations. This largely renter occupied area consists primarily of
Mexican, Cuban, Haitian, and Guatemalan populations. Although integrated with various
races, ethnicities and national origins, this area is slightly segregated from the White, Non-
Hispanic populations within the owner-occupied housing units in the surrounding areas.
Another area that is identified has highly concentrated with rental units is the area surround
South Fort Myers High School on 6 Mile Cypress Parkway. This area features one multi-
family apartment complex and no other housing units, thus making it a highly concentrated
rental area. Another identified area on Cypress Lake Dr. and McGregor Blvd has similar
characteristics, with a small single family neighborhood located behind a largely retail
area. These areas have primarily White, Non-Hispanic populations with some Hispanic
persons.
Finally, a high-density rental area is located east of 41 beginning at the Page Park
Neighborhood and continues north into the City of Fort Myers Jurisdiction until Winkler
Ave. The northern portion of this area consists of multiple multi-family housing
complexes, both apartments and condominiums. These complexes are well integrated into
retail and industrial spaces and are very close to a major shopping mall and highway 41.
The southern portion of this area, Page Park, is one of Lee County’s five target
neighborhoods. Page Park has 599 housing units, 295, or 66%, of which are renter
occupied. Both areas are fairly integrated with Hispanic, Black, Non-Hispanic, and White,
Non-Hispanic populations.
e. Discuss whether there are any demographic trends, policies, or practices that
could lead to higher segregation in the jurisdiction in the future. Participants
should focus on patterns that affect the jurisdiction and region rather than
creating an inventory of local laws, policies, or practices.
The continually growing Hispanic population could lead to higher segregation in the
jurisdiction in the future. Large concentrations of Hispanic populations are moving into the
already identified R/ECAPs and portions of Lehigh Acres, one of which has been recently
identified as a R/ECAP. If immigration and income trends continue in these areas, this
could lead to the identification of additional R/ECAPs within the region. Development
practices that prevent affordable housing development in high-income areas further
contribute to this developing trend. As rents rise and the availability of affordable housing
units decrease, low-income minority residents are experience increased gentrification.
Three items were identified as potential issues in the 2015 Assessment Report: the
definition of family, group homes in single-family districts, and minimum lot size
requirements. They were deemed not an impediment to fair housing in the Lee County
Regional Analysis of Impediments to Fair Housing Choice FY2015/2016 – FY2019/20 and
continue not to be an impediment today.
Family. “Family,” as provided in the Lee County Land Development Code Section 34-02,
includes up to four unrelated adults living in one dwelling unit.
“Family means one or more persons occupying a dwelling unit and living as a single,
nonprofit housekeeping unit, provided that a group of five or more adults who are not
related by blood, marriage or adoption will not be deemed to constitute a family. The term
"family" does not include a fraternity, sorority, club, monastery, convent or institutional
group.”
Community Residential Homes, Group Quarters. Lee County does not require distance
separation requirements for group homes and defines a community residential home the
similar to the State. The Land Development Code Section 34-2 provides:
“Community residential home means a dwelling unit licensed to serve residents who are
clients of the Department of Elderly Affairs, the Agency for Persons with Disabilities, the
Department of Juvenile Justice, or the Department of Children and Family Services or
licensed by the Agency for Health Care Administration which provides a living
environment for seven to 14 unrelated residents who operate as the functional equivalent
of a family, including such supervision and care by supportive staff as may be necessary to
meet the physical, emotional, and social needs of the residents.”
The Community residential homes definition provides that seven to fourteen unrelated
residents can be considered family. They are an allowable use in all residential and
agricultural zoning districts, and some commercial districts. Community residential homes
may also be a requested use as part of a residential, mobile home, commercial or mixed use
planned development rezoning. Community residential homes are allowed in all residential
zoning districts with the exception of Airport Noise Zones B. The Airport Noise Zone B
excludes all residential uses based on the airplane decibel levels during take offs and
landings.
Group quarters (such a fraternity houses) allow for unrelated persons to live in one
dwelling unit and are allowed in multi-family zoning districts providing a Special
Exception is approved for the development. They are also permitted in commercial tourist
zoning districts and can also be a requested use as part of a residential, commercial or
mixed use planned development rezoning. Group Quarters are defined Lee County Land
Development Code Section 34-02 as follows:
“Group quarters means a building in which a number of unrelated individuals that do not
constitute a family live and share various spaces and facilities for, for example, cooking,
eating, sanitation, relaxation, study and recreation. Examples of group quarters include
fraternity and sorority houses, boarding houses, adult congregate living facilities,
dormitories, rooming houses and other similar uses.”
Lee County allows community residential homes, adult family-care homes and home care
facilities to locate in single-family residential zoning districts. Community residential
homes and home care facilities are allowed by right. A family day care facility meeting
F.S. 125.0109 may apply for a waiver from the Special Exception process and develop by
right. This applies to family day care homes licensed or registered in accordance with F.S.
402.313. The day care home must operate within the applicant’s residence and be either
owned or leased by the applicant.

“Home care facility means a conventional residence in which up to three unrelated
individuals are cared for, but without provision for routine nursing or medical care.”
Family Day Care waivers are addressed in Lee County Land Development Code Section
34-206. Day care, adult is defined in LDC 34-02 as follows:
“(Day care center, adult) means a facility or establishment that provides basic services
such as, but not limited to, a protective setting, social or leisure time activities, self-care
training or nutritional services to three or more adults not related by blood or marriage to
the owner or operator, who require services. This definition will not be interpreted to
include overnight care.”
Property Development Regulations: Lot size requirements
The minimum single-family lot size in a conventional Lee County zoning district is 6,000
square feet for new developments. Lot size varies with each zoning district. Lot size can be
modified as part of a planned development rezoning providing the request is consistent
with the Lee Plan density regulations. The planned development process can also be used
to accommodate “tiny home pocket” communities.
Density. The Lee Plan sets forth the allowable residential densities based on infrastructure
and service availability associated with urban, suburban and rural areas of the county.
o More residential density is allowed in the urban areas where infrastructure and
services exist.
o Affluent households are typically less dependent on public transportation and
have personal vehicles to access services further from where they live.
Indicative of the development that occurred in the 1980’s and 90’s, many of
the golf course residential communities in the suburban areas are gated and
miles away from public transit and other services.
o In order to promote the integration of economic groups, Lee County, through
the Lee Plan, allows additional density for developments containing affordable
housing units. This is called the Bonus Density Program and pertains to urban
properties. Additional density is allowed on the urban lands to accommodate
the development of affordable housing.
o Accessory apartments are permitted. They are considered affordable housing
and qualify for additional density through the Bonus Density Program.
o Developments containing a mixture of uses and clustering are promoted
through the planned development zoning districts. This allows for single-
family and multi-family units within a development, with commercial uses
nearby.
Two areas that would support the availability of fair housing include expanding
educational programs and addressing the unintended consequence of voucher programs
that result in concentrated housing.
Education. Homebuyer education programs are provided through Lee County to provide
one-on-one training for homebuyers. This program could be expanded to include more
information about Fair Housing to advise agencies and clients that they are allowed to
purchase a house anywhere within the county. This could be accomplished through a
social media campaign to better inform the public, agencies and end-users.
Shortage of Rental Units. Many economically-challenged minorities depend on Section 8
and other housing voucher programs for rental assistance, however, the rental units that
accept these vouchers are concentrated to specific areas within the county. It has been
identified that renters receiving government assistance are not always welcome in all rental
projects or rental homes. This concentration can mean that workers need to travel longer to
get to their place of employment which increases the need for transportation services and
infrastructure. It also lowers the workers’ quality of life requiring them to spend more time
away from their families and community. Again, a social media campaign may help
alleviate the public’s fears and emphasize the importance of providing a mix of housing
types to accommodate different economic groups within all areas of the community.
2. Additional Information
a. Beyond the HUD-provided data, provide additional relevant information, if any,
about segregation in the jurisdiction and region affecting groups with other
protected characteristics.

b. The program participant may also describe other information relevant to its
assessment of segregation, including activities such as place-based investments
and geographic mobility options for protected class groups.
Lee County, through the State Housing Initiative Partnership Program (SHIP), awards nonprofit
organizations grants that provide housing for very low, low, and moderate income families. The
nonprofit organizations select parcels throughout Lee County for the construction of affordable
housing units. The SHIP program monitors the grant expenditures and verifies that the units remain
affordable for 15 years.
In addition, the Affordable Housing Incentive Plan is adopted into the Local Housing Assistance
Plan and evaluated every three years. The incentives encourage the development of affordable
housing throughout Lee County include:
1. Expedited Review. The Planning Section of the Lee County Department of Community
Development provides technical assistance to developers of Affordable Housing
Developments (AHDs). Developers of AHDs in unincorporated Lee County may apply
to the Lee County Planning Section for a Certificate of Housing Affordability (CHA)
that will entitle AHDs to receive expedited permit processing. A copy of the CHA will
be attached to each county permit for which the AHD developer is applying. A copy of
the CHA is also entered into the Lee County’s permit tracking software. This assures
that the AHD will be expedited to a greater degree than other projects.
2. Impact Fee Reimbursement Program. The Lee County BoCC and the School District
established a program that reimburses up to half (50%) of the amount paid for school
impact fees for new construction of single-family or multi-family homes to be occupied
by income eligible households.
3. Bonus Density. The Lee County Land Development Code provides increased densities
for housing that is affordable for very-low, low, moderate, and workforce-income
families. The program provides both a construction option (affordable units must be
constructed) and cash option (market priced units may be constructed in exchange for a
cash contribution to the Affordable Housing Trust Fund).
4. Transfer of Development Rights. The Lee County Land Development Code allows for
the transfer or sale of development rights from environmentally sensitive areas. This
provision may be used for affordable housing purposes if the proposal is consistent with
the Comprehensive Plan.
5. Infrastructure. There are currently no restrictions on the availability of infrastructure
capacity. Therefore, the reservation of capacity for very-low, low, and moderate income
households is not necessary.
6. Accessory Apartments. The Lee County Land Development Code allows accessory
apartments by right in certain areas. The purpose is to facilitate the provision of
affordable housing, to strengthen the family unit or to provide increased opportunities
for housing the elderly and persons with special needs.
7. Parking & Setback Relief: The Land Development Code provides several avenues for
relief in parking and setbacks. First through the Planned Development rezoning process
an applicant can design their own property development regulations for lot configuration
and setbacks and seek deviations in roadway designs and parking. Variances are
available for conventional zoning districts. Both processes are "fast tracked" for
affordable housing under the expedited review process.
8. Flexible Lot Configurations: The Land Development Code provides several avenues
for the allowance of flexible lot configurations, including zero-lot-line configurations.
First through the Planned Development re-zoning process an applicant can design their
own property development regulations for lot configuration and setbacks and seek
deviations in roadway designs and parking. Variances are available for conventional
zoning districts. Both processes are "fast tracked" for affordable housing.
9. Street Requirements Relief. The Land Development Code provides several avenues
for the modification of street requirements. First through the Planned Development re-
zoning process an applicant can design their own property development regulations for
lot configuration and setbacks and seek deviations in roadway designs and parking.
Variances are available for conventional zoning districts. Both processes are "fast
tracked" for affordable housing.
10. Regulatory Oversight. Lee County has created an Executive Regulatory Oversight
Committee whose responsibility is to review and consider the impact to the cost of
development attributable to regulatory changes under consideration.
11. County Owned Surplus Lands. The Division of County Lands was created in January
1987. The Division reviews County owned surplus real estate for possible disposal,
either by donation or sale of governmentally owned real estate. The Division of County
Lands regularly makes available its inventory of public lands for evaluation by
government agencies and non-profit and for-profit affordable housing providers for the
construction and development of affordable housing.
12. Support for Development near Transportation Hubs, employment centers and Mixed
Use development. Contiguous and compact growth patterns are promoted through the
rezoning process to contain urban sprawl, minimize energy costs, conserve land, water,
and natural resources, minimize the cost of services, prevent development patterns where
large tracts of land are by-passed in favor of development more distant from services
and existing communities. The Lee County SHIP application promotes locating units
near transportation. The point ranking system awards a point for projects in close
proximity to transit.
13. Multi-Modal Transportation. Lee County’s Land Development Code (LDC) has been
amended to include: Multimodal Transportation Districts i.e. areas designated under the
Lee Plan where community design features reduce the use of private vehicles and
support an integrated multimodal transportation system. These districts are designated
in accordance with FS 163.3180(15). To date no district has been identified but staff is
evaluating designating SR 82 as a Multimodal Transportation District.
VI. Contributing Factors of Segregation
Consider the listed factors and any other factors affecting the jurisdiction and region. Identify
factors that significantly create, contribute to, perpetuate, or increase the severity of
segregation.
Community Opposition
Displacement of residents due to economic pressures
Rising rents and home prices throughout the region have contributed to minorities being
segregated into specific areas. High housing costs have made affordable housing
unavailable to low and even mid-wage workers in some of the more diverse areas in the
region.
Lack of community revitalization strategies
Lack of private investments in specific neighborhoods
Lack of public investments in specific neighborhoods, including services or amenities
Lack of regional cooperation
Land use and zoning laws
Lending Discrimination
Location and type of affordable housing
Large areas of segregation coincide with the locations of publicly supported housing and
affordable housing units. The areas identified on the HUD provided maps as R/ECAPS are areas
where large numbers of affordable and publically supported housing units are located. – ENTER
% of minorities living in Public Housing
Occupancy codes and restrictions
Private discrimination
Other
ii. R/ECAPs
1.Analysis
a. Identify any R/ECAPs or groupings of R/ECAP tracts within the jurisdiction.
As per 24 C.F.R. § 5.152 a racially or ethnically concentrated area of poverty, also referred to
as a R/ECAP, is a geographic area with significant concentrations of poverty and minority
populations. These areas are determined based on census data, and identified in the HUD
provided maps.
There are four R/ECAPs identified with in the region, three lie mostly within the jurisdiction
of the City of Fort Myers, the fourth lies in the south western portion of Lehigh Acres. The
southernmost R/ECAP, near Dunbar, features concentrated areas of Black, Non-Hispanic
persons of mostly Haitian descent. Of the total population in this area, 7% are persons with
limited English proficiency, who speak Spanish. Another 8% are persons with limited English
proficiency, who speak Fresh Creole.
The high concentration of Black, Non-Hispanic populations continues north into another
identified R/ECAP near Sabal Palms and the Bardens Subdivision. This area, however, has
very few persons who are of Haitian descent. HUD Map 3 does not indicate the national origin
of persons in this area. The eastern border of the Sabal Palm R/ECAP aligns with the third
R/ECAP near Poinsettia Park and Billy Creek. Of the total population in the Sabal Palm
R/ECAP, 3% are persons with limited English proficiency, who speak Spanish.
The Billy Creek R/ECAP features a large population of White, Non-Hispanic and Hispanic
persons. The concentration of Hispanic persons is higher in the eastern portions of the area,
and there is a higher concentration of White, Non-Hispanic persons in the western portion of
the area near Whitehead Creek. Of the Hispanic persons within the R/ECAP, 72% are of

Mexican of descent and 25% are of Guatemalan descent. Of the total population within the
area, 22.58% are persons with limited English proficiency, who speak Fresh Creole.
The fourth R/ECAP is located entirely in the Lee County jurisdiction, near the Westminister
Gold community. The Westminister R/ECAP is fairly integrated with large representations of
Black, Non-Hispanic, White, Non-Hispanic, and Hispanic populations. Just as this area is
fairly racially integrated, the national origins of persons living in this R/ECAP are fairly
diverse. Populations from Mexico make up more than 40% of the whole; those from Cuba
compose an additional 29% of the area’s population. Persons from Haiti and Guatemala make
up the remaining 31%. Of the total population in this area, 34% are persons with limited
English proficiency, who speak Spanish. Another 8% are persons with limited English
proficiency, who speak Fresh Creole and another .33% who speak Portuguese.
b. Which protected classes disproportionately reside in R/ECAPs compared to
the jurisdiction and region?
Of the total population of the Cape Coral – Fort Myers Region more than 2%, or 13,966 reside in
R/ECAPs. Of those 13, 966 persons, nearly 50% are Black, Non-Hispanic, and more than 25% are
Hispanic. Additionally, there are a total of 3,054 families living in a R/ECAP, nearly 50% of whom
have children under the age of 18. Persons with national origins lying in Haiti, Guatemala, and
Mexico make up nearly 15% of populations living in R/ECAPS. Local Maps 23 and 25 also
indicate a high number of minority concentrations in all of the identified R/ECAPs, with greater
than 60% minorities represented in most areas. The greatest concentration of households with
children among the R/ECAPs lies within the Westminister R/ECAP, as indicated in Local Map 21,
which is more than 50% populated with families with children. Regionally minorities, specifically
Black, Non-Hispanic families with children, are disproportionally represented within R/ECAPs.
Within the Lee County Jurisdiction the trends in minority representation vary slightly, as compared
to the overall region. White, Non Hispanic and Black, Non Hispanic persons represent 556 of the
717 persons residing within the identified R/ECAPs. Being of an equal 38.77% each, there is not
disproportionate representation of either race within the R/ECAPs. The remaining population is
composed of nearly 18% Hispanic persons and small numbers of Asian or Pacific Islander, Non-
Hispanic, Native American, Non-Hispanic, and other populations. Similarly to the regional trend
however, the jurisdictional R/ECAPs are made up of more than 43% families with children. Also
like the region, the majority of the population within the R/ECAPs is of Haitian, Guatemalan, or
Mexican national origin. Within the jurisdiction, only families with children appear to be
disproportionally represented within R/ECAPs.
**Note that the percentages reflect the proportion of the total population living in R/ECAPs that
has a protected characteristic, not the proportion of individuals with a particular protected
characteristic living in R/ECAPs.
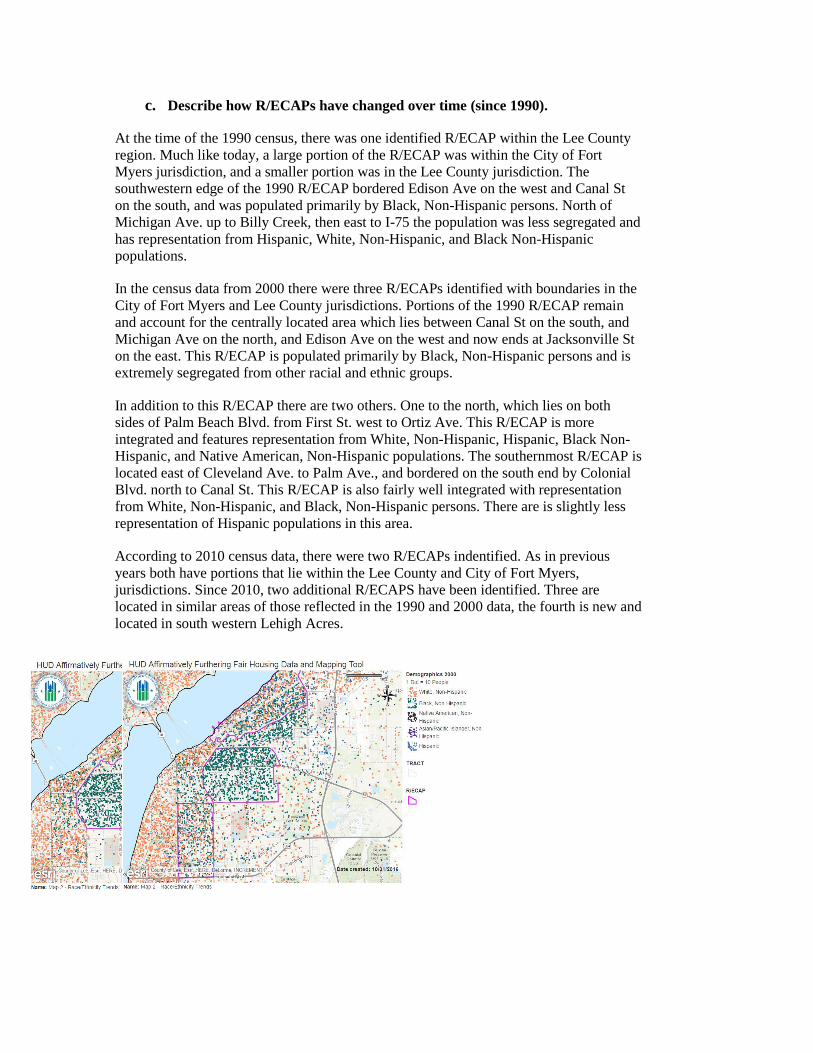
c. Describe how R/ECAPs have changed over time (since 1990).
At the time of the 1990 census, there was one identified R/ECAP within the Lee County
region. Much like today, a large portion of the R/ECAP was within the City of Fort
Myers jurisdiction, and a smaller portion was in the Lee County jurisdiction. The
southwestern edge of the 1990 R/ECAP bordered Edison Ave on the west and Canal St
on the south, and was populated primarily by Black, Non-Hispanic persons. North of
Michigan Ave. up to Billy Creek, then east to I-75 the population was less segregated and
has representation from Hispanic, White, Non-Hispanic, and Black Non-Hispanic
populations.
In the census data from 2000 there were three R/ECAPs identified with boundaries in the
City of Fort Myers and Lee County jurisdictions. Portions of the 1990 R/ECAP remain
and account for the centrally located area which lies between Canal St on the south, and
Michigan Ave on the north, and Edison Ave on the west and now ends at Jacksonville St
on the east. This R/ECAP is populated primarily by Black, Non-Hispanic persons and is
extremely segregated from other racial and ethnic groups.
In addition to this R/ECAP there are two others. One to the north, which lies on both
sides of Palm Beach Blvd. from First St. west to Ortiz Ave. This R/ECAP is more
integrated and features representation from White, Non-Hispanic, Hispanic, Black Non-
Hispanic, and Native American, Non-Hispanic populations. The southernmost R/ECAP is
located east of Cleveland Ave. to Palm Ave., and bordered on the south end by Colonial
Blvd. north to Canal St. This R/ECAP is also fairly well integrated with representation
from White, Non-Hispanic, and Black, Non-Hispanic persons. There are is slightly less
representation of Hispanic populations in this area.
According to 2010 census data, there were two R/ECAPs indentified. As in previous
years both have portions that lie within the Lee County and City of Fort Myers,
jurisdictions. Since 2010, two additional R/ECAPS have been identified. Three are
located in similar areas of those reflected in the 1990 and 2000 data, the fourth is new and
located in south western Lehigh Acres.

2. Additional Information
a. Beyond the HUD-provided data, provide additional relevant information, if
any, about R/ECAPs in the jurisdiction and region affecting groups with
other protected characteristics.
Local Table 4 provides additional demographic data for the four identified
R/ECAPs within the region. The Sabal Palm R/ECAP features the largest portion
of minority population with more than 90% of the residents being minority.
Additionally, the residents within the Sabal Palm and Dunbar R/ECAPs are more
than 36% families with children. Local data supports the HUD provided data,
which indicates that minorities and families with children are disproportionally
represented within the identified R/ECAPs.
In addition to local demographic data, local land use data was evaluated to
identify possible contributing factors of the R/ECAPs. The majority of the lots
within the Billy Creek R/ECAP are industrial, commercial, or open space, which
could be a contributing factor to the high minority concentrations in this area.
Conversely, the large majority of lots within the Westminister R/ECAP are used
for residences, with the exception of one larger commercial space and two
smaller institutional spaces.
Persons with disabilities are fairly integrated throughout the region and all
jurisdictions, and therefore are not disproportionately represented in any of the
R/ECAPs.
b. The program participant may also describe other information relevant to
its assessment of R/ECAPs, including activities such as place-based
investments and mobility options for protected class groups.
Local Map 12 provides data regarding the location of publically supported
housing in relationship to areas of minority concentration. As viewed on the
map a significant portion of the publically supported housing units are located
within the previously identified R/ECAPs. This trend is both a contributing
factor to the R/ECAPs and an investment aiming to increase the self-sufficiency
of protected classes in these areas. The location of public housing in
concentrated areas of the region promotes high concentrations of low income
persons.
Conversely, the provision of housing support for low income families is
intended to create an environment fostered toward assisting families in
becoming economically self-sufficient. The Housing Authority of the City of
Fort Myers encourages residents to become homeowners, and supports
resident's transition to independence with the Housing Choice (Section 8)
Voucher Home ownership Program. Lee County and the City of Fort Myers also
promote homeownership and mobility through the provision of Down Payment
Assistance programs for low-income homebuyers in Lee County.

3. Contributing Factors of R/ECAPs
Consider the listed factors and any other factors affecting the jurisdiction and region.
Identify factors that significantly create, contribute to, perpetuate, or increase the
severity of R/ECAPs.
Community Opposition
Deteriorated and abandoned properties
Displacement of residents due to economic pressures
Lack of community revitalization strategies
Lack of private investments in specific neighborhoods
Lack of public investments in specific neighborhoods, including services or amenities
Lack of regional cooperation
Land use and zoning laws
Location and type of affordable housing
Occupancy codes and restrictions
Private discrimination
Other

iii. Disparities in Access to Opportunity
1. Analysis
HUD Table 12 provides data on opportunity indicators by race and ethnicity. The index measures
poverty, school proficiency, labor market, transit, transportation cost, job proximity and
environmental health in a geographic area. A higher score on each of the indices indicates: lower
neighborhood poverty rates; higher levels of school proficiency; higher levels of labor engagement;
closer proximity to jobs; lower transportation costs; closer access to public transportation; and
greater neighborhood environmental quality.
Jurisdictionally, Lee County features low opportunity indicators for both the total population and
the population below the federal poverty line. The average of all indices for the total population in
the Lee County jurisdiction is 42.56, as compared to the average of all indices for the population
below the poverty line, which is 41.6. The access to opportunity index takes into consideration
various “’stressors’ and ‘assets’ in every neighborhood.” (HUD AFFHT Data Documentation)
The lowest indices are found in the measurement of transportation costs. Among the total
population, every race and ethnicity has a transportation cost index below 30, indicating that
transportation costs are high throughout the jurisdiction. For populations below the poverty line,
the greatest transportation costs are found among persons who are White/Non-Hispanic,
Black/Non-Hispanic, and Asian or Pacific Islander/Non-Hispanic.
As previously mentioned the provision of public transit continues to be lacking throughout Lee
County. The opportunity index is reflective of this shortfall, and indicates that Black/Non-Hispanic
and Hispanic populations experience the most disparity in access to public transportation.
Another indicator that is well below average is the poverty index for Black/Non-Hispanic and
Hispanic persons that are below the federal poverty line. Indices at 28.64 (Black/Non-Hispanic)
and 27.95 (Hispanic) illustrate that these populations experience high poverty rates as compared to
other residents of varying race and ethnicity.
Other disparities in access to opportunity are indicated by the index for labor markets.
Jurisdictionally, Black/Non-Hispanic populations have the lowest index for access to labor
markets. A similar trend is true for the portion of the population below the federal poverty level.
Black/Non-Hispanic and Hispanic populations in that subgroup have labor market indices of 20.32
and 29.94, respectively, which is far below the average for all races.
Regionally the indicators demonstrate similar trends. The lowest indices are found in transportation
costs, transit availability, labor market access, and poverty rates. Again, the average opportunity
indicators for the total population and the population below the federal poverty line are fairly low.
The average of all indices for the total population in the Lee County Region is 42.81, as compared
to the average of all indices for the population below the poverty line, which is 41.88. Among the
total population the lowest indices are in found in the transportation cost measure with most indices
near 30. Like in the jurisdictional measures, the lowest poverty and labor market indicators belong
to Black/Non-Hispanic and Hispanic populations, indicating that those groups have the highest
poverty levels and lowest access to labor markets.
28
a. Educational Opportunities - Table 12 and refer to Map 9
i. Describe any disparities in access to proficient schools based on race/ethnicity, national
origin, and family status.
The HUD provided school proficiency index, Table 12, indicates a fairly equal average access to
adequate schools by all races and ethnicities both above and below the federal poverty line. The
average index for all persons is 47.75 and 44.72 for persons below the federal poverty line,
indicating that being below the poverty line has only a minor impact on access to proficient schools
in the region.
Those racial and ethnic groups with the lowest indices, and therefore the lowest access to proficient
schools, are Black, Non-Hispanic and Hispanic persons below the federal poverty line. With indices
of 39.91 and 41.47 respectively, these groups experience slightly less access to proficient schools
than their White, Non-Hispanic counterparts, who also fall below the federal poverty line. Similar
disparity is applicable across the total jurisdiction population, with Black, Non-Hispanic, and
Hispanic populations having the lowest access to proficient schools overall.
Regionally similar trends can be identified. Among the total population of the region, Black, Non-
Hispanic and Hispanic have the lowest indices, indicating they have less access to proficient schools
that other racial and ethnic groups. Even greater regional disparities can be indentified for Black,
Non-Hispanic and Hispanic populations that live below the poverty line. The average index for
those populations is nearly 5 points less than the average index for the total population. Again,
Black, Non-Hispanic and Hispanic populations throughout the region, experience the greatest
disparity in access to proficient schools among all racial and ethnic groups below the federal poverty
line.
ii. Describe the relationship between the residency patterns of racial/ethnic, national origin,
and family status groups and their proximity to proficient schools.
HUD Map 7 indicates that the lowest school proficiency levels are near three of the identified
R/ECAP’s. Large portions of the Dunbar, Sabal Plam, and Billy Creek R/ECAPs have a school
proficiency index between 0 and 10, the lowest possible. The racial and ethnic concentrations in this
area are of primarily Black, Non-Hispanic, and Hispanic populations. The national origins
represented in this area are primarily Mexican and Guatemalan. There is also a high concentration of
Haitian persons in the Dunbar, Billy Creek, and Sabal Palm R/ECAPs, along Martin Luther King Jr
Blvd and Cleveland Ave. The relationship of low school proficiency indices to high concentrations
of Black, Non-Hispanic and Hispanic persons of Mexican, Guatemalan, or Haitian descent indicates
that these populations have less access to proficient schools than persons of any other race, ethnicity,
or national origin, living in other portions of the region.
Local data, in agreement with HUD provided data, indicates that areas with high minority
concentrations feature the lowest graded schools. Local Map 3 shows that there are two “F” rated
schools within the region; both are located near the indentified R/ECAPs. The six “D” rated are also
found in or near areas of highly concentrated minority areas and other identified R/ECAPs.

Families with children are distributed reasonably evenly throughout the most populated areas of Lee
County. Comparatively, there are fewer families that reside within areas where the school
proficiency index is less than 10. The residency patterns of families with children does not appear to
be affected by the locations of proficient schools.
iii. Describe how school-related policies, such as school enrollment policies, affect a student’s
ability to attend a proficient school. Which protected class groups are least successful in
accessing proficient schools?
The Lee County School District (LCSD) features an open-enrollment system in which allows
parents to rank various schools near their residence. This process prevents children for mandatorily
attending a school that is low scoring or not within their chosen area of concentration. The various
school zones and school options can be seen in Local Map 4. The LCSD has outlined their Plan for
Student Assignment which includes efforts to improve student achievement, equity, diversity, and
growth.
The LCSD has several policies and programs to ensure that each student in a protected class group
has access to proficient schools. To provide for those students and schools in areas of high poverty
the LCSD operates Title I schools, which provide additional educational and supportive services for
students and parents. According to the LCSD 2014/2015 Annual Report the 121 schools in the
district were attended by 42.6% White, 35.9% Hispanic, 14.6% Black, 4.9% Multi-Racial and less
than 2% Asian and American Indian/Pacific Islander students. Additionally, the district reported that
34,833 of the 89,345 students attending, were from homes where English is not the primary spoken
language. This 38.98% of the student population represents 159 countries and speaks approximately
124 different languages. To provide for those students who are limited in English proficiency, the
LCSD has implemented the English for Speakers of Other Language, E.S.O.L. program which is
provided at all schools to aid students in becoming English proficient. The LCSD also operates the
Lee Adolescent Mother Program (LAMP) for students who are parents themselves. LAMP provides
child care allowing student mothers to remain in school until graduation.

The Plan for Student Assignment can be viewed here: http://www.leeschools.net/student-assignment.
The LSCD Annual Report can be viewed here: http://www.leeschools.net/reports-publications
b. Employment Opportunities
i. Describe any disparities in access to jobs and labor markets by protected class
groups.
HUD Table 12 provides data on opportunity indicators by race and ethnicity. The index measures
labor market and job proximity in the region and in each jurisdiction. A higher score on each of the
indices indicates higher levels of labor engagement and closer proximity to jobs. The labor market
and job proximity indices indicate a fairly equal average of job proximity for all races and
ethnicities both above and below the federal poverty line. The average index for all persons is 43.2
and 42.8 for persons below the federal poverty line.
The index evaluating access and engagement in the labor market is lower throughout the jurisdiction
for populations above the poverty line and higher for those below the poverty line. This indicates
that all races and ethnicities living above the poverty line are less engaged in the labor market than
those who are living below the poverty line. These indices are indicative of our region’s unique
culture which features a large population of retired and seasonal individuals who no longer need to
access the labor market, and a large number of working poor who fill low skill, low wage hospitality
and retail positions. Charts 6 and 7 make a comparison of employment industries and wages paid
throughout the Southwest Florida region.
The Southwest Florida Regional Economic Indicators report published monthly by Regional
Economic Research Institute at the Lutgert College of Business indicates that the Lee County
unemployment rate was just over 4% in January of 2016. Since 2009 the gap between the labor
force and those who are unemployed has been slowly growing smaller.
Lee County Labor Force and Unemployment
Source: Florida Department of Economic Opportunity and seasonal adjustment by RERI
http://www.fgcu.edu/cob/reri/indicators/indicators201611.pdf
ii. How does a person’s place of residence affect their ability to obtain a job?
As indicated by Local Map 7, those persons who live in the outer areas of the county experience
higher unemployment rates than those that reside closer to business centers. There are three areas
in eastern Lehigh Acres which have an unemployment rate of greater than 40%. This high rate
could be attributed to job proximity. These areas are approximately 15 to 20 miles from downtown
Fort Myers, and not located near any major retail facilities that would provide employment
opportunities. Two other areas located in North Fort Myers with greater than 40% unemployment
are comprised of the Jones Mobile Trailer Park, the Southern Villas mobile home park, the Rivers
Edge mobile home park, and several scattered single family homes. These areas a located in close
proximity with many retail complexes, but the area has experienced a long history of economic
decline, which may attribute to the low employment rates.
Another area with an unemployment rate of 40% or more lies north of Palm Beach Blvd. between
I-75 and Highway 31. This area has one residential complex, the Orange Harbor Mobile Home and
RV Resort, which is an over 55 community. The average median age in this area is 66.5 years or
above. Because of the age of the population located in this area it is possible that many individuals
are no longer seeking employment and therefore should not be considered when examining access
to the labor market and employment opportunities.
iii. Which racial/ethnic, national origin, or family status groups are least
successful in accessing employment?
Black, Non-Hispanic and Hispanic populations, both above and below the poverty line, have lower
access to the labor market and farther to travel to reach jobs than other populations. Regionally
similar trends can be identified.
Need demographics of persons that are employed, unemployed and underemployed in
Lee County
c. Transportation Opportunities = COMPLETED BY LEE TRAN TEAL AREAS
ARE COMPLETE
i. Describe any disparities in access to transportation based on place of residence,
cost, or other transportation related factors.
HUD Table 12 provides information regarding transportation costs and the use of public transit for
various races and ethnicities. The Low Transportation Cost Index measures cost of transport and
proximity to public transportation by neighborhood. The Transit Trips Index measures how often
low-income families in a neighborhood use public transportation. A higher score on each of the
indices would indicate lower transportation costs and closer access to public transportation.
As previously mentioned, public transportation indices are low throughout the region and the
jurisdiction. The average transit index for all populations both above and below the poverty line is
30.9, indicating that there is low utilization of public transportation throughout the County. The
transportation cost index also presents a bleak picture. With an average index of less than 30 for all
populations, transportation costs throughout the County are high. Additionally the low indices
indicate that most populations have to travel long distances to reach public transit stops.
Local Map 9 displays the LeeTran system routes in areas of low access to opportunity. The map
indicates only one route traveling to the northeastern region of the county via Palm Beach Blvd.,
and only one route serving Lehigh Acres via Lee Blvd. These areas consist of high minority
concentrations and are designed mainly for transportation via personal vehicle, yet, as indicated in
Local Map 8, there are several smaller areas within these two regions where more than 35% of the
households do not own a personal vehicle.
ii. Which racial/ethnic, national origin or family status groups are most affected
by the lack of a reliable, affordable transportation connection between their
place of residence and opportunities?
HUD Map 11 indicates that areas with the highest transportation costs are also areas with high
concentrations of Black, Non-Hispanic, and Hispanic populations. In Lehigh Acres, the area north
of 82 and east of Gunnery Road features a transportation index ranging from 10.1-30 indicating
that transportation costs are fairly high. This area features populations of Mexican, Cuban, and
Haitian descent. There is a high concentration of families with children in this area, with several
blocks being made of more than 60% families. Populations in this area are less likely to be able to
access opportunities due to high transportation costs and low access to public transit.
The Buckingham area, regions of North Fort Myers on Nalle Grade Rd, and far eastern Lee County
along 82 are all areas of very high transportation costs, with indices ranging from 0-20. These areas
feature primarily White, Non-Hispanic populations, and, as demonstrated by Local Map 8, more
than 95% of these households own a personal vehicle. These areas feature limited amounts of
Cuban and Haitian populations, and only a few blocks have concentrations of families with
children greater than 60%. These areas are located on the far north and east borders of the County.
Because of the distance between these areas and the central business districts, residents in these
areas may have less access to opportunity and higher transportation costs.
Some areas of southern Lee County near the Collier County border, as well as portions of Sanibel
and Pine Island also have higher transportation costs and low public transportation utilizations.
LeeTran has a bus route with limited service days on Pine Island, which holds a large concentration
of White, Non-Hispanic low income persons. There are very few families with children on both
Pine Island and Sanibel. Sanibel Island does not have any public transportation options.
Populations living on the barrier islands, with the exception of Fort Myers Beach, have little access
to public transportation and have high transportation costs. Because living expenses in these areas
are higher than other areas of the county, residents often have higher incomes and do not have a
need for public transit.
iii. Describe how the jurisdiction’s and region’s policies, such as public
transportation routes or transportation systems designed for use personal
vehicles, affect the ability of protected class groups to access transportation.
Lee County’s infrastructure is primarily designed for use of personal vehicles. Since 1990 the
permanent resident population has more than doubled. In addition to the permanent growth, Lee
County’s seasonal tourism industry temporarily increases the population by more than 100,000
from November through May. The public transportation system and the road infrastructure have
struggled to develop as quickly the population. Use of personal vehicles to travel can be time
consuming and increased traffic accidents can be costly for low income individuals and families.
Low frequency public transit routes and high costs make it difficult for low income residents from
all protected classes to access efficient transportation.
In an effort to improve the public transportation system for persons within protect classes, LeeTran
has developed and implemented the Title VI Program “to ensure that transit services in Lee County
are made available, are equitably distributed, and provide equal access and mobility to any person
without regard to race, color, or national origin.” (LeeTran 2015) LeeTran works in coordination
with the Lee County Metropolitan Planning Organization to ensure “that no person shall on the
basis of race, color, national origin, sex, age, disability, family or religious status, as provided by
Title VI of the Civil Rights Act of 1964, the Civil Rights Restoration Act of 1987 and the Florida
Civil Rights Act of 1992 be excluded from participation in, be denied the benefits of, or be
otherwise subjected to discrimination or retaliation under any program or activity.” (Lee County
Metropolitan Planning Organization 2016) As part of the Title VI Plan, LeeTran has analyzed the
availability of transit routes for persons with limited English proficiency, persons with disabilities,
minorities, and low income populations. These map analyses and the entire Title VI Plan can be
viewed here: http://www.leegov.com/leetran/Documents/FY2015-
2017%20Title%20VI%20Program.pdf. To ensure compliance with Title VI and access for all
persons to the public transportation system Lee Tran regularly monitors services, conducts route
samples, and thoroughly processes consumer complaints.
LeeTran. (2015). 2015-2017 Title VI Program Update. Retrieved from
http://www.leegov.com/leetran/Documents/FY2015-2017%20Title%20VI%20Program.pdf
Lee County Metropolitan Planning Organization. (2016). Title VI/Civil Rights. Retrieved from
http://leempo.com/public-involvement/title-vicivil-rights/
d. Low Poverty Exposure Opportunities
i. Describe any disparities in exposure to poverty by protected class groups.
There are several areas within the region, where there are high concentrations of poverty. Many of
these areas lie within the jurisdiction of the City of Fort Myers. Still others lie in the Lee County
jurisdiction, within Lehigh Acres. These areas consist of high concentrations of minorities and
households with children.
As shown in Table 2, resident of African American, American Indian, or Alaskan Native races in
Lee County experienced poverty at a greater rate than White residents. More than 12 percent of
White residents were living in poverty in 2015, compared with 30.1 percent of Blacks and 28.1
percent of Hispanics. While Asians had the highest median household income, Asians still had a
poverty rate slightly less than the County average of 14.5 percent. This suggests there is a high
degree of income extremes amongst Lee County’s Asian population.” (Lee County Regional
Analysis of Impediments to Fair Housing Choice, 2015)
Median
Household
Income
Less than 100% of
the Federal Poverty
Level
Lee County $55,755 14.70%
White $59,698 12.20%

Black/African
American $36,544 25.40%
American Indian and
Alaska Native $38,530 26.60%
Asian $77,368 12.00%
Native Hawaiian and
Other Pacific Islander $55,607 18.90%
ii. What role does a person’s place of residence play in their exposure to
poverty?
HUD Map 12 indicates that those persons who live in or near the previously identified R/ECAPs
have a higher exposure to poverty than those living outside of the R/ECAPs or the surrounding
areas. The poverty index in most of the previously identified R/ECAPs is less than 10, meaning
that residents in these areas experience high exposure to poverty. The Suncoast Estates, Pine
Manor, and Page Park neighborhoods also have a very low poverty indices (below 10), which
indicates that residents in these areas tend to experience higher poverty levels. The County has
identified these neighborhoods as Local Target Areas and continues to provide public services and
infrastructure improvements in these areas. Several other portions of the region indicate poverty
indices below 20, these areas a scattered throughout Lee County, the City of Cape Coral, and the
City of Fort Myers. Persons living in areas with lower poverty indices experience higher exposure
to poverty.
iii. Which racial/ethnic, national origin or family status groups are most affected
by these poverty indicators?
Black, Non-Hispanic and Hispanic populations have the highest exposure to poverty both
regionally and jurisdictionally as indicated by HUD Table 12. The areas of highest expose to
poverty are within and surrounding the previously identified R/ECAPs. These areas have a low
poverty index of less than ten, and feature high concentrations of Haitian, Cuban, and Guatemalan
populations. The households in these areas are also made of more than 60% of families with
children. Additional areas that have high exposure to poverty, with a low poverty index between 10
and 30, are far southeastern Lehigh Acres, areas of western Lehigh Acres near Buckingham, and
Bonita Springs nearest the southern Lee County border. All of these areas have a high
concentration of Hispanic populations, most of whom are of Mexican, Guatemalan, and Haitian
descent. Additionally, between 60% and 80% of the population in these areas are families with
children. These measures indicate that a large portion of the Black, Non-Hispanic and Hispanic
families with children in Lee County have a higher rate of exposure to poverty than do other
residents throughout the county. One exception to this generalization is the Suncoast Estates
neighborhood in North Fort Myers, which consists of primarily White, Non-Hispanic populations
and has a low poverty index of less than 20. Only a small portion of this area has a concentration
of families with children, and even fewer are of varying national origin.
Source: U.S. Census 2015 American Community Survey Table S1903 and S1703

iv. Describe how the jurisdiction’s and region’s policies affect the ability of protected
class groups to access low poverty areas.
Voucher Mobility?
Affordable Rental Availability?
Zoning that restricts the establishment of affordable housing
Sanibel Group home ordinance
e. Environmentally Healthy Neighborhood Opportunities
i. Describe any disparities in access to environmentally healthy neighborhoods
by protected class groups.
ii. Which racial/ethnic, national origin or family status groups have the least
access to environmentally healthy neighborhoods?
HUD Map 13 shows residency patterns of racial/ethnic and national origin groups and families
with children overlaid by shading showing the level of exposure to environmental health hazards
for Lee County.
HUD Map 13 indicates that most areas throughout the region have fairly high environmental health
indices, indicated that the level of exposure to environmental health hazard within Lee County is
fairly small. The areas with the lowest environmental health index, which indicates the least
environmentally healthy areas, are located in areas near the I-75 and Cleveland Ave corridors. The
lower indices in these areas could be attributed to air pollution caused by high volumes and traffic
and industry located on these major highways.
Because the region has fairly high environmental health indices, it is not believed that any
particular racial, ethnic, national origin, or family status groups have disproportionate access to
health neighborhoods.
The infant mortality rate (IMR) and disability adjusted life expectancy (DALE) are the primary
indicators of the overall health in any community. Infant mortality indicates the health of the
mothers and often leads to the identification health issues caused by economic insecurity, poor
living conditions, poor environmental quality, and illnesses associated with the prior. (Allotey
2003, p.344)
Allotey, P., Reidpath, D., (2003). Infant mortality rate as an indicator of population health. J Epidemio Community Health. 57. 344-
346. Retrieved from https://www.researchgate.net/publication/10800820_Infant_Mortality_Rate_as_an_Indicator_of_Population_Health
The Florida Health Department provides data on infant mortality, and as indicated in the Chart 14,
Black, Non-Hispanic persons residing in Lee County have higher instances of infant mortality rates
than White, Non-Hispanic residents. Similarly, Hispanic populations have experienced slightly
higher infant mortality rates than their White counter parts since 2004. As indicated in Charts 14
and 15 the infant mortality rates for Black, Non-Hispanic and Hispanic populations in Lee County
were slightly higher than the state-wide trend from 2013-2015. This could indicated that as the
minority populations increase, their opportunity to access environmentally safe neighborhoods is
decreasing.
As demonstrated by the infant mortality data and HUD Table 12, Black, Non-Hispanic and
Hispanic populations tend to have less access to environmentally healthy neighborhoods than
White, Non-Hispanic The environmental health index for Black, Non-Hispanic persons below the
poverty line is 39.46 in the Cape Coral-Fort Myers region. Those living above the poverty line
have an index of 42.57; more than 4 points lower than the index for other races and ethnicities.
These indices indicate that Black, Non-Hispanic populations throughout the region experience
higher environmental health risks that other races and ethnicities living in the region.
The Lee County development plan, also known as the Lee Plan, has made careful consideration of
the environmental factors that contribute to the health of Lee County residents. The plan outlines
land use and infrastructure design ideals which “protect its natural resource base in order to
maintain a high quality of life for its [Lee County’s] residents and visitors.” (Lee Plan, 2016)
In addition to addressing environmental concerns in the Lee Plan, the County ensures that all state
and federally funded projects comply with federal environmental standards. Lee County Human
and Veterans Services completes a comprehensive tiered environmental review in coordination
with the HUD Consolidated Plan, an annual environmental review in coordination with the Annual
Action Plan, and a project based review for all rehabilitation and new construction projects. Factors
evaluated in this review process include separation distance from hazardous facilities, acceptable
distance from railroads and major highways, and the location of flood hazard areas. This
multilayered review process ensures that projects being carried out by the country are
environmentally sound and benefit, rather than harm, Lee County residents and the environment as
a whole.
f. Patterns in Disparities in Access to Opportunity
i. Identify and discuss any overarching patterns of access to opportunity and exposure to
adverse community factors based on race/ethnicity, national origin or familial status.
Identify areas that experience an aggregate of poor access to opportunity and high exposure
to adverse factors. Include how these patterns compare to patterns of segregation and
R/ECAPs.
As per the HUD provided data evaluated above, there are several overarching patterns of access
opportunity and exposure to adverse community factors that can be identified. Generally, Black,
Non-Hispanic and Hispanic populations in Lee County have higher exposure to poverty, lower
access to opportunity, lower access to transportation, higher transportation costs, and lower access
to environmentally healthy neighborhoods. Haitian, Guatemalan, and Cuban households also have
higher exposure to poverty, lower access to opportunity, lower access to transportation, higher
transportation costs, and lower access to environmentally healthy neighborhoods. These patterns
are consistent with patterns of segregation and the identified R/ECAPs within the region. Those
populations which have the most adversity are located within or near the identified areas of
segregation and R/ECAPs.
Families with children are distributed reasonably evenly throughout the most populated areas of Lee
County, and have fairly equal access to low poverty and high environmental health. Other than
designated 55+ communities, there are no zoning restrictions which would prevent families with
children from residing in an area of the County. Families with children are not concentrated within
segregated areas or R/ECAPs and have fairly equal access to opportunities, transportation, adequate
schools, and other resources.
2. Additional Information
a. Beyond the HUD-provided data, provide additional relevant information, if any,
about disparities in access to opportunity in the jurisdiction and region affecting
groups with other protected characteristics.
b. The program participant may also describe other information relevant to its
assessment of disparities in access to opportunity, including any activities aimed at
improving access to opportunities for areas that may lack such access, or in
promoting access to opportunity (e.g., proficient schools, employment opportunities,
and transportation).
In an effort to increase access to opportunity in some of Lee County’s most vulnerable
neighborhoods, the County has designated five special areas of concentration for CDBG funds
to provide public service, code enforcement and infrastructure improvement services. Those
areas include Suncoast Estates and Palmona Park, located in the North Fort Myers area of the
County, Pine Manor and Page Park, located south of the City of Fort Myers in un-incorporated
Lee County, and Charleston Park, located in Alva on the Eastern edge of the County. Public
service projects in these areas include job readiness programs, occupational training programs,
food pantries, after school programs, community gardens, and more.

3. Contributing Factors of Disparities in Access to Opportunity
Consider the listed factors and any other factors affecting the jurisdiction and region.
Identify factors that significantly create, contribute to, perpetuate, or increase the
severity of disparities in access to opportunity.
Access to financial services
The availability, type, frequency, and reliability of public transportation
Lack of private investments in specific neighborhoods
Lack of public investments in specific neighborhoods, including services or amenities
Lack of regional cooperation
Land use and zoning laws
Lending Discrimination
Location of employers
Location of environmental health hazards
Location of proficient schools and school assignment policies
Location and type of affordable housing
Occupancy codes and restrictions
Private discrimination
Other
iv. Disproportionate Housing Needs
1. Analysis
a. Which groups (by race/ethnicity and family status) experience higher rates of housing cost
burden, overcrowding, or substandard housing when compared to other groups? Which
groups also experience higher rates of severe housing burdens when compared to other
groups?
HUD Table 9 shows the percentage of race/ethnicity groups and families with children
experiencing two potential categories of housing need.
The first category is households experiencing one of four housing problems:
1. Housing cost burden (defined as paying more than 30% of income for monthly housing
costs including utilities),
2. Overcrowding,
3. Lacking a complete kitchen, or
4. Lacking plumbing.
The second category is households experiencing “one of four severe housing problems” which
are:
1. Severe housing cost burden (defined as paying more than half of one’s income for monthly
housing costs including utilities),
2. Overcrowding, and
3. Lacking a complete kitchen, or
4. Lacking plumbing.
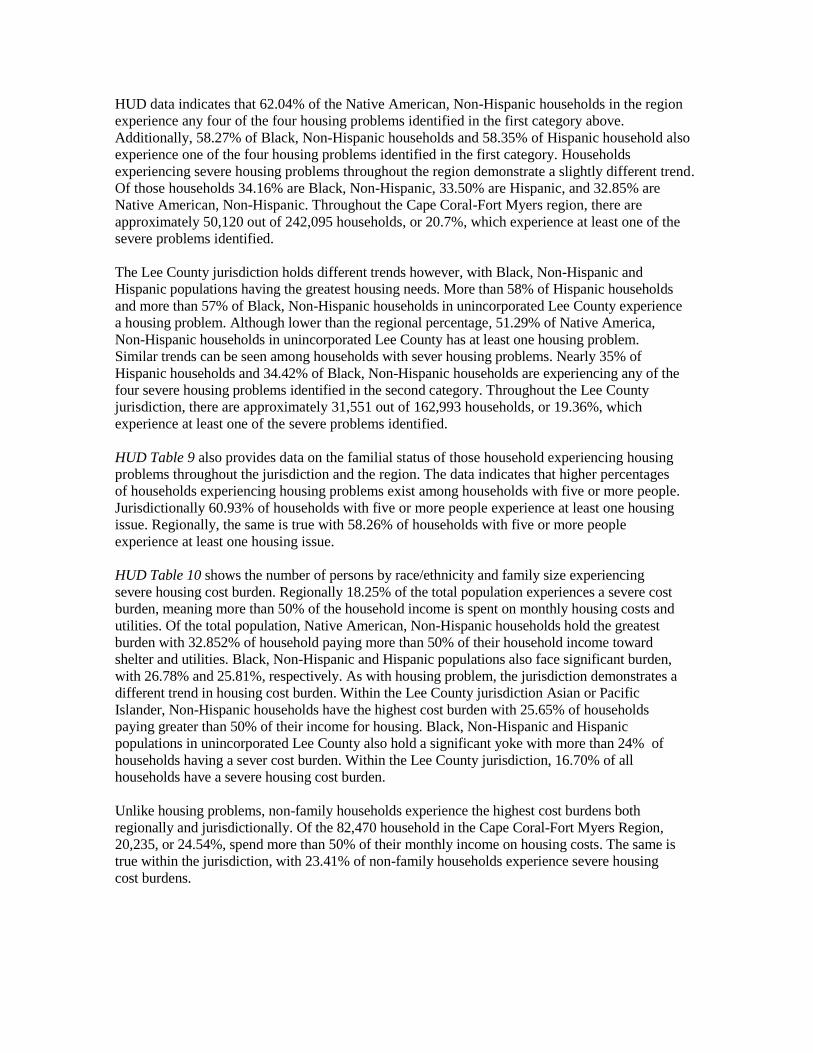
HUD data indicates that 62.04% of the Native American, Non-Hispanic households in the region
experience any four of the four housing problems identified in the first category above.
Additionally, 58.27% of Black, Non-Hispanic households and 58.35% of Hispanic household also
experience one of the four housing problems identified in the first category. Households
experiencing severe housing problems throughout the region demonstrate a slightly different trend.
Of those households 34.16% are Black, Non-Hispanic, 33.50% are Hispanic, and 32.85% are
Native American, Non-Hispanic. Throughout the Cape Coral-Fort Myers region, there are
approximately 50,120 out of 242,095 households, or 20.7%, which experience at least one of the
severe problems identified.
The Lee County jurisdiction holds different trends however, with Black, Non-Hispanic and
Hispanic populations having the greatest housing needs. More than 58% of Hispanic households
and more than 57% of Black, Non-Hispanic households in unincorporated Lee County experience
a housing problem. Although lower than the regional percentage, 51.29% of Native America,
Non-Hispanic households in unincorporated Lee County has at least one housing problem.
Similar trends can be seen among households with sever housing problems. Nearly 35% of
Hispanic households and 34.42% of Black, Non-Hispanic households are experiencing any of the
four severe housing problems identified in the second category. Throughout the Lee County
jurisdiction, there are approximately 31,551 out of 162,993 households, or 19.36%, which
experience at least one of the severe problems identified.
HUD Table 9 also provides data on the familial status of those household experiencing housing
problems throughout the jurisdiction and the region. The data indicates that higher percentages
of households experiencing housing problems exist among households with five or more people.
Jurisdictionally 60.93% of households with five or more people experience at least one housing
issue. Regionally, the same is true with 58.26% of households with five or more people
experience at least one housing issue.
HUD Table 10 shows the number of persons by race/ethnicity and family size experiencing
severe housing cost burden. Regionally 18.25% of the total population experiences a severe cost
burden, meaning more than 50% of the household income is spent on monthly housing costs and
utilities. Of the total population, Native American, Non-Hispanic households hold the greatest
burden with 32.852% of household paying more than 50% of their household income toward
shelter and utilities. Black, Non-Hispanic and Hispanic populations also face significant burden,
with 26.78% and 25.81%, respectively. As with housing problem, the jurisdiction demonstrates a
different trend in housing cost burden. Within the Lee County jurisdiction Asian or Pacific
Islander, Non-Hispanic households have the highest cost burden with 25.65% of households
paying greater than 50% of their income for housing. Black, Non-Hispanic and Hispanic
populations in unincorporated Lee County also hold a significant yoke with more than 24% of
households having a sever cost burden. Within the Lee County jurisdiction, 16.70% of all
households have a severe housing cost burden.
Unlike housing problems, non-family households experience the highest cost burdens both
regionally and jurisdictionally. Of the 82,470 household in the Cape Coral-Fort Myers Region,
20,235, or 24.54%, spend more than 50% of their monthly income on housing costs. The same is
true within the jurisdiction, with 23.41% of non-family households experience severe housing
cost burdens.

b. Which areas in the jurisdiction and region experience the greatest housing burdens?
Which of these areas align with segregated areas, integrated areas, or R/ECAPs and what
are the predominant race/ethnicity or national origin groups in such areas?
HUD Map 7 shows the residential living patterns for persons by race/ethnicity, overlaid by shading
indicating the percentage of households experiencing one or more housing problems. Darker
shading indicates a higher prevalence of such problems. HUD Map 8 shows the same information
overlaid on residential living patterns by national origin. As indicated by the maps below, there are
several areas throughout the county which have high concentrations of minority populations and a
high percent of households with housing problems.
The areas in and around the previously identified R/ECAPs have more than 53.43% of households
who are experiencing high housing costs or other housing problems. These areas have high
concentrations of Black, Non-Hispanic and Hispanic populations of Haitian, Mexican, or
Guatemalan descent. Other areas with slightly lower concentrations of high housing burden, 43.85
% to 53.43%, are found in Lehigh Acres, and a small area of Bonita Springs.
The Lehigh Acres R/ECAP is highly concentrated with scattered sight single family rentals and has
previously been identified as a slightly segregated area consisting of large proportions of Hispanic
households of Cuban, Mexican, and Guatemalan descent. Rents in this area were previously
determine to be mostly below 30% of the area median income leading to the hypothesis that
households in these areas experience housing problems other than high cost burden. Another area
in Lehigh Acres, located further south east on SR 82, east of Alabama Rd., is high concentrated
with Black, Non-Hispanic and Hispanic persons of Haitian or Cuban descent.
Family Size and Housing Problems Comparison
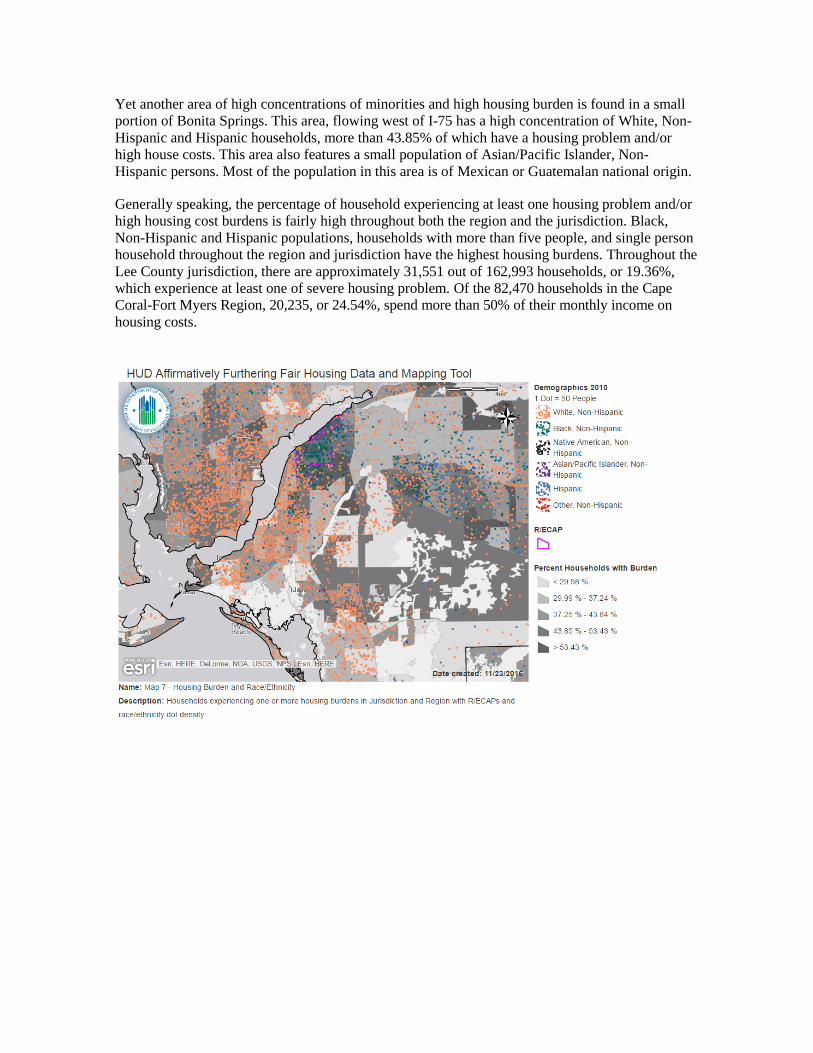
Yet another area of high concentrations of minorities and high housing burden is found in a small
portion of Bonita Springs. This area, flowing west of I-75 has a high concentration of White, Non-
Hispanic and Hispanic households, more than 43.85% of which have a housing problem and/or
high house costs. This area also features a small population of Asian/Pacific Islander, Non-
Hispanic persons. Most of the population in this area is of Mexican or Guatemalan national origin.
Generally speaking, the percentage of household experiencing at least one housing problem and/or
high housing cost burdens is fairly high throughout both the region and the jurisdiction. Black,
Non-Hispanic and Hispanic populations, households with more than five people, and single person
household throughout the region and jurisdiction have the highest housing burdens. Throughout the
Lee County jurisdiction, there are approximately 31,551 out of 162,993 households, or 19.36%,
which experience at least one of severe housing problem. Of the 82,470 households in the Cape
Coral-Fort Myers Region, 20,235, or 24.54%, spend more than 50% of their monthly income on
housing costs.
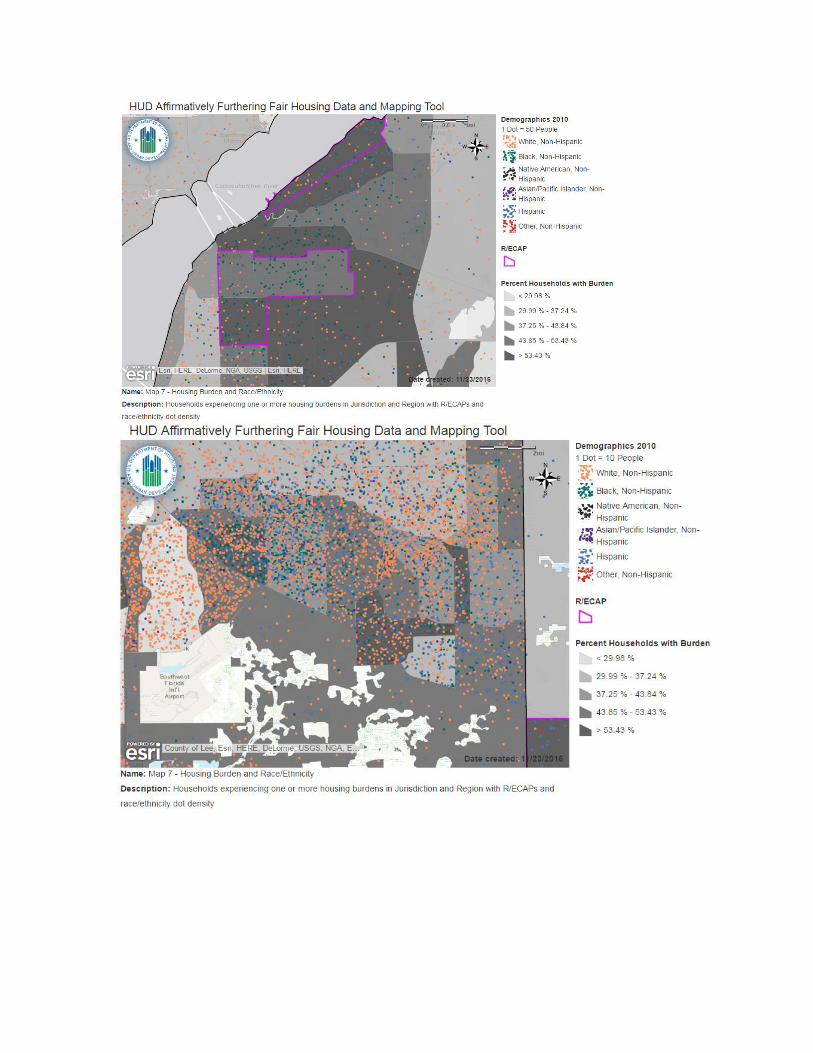
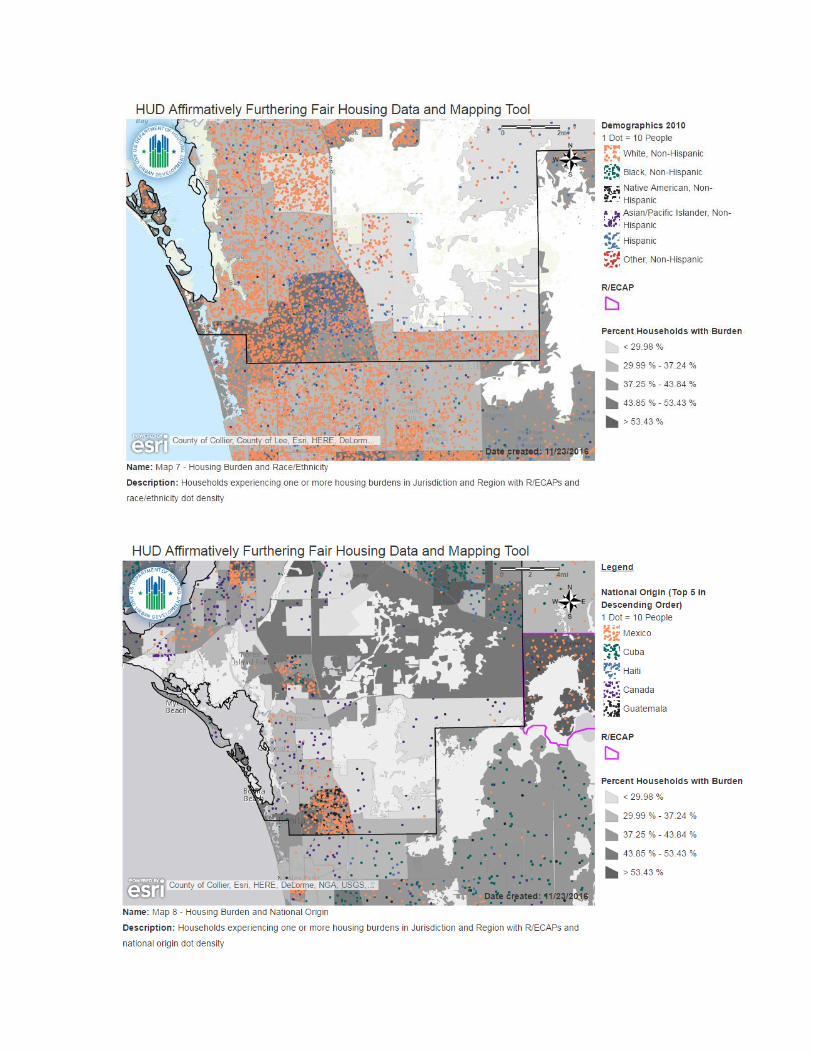
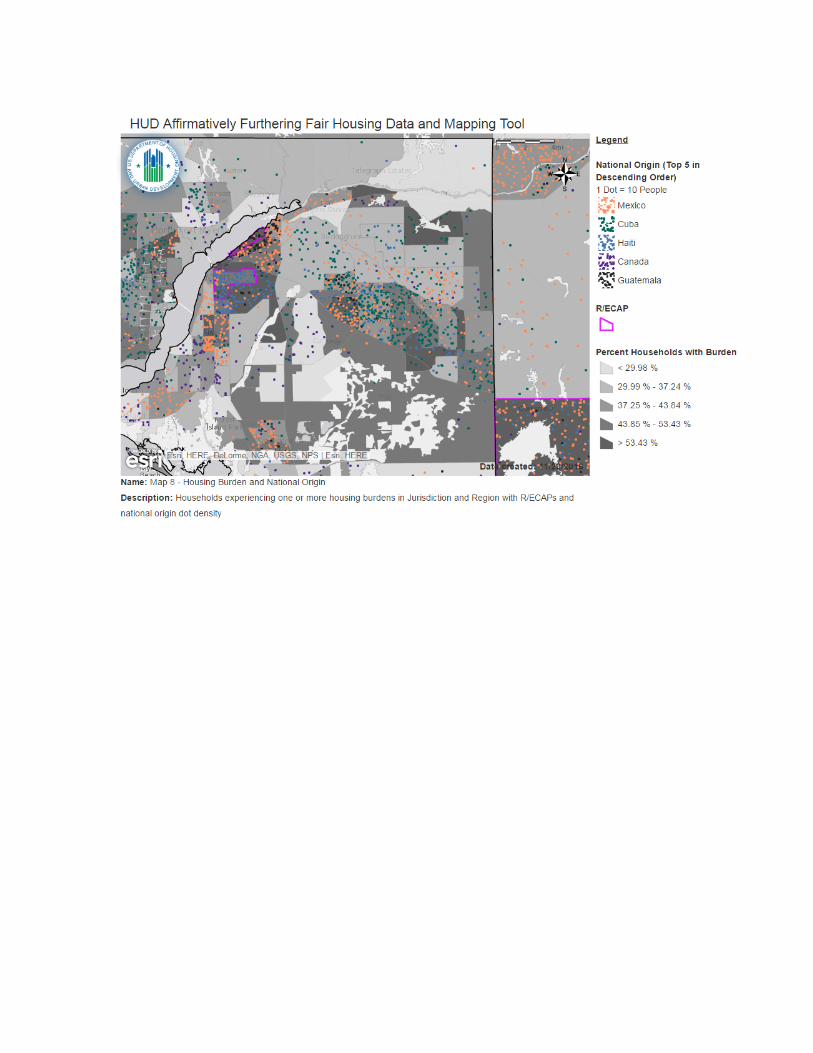

c. Compare the needs of families with children for housing units with two, and three or
more bedrooms with the available existing housing stock in each category of publicly
supported housing.
HUD Table 9 provides data on the familial status of those household experiencing housing
problems throughout the jurisdiction and the region. The data indicates that higher percentages
of households experiencing housing problems exist among households with five or more people.
Jurisdictionally 60.93% of households with five or more people experience at least one housing
issue. Regionally, the same is true with 58.26% of households with five or more people
experience at least one housing issue.
HUD Table 11 shows the number of households occupying units of various sizes (0-1 bedrooms, 2
bedrooms, 3 or more bedrooms) in four publicly supported housing program categories (public
housing, Project-based Section 8, Other HUD Multifamily, and HCV). Table 11 shows the number
of households with children currently residing in each of those four program categories.
NEED TO ADD MORE HERE: NEED INPUT FROM PHA – HUD TABLE DOESN’T
MAKE SENSE

d. Describe the differences in rates of renter and owner occupied housing by race/ethnicity in the
jurisdiction and region.
Regionally, between 30% and 50% of the available housing units are renter occupied. A few areas
have renter occupied units in greater volume, some as many as 70%-89.99%. The most highly
concentrated areas of renter occupied units exceed 90%. As displayed on the map below, there are
several areas of the region which are 90% or more renter occupied dwellings. Many of these areas
lie within the City of Fort Myers jurisdiction. The others that lie within the Lee County jurisdiction
are described below.
One area highly concentrated with
scattered sight rentals is in Lehigh
Acres, north of 82, south of Lee Blvd.
and west of Gunnery Rd. This area
consists primarily of single family rental
homes. As displayed on the map below
this area is fairly integrated with large
minority populations. Large Hispanic,
as well as Black, Non-Hispanic,
populations are renters in this area.
Another area that is identified has
highly concentrated with rental units is
the area surround South Fort Myers
High School on 6 Mile Cypress Parkway. This area features one multi-family apartment complex
and no other housing units, thus making it a highly concentrated rental area.
Another identified area on Cypress Lake Dr. and McGregor Blvd has similar characteristics, with a
small single family neighborhood located behind a largely retail area. This area features fairly
equal representation of Hispanic and White, Non-Hispanic households.
Another area with a high density of rental units in the unincorporated Lee County jurisdiction is
located east of 41 beginning at the Page Park Neighborhood and continues north into the City of
Fort Myers Jurisdiction until Winkler Ave. The northern portion of this area consists of multiple
multi-family housing complexes, both apartments and condominiums. These complexes are well
integrated into retail and industrial spaces and are very close to a major shopping mall and highway
41. The southern portion of this area, Page Park, is one of Lee County’s five target neighborhoods.
Page Park has a total of 599 housing units, 295, or 66%, of which are renter occupied. Again these
areas have a fairly equal representation of White, Non-Hispanic and Hispanic populations.

2. Additional Information
a. Beyond the HUD-provided data, provide additional relevant information, if any, about
disproportionate housing needs in the jurisdiction and region affecting groups with
other protected characteristics.
b. The program participant may also describe other information relevant to its
assessment of disproportionate housing needs. For PHAs, such information may
include a PHA’s overriding housing needs analysis.
3. Contributing Factors of Disproportionate Housing Needs
Consider the listed factors and any other factors affecting the jurisdiction and region.
Identify factors that significantly create, contribute to, perpetuate, or increase the severity
of disproportionate housing needs.
The availability of affordable units in a range of sizes
Displacement of residents due to economic pressures
Lack of private investments in specific neighborhoods
Lack of public investments in specific neighborhoods, including services or amenities
Land use and zoning laws
Lending Discrimination
Other

C. Publicly Supported Housing Analysis
1. Analysis
a. Publicly Supported Housing Demographics
i. Are certain racial/ethnic groups more likely to be residing in one category of publicly
supported housing than other categories (public housing, project-based Section 8,
Other HUD Multifamily Assisted developments, and Housing Choice Voucher
(HCV))?
ii. Compare the demographics, in terms of protected class, of residents of each category
of publicly supported housing (public housing, project-based Section 8, Other HUD
Multifamily Assisted developments, and HCV) to the population in general, and
persons who meet the income eligibility requirements for the relevant category of
publicly supported housing. Include in the comparison, a description of whether there
is a higher or lower proportion of groups based on protected class.
b. Publicly Supported Housing Location and Occupancy
i. Describe patterns in the geographic location of publicly supported housing by
program category (public housing, project-based Section 8, Other HUD
Multifamily Assisted developments, HCV, and LIHTC) in relation to previously
discussed segregated areas and R/ECAPs.
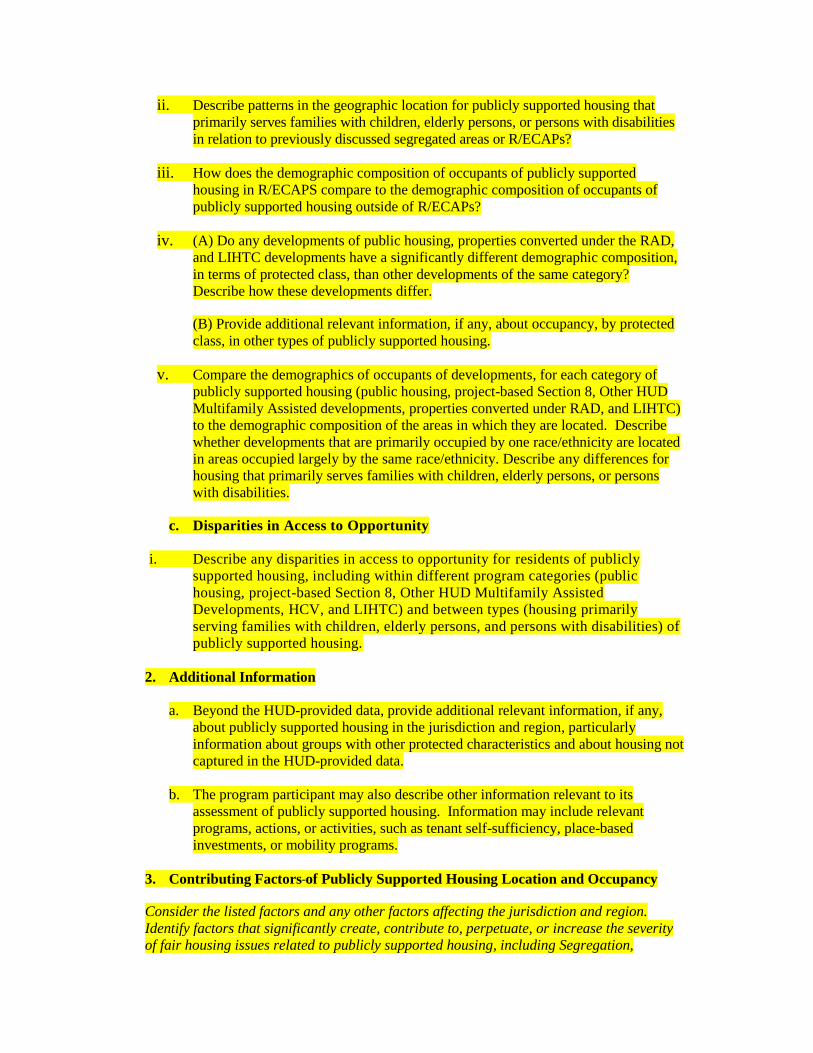
ii. Describe patterns in the geographic location for publicly supported housing that
primarily serves families with children, elderly persons, or persons with disabilities
in relation to previously discussed segregated areas or R/ECAPs?
iii. How does the demographic composition of occupants of publicly supported
housing in R/ECAPS compare to the demographic composition of occupants of
publicly supported housing outside of R/ECAPs?
iv. (A) Do any developments of public housing, properties converted under the RAD,
and LIHTC developments have a significantly different demographic composition,
in terms of protected class, than other developments of the same category?
Describe how these developments differ.
(B) Provide additional relevant information, if any, about occupancy, by protected
class, in other types of publicly supported housing.
v. Compare the demographics of occupants of developments, for each category of
publicly supported housing (public housing, project-based Section 8, Other HUD
Multifamily Assisted developments, properties converted under RAD, and LIHTC)
to the demographic composition of the areas in which they are located. Describe
whether developments that are primarily occupied by one race/ethnicity are located
in areas occupied largely by the same race/ethnicity. Describe any differences for
housing that primarily serves families with children, elderly persons, or persons
with disabilities.
c. Disparities in Access to Opportunity
i. Describe any disparities in access to opportunity for residents of publicly
supported housing, including within different program categories (public
housing, project-based Section 8, Other HUD Multifamily Assisted
Developments, HCV, and LIHTC) and between types (housing primarily
serving families with children, elderly persons, and persons with disabilities) of
publicly supported housing.
2. Additional Information
a. Beyond the HUD-provided data, provide additional relevant information, if any,
about publicly supported housing in the jurisdiction and region, particularly
information about groups with other protected characteristics and about housing not
captured in the HUD-provided data.
b. The program participant may also describe other information relevant to its
assessment of publicly supported housing. Information may include relevant
programs, actions, or activities, such as tenant self-sufficiency, place-based
investments, or mobility programs.
3. Contributing Factors of Publicly Supported Housing Location and Occupancy
Consider the listed factors and any other factors affecting the jurisdiction and region.
Identify factors that significantly create, contribute to, perpetuate, or increase the severity
of fair housing issues related to publicly supported housing, including Segregation,
RECAPs, Disparities in Access to Opportunity, and Disproportionate Housing Needs. For
each contributing factor that is significant, note which fair housing issue(s) the selected
contributing factor relates to.
Admissions and occupancy policies and procedures, including preferences in
publicly supported housing
Land use and zoning laws
Community opposition
Impediments to mobility
Lack of private investment in specific neighborhoods
Lack of public investment in specific neighborhoods, including services and amenities
Lack of regional cooperation
Occupancy codes and restrictions
Quality of affordable housing information programs
Sitting selection policies, practices and decisions for publicly supported housing,
including discretionary aspects of Qualified Allocation Plans and other programs
Source of income discrimination
Other
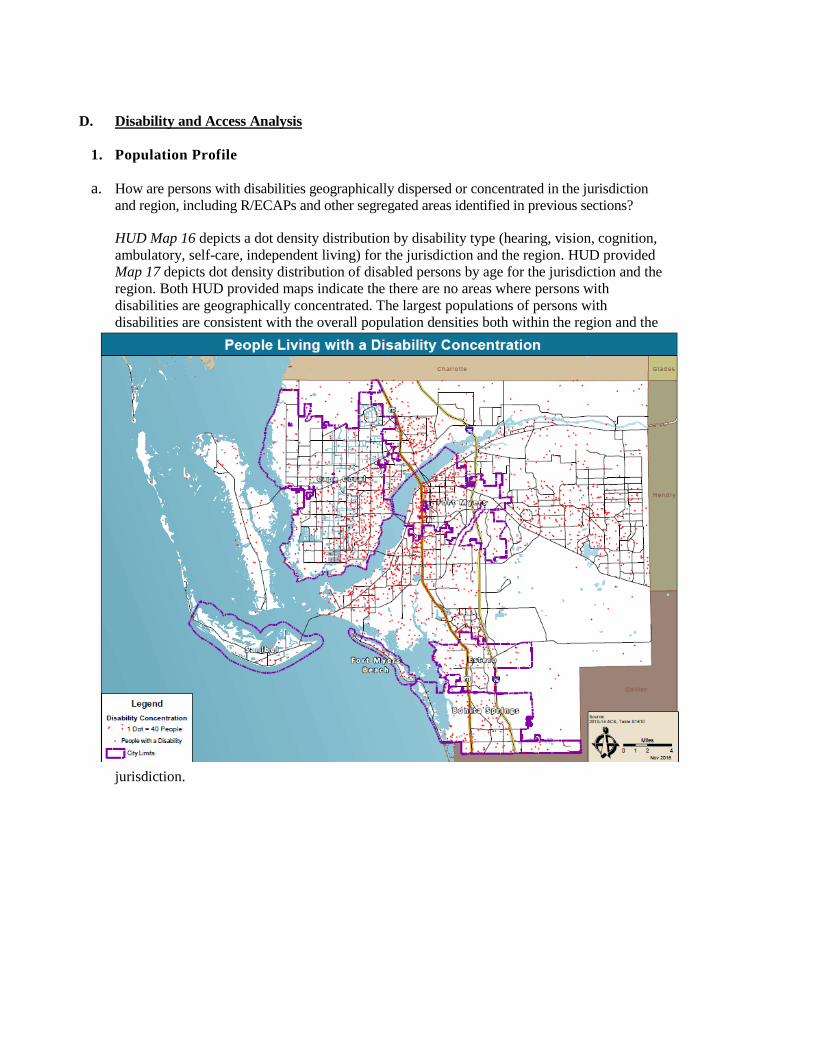
D. Disability and Access Analysis
1. Population Profile
a. How are persons with disabilities geographically dispersed or concentrated in the jurisdiction
and region, including R/ECAPs and other segregated areas identified in previous sections?
HUD Map 16 depicts a dot density distribution by disability type (hearing, vision, cognition,
ambulatory, self-care, independent living) for the jurisdiction and the region. HUD provided
Map 17 depicts dot density distribution of disabled persons by age for the jurisdiction and the
region. Both HUD provided maps indicate the there are no areas where persons with
disabilities are geographically concentrated. The largest populations of persons with
disabilities are consistent with the overall population densities both within the region and the
jurisdiction.

b. Describe whether these geographic patterns vary for persons with each type of disability
or for persons with disabilities in different age ranges.
HUD Table 13 provides data on the percentage of the population with types of disabilities in
the jurisdiction and the region. Data from this table indicates that the majority of persons with
disabilities experience ambulatory difficulty. The secondary disability within the region is
difficulty with independent living. As with the general distribution of persons with
disabilities, there are no concentrated areas of persons with a specific disability.
As indicated in Chart 20, the majority of persons with disabilities are 65 years of age or older.
Nearly 8% of the total populations are persons over the age of 65 with a disability. Persons
ages 18 to 64 with disabilities make up 6.08% of the regional population. Persons with
disabilities under the age of 18 make up less than 1% of the regional population, as indicated
in Chart 21. As with the varying types of disabilities, persons of varying ages with disabilities
are fairly evenly distributed throughout all jurisdictions and the region.
2. Housing Accessibility
a. Describe whether the jurisdiction and region have sufficient affordable, accessible
housing in a range of unit sizes.
Affordable housing is limited within the entire region and throughout Southwest
Florida. A recent study released by the National Low Income Housing Coalition (2016)
estimates that the mean renter wage, of the 31% of the Lee County population that rents
their place of residence, is approximately $13.00 per hour. At this wage, and affordable

monthly rent would be $680.00. The fair market rental rate, as established by HUD, in
Lee County is $911.00 for a two bedroom unit, and most units in region far exceed this
monthly rent amount. (NLIHC, 2016)
As previously discussed, the Southwest Florida economy is largely based on seasonal
residents and tourism. For this reason rental units are often reserved for seasonal and
vacation stays and come at a high price. This trend limits the amount of affordable units
available for year round residents. Lee County is working to address issues to
affordable housing through the development and implementation of a new Local
Housing Assistance Plan and Affordable Housing Incentives. Additionally, significant
collaboration is taking place between the Public Housing Authorities (PHA), affordable
housing developers, and even neighboring local governments, to develop additional
affordable housing units. Housing units which are rehabilitated or newly constructed by
Lee County and PHAs are ADA compliant and vary in size to address the needs of all
households.
National Low Income Housing Coalition. (2016). Out of Reach 2016: Florida.
Retrieved from http://nlihc.org/oor/florida
b. Describe the areas where affordable accessible housing units are located. Do they
align with R/ECAPs or other areas that are segregated?
As indicated by Local Maps 2, 10 and 12, the majority of rental units within the region
exceed the affordability measure of 30% or less of the area median income. The average
rent in Lee County is 60.8% of the area median income. Units constructed by the PHA
are located within the identified R/ECAPs.
b. To what extent are persons with different disabilities able to access and live in the
different categories of publicly supported housing?
3. Integration of Persons with Disabilities Living in Institutions and Other Segregated Settings
a. To what extent do persons with disabilities in or from the jurisdiction or region reside
in segregated or integrated settings?
As depicted on Local Map 11 persons with disabilities are fairly integrated throughout
the jurisdictions and region. There are no distinct areas where persons living with a
disability are segregated from other populations. Service providers, which assist
persons living with disabilities, are evenly distributed throughout the region, and are

located near public facilities, such as parks and libraries, to ensure accessibility for
persons with disabilities.
b. Describe the range of options for persons with disabilities to access affordable
housing and supportive services.
Disparities in Access to Opportunity
a. To what extent are persons with disabilities able to access the following? Identify major
barriers faced concerning:
As demonstrated on Local Map 11, persons with disabilities are not concentrated in any particular
area within the region. Because of this high integration, persons with disabilities have equal access
to public facilities such as, schools, infrastructure, parks, and libraries. There are no anticipated
barriers for persons with disabilities as the jurisdiction has enacted provisions to promote
accessibility.
i. Government services and facilities
In accordance with the requirements of Title II of the Americans with Disabilities Act of 1990,
Lee County will not discriminate against qualified individuals with disabilities on the basis of
disability in the County's services, programs or activities. Most government facilities are
accessible to persons with varying types of disabilities, including wheel chair accessible.
Reasonable accommodations are made upon request to provide access to government services and
facilities for persons with disabilities.
Lee County also offers an ADA Grievance process in which an individual can file a complaint
alleging discrimination on the basis of disability in the provision of services, activities, programs,
or benefits by Lee County, Florida.
GET DATA FROM JOAN L. RE: THE # OF COMPLIANTS FILED.
ii. Public infrastructure (e.g., sidewalks, pedestrian crossings, pedestrian signals)
The 2016 Lee Plan outlines requirements for Suburban or higher density developments within the
County supply ADA compliant access to public transportation through the development of: “bus
accommodations such as dedicated transfer/loading areas, adequate lane widths and turn arounds;
bus shelters with route information displays; bicycle storage areas near major bus stops; and
walkways for access to bus stops.” Additionally, the Lee Plan specifies goals for assisting persons
with disabilities during emergencies. All infrastructure projects completed by the County are ADA
compliant, and feature appropriate pedestrian crossing markings and notifications.
ii. Transportation
Lee Tran works in coordination with the Lee Metropolitan Planning Organization to ensure “that
no person shall on the basis of race, color, national origin, sex, age, disability, family or religious
status, as provided by Title VI of the Civil Rights Act of 1964, the Civil Rights Restoration Act of
1987 and the Florida Civil Rights Act of 1992 be excluded from participation in, be denied the
benefits of, or be otherwise subjected to discrimination or retaliation under any program or
activity.” (Lee County Metropolitan Planning Organization 2016) As part of the Title VI Plan, Lee
Tran has analyzed the availability of transit routes for persons with limited English proficiency,
persons with disabilities, minorities, and low income populations. These map analyses and the
entire Title VI Plan can be viewed here: http://www.leegov.com/leetran/Documents/FY2015-
2017%20Title%20VI%20Program.pdf. To ensure compliance with Title VI and access for all
persons to the public transportation system Lee Tran regularly monitors services, conducts route
samples, and thoroughly processes consumer complaints.
Lee Tran. (2015). 2015-2017 Title VI Program Update. Retrieved from
http://www.leegov.com/leetran/Documents/FY2015-2017%20Title%20VI%20Program.pdf
Lee County Metropolitan Planning Organization. (2016). Title VI/Civil Rights. Retrieved from
http://leempo.com/public-involvement/title-vicivil-rights/
iii. Proficient schools and educational programs
“Through the Exceptional Student Education Department, the [Lee County School] District offers
a free and appropriate public education in compliance with the federally mandated Individuals
with Disabilities Education Improvement Act of 2004 (IDEA). A continuum of services and
programs is available to meet the individual needs of students requiring special education, ages 3
through 21. Services … are provided per an Individual Education Plan (IEP) and are based on
each child’s unique needs, as related to present levels of academic achievement and functional
performance. …The Exceptional Student Education Department (Special Education) coordinates
the provision of programs with the District’s School Assignment Office. Special education
services are provided in all of the three attendance zones – East, West and South. With the
exception of very specialized low-incidence programs, students will attend a school within the
geographical school attendance zone of residence.”
Lee County School District. (2016). Exceptional Student Education. Retrieved from
http://www.leeschools.net/ese
iv. Jobs
Lee County does not discriminate on the basis of disability in its hiring or employment practices
and complies with all regulations promulgated by the U.S. Equal Employment Opportunity
Commission under Title I of the Americans with Disabilities Act (ADA). Additionally, Lee County
collaborates with community partners, such a LARC Inc., which offers adult day training,
vocational rehabilitation, independent living education, and job placement and retention services
for persons with disabilities. Additional job opportunities are made available to persons with
disabilities through Goodwill Industries of Southwest Florida, Inc., and various other private sector
employers.
b. Describe the processes that exist in the jurisdiction and region for persons with disabilities to
request and obtain reasonable accommodations and accessibility modifications to address
the barriers discussed above.
Lee County government is committed to making reasonable accommodations for any persons in
need of such in order to access services and facilities. All Notices of Public Hearings advise
persons with disabilities that reasonable accommodations, including translation and interpretation,
can be requested by email or phone no later than three business days prior to the hearing. Other
public notices provide contact information for persons with disabilities to request reasonable
accommodations at any time.

Lee County also offers an ADA Grievance process in which an individual can file a complaint
alleging discrimination on the basis of disability in the provision of services, activities, programs,
or benefits by Lee County, Florida.
c. Describe any difficulties in achieving homeownership experienced by persons with
disabilities and by persons with different types of disabilities.
4. Disproportionate Housing Needs
a. Describe any disproportionate housing needs experienced by persons with disabilities and by
persons with certain types of disabilities.
5. Additional Information
a. Beyond the HUD-provided data, provide additional relevant information, if any, about disability
and access issues in the jurisdiction and region affecting groups with other protected
characteristics.
b. The program participant may also describe other information relevant to its assessment of
disability and access issues.
6. Disability and Access Issues Contributing Factors
Consider the listed factors and any other factors affecting the jurisdiction and region.
Identify factors that significantly create, contribute to, perpetuate, or increase the severity
of disability and access issues and the fair housing issues, which are Segregation,
RECAPs, Disparities in Access to Opportunity, and Disproportionate Housing Needs. For
each contributing factor, note which fair housing issue(s) the selected contributing factor
relates to.
Access to proficient schools for persons with disabilities
Access to publicly supported housing for persons with disabilities
Access to transportation for persons with disabilities
Inaccessible government facilities or services
Inaccessible sidewalks, pedestrian crossings, or other infrastructure
Lack of affordable in-home or community-based supportive services
Lack of affordable, accessible housing in range of unit sizes
Lack of affordable, integrated housing for individuals who need supportive services
Lack of assistance for housing accessibility modifications
Lack of assistance for transitioning from institutional settings to integrated housing
Land use and zoning laws
Lending Discrimination
Location of accessible housing
Occupancy codes and restrictions
Regulatory barriers to providing housing and supportive services for persons with
disabilities

State or local laws, policies, or practices that discourage individuals with disabilities
from being placed in or living in apartments, family homes, and other integrated
settings
Other
E. Fair Housing Enforcement, Outreach Capacity, and Resources Analysis
1. List and summarize any of the following that have not been resolved: a charge or letter of
finding from HUD concerning a violation of a civil rights-related law, a cause
determination from a substantially equivalent state or local fair housing agency concerning
a violation of a state or local fair housing law, a letter of findings issued by or lawsuit filed
or joined by the Department of Justice alleging a pattern or practice or systemic violation
of a fair housing or civil rights law, or a claim under the False Claims Act related to fair
housing, nondiscrimination, or civil rights generally, including an alleged failure to
affirmatively further fair housing.
Lee County does not have any HUD findings, concerns or violations of civil rights-related laws,
and has never been accused of failing to affirmatively further fair housing. A report of recent fair
housing complaints, which originated from Lee County, and were filed with the HUD Miami Field
Office, is attached.
2. Describe any state or local fair housing laws. What characteristics are protected
under each law?
Chapter 760 of the Florida Statute addresses the discrimination in the treatment of persons and
minority representation in the sale or rental of any property. The state addresses the 1992 Florida
Civil Rights Act, the Fair Housing Act, and other provisions related to rights of all Florida
residents.
Lee County codified similar provisions in Lee County Ordinance 13-04, which provides for equal
opportunity in housing in Lee County that is free from discrimination because of race, color,
religion, national origin, sex, familial status, or disability. The complete ordinance can be reviewed
here: http://www.leegov.com/bocc/ordinances
The City of Cape Coral has also codified Fair Housing efforts in Code of Ordinances Chapter 16,
which declares the City’s efforts to preserve fair housing in the sale and rental of all properties.
Likewise, the City of Fort Myers……
The Housing Authority of the City of Fort Myers and the Lee County Housing Authority…
3. Identify any local and regional agencies and organizations that provide fair housing
information, outreach, and enforcement, including their capacity and the resources
available to them.
Lee County held a vendor agreement with Florida Rural Legal Services, Inc. for the 2016 calendar
year. This agreement provided for the presentation of fair housing education sessions, consulting
services, and coordination for the annual fair housing summit. Educational sessions were to be
presented by request; there were no requests in 2016. Florida Rural Legal Services did provide
support for the Fair Housing Summit presented by the Housing Authority of the City of Fort Myers
and Lee County Human and Veteran Services.

In 2017, Lee County Human and Veteran Services contracted with ……… to provide fair housing
information and outreach throughout the region.
4. Additional Information
a. Provide additional relevant information, if any, about fair housing enforcement,
outreach capacity, and resources in the jurisdiction and region.
b. The program participant may also include information relevant to programs,
actions, or activities to promote fair housing outcomes and capacity.
5. Fair Housing Enforcement, Outreach Capacity, and Resources Contributing Factors
Consider the listed factors and any other factors affecting the jurisdiction and region.
Identify factors that significantly create, contribute to, perpetuate, or increase the severity of
fair housing enforcement, outreach capacity, and resources and the fair housing issues, which
are Segregation, RECAPs, Disparities in Access to Opportunity, and Disproportionate
Housing Needs. For each significant contributing factor, note which fair housing issue(s) the
selected contributing factor impacts.
Lack of local private fair housing outreach and enforcement
Lack of local public fair housing enforcement
Lack of resources for fair housing agencies and organizations
Lack of state or local fair housing laws
Unresolved violations of fair housing or civil rights law
Other
VII. Fair Housing Goals and Priorities
1. For each fair housing issue, prioritize the identified contributing factors. Justify the
prioritization of the contributing factors that will be addressed by the goals set below in
Question 2. Give the highest priority to those factors that limit or deny fair housing choice or
access to opportunity, or negatively impact fair housing or civil rights compliance.
2. For each fair housing issue with significant contributing factors identified in Question 1, set
one or more goals. Explain how each goal is designed to overcome the identified
contributing factor and related fair housing issue(s). For goals designed to overcome more
than one fair housing issue, explain how the goal will overcome each issue and the related
contributing factors. For each goal, identify metrics and milestones for determining what fair
housing results will be achieved, and indicate the timeframe for achievement.
Goal Contributing
Factors
Fair Housing
Issues
Metrics,
Milestones,
and
Timeframe for
Achievement
Responsible
Program
Participant(s)

Discussion:


