
Asw
ath Dam
odaran186
Valuation
Asw
ath Dam
odaran

Asw
ath Dam
odaran187
First P
rinciples
Invest in projects that yield a return greater than the minim
umacceptable hurdle rate.•
The hurdle rate should be higher for riskier projects and reflect the
financing mix used - ow
ners’ funds (equity) or borrowed m
oney (debt)
•R
eturns on projects should be measured based on cash flow
s generatedand the tim
ing of these cash flows; they should also consider both positive
and negative side effects of these projects.
Choose a financing m
ix that minim
izes the hurdle rate and matches the
assets being financed.
If there are not enough investments that earn the hurdle rate, return the
cash to stockholders.•
The form
of returns - dividends and stock buybacks - will depend upon
the stockholders’ characteristics.
Objective: M
aximize the V
alue of the Firm
Asw
ath Dam
odaran188
Discounted C
ashflow V
aluation: Basis for
Approach
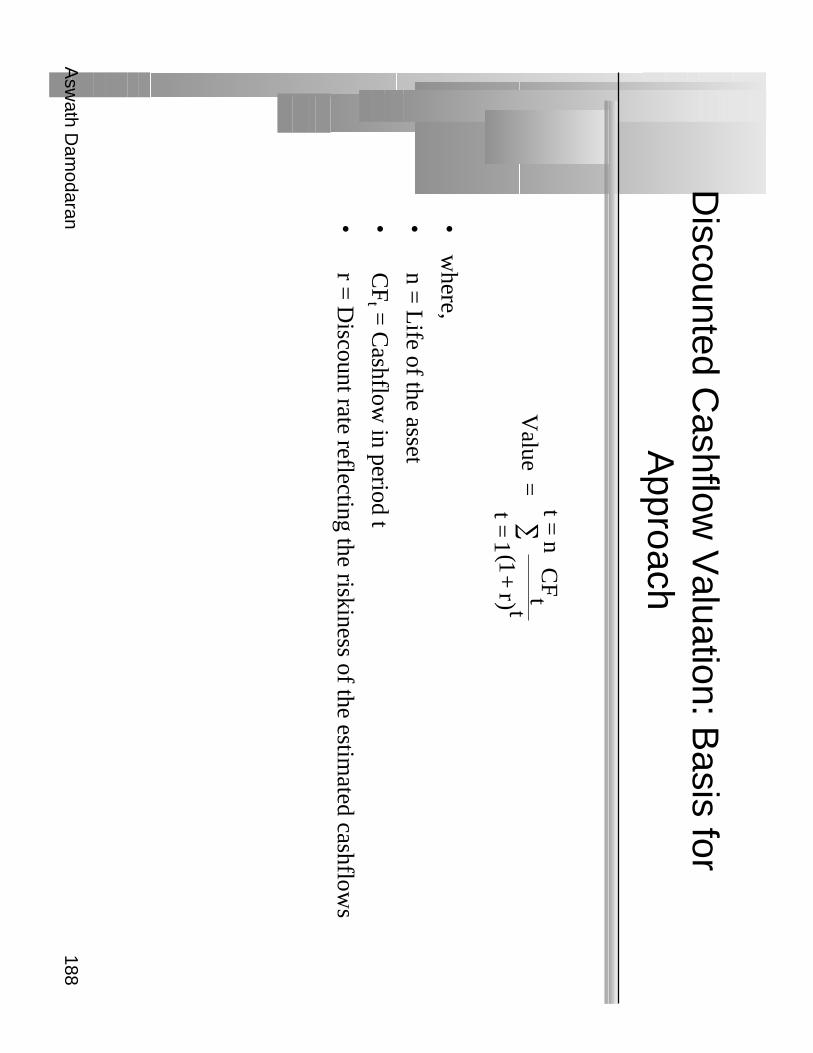
•w
here,
•n =
Life of the asset
•C
Ft =
Cashflow
in period t
•r =
Discount rate reflecting the riskiness of the estim
ated cashflows
Value =
C
Ft
(1+
r) tt=
1
t=n
∑

Asw
ath Dam
odaran189
Equity V
aluation
The value of equity is obtained by discounting expected cashflow
s toequity, i.e., the residual cashflow
s after meeting all expenses, tax
obligations and interest and principal payments, at the cost of equity,
i.e., the rate of return required by equity investors in the firm.
where,
CF to E
quityt = E
xpected Cashflow
to Equity in period t
ke = C
ost of Equity
The dividend discount m
odel is a specialized case of equity valuation,and the value of a stock is the present value of expected futuredividends.
Value of E
quity=
C
F to E
quityt
(1+
ke ) t
t=1
t=n
∑

Asw
ath Dam
odaran190
Firm
Valuation
The value of the firm
is obtained by discounting expected cashflows to
the firm, i.e., the residual cashflow
s after meeting all operating
expenses and taxes, but prior to debt payments, at the w
eightedaverage cost of capital, w
hich is the cost of the different components
of financing used by the firm, w
eighted by their market value
proportions.
where,
CF to Firm
t = E
xpected Cashflow
to Firm in period t
WA
CC
= W
eighted Average C
ost of Capital
Value of F
irm=
C
F to F
irmt
(1+
WA
CC
) tt=1
t=n
∑

Asw
ath Dam
odaran191
Generic D
CF
Valuation M
odel
Cash
flow
sF
irm: P
re-debt cash flowE
quity: After debt
cash flows
Exp
ected G
row
thF
irm: G
rowth in
Operating E
arningsE
quity: Grow
th in N
et Income/E
PS
CF
1C
F2
CF
3C
F4
CF
5
Forever
Firm
is in stable growth:
Grow
s at constant rateforever
Term
inal Value
CF
n.........
Disco
un
t Rate
Firm
:Cost of C
apital
Equity: C
ost of Equity
Value
Firm
: Value of F
irm
Equity: V
alue of Equity
DIS
CO
UN
TE
D C
AS
HF
LOW
VA
LUA
TIO
N
Len
gth
of P
eriod
of H
igh
Gro
wth

Asw
ath Dam
odaran192
Estim
ating Inputs:I. D
iscount Rates
Critical ingredient in discounted cashflow
valuation. Errors in
estimating the discount rate or m
ismatching cashflow
s and discountrates can lead to serious errors in valuation.
At an intutive level, the discount rate used should be consistent w
ithboth the riskiness and the type of cashflow
being discounted.
The cost of equity is the rate at w
hich we discount cash flow
s to equity(dividends or free cash flow
s to equity). The cost of capital is the rate
at which w
e discount free cash flows to the firm
.
Asw
ath Dam
odaran193
Estim
ating Aracruz’s C
ost of Equity
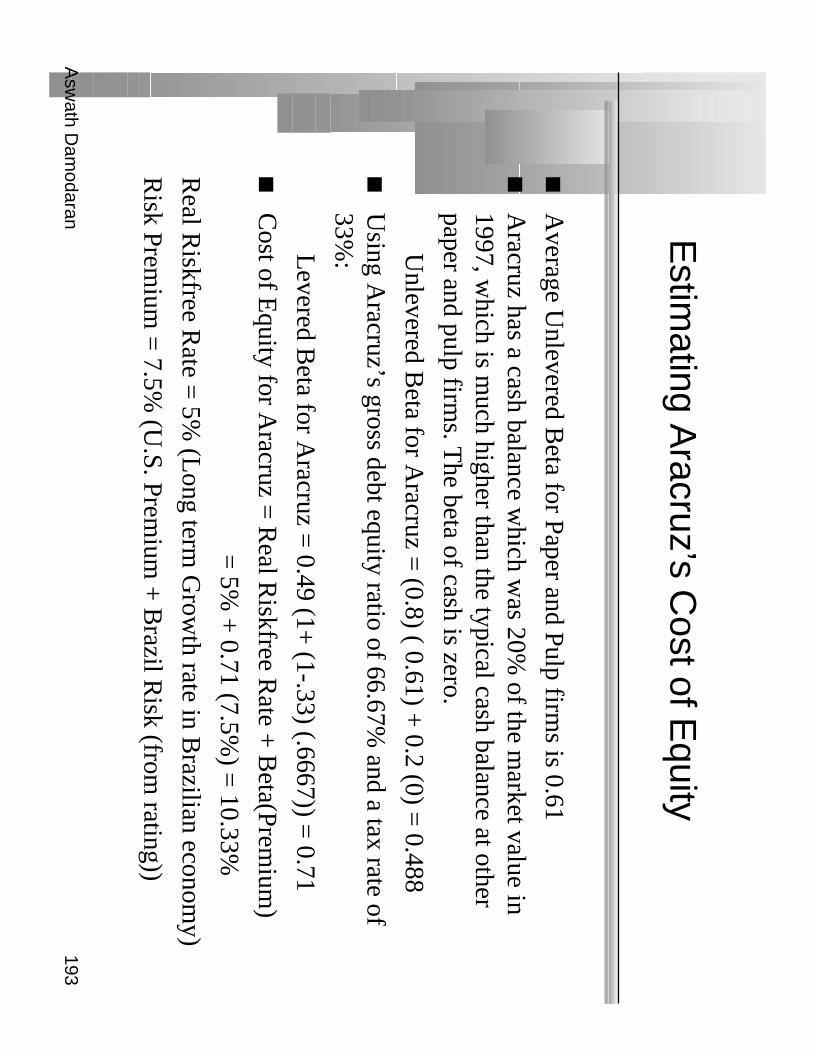
Average U
nlevered Beta for Paper and Pulp firm
s is 0.61
Aracruz has a cash balance w
hich was 20%
of the market value in
1997, which is m
uch higher than the typical cash balance at otherpaper and pulp firm
s. The beta of cash is zero.
Unlevered B
eta for Aracruz =
(0.8) ( 0.61) + 0.2 (0) =
0.488
Using A
racruz’s gross debt equity ratio of 66.67% and a tax rate of
33%:Levered B
eta for Aracruz =
0.49 (1+ (1-.33) (.6667)) =
0.71
Cost of E
quity for Aracruz =
Real R
iskfree Rate +
Beta(Prem
ium)
= 5%
+ 0.71 (7.5%
) = 10.33%
Real R
iskfree Rate =
5% (L
ong term G
rowth rate in B
razilian economy)
Risk Prem
ium =
7.5% (U
.S. Premium
+ B
razil Risk (from
rating))
Asw
ath Dam
odaran194
Estim
ating Cost of E
quity: Deutsche B
ank
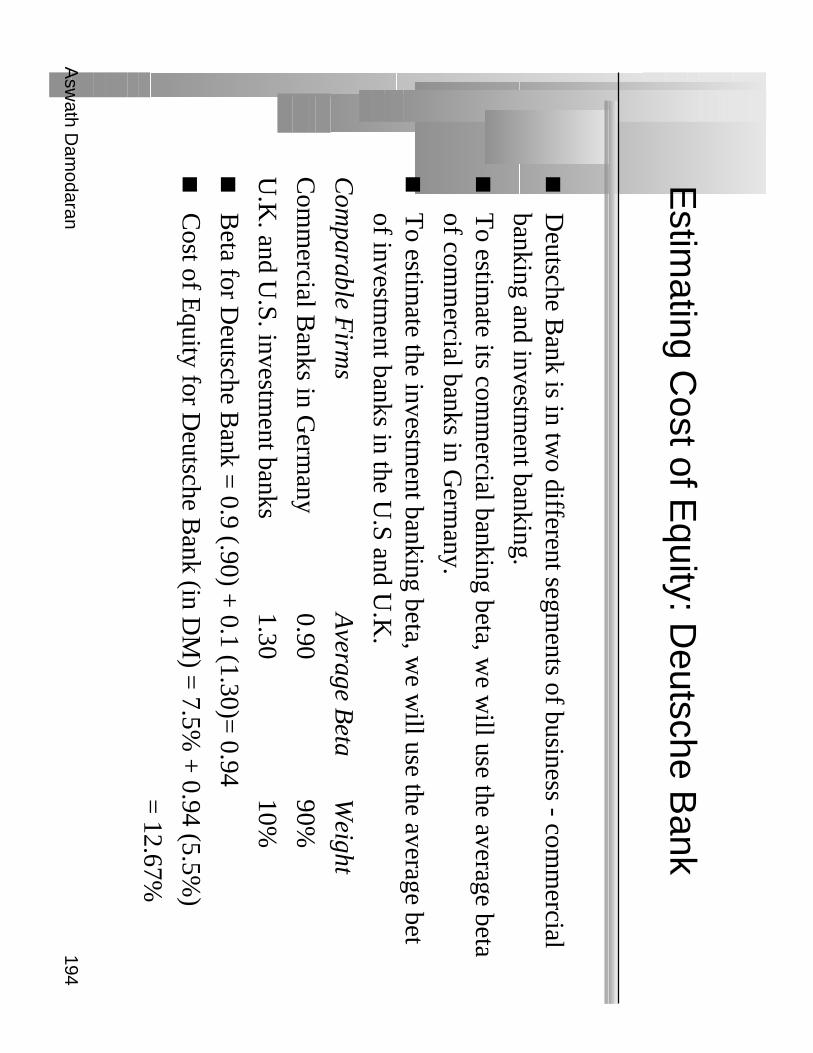
Deutsche B
ank is in two different segm
ents of business - comm
ercialbanking and investm
ent banking.
To estim
ate its comm
ercial banking beta, we w
ill use the average betaof com
mercial banks in G
ermany.
To estim
ate the investment banking beta, w
e will use the average bet
of investment banks in the U
.S and U.K
.
Com
parable Firm
sA
verage Beta
Weight
Com
mercial B
anks in Germ
any0.90
90%
U.K
. and U.S. investm
ent banks1.30
10%
Beta for D
eutsche Bank =
0.9 (.90) + 0.1 (1.30)=
0.94
Cost of E
quity for Deutsche B
ank (in DM
) = 7.5%
+ 0.94 (5.5%
)
= 12.67%

Asw
ath Dam
odaran195
Review
ing Disney’s C
osts of Equity &
Debt
Business
Unlevered
D/E
Ratio
Levered
Riskfree
Risk
Cost of
Beta
Beta
Rate
Premium
Equity
Creative C
ontent1.25
20.92%1.42
7.00%5.50%
14.80%
Retailing
1.5020.92%
1.707.00%
5.50%16.35%
Broadcasting
0.9020.92%
1.027.00%
5.50%12.61%
Them
e Parks1.10
20.92%1.26
7.00%5.50%
13.91%
Real E
state0.70
59.27%0.92
7.00%5.50%
12.31%
Disney
1.0921.97%
1.257.00%
5.50%13.85%
Disney’s C
ost of Debt (based upon rating) =
7.50%
Asw
ath Dam
odaran196
Estim
ating Cost of C
apital: Disney
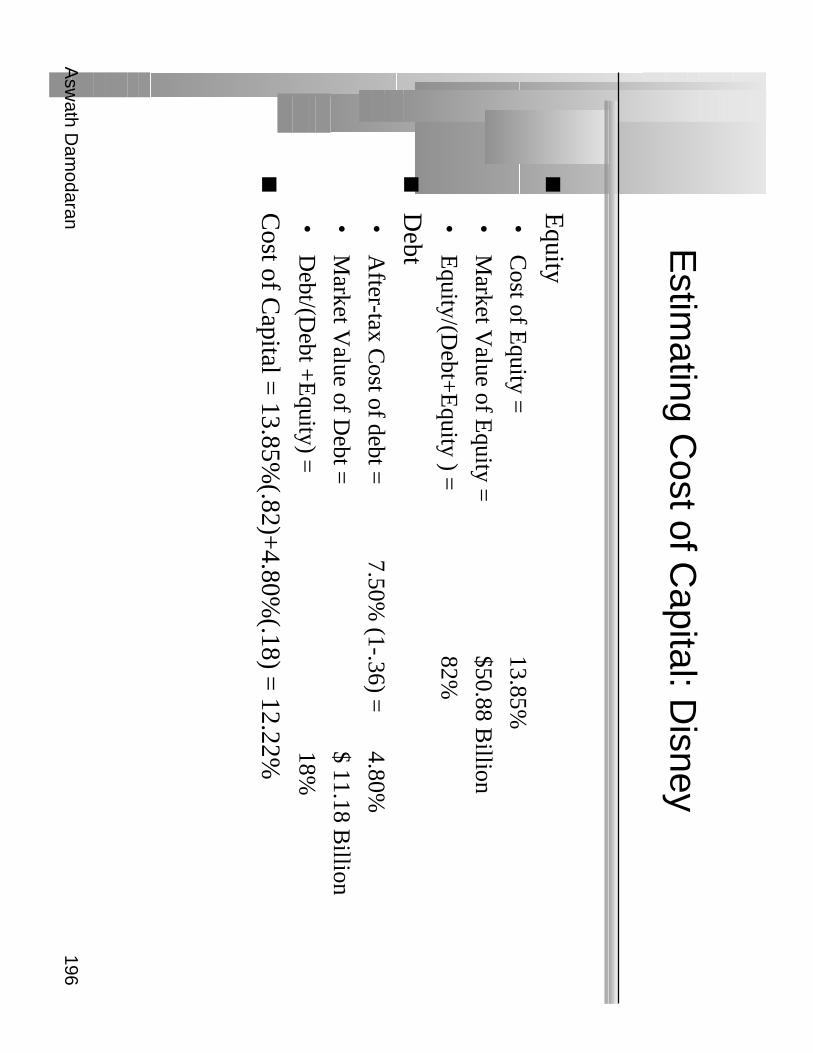
Equity•
Cost of E
quity =13.85%
•M
arket Value of E
quity =
$50.88 Billion
•E
quity/(Debt+
Equity ) =
82%
Debt
•A
fter-tax Cost of debt =
7.50% (1-.36) =
4.80%
•M
arket Value of D
ebt =$ 11.18 B
illion
•D
ebt/(Debt +
Equity) =
18%
Cost of C
apital = 13.85%
(.82)+4.80%
(.18) = 12.22%

Asw
ath Dam
odaran197
II. Estim
ating Cash F
lows
Cash F
lows
To E
quityT
o Firm
The S
trict View
Dividends +
Stock B
uybacks
The B
roader View
Net Incom
e- N
et Cap E
x (1-Debt R
atio)- C
hg WC
(1 - Debt R
atio)= F
ree Cashflow
to Equity
EB
IT (1-t)
- ( Cap E
x - Depreciation)
- Change in W
orking Capital
= Free C
ashflow to F
irm

Asw
ath Dam
odaran198
Estim
ating FC
FE
next year: Aracruz
All inputs are per share num
bers:
Earnings
BR
0.222
- (CapE
x-Depreciation)*(1-D
R)
BR
0.042
-Chg. W
orking Capital*(1-D
R)
BR
0.018
Free Cashflow
to Equity
BR
0.170
Earnings: Since A
racruz’s 1996 earnings are “abnormally” low
, I usedthe average earnings per share from
1992 to 1996.
Capital E
xpenditures per share next year = 0.24 B
R/share
Depreciation per share next year =
0.18 BR
/share
Change in W
orking Capital =
0.03 BR
/share
Debt R
atio = 39%
Asw
ath Dam
odaran199
Estim
ating FC
FF
: Disney
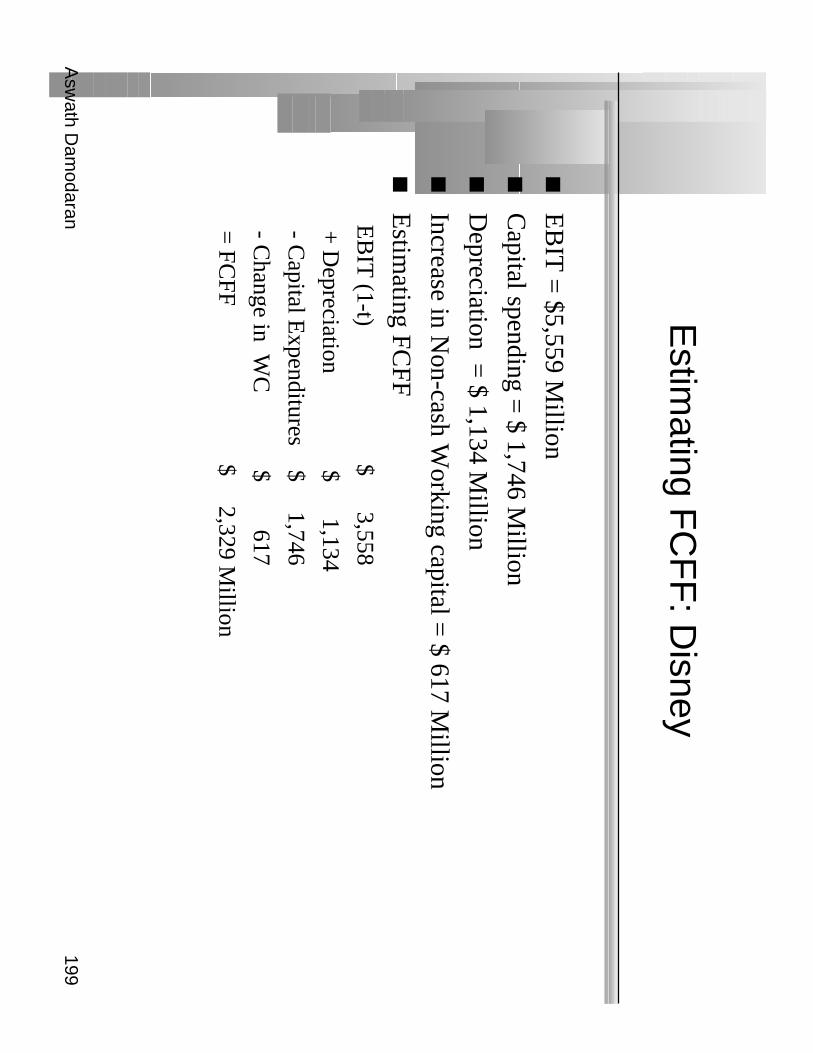
EB
IT =
$5,559 Million
Capital spending =
$ 1,746 Million
Depreciation =
$ 1,134 Million
Increase in Non-cash W
orking capital = $ 617 M
illion
Estim
ating FCFF
EB
IT (1-t)
$ 3,558
+ D
epreciation $ 1,134
- Capital E
xpenditures $ 1,746
- Change in W
C $ 617
= FC
FF
$ 2,329 Million

Asw
ath Dam
odaran200
Application T
est: Estim
ating your firm’s
FC
FF
Estim
ate the FCFF for your firm
in its most recent financial year:
In general,If using statem
ent of cash flows
EB
IT (1-t)
EB
IT (1-t)
+ D
epreciation+
Depreciation
- Capital E
xpenditures+
Capital E
xpenditures
- Change in N
on-cash WC
+ C
hange in Non-cash W
C
= FC
FF=
FCFF
Estim
ate the dollar reinvestment at your firm
:
Reinvestm
ent = E
BIT
(1-t) - FCFF

Asw
ath Dam
odaran201
Choosing a C
ash Flow
to Discount
When you cannot estim
ate the free cash fllows to equity or the firm
,the only cash flow
that you can discount is dividends. For financialservice firm
s, it is difficult to estimate free cash flow
s. For Deutsche
Bank, w
e will be discounting dividends.
If a firm’s debt ratio is not expected to change over tim
e, the free cashflow
s to equity can be discounted to yield the value of equity. ForA
racruz, we w
ill discount free cash flows to equity.
If a firm’s debt ratio m
ight change over time, free cash flow
s to equitybecom
e cumbersom
e to estimate. H
ere, we w
ould discount free cashflow
s to the firm. For D
isney, we w
ill discount the free cash flow to
the firm.
Asw
ath Dam
odaran202
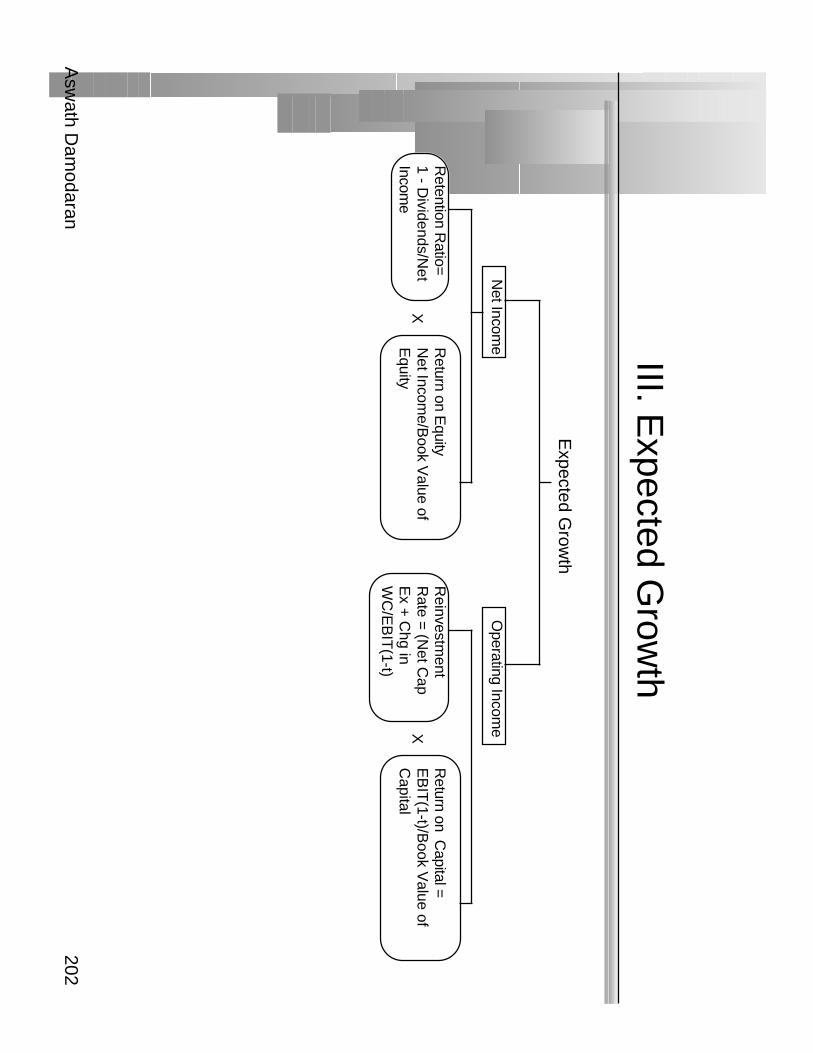
III. Expected G
rowth
Expected G
rowth
Net Incom
eO
perating Income
Retention R
atio=1 - D
ividends/Net
Income
Return on E
quityN
et Income/B
ook Value of
Equity
X
Reinvestm
ent R
ate = (Net C
ap E
x + C
hg in W
C/E
BIT
(1-t)
Return on C
apital =E
BIT
(1-t)/Book V
alue of C
apitalX

Asw
ath Dam
odaran203
Expected G
rowth in E
PS
gE
PS =
Retained E
arningst-1 / N
It-1 * RO
E=
Retention R
atio * RO
E=
b * RO
E•
Proposition 1: The expected grow
th rate in earnings for a company
cannot exceed its return on equity in the long term.
Asw
ath Dam
odaran204
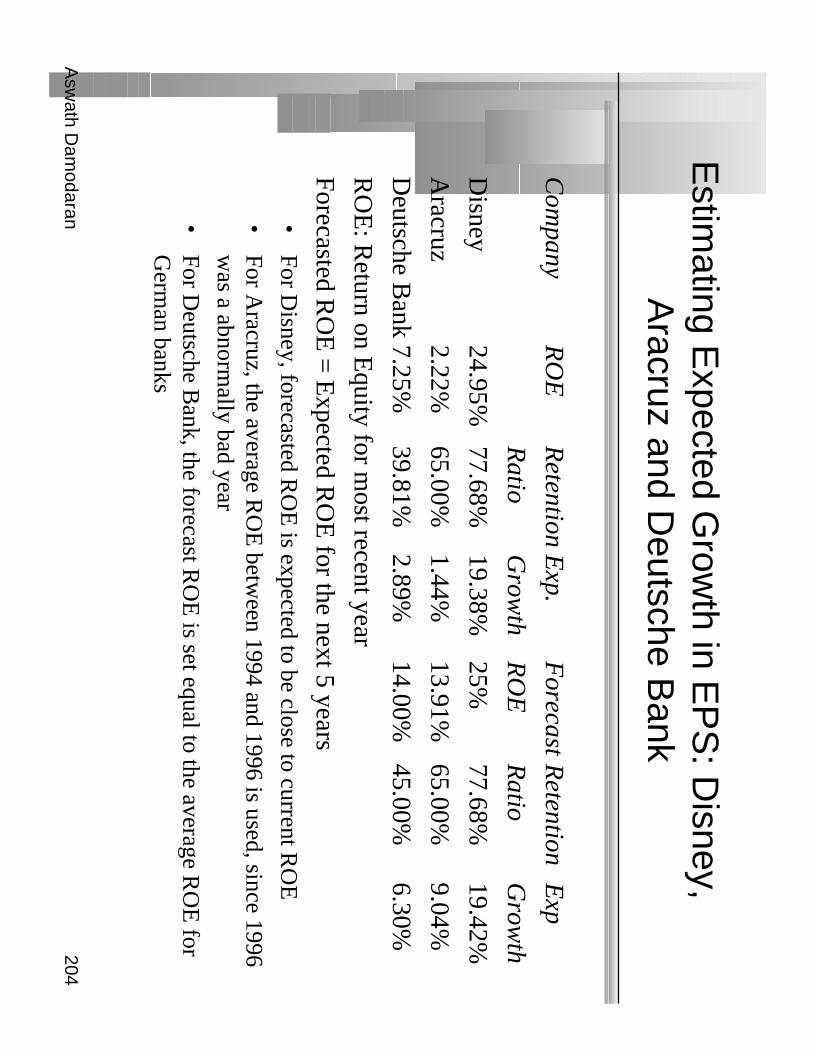
Estim
ating Expected G
rowth in E
PS
: Disney,
Aracruz and D
eutsche Bank
Com
panyR
OE
Retention
Exp.
Forecast
Retention
Exp
Ratio
Grow
thR
OE
Ratio
Grow
th
Disney
24.95%77.68%
19.38%25%
77.68%19.42%
Aracruz
2.22%65.00%
1.44%13.91%
65.00%9.04%
Deutsche B
ank7.25%
39.81%2.89%
14.00%45.00%
6.30%
RO
E: R
eturn on Equity for m
ost recent year
Forecasted RO
E =
Expected R
OE
for the next 5 years•
For Disney, forecasted R
OE
is expected to be close to current RO
E
•For A
racruz, the average RO
E betw
een 1994 and 1996 is used, since 1996w
as a abnormally bad year
•For D
eutsche Bank, the forecast R
OE
is set equal to the average RO
E for
Germ
an banks
Asw
ath Dam
odaran205
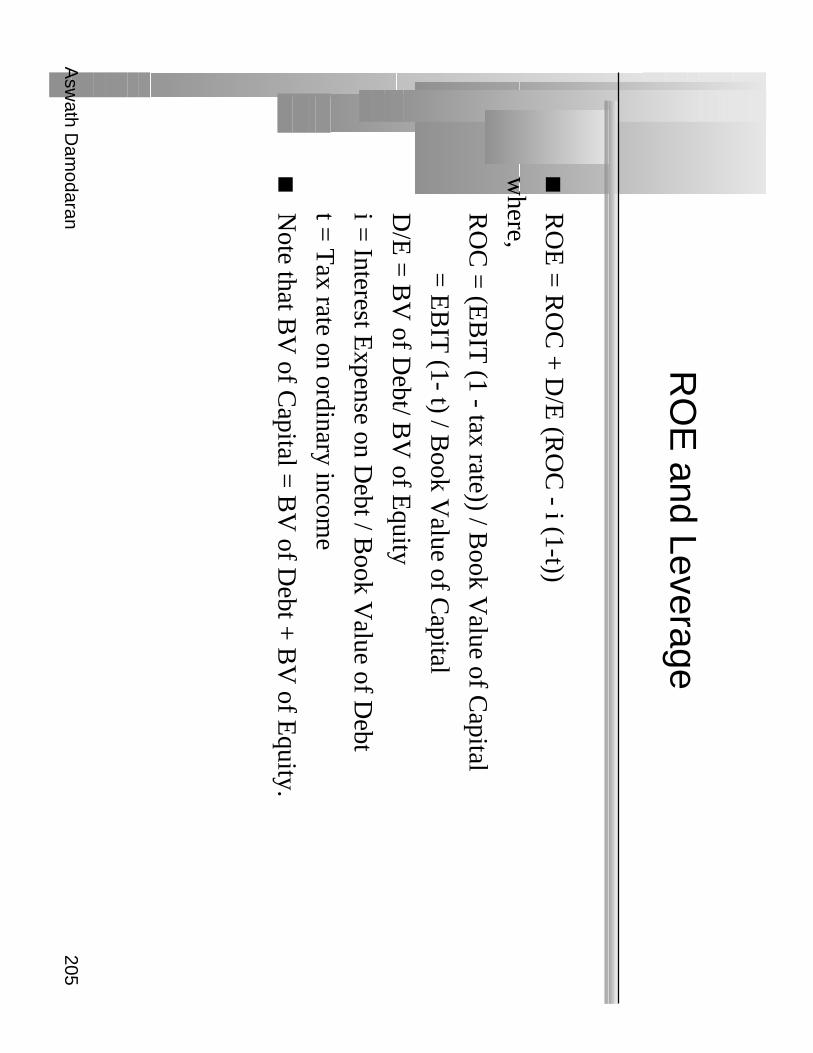
RO
E and Leverage
RO
E =
RO
C +
D/E
(RO
C - i (1-t))
where,
RO
C =
(EB
IT (1 - tax rate)) / B
ook Value of C
apital
= E
BIT
(1- t) / Book V
alue of Capital
D/E
= B
V of D
ebt/ BV
of Equity
i = Interest E
xpense on Debt / B
ook Value of D
ebt
t = T
ax rate on ordinary income
Note that B
V of C
apital = B
V of D
ebt + B
V of E
quity.
Asw
ath Dam
odaran206
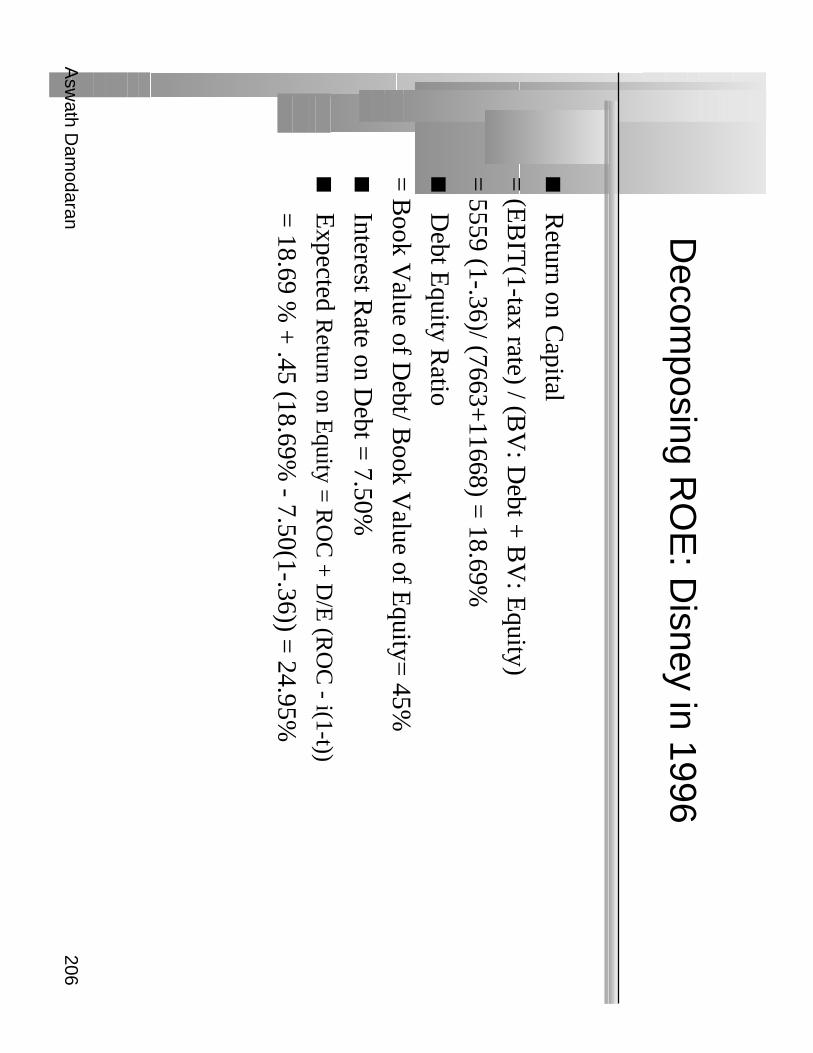
Decom
posing RO
E: D
isney in 1996
Return on C
apital
= (E
BIT
(1-tax rate) / (BV
: Debt +
BV
: Equity)
= 5559 (1-.36)/ (7663+
11668) = 18.69%
Debt E
quity Ratio
= B
ook Value of D
ebt/ Book V
alue of Equity=
45%
Interest Rate on D
ebt = 7.50%
Expected R
eturn on Equity =
RO
C +
D/E
(RO
C - i(1-t))
=
18.69 % +
.45 (18.69% - 7.50(1-.36)) =
24.95%
Asw
ath Dam
odaran207
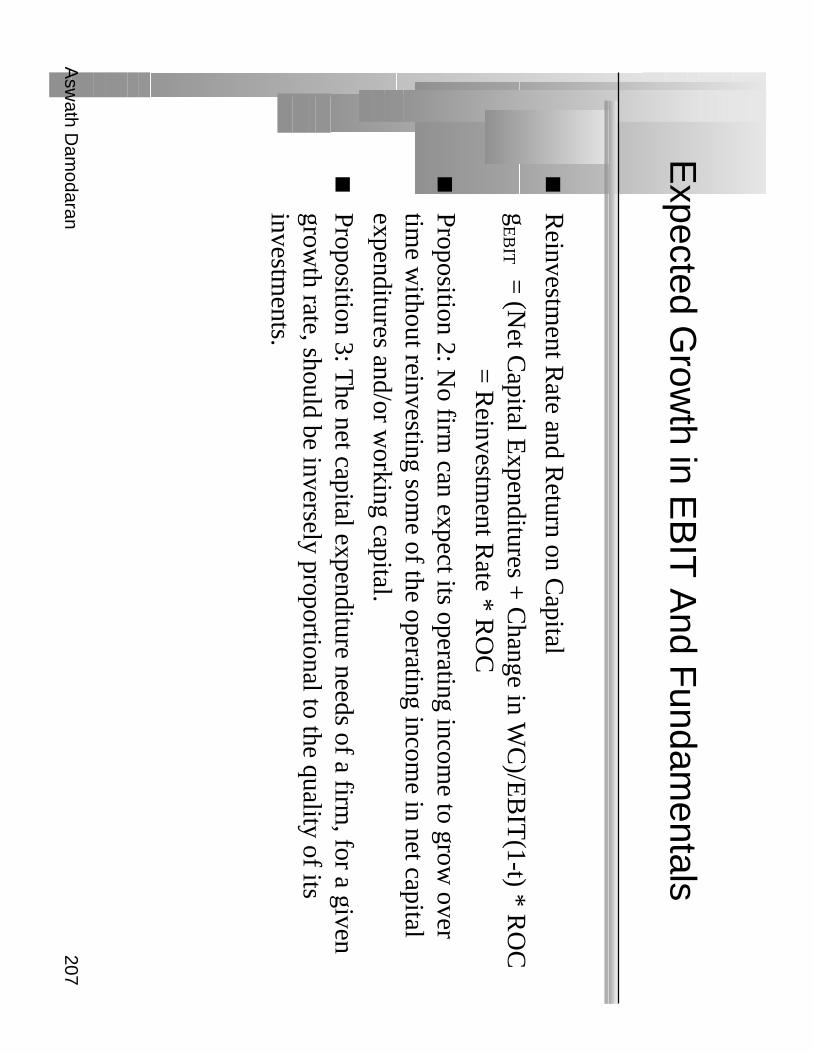
Expected G
rowth in E
BIT
And F
undamentals
Reinvestm
ent Rate and R
eturn on Capital
gE
BIT
= (N
et Capital E
xpenditures + C
hange in WC
)/EB
IT(1-t) * R
OC
= R
einvestment R
ate * RO
C
Proposition 2: No firm
can expect its operating income to grow
overtim
e without reinvesting som
e of the operating income in net capital
expenditures and/or working capital.
Proposition 3: The net capital expenditure needs of a firm
, for a givengrow
th rate, should be inversely proportional to the quality of itsinvestm
ents.
Asw
ath Dam
odaran208
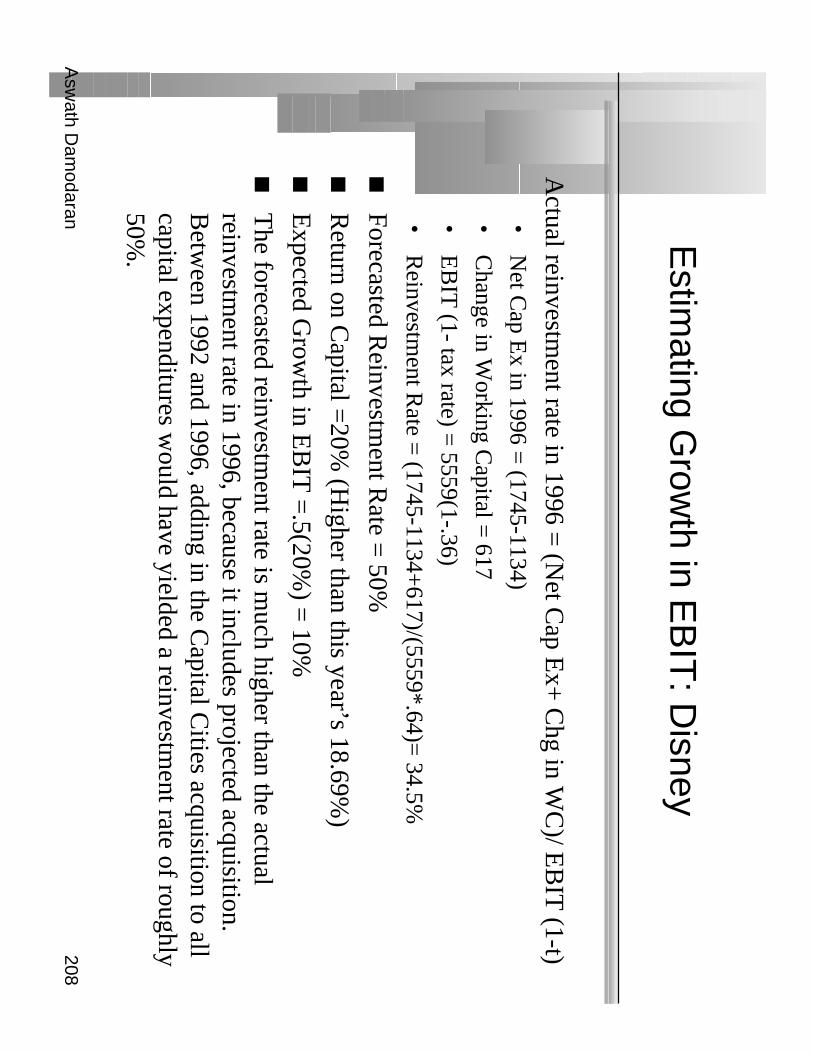
Estim
ating Grow
th in EB
IT: D
isney
Actual reinvestm
ent rate in 1996 = (N
et Cap E
x+ C
hg in WC
)/ EB
IT (1-t)
•N
et Cap E
x in 1996 = (1745-1134)
•C
hange in Working C
apital = 617
•E
BIT
(1- tax rate) = 5559(1-.36)
•R
einvestment R
ate = (1745-1134+
617)/(5559*.64)= 34.5%
Forecasted Reinvestm
ent Rate =
50%
Return on C
apital =20%
(Higher than this year’s 18.69%
)
Expected G
rowth in E
BIT
=.5(20%
) = 10%
The forecasted reinvestm
ent rate is much higher than the actual
reinvestment rate in 1996, because it includes projected acquisition.
Betw
een 1992 and 1996, adding in the Capital C
ities acquisition to allcapital expenditures w
ould have yielded a reinvestment rate of roughly
50%.
Asw
ath Dam
odaran209
Application T
est: Estim
ating Expected
Grow
th
Estim
ate the following:
•T
he reinvestment rate for your firm
•T
he after-tax return on capital
•T
he expected growth in operating incom
e, based upon these inputs

Asw
ath Dam
odaran210
IV. G
etting Closure in V
aluation
A publicly traded firm
potentially has an infinite life. The value is
therefore the present value of cash flows forever.
Since we cannot estim
ate cash flows forever, w
e estimate cash flow
sfor a “grow
th period” and then estimate a term
inal value, to capture thevalue at the end of the period:
Value =
C
Ft
(1+
r) tt
=1
t=∞
∑
Value =
C
Ft
(1+
r) tT
erminal V
alue
(1+
r)t=
1
t=N
N+
∑

Asw
ath Dam
odaran211
Stable G
rowth and T
erminal V
alue
When a firm
’s cash flows grow
at a “constant” rate forever, the presentvalue of those cash flow
s can be written as:
Value =
Expected C
ash Flow N
ext Period / (r - g)
where,
r = D
iscount rate (Cost of E
quity or Cost of C
apital)
g = E
xpected growth rate
This “constant” grow
th rate is called a stable growth rate and cannot
be higher than the growth rate of the econom
y in which the firm
operates.
While com
panies can maintain high grow
th rates for extended periods,they w
ill all approach “stable growth” at som
e point in time.
When they do approach stable grow
th, the valuation formula above
can be used to estimate the “term
inal value” of all cash flows beyond.

Asw
ath Dam
odaran212
Grow
th Patterns
A key assum
ption in all discounted cash flow m
odels is the period ofhigh grow
th, and the pattern of growth during that period. In general,
we can m
ake one of three assumptions:
•there is no high grow
th, in which case the firm
is already in stable growth
•there w
ill be high growth for a period, at the end of w
hich the growth rate
will drop to the stable grow
th rate (2-stage)
•there w
ill be high growth for a period, at the end of w
hich the growth rate
will decline gradually to a stable grow
th rate(3-stage)
The assum
ption of how long high grow
th will continue w
ill dependupon several factors including:•
the size of the firm (larger firm
-> shorter high grow
th periods)
•current grow
th rate (if high -> longer high grow
th period)
•barriers to entry and differential advantages (if high ->
longer growth
period)
Asw
ath Dam
odaran213
Length of High G
rowth P
eriod
Assum
e that you are analyzing two firm
s, both of which are enjoying
high growth. T
he first firm is E
arthlink Netw
ork, an internet serviceprovider, w
hich operates in an environment w
ith few barriers to entry
and extraordinary competition. T
he second firm is B
iogen, a bio-technology firm
which is enjoying grow
th from tw
o drugs to which it
owns patents for the next decade. A
ssuming that both firm
s are well
managed, w
hich of the two firm
s would you expect to have a longer
high growth period?
Earthlink N
etwork
Biogen
Both are w
ell managed and should have the sam
e high growth period
Asw
ath Dam
odaran214
Choosing a G
rowth P
attern: Exam
ples
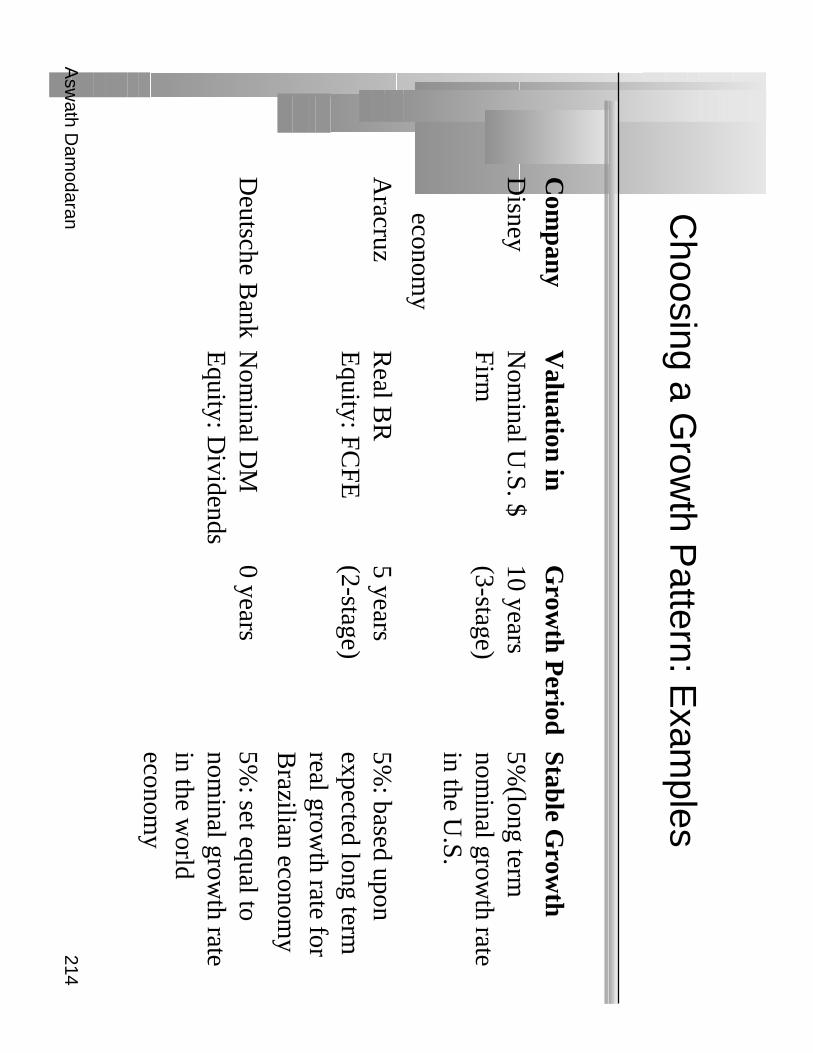
Com
panyV
aluation in G
rowth P
eriodStable G
rowth
Disney
Nom
inal U.S. $
10 years5%
(long term
Firm(3-stage)
nominal grow
th ratein the U
.S.econom
y
Aracruz
Real B
R5 years
5%: based upon
Equity: FC
FE(2-stage)
expected long termreal grow
th rate forB
razilian economy
Deutsche B
ankN
ominal D
M0 years
5%: set equal to
Equity: D
ividendsnom
inal growth rate
in the world
economy
Asw
ath Dam
odaran215
Firm
Characteristics as G
rowth C
hanges
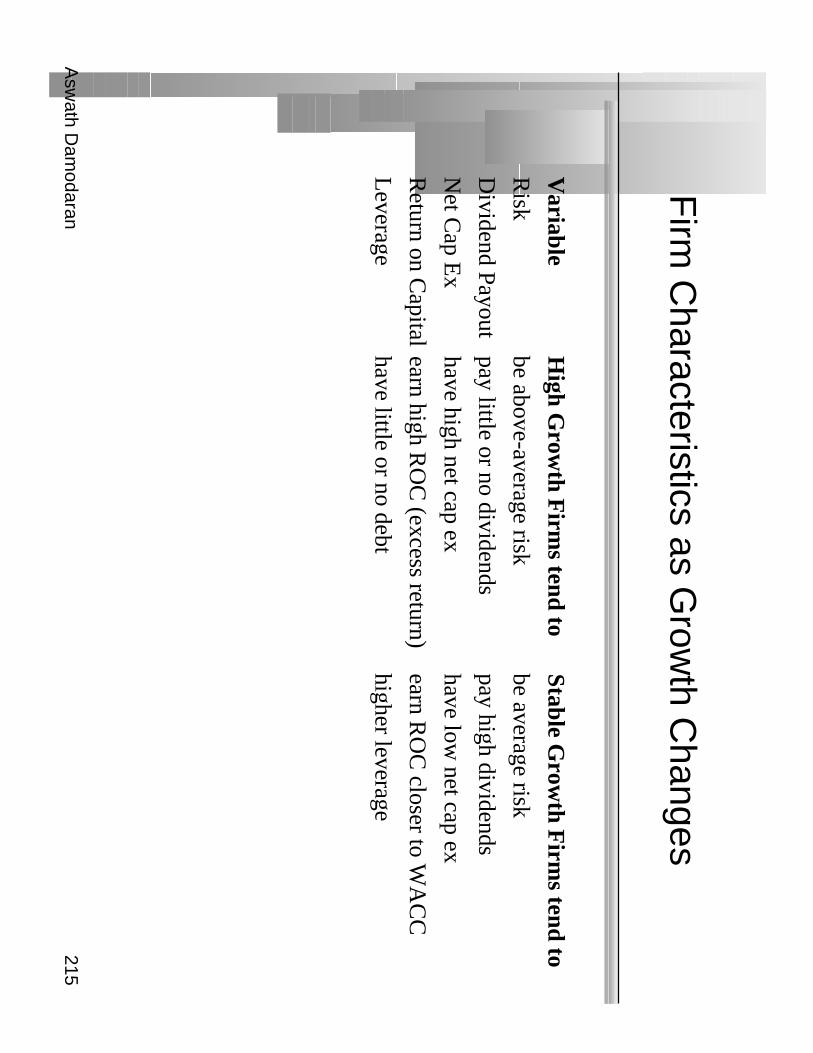
Variable
High G
rowth F
irms tend to
Stable Grow
th Firm
s tend to
Risk
be above-average riskbe average risk
Dividend Payout
pay little or no dividendspay high dividends
Net C
ap Ex
have high net cap exhave low
net cap ex
Return on C
apitalearn high R
OC
(excess return)earn R
OC
closer to WA
CC
Leverage
have little or no debthigher leverage
Asw
ath Dam
odaran216
Estim
ating Stable G
rowth Inputs
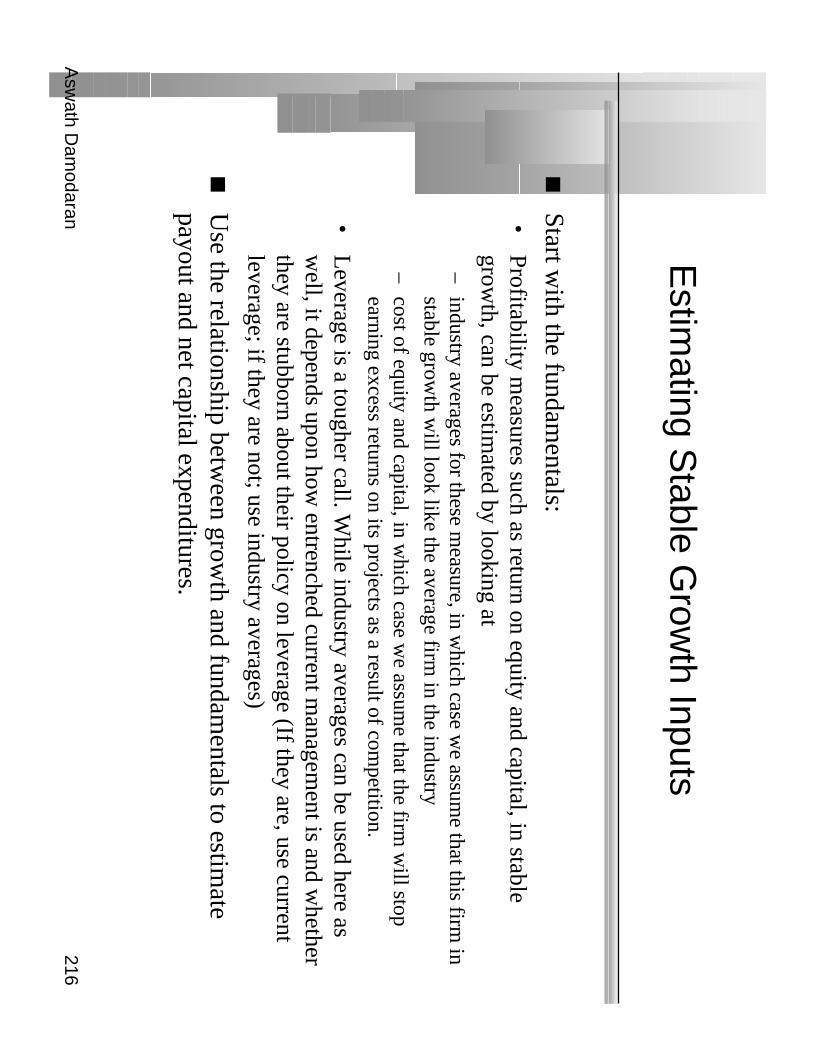
Start with the fundam
entals:•
Profitability measures such as return on equity and capital, in stable
growth, can be estim
ated by looking at–
industry averages for these measure, in w
hich case we assum
e that this firm in
stable growth w
ill look like the average firm in the industry
–cost of equity and capital, in w
hich case we assum
e that the firm w
ill stopearning excess returns on its projects as a result of com
petition.
•L
everage is a tougher call. While industry averages can be used here as
well, it depends upon how
entrenched current managem
ent is and whether
they are stubborn about their policy on leverage (If they are, use currentleverage; if they are not; use industry averages)
Use the relationship betw
een growth and fundam
entals to estimate
payout and net capital expenditures.
Asw
ath Dam
odaran217
Estim
ating Stable P
eriod Net C
ap Ex
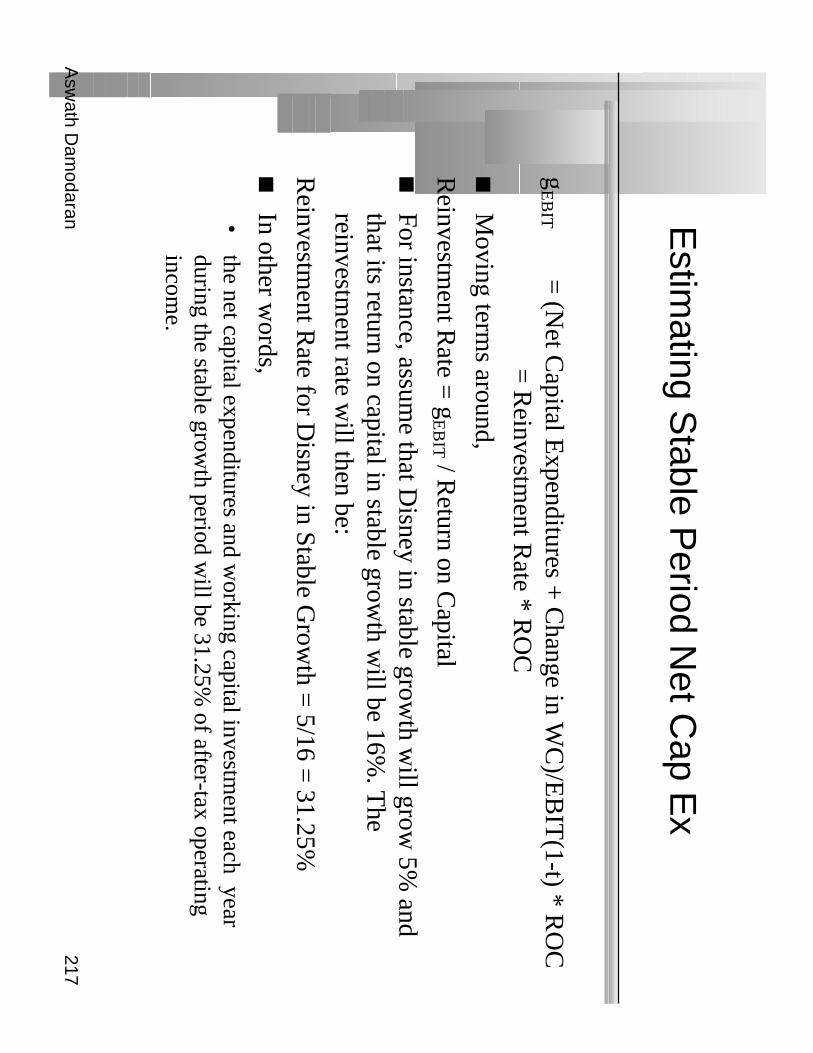
gE
BIT
= (N
et Capital E
xpenditures + C
hange in WC
)/EB
IT(1-t) * R
OC
= R
einvestment R
ate * RO
C
Moving term
s around,
Reinvestm
ent Rate =
gE
BIT / R
eturn on Capital
For instance, assume that D
isney in stable growth w
ill grow 5%
andthat its return on capital in stable grow
th will be 16%
. The
reinvestment rate w
ill then be:
Reinvestm
ent Rate for D
isney in Stable Grow
th = 5/16 =
31.25%
In other words,
•the net capital expenditures and w
orking capital investment each year
during the stable growth period w
ill be 31.25% of after-tax operating
income.

Asw
ath Dam
odaran218
Valuation: D
eutsche Bank
Sustainable growth at D
eutsche Bank =
RO
E * R
etention Ratio
= 14%
(.45) = 6.30%
{ I used the normalized num
bers for this]
Cost of equity =
7.5% +
0.94 (5.5%) =
12.67%.
Current D
ividends per share = 2.61 D
M
Model U
sed:•
Stable Grow
th (Large firm
; Grow
th is close to stable growth already)
•D
ividend Discount M
odel (FCFE
is tough to estimate)
Valuation
•E
xpected Dividends per Share next year =
2.61 DM
(1.063) = 2.73 D
M
•V
alue per Share = 2.73 D
M / (.1267 - .063) =
42.89 DM
Deutsche B
ank was trading for 119 D
M on the day of this analysis.
Asw
ath Dam
odaran219
What does the valuation tell us?
Stock is tremendously overvalued: T
his valuation would suggest that
Deutsche B
ank is significantly overvalued, given our estimates of
expected growth and risk.
Dividends m
ay not reflect the cash flows generated by D
eutsche Bank.
TheFC
FE could have been significantly higher than the dividends
paid.
Estim
ates of growth and risk are w
rong: It is also possible that we
have underestimated grow
th or overestimated risk in the m
odel, thusreducing our estim
ate of value.

Asw
ath Dam
odaran220
Valuation: A
racruz Cellulose
The current earnings per share for A
racruz Cellulose is 0.044 B
R.
These earnings are abnorm
ally low. T
o normalize earnings, w
e use theaverage earnings per share betw
een 1994 and 1996 of 0.204 BR
pershare as a m
easure of the normalized earnings per share.
Model U
sed:•
Real valuation (since inflation is still in double digits)
•2-Stage G
rowth (Firm
is still growing in a high grow
th economy)
•FC
FE D
iscount Model (D
ividends are lower than FC
FE: See D
ividendsection)
Asw
ath Dam
odaran221
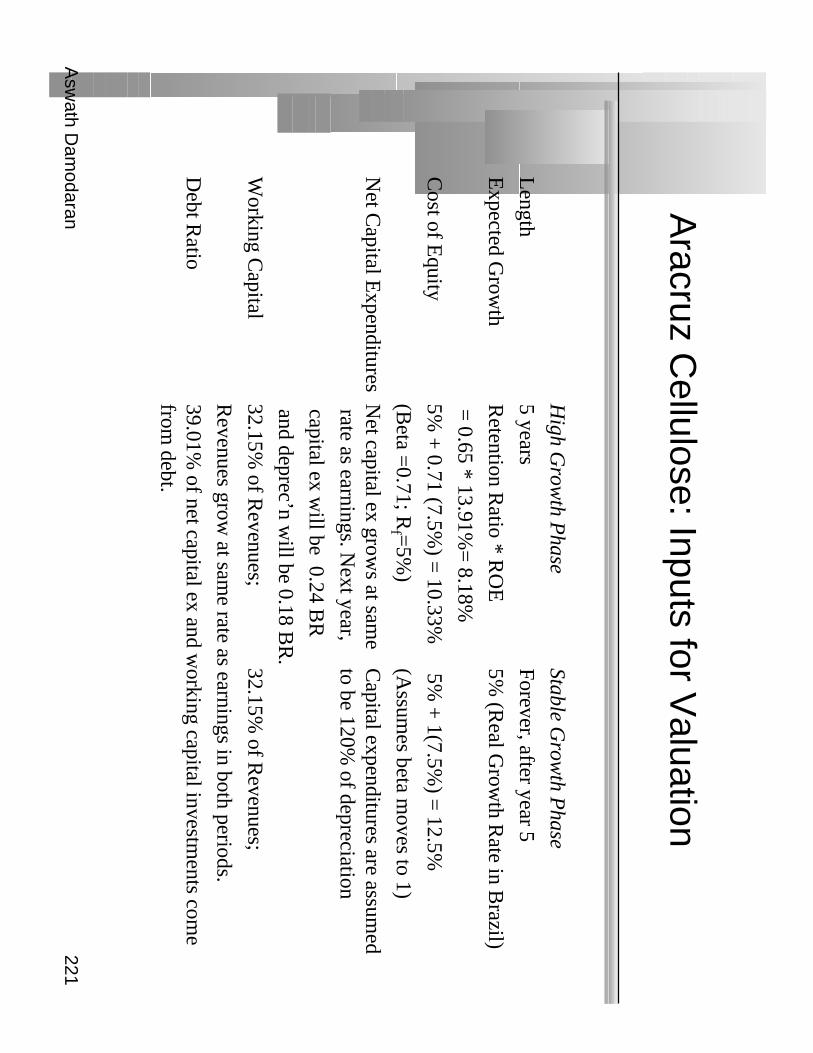
Aracruz C
ellulose: Inputs for Valuation
High G
rowth P
haseStable G
rowth P
hase
Length
5 yearsForever, after year 5
Expected G
rowth
Retention R
atio * RO
E5%
(Real G
rowth R
ate in Brazil)
= 0.65 * 13.91%
= 8.18%
Cost of E
quity5%
+ 0.71 (7.5%
) = 10.33%
5% +
1(7.5%) =
12.5%
(Beta =
0.71; Rf =
5%)
(Assum
es beta moves to 1)
Net C
apital Expenditures
Net capital ex grow
s at same
Capital expenditures are assum
ed rate as earnings. N
ext year, to be 120%
of depreciation
capital ex will be 0.24 B
R
and deprec’n will be 0.18 B
R.
Working C
apital32.15%
of Revenues;
32.15% of R
evenues;
Revenues grow
at same rate as earnings in both periods.
Debt R
atio39.01%
of net capital ex and working capital investm
ents come
from debt.
Asw
ath Dam
odaran222
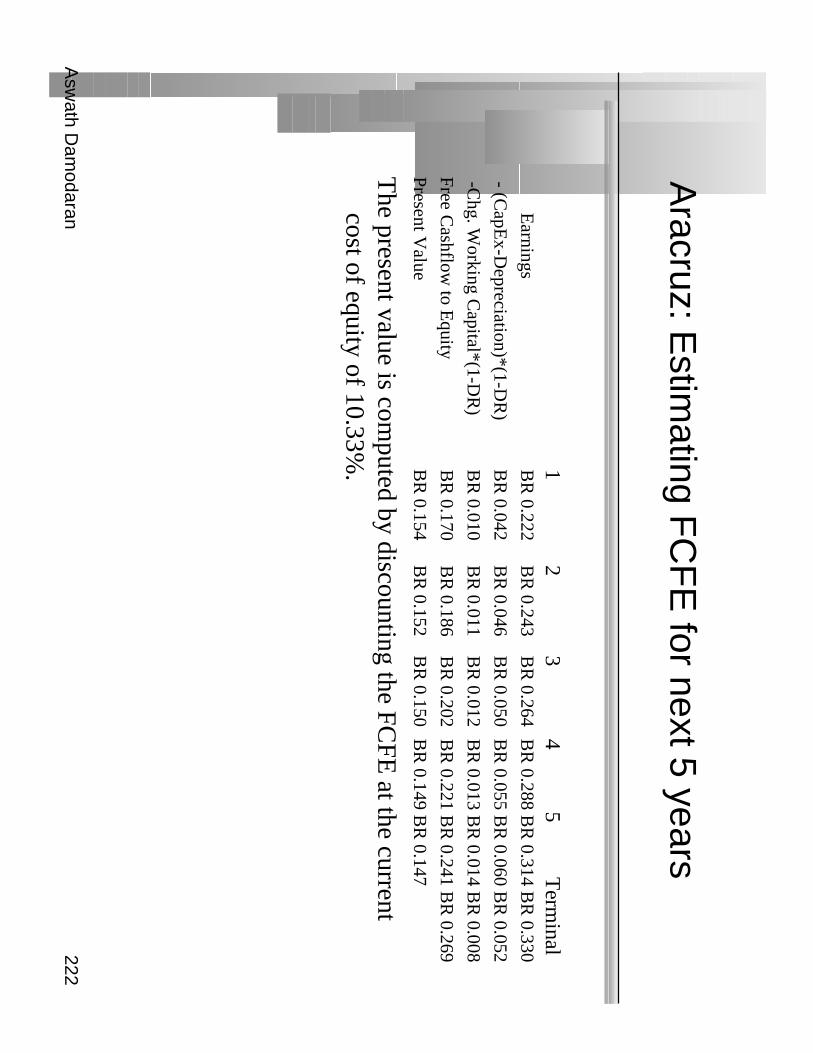
Aracruz: E
stimating F
CF
E for next 5 years
12
34
5T
erminal
Earnings
BR
0.222 B
R 0.243
BR
0.264 B
R 0.288 B
R 0.314 B
R 0.330
- (CapE
x-Depreciation)*(1-D
R)
BR
0.042 B
R 0.046
BR
0.050 B
R 0.055 B
R 0.060 B
R 0.052
-Chg. W
orking Capital*(1-D
R)
BR
0.010 B
R 0.011
BR
0.012 B
R 0.013 B
R 0.014 B
R 0.008
Free Cashflow
to Equity
BR
0.170 B
R 0.186
BR
0.202 B
R 0.221 B
R 0.241 B
R 0.269
Present Value
BR
0.154 B
R 0.152
BR
0.150 B
R 0.149 B
R 0.147
The present value is com
puted by discounting the FCFE
at the currentcost of equity of 10.33%
.
Asw
ath Dam
odaran223
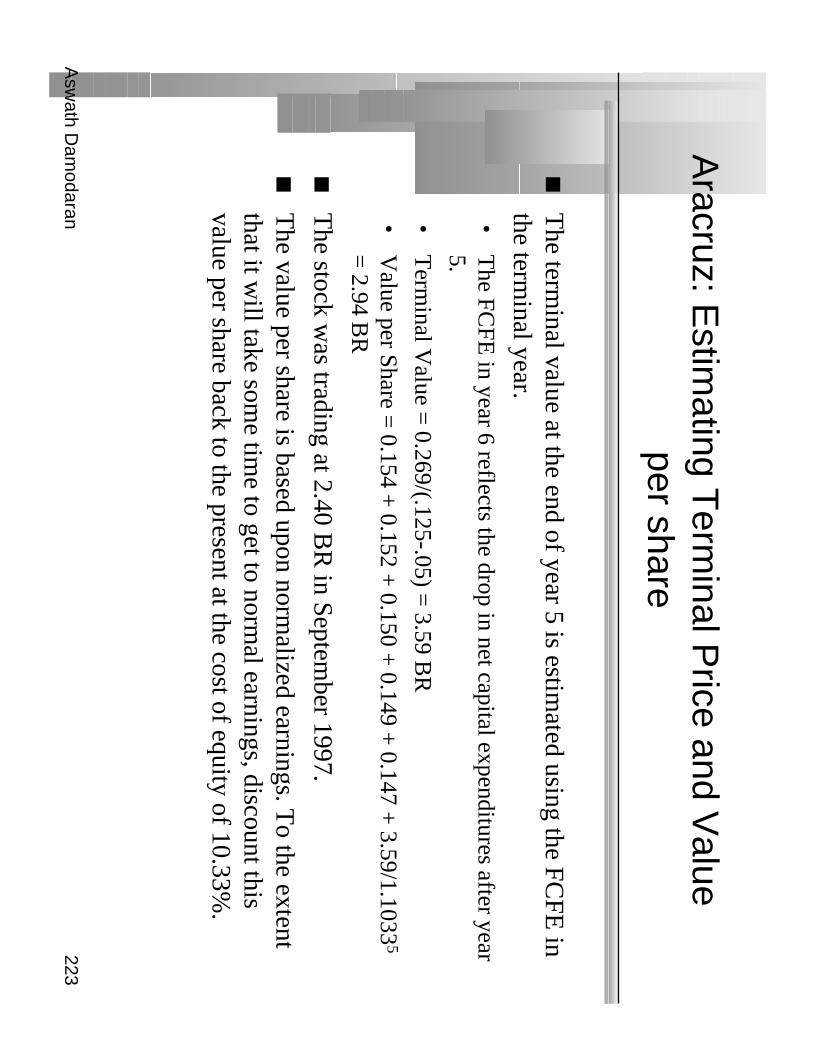
Aracruz: E
stimating T
erminal P
rice and Value
per share
The term
inal value at the end of year 5 is estimated using the FC
FE in
the terminal year.
•T
he FCFE
in year 6 reflects the drop in net capital expenditures after year5.
•T
erminal V
alue = 0.269/(.125-.05) =
3.59 BR
•V
alue per Share = 0.154 +
0.152 + 0.150 +
0.149 + 0.147 +
3.59/1.10335
= 2.94 B
R
The stock w
as trading at 2.40 BR
in September 1997.
The value per share is based upon norm
alized earnings. To the extent
that it will take som
e time to get to norm
al earnings, discount thisvalue per share back to the present at the cost of equity of 10.33%
.
Asw
ath Dam
odaran224
Disney V
aluation
Model U
sed:•
Cash Flow
: FCFF (since I think leverage w
ill change over time)
•G
rowth Pattern: 3-stage M
odel (even though growth in operating incom
eis only 10%
, there are substantial barriers to entry)

Asw
ath Dam
odaran225
Disney: Inputs to V
aluation
High G
rowth P
haseT
ransition Phase
Stable Grow
th Phase
Length of Period
5 years5 years
Forever after 10 years
Revenues
Current R
evenues: $
18,739;
Expected to grow
at same rate a
operating earnings
Continues to grow
at same rate
as operating earnings
Grow
s at stable growth rate
Pre-tax Operating M
argin29.67%
of revenues, based upon
1996 EB
IT of $ 5,559 m
illion.
Increases gradually to 32%
of
revenues, due to economies of
scale.
Stable margin is assum
ed to be
32%.
Tax R
ate36%
36%36%
Return on C
apital20%
(approximately 1996 level)
Declines linearly to 16%
Stable RO
C of 16%
Working C
apital5%
of Revenues
5% of R
evenues5%
of Revenues
Reinvestm
ent Rate
(Net C
ap Ex +
Working C
apital
Investments/E
BIT
)
50%
of after-tax
operating
income; D
epreciation in 1996 is
$ 1,134 m
illion, and is assumed
to grow at sam
e rate as earnings
Declines to 31.25%
as RO
C and
growth rates drop:
Reinvestm
ent Rate = g/R
OC
31.25% of
after-tax operating
income; this is estim
ated from
the growth rate of 5%
Reinvestm
ent rate = g/R
OC
Expected G
rowth R
ate in EB
ITR
OC
*
Reinvestm
ent R
ate =
20% * .5 =
10%
Linear decline to S
table Grow
th
Rate
5%, based upon overall nom
inal
economic grow
th
Debt/C
apital Ratio
18%Increases linearly to 30%
Stable debt ratio of 30%
Risk Param
etersB
eta = 1.25, ke =
13.88%
Cost of D
ebt = 7.5%
(Long T
erm B
ond Rate =
7%)
Beta decreases linearly to 1.00;
Cost of debt stays at 7.5%
Stable beta is 1.00.
Cost of debt stays at 7.5%
Asw
ath Dam
odaran226
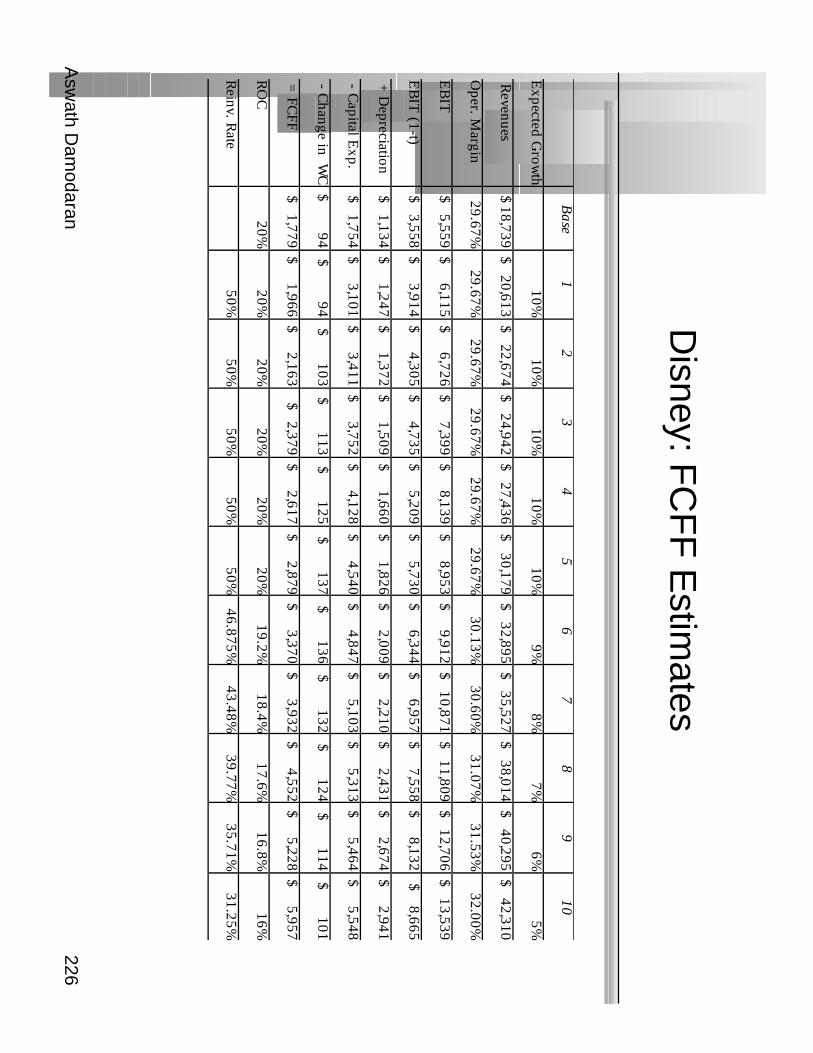
Disney: F
CF
F E
stimates
Base
12
34
56
78
910
Expected G
rowth
10%10%
10%10%
10%9%
8%7%
6%5%
Revenues
$ 18,739 $ 20,613
$ 22,674 $ 24,942
$ 27,436 $ 30,179
$ 32,895 $ 35,527
$ 38,014 $ 40,295
$ 42,310
Oper. M
argin29.67%
29.67%29.67%
29.67%29.67%
29.67%30.13%
30.60%31.07%
31.53%32.00%
EB
IT $ 5,559
$ 6,115 $ 6,726
$ 7,399 $ 8,139
$ 8,953 $ 9,912
$ 10,871 $ 11,809
$ 12,706 $ 13,539
EB
IT (1-t)
$ 3,558 $ 3,914
$ 4,305 $ 4,735
$ 5,209 $ 5,730
$ 6,344 $ 6,957
$ 7,558 $ 8,132
$ 8,665
+ Depreciation
$ 1,134 $ 1,247
$ 1,372 $ 1,509
$ 1,660 $ 1,826
$ 2,009 $ 2,210
$ 2,431 $ 2,674
$ 2,941
- Capital E
xp. $ 1,754
$ 3,101 $ 3,411
$ 3,752 $ 4,128
$ 4,540 $ 4,847
$ 5,103 $ 5,313
$ 5,464 $ 5,548
- Change in W
C $ 94
$ 94 $ 103
$ 113 $ 125
$ 137 $ 136
$ 132 $ 124
$ 114 $ 101
= FC
FF $ 1,779
$ 1,966 $ 2,163
$ 2,379 $ 2,617
$ 2,879 $ 3,370
$ 3,932 $ 4,552
$ 5,228 $ 5,957
RO
C20%
20%20%
20%20%
20%19.2%
18.4%17.6%
16.8%16%
Reinv. R
ate50%
50%50%
50%50%
46.875%43.48%
39.77%35.71%
31.25%
Asw
ath Dam
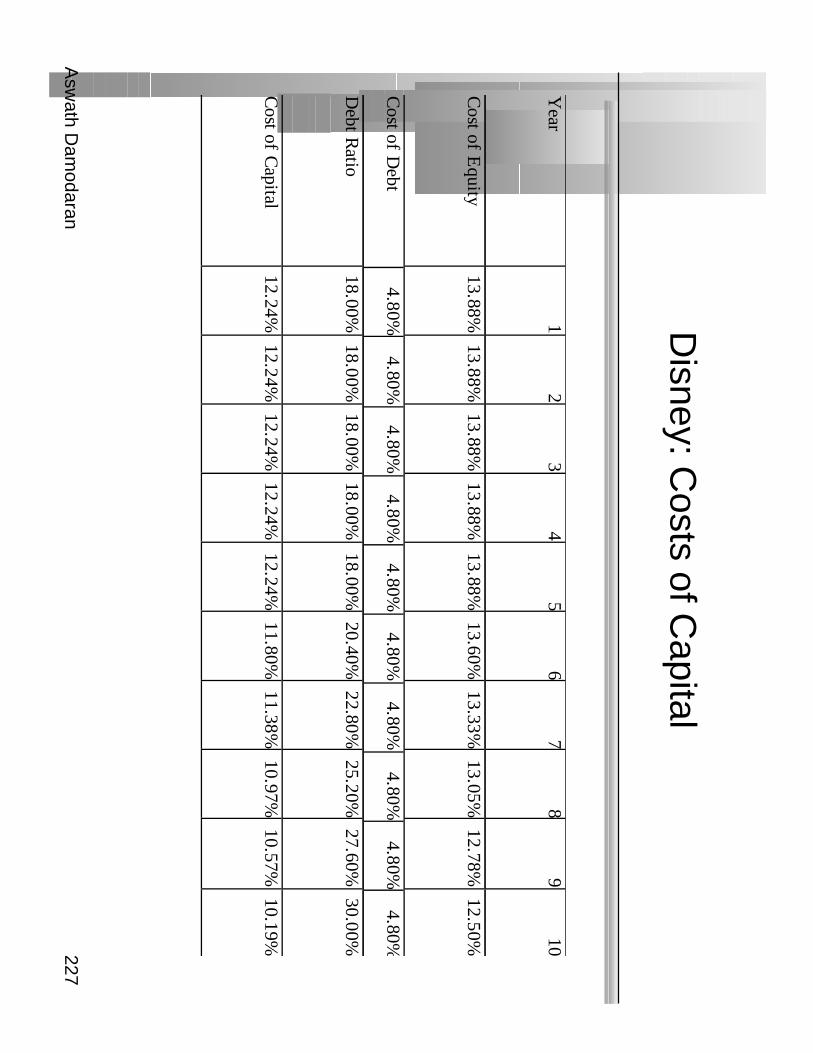
odaran227
Disney: C
osts of Capital
Year
12
34
56
78
910
Cost of E
quity13.88%
13.88%13.88%
13.88%13.88%
13.60%13.33%
13.05%12.78%
12.50%
Cost of D
ebt4.80%
4.80%4.80%
4.80%4.80%
4.80%4.80%
4.80%4.80%
4.80%
Debt R
atio18.00%
18.00%18.00%
18.00%18.00%
20.40%22.80%
25.20%27.60%
30.00%
Cost of C
apital12.24%
12.24%12.24%
12.24%12.24%
11.80%11.38%
10.97%10.57%
10.19%
Asw
ath Dam
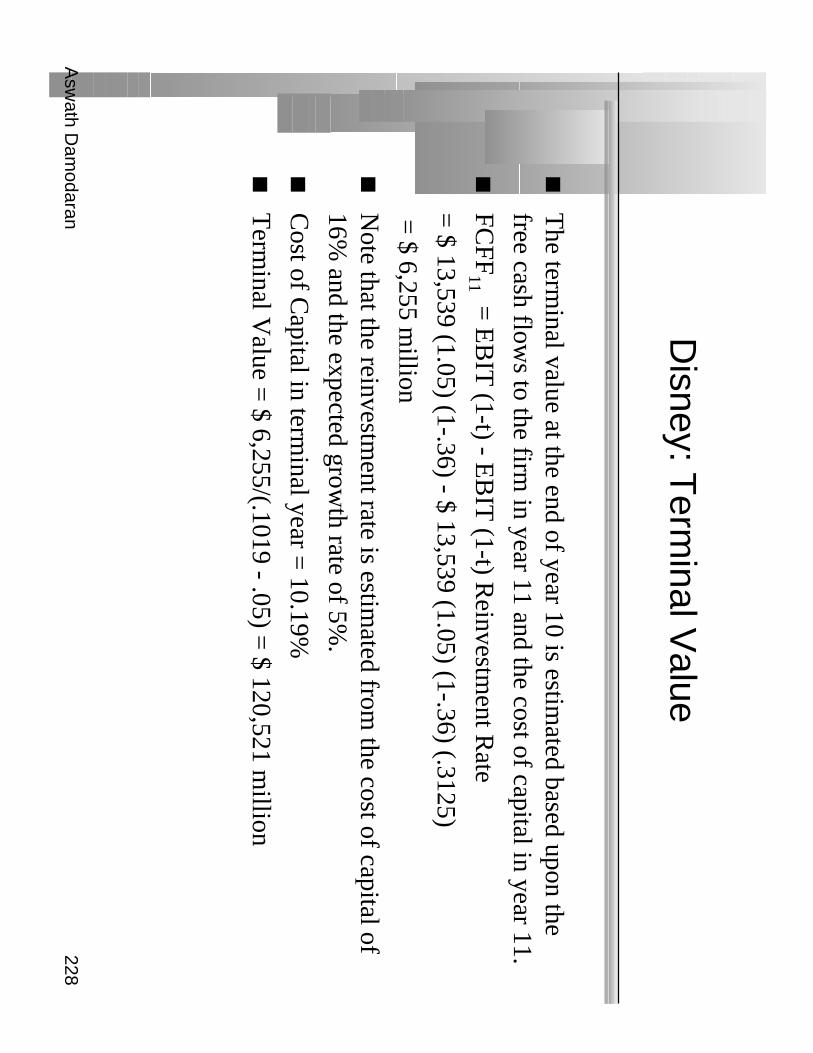
odaran228
Disney: T
erminal V
alue
The term
inal value at the end of year 10 is estimated based upon the
free cash flows to the firm
in year 11 and the cost of capital in year 11.
FCFF
11 = E
BIT
(1-t) - EB
IT (1-t) R
einvestment R
ate
= $ 13,539 (1.05) (1-.36) - $ 13,539 (1.05) (1-.36) (.3125)
= $ 6,255 m
illion
Note that the reinvestm
ent rate is estimated from
the cost of capital of16%
and the expected growth rate of 5%
.
Cost of C
apital in terminal year =
10.19%
Term
inal Value =
$ 6,255/(.1019 - .05) = $ 120,521 m
illion
Asw
ath Dam
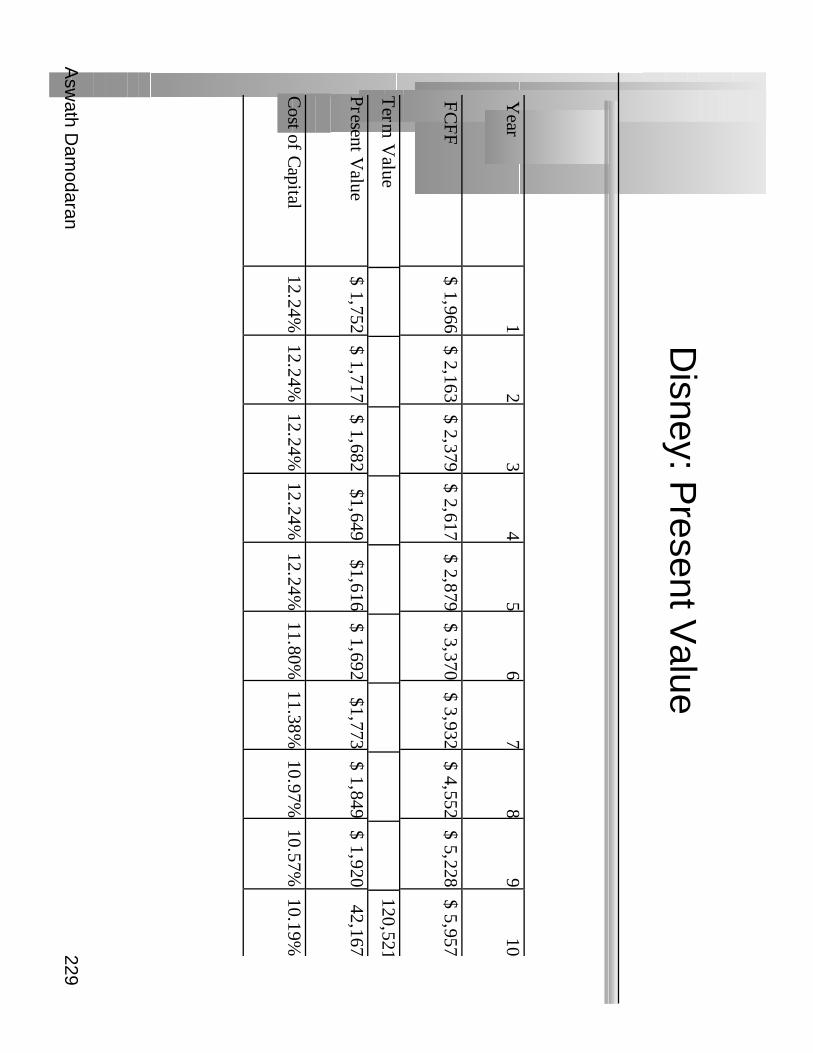
odaran229
Disney: P
resent Value
Year
12
34
56
78
910
FC
FF
$ 1,966 $ 2,163
$ 2,379 $ 2,617
$ 2,879 $ 3,370
$ 3,932 $ 4,552
$ 5,228 $ 5,957
Term
Value
120,521
Present V
alue $ 1,752
$ 1,717 $ 1,682
$1,649 $1,616
$ 1,692 $1,773
$ 1,849 $ 1,920
42,167
Cost of C
apital12.24%
12.24%12.24%
12.24%12.24%
11.80%11.38%
10.97%10.57%
10.19%
Asw
ath Dam
odaran230
Present V
alue Check
The FC
FF and costs of capital are provided for all 10 years. Confirm
the present value of the FCFF in year 7.

Asw
ath Dam
odaran231
Disney: V
alue Per S
hare
Value of the Firm
=$ 57,817 m
illion
+ V
alue of Cash =
$ 0 (almost no non-operating cash)
- Value of D
ebt =$ 11,180 m
illion
= V
alue of Equity =
$ 46,637 million
/ Num
ber of Shares675.13
Value Per Share =
$ 69.08
Asw
ath Dam
odaran232
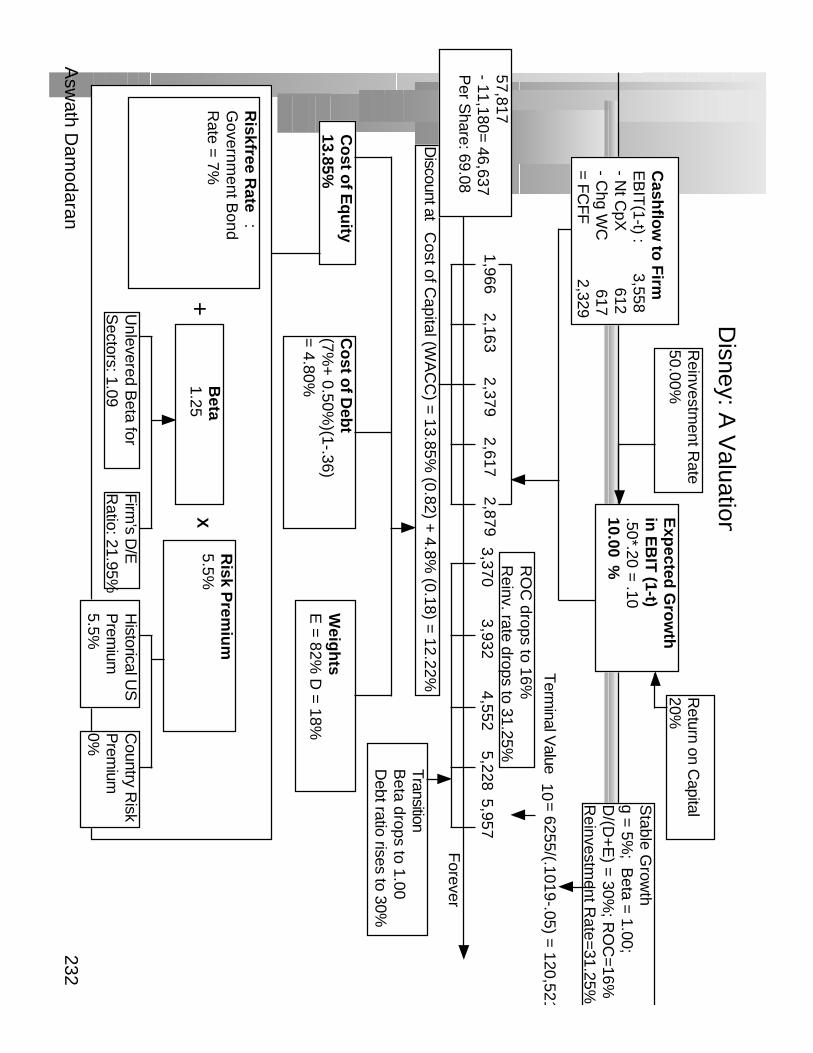
Cash
flow
to F
irmE
BIT
(1-t) : 3,558- N
t CpX
612- C
hg WC
617= F
CF
F 2,329
Exp
ected G
row
th
in E
BIT
(1-t).50*.20 =
.1010.00
%
1,9662,163
2,379 2,617
2,879
Forever
Stable G
rowth
g = 5%
; Beta =
1.00; D
/(D+
E) =
30%; R
OC
=16%
Reinvestm
ent Rate=
31.25%
Term
inal Value
10=
6255/(.1019-.05) = 120,52 1
Co
st of E
qu
ity13.85%
Co
st of D
ebt
(7%+
0.50%)(1-.36)
= 4.80%
Weig
hts
E =
82% D
= 18%
Discount at
Cost of C
apital (WA
CC
) = 13.85%
(0.82) + 4.8%
(0.18) = 12.22%
57,817- 11,180=
46,637P
er Share: 69.08
Riskfree R
ate:
Governm
ent Bond
Rate =
7%+
Beta
1.25X
Risk P
remiu
m5.5%
Unlevered B
eta for S
ectors: 1.09F
irm’s D
/ER
atio: 21.95%H
istorical US
P
remium
5.5%
Country R
iskP
remium
0%
Disney: A
Valuation
Reinvestm
ent Rate
50.00%R
eturn on Capital
20%
3,370 3,932
4,552 5,228
5,957
TransitionB
eta drops to 1.00D
ebt ratio rises to 30%
RO
C drops to 16%
Reinv. rate drops to 31.25%

Asw
ath Dam
odaran233
Th
e Investm
ent D
ecision
Invest in projects that yield a return
greater than the m
inimum
acceptablehurdle rate
Th
e Fin
ancin
g D
ecision
Choose a financing m
ix that
maxim
izes the value of the projectstaken, and
matches the assets
beingfinanced.
Th
e Divid
end
Decisio
nIf there are
not enoughinvestm
ents that earn the
hurdle rate, return the cash
tothe ow
ners
Current
EB
IT(1-t) =
$3,558 m
illion
Return on C
apital20.00%
Reinvestm
ent Rate
50%
Expected G
rowth =
RO
C * R
R=
.50 * 20%=
10%
Cost of C
apital12.22%
Determ
ine the business risk of the firm (B
eta, Default R
isk)
Equity:
Beta=
1.25D
ebt::D
efault Risk
In stable growth:
Reinvestm
ent Rate=
31.67%R
eturn on Capital = 16%
Beta =
1.00D
ebt Ratio =
30.00%C
ost of Capital =
10.19%
Transition tostable grow
thinputs
Year
EB
IT(1-t)
Reinvestm
entF
CF
FT
erminal V
aluePV
13,914
$ 1,947
$ 1,966
$ 1,752
$ 2
4,305$
2,142$
2,163$
1,717$
34,735
$ 2,356
$ 2,379
$ 1,682
$ 4
5,209$
2,343$
2,866$
1,649$
55,730
$ 2,851
$ 2,879
$ 1,616
$ 6
6,344$
2,974$
3,370$
1,692$
76,957
$ 2,762
$ 4,196
$ 1,773
$ 8
7,558$
3,006$
4,552$
1,849$
98,132
$ 2,904
$ 5,228
$ 1,920
$ 10
8,665$
2,708$
5,957$
120,521$
42,167$ 57,817$ $11,180
46,637$
69.08$
Value of D
isney =
= Value of E
quity - V
alue of Debt =
Value of D
isney/share =

Asw
ath Dam
odaran234
Relative V
aluation
In relative valuation, the value of an asset is derived from the pricing
of 'comparable' assets, standardized using a com
mon variable such as
earnings, cashflows, book value or revenues. E
xamples include --
•Price/E
arnings (P/E) ratios
–and variants (E
BIT
multiples, E
BIT
DA
multiples, C
ash Flow m
ultiples)
•Price/B
ook (P/BV
) ratios–
and variants (Tobin's Q
)
•Price/Sales ratios
Asw
ath Dam
odaran235
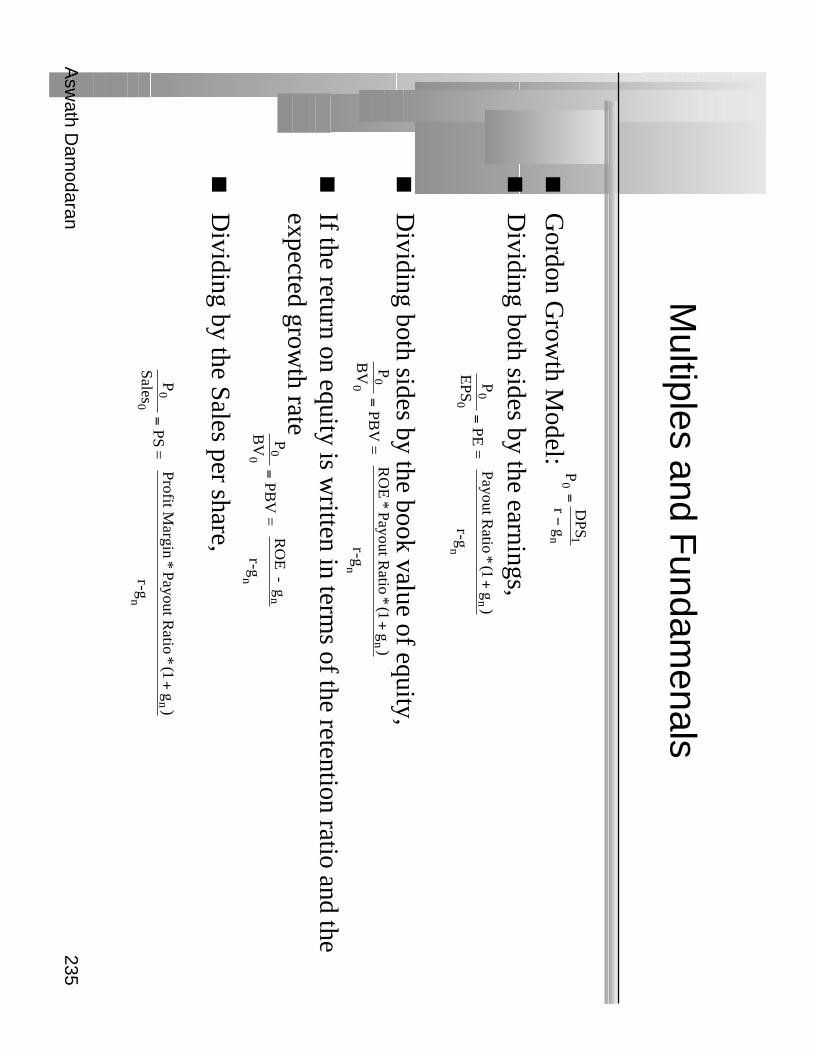
Multiples and F
undamenals
Gordon G
rowth M
odel:
Dividing both sides by the earnings,
Dividing both sides by the book value of equity,
If the return on equity is written in term
s of the retention ratio and theexpected grow
th rate
Dividing by the Sales per share,
P0=
DP
S1
r−
gn
P0
EP
S0=
PE
= P
ayout Ratio
*(1+
gn )
r-gn
P0
BV
0=
PB
V=
RO
E - g
n
r-gn
P0
BV
0=
PB
V=
RO
E*
Payout R
atio*
(1+
gn )
r-gn
P0
Sales0
=P
S=
Profit M
argin*
Payout R
atio*
(1+
gn )
r-gn
Asw
ath Dam
odaran236
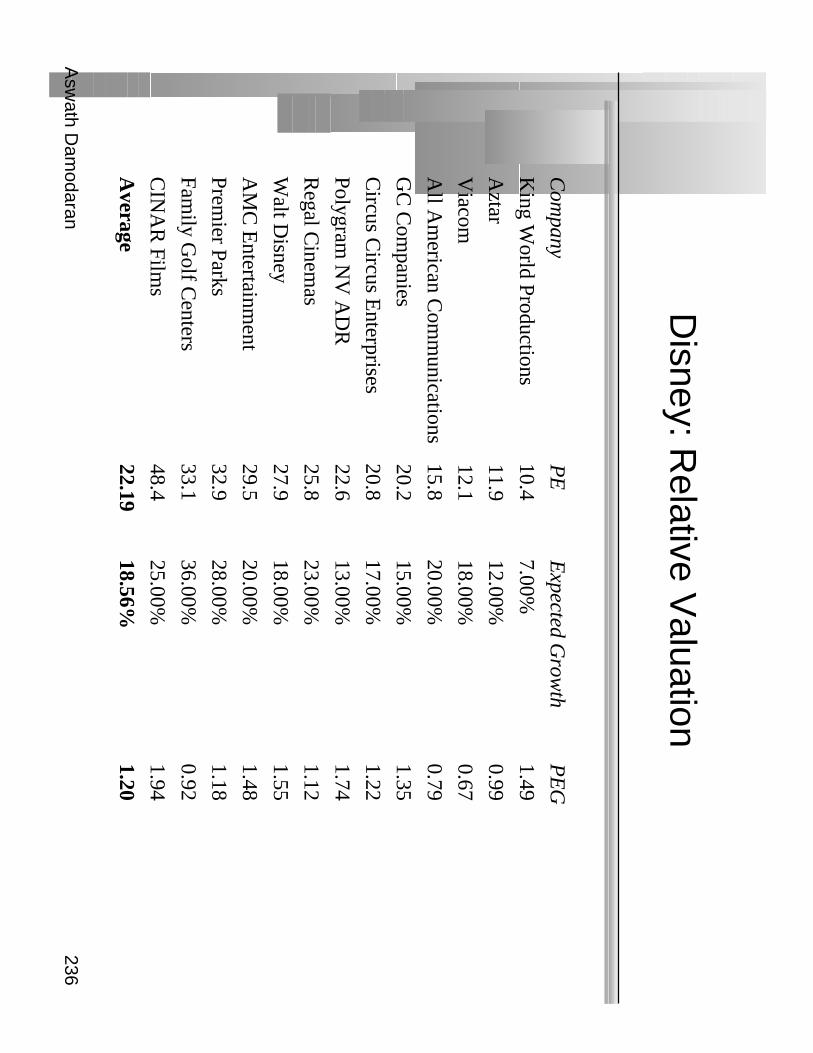
Disney: R
elative Valuation
Com
panyP
EE
xpected Grow
thP
EG
King W
orld Productions10.4
7.00%1.49
Aztar
11.912.00%
0.99
Viacom
12.118.00%
0.67
All A
merican C
omm
unications15.8
20.00%0.79
GC
Com
panies20.2
15.00%1.35
Circus C
ircus Enterprises
20.817.00%
1.22
Polygram N
V A
DR
22.613.00%
1.74
Regal C
inemas
25.823.00%
1.12
Walt D
isney27.9
18.00%1.55
AM
C E
ntertainment
29.520.00%
1.48
Premier Parks
32.928.00%
1.18
Family G
olf Centers
33.136.00%
0.92
CIN
AR
Films
48.425.00%
1.94
Average
22.1918.56%
1.20

Asw
ath Dam
odaran237
Is Disney fairly valued?
Based upon the PE
ratio, is Disney under, over or correctly valued?
Under V
alued
Over V
alued
Correctly V
alued
Based upon the PE
G ratio, is D
isney under valued?
Under V
alued
Over V
alued
Correctly V
alued
Will this valuation give you a higher or low
er valuation than thediscounted C
F valutaion?
Higher
Low
er

Asw
ath Dam
odaran238
Relative V
aluation Assum
ptions
Assum
e that you are reading an equity research report where a buy
recomm
endation for a company is being based upon the fact that its PE
ratio is lower than the average for the industry. Im
plicitly, what is the
underlying assumption or assum
ptions being made by this analyst?
The sector itself is, on average, fairly priced
The earnings of the firm
s in the group are being measured consistently
The firm
s in the group are all of equivalent risk
The firm
s in the group are all at the same stage in the grow
th cycle
The firm
s in the group are of equivalent risk and have similar cash
flow patterns
All of the above
Asw
ath Dam
odaran239
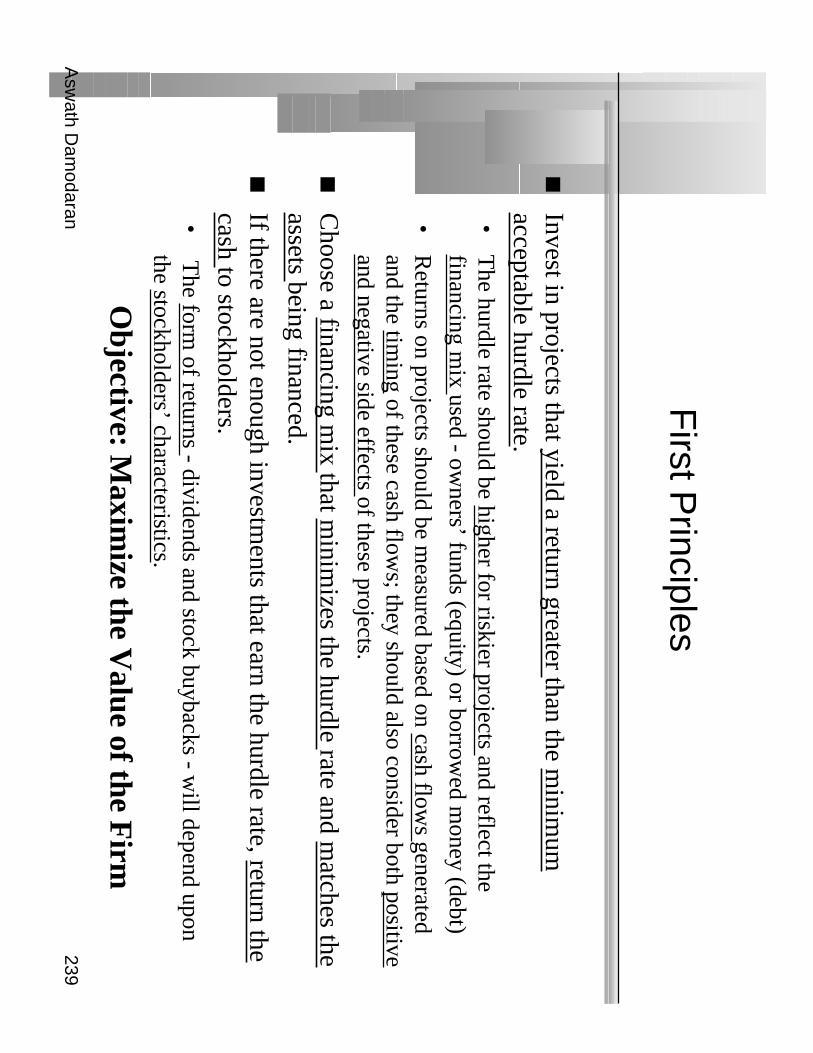
First P
rinciples
Invest in projects that yield a return greater than the minim
umacceptable hurdle rate.•
The hurdle rate should be higher for riskier projects and reflect the
financing mix used - ow
ners’ funds (equity) or borrowed m
oney (debt)
•R
eturns on projects should be measured based on cash flow
s generatedand the tim
ing of these cash flows; they should also consider both positive
and negative side effects of these projects.
Choose a financing m
ix that minim
izes the hurdle rate and matches the
assets being financed.
If there are not enough investments that earn the hurdle rate, return the
cash to stockholders.•
The form
of returns - dividends and stock buybacks - will depend upon
the stockholders’ characteristics.
Objective: M
aximize the V
alue of the Firm


