

Austin’s industrial rates continue their steady rise despite roller coaster of vacancy rates
Research & Forecast Report
AUSTIN | INDUSTRIALQ1 2019
Kaitlin Holm Research and Marketing Coordinator | Austin
Austin’s industrial market posted 294,233 square feet of negative net absorption in the first quarter of 2019. Activity levels remained high as a large number of sizeable tenants occupied significant blocks of space over the quarter including Hajoca Corporation, a plumbing, heating and industrial supplies company that moved into 75,600 square feet at 10519 Boyer Boulevard in the North submarket.
Looking forward, eighteen blocks of space over 10,000 SF will be occupied by new tenants in the second quarter of 2019. One of these tenants is TireHub, who is taking 40,467 square feet at 2300 Scarbrough Drive in the North submarket.
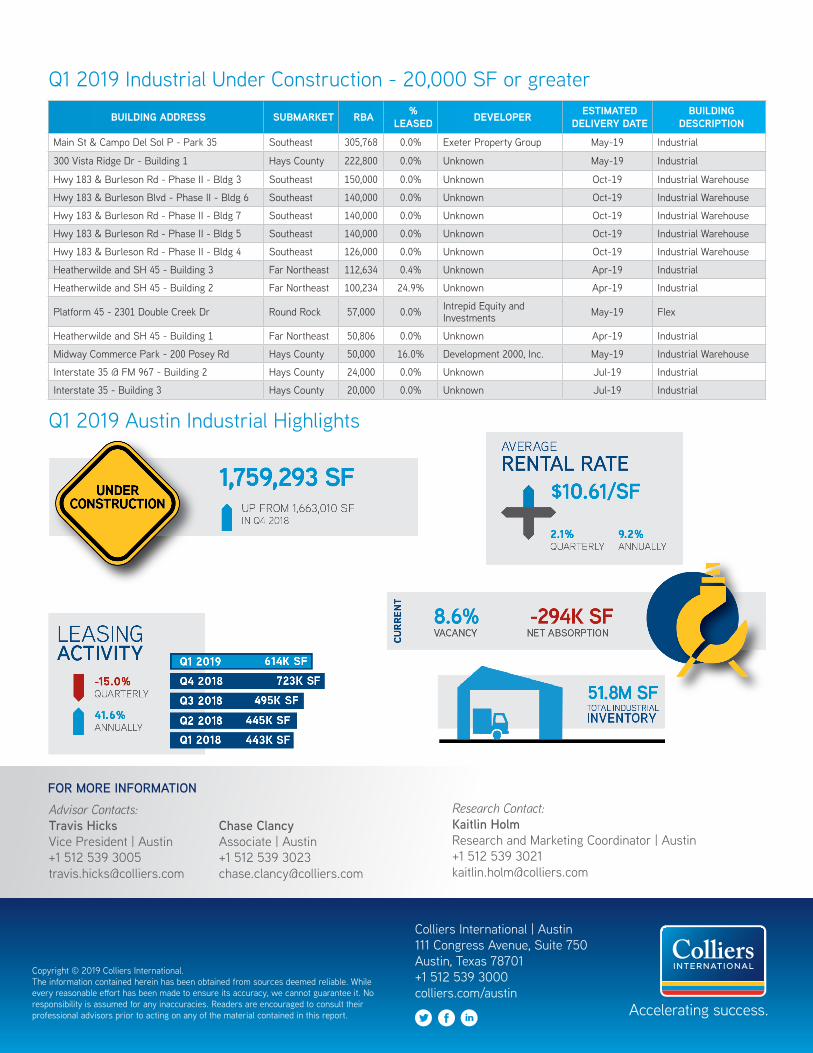
Austin’s citywide average rental rates increased moderately over the quarter, moving up from $10.39 per square foot in Q4 2018 to $10.61 per square foot in Q1 2019. The average citywide Flex/R&D rental rate increased significantly to $14.16 per square foot up from $13.17, while the average Warehouse/Distribution rental rate decreased slightly over the quarter from $8.73 per square foot to $8.61 per square foot.
In the first quarter, Austin’s industrial market had eight buildings deliver and fifteen new buildings began construction. Five of the new buildings under construction are a part of Phase II at Park 183. Buildings 3 through 7, totalling 696,000 square feet, are located at Highway 183 and Burleson Road in the Southeast submarket.
In all, 1,759,293 square feet of industrial supply was under construction consisting of twenty-four projects. Only one of these developments, 1481 Robert S. Light Boulevard, is a build-to-suit project. 957,992 square feet of projects in the development pipeline are scheduled to deliver in the second quarter and 67,849 square feet of that inventory is pre-leased.
Summary Statistics Austin Industrial Market Q1 2018 Q4 2018 Q1 2019
Vacancy Rate 7.5% 7.5% 8.6%
Net Absorption (SF) 429,947 464,919 -294,233
New Construction (SF) 837,441 861,274 1,048,401
Under Construction (SF) 1,066,107 1,663,010 1,759,293
Asking Rents Per Square Foot Per Year
Average $9.71 $10.39 $10.61
Warehouse/Distribution $8.55 $8.73 $8.61
Flex/R&D $12.61 $13.17 $14.16
Market IndicatorsRelative to prior period
AnnualChange
Quarterly Change
Quarterly Forecast*
VACANCY
NET ABSORPTION
NEW CONSTRUCTION
UNDER CONSTRUCTION
*Projected

In January, Black Creek Industrial REIT purchased the 119,400 SF industrial distribution building from St. Croix Capital Realty Advisors. The building is currently 100% leased by five different tenants. The building sold for $8,100,000 ($67.84/SF).
6110 Trade Center Drive
Job Growth & Unemployment(not seasonally adjusted)
UNEMPLOYMENT 2/18 2/19
AUSTIN 3.1% 3.0%
TEXAS 4.1% 3.9%
U.S. 4.4% 4.1%
JOB GROWTHAnnual Change
# of Jobs Added
AUSTIN 2.2% 23.2K
TEXAS 2.2% 273.2K
U.S. 1.7% 2.5M
The 50,000 SF industrial warehouse building was purchased in January by Donald and Lynne O’Connor, for $2,500,00 ($50.00/SF), from Taylor Economic Development Corp.
2 Austin Research & Forecast Report | Q1 2019 | Industrial | Colliers International
Sales ActivitySources: Real Capital Analytics and CoStar
Q1 2019
No. of Properties: 16
Total SF: 1,416,633 SF
Average $/SF: $113
Average Cap Rate: 8.9%
197 South Edmonds Street
Vacancy & Availability
Austin’s citywide average vacancy rate increased from 7.5% to 8.6% over the quarter, due largely to new deliveries. The most significant increase in vacancy over the quarter occurred in the Hays County submarket where the vacancy rate jumped from 9.2% to 12.1%. The East, Far Northeast, Far Northwest, Hays County, Northeast, Northwest, Round Rock, Southeast and Southwest submarkets also saw an increase in vacancy in Q1 2019.
The largest quarterly decrease in vacancy occurred in the Central submarket, where it decreased from 4.6% in Q4 2018 to 3.9% in Q1 2019. Other submarkets reporting a decrease in vacancy include the North and South submarkets.
4.0%
5.0%
6.0%
7.0%
8.0%
9.0%
10.0%
11.0%
$2.00$3.00$4.00$5.00$6.00$7.00$8.00$9.00
$10.00$11.00$12.00
Industrial Rental Rate and Vacancy Percentage Austin, TX
Avg Quoted Rent Avg Vacancy
*Vacancy percentage includes direct and sublease space.
Absorption & Demand
Although Austin’s industrial market posted negative net absorption of 294,233 square feet in Q1 2019, one of the tenants that moved into space in Q1 included Hajoca Corporation moving into 75,600 square feet at Rutland 4 (10519 Boyer Boulevard) in the North submarket. Eighteen tenants moved into over 375,000 SF of industrial space during the first quarter of 2019. One of those tenants, TireHub, is moving into a 40,467 square foot space at 2300 Scarbrough Drive, Building 7, in the North submarket.
The Northeast submarket posted the largest amount of positive net absorption with 122,562 square feet. The North submarket had the second greatest absorption with 84,393 square feet of positive net absorption. Other submarkets that also had positive absorption include Central and South.
The submarkets that posted negative net absorption were East, Far Northeast, Far Northwest, Hays County, Northwest, Round Rock, Southeast and Southwest. The Southeast submarket had the highest negative absorption with 197,607 square feet of negative net absorption in the first quarter. This can be attributed to 123,685 square feet of space at 5330 Fleming Court coming to the market.
Rental Rates
According to CoStar, our data service provider, the citywide average rental rate increased over the quarter from $10.39 per square foot in Q4 2018 to $10.61 per square foot in Q1 2019. Annually, the citywide average rental rate has increased 9.2% from $9.71 in Q1 2018.
The highest average rental rate at the end of Q1, most likely due to the higher number of flex buildings in the area, was in the Southwest submarket at $18.50 per square foot. The submarket with the lowest average rental rate in Q1 2019 was the Hays County submarket at $5.68 per square foot.

3 Austin Research & Forecast Report | Q1 2019 | Industrial | Colliers International33
Q1 2019 Top Industrial Lease TransactionsBUILDING NAME/ADDRESS SUBMARKET SF TENANT LEASE DATE
4500 S Pleasant Valley Rd Southeast 89,332 Fed Ex Mar-19
15855 Long Vista Dr North 86,700 Western Pacific2 Feb-19
10200-10212 Metropolitan Dr North 51,337 FSG Jan-19
2300 Scarbrough Dr North 38,947 InterCeramic Feb-19
7615 Metro Center Dr Southeast 31,636 Teleworks Communications Feb-19
2251 Picadilly Dr Far Northeast 25,806 Ruvati, USA2,3 Mar-19
9200 Waterford Centre Blvd North 23,132 Gemaire Distributors Mar-19
9715 Burnet Rd North 21,600 Trane Feb-19
9715-A Burnet Rd North 20,822 Unknown Mar-19
1942 S Interstate 35 Hays County 20,376 Builders Alliance Jan-19
7000 Burleson Rd Southeast 20,182 LSG Sky Chefs Feb-19
4018 Caven Rd Southeast 17,600 Jack Hillard Distributing Co. Feb-19
3636 Dime Cir Southeast 16,000 Unknown Jan-19
3500 Wadley Pl North 14,738 Unknown Feb-19
3015 Industrial Ter North 14,400 Transtar Industries1 Jan-19
9200 Waterford Centre Blvd North 14,155 Spiral Binding LLC Feb-19
8301 Springdale Rd East 12,000 Tide Texas Jan-19
5925 Dillard Cir Central 11,855 Acton Imprimis Inc Jan-19
Leasing ActivityAustin’s industrial leasing activity included 614,538 square feet of space in Q1 2019. The bulk of the leases signed in the first quarter were in the North submarket, totaling 285,831 square feet. The largest new lease was signed by Fed Ex for 89,332 square feet at 4500 South Pleasant Valley Road in the Southeast Industrial submarket.
1 Renewal 2 Sublease 3 Colliers Deal
AUSTIN INDUSTRIAL MARKET STATISTICAL SUMMARY Q1 2019
Market # Bldgs
Rentable Area
Direct Vacant
SF
Direct Vacancy
Rate
Sublet Vacant
SF
Sublet Vacancy
Rate
Total Vacant SF
Total Vacancy
Rate
1Q19 Net Absorption
4Q18 Net Absorption
1Q19 Comple-
tions
4Q18 Comple-
tions
SF Under Construc-
tion
Austin Total 820 51,871,510 4,028,702 7.8% 429,367 0.8% 4,458,069 8.6% (294,233) 464,907 542,858 733,933 1,759,293
Central 30 1,081,796 42,616 3.9% - 0.0% 42,616 3.9% 6,915 (17,246) - - -
East 63 3,539,587 287,397 8.1% 14,240 0.4% 301,637 8.5% (68,793) 17,322 - - -
Far Northeast 44 3,278,968 260,575 7.9% 65,781 2.0% 326,356 10.0% (76,555) 147,625 - 280,416 299,674
Far Northwest 15 658,024 12,650 1.9% - 0.0% 12,650 1.9% (1,650) (3,434) - - -
Hays County 42 3,167,768 384,880 12.1% - 0.0% 384,880 12.1% (92,578) (115,205) 32,500 - 340,000
North 215 13,480,173 728,431 5.4% 62,690 0.5% 791,121 5.9% 84,393 112,680 - 65,693 -
Northeast 123 8,166,499 650,993 8.0% 78,444 1.0% 729,437 8.9% 122,562 126,744 262,850 - -
Northwest 25 2,505,884 145,052 5.8% - 0.0% 145,052 5.8% (49,502) (42,052) - - -
Round Rock 50 2,697,663 275,303 10.2% - 0.0% 275,303 10.2% (42,340) 128,447 223,530 87,824 102,851
South 37 1,423,045 71,377 5.0% 36,507 2.6% 107,884 7.6% 24,672 40,391 23,978 -
Southeast 170 11,630,072 1,150,928 9.9% 71,705 1.5% 1,322,633 11.4% (197,607) 69,635 - 1,016,768
Southwest 6 242,031 18,500 7.6% - 0.0% 18,500 7.6% (3,750) - - - -
Austin Industrial Market Summary
4 Austin Research & Forecast Report | Q2 2015 | Office | Colliers International4 North American Research & Forecast Report | Q4 2014 | Office Market Outlook | Colliers International
Copyright © 2015 Colliers International.The information contained herein has been obtained from sources deemed reliable. While every reasonable effort has been made to ensure its accuracy, we cannot guarantee it. No responsibility is assumed for any inaccuracies. Readers are encouraged to consult their professional advisors prior to acting on any of the material contained in this report.
Colliers International | Market000 Address, Suite # 000 Address, Suite #+1 000 000 0000colliers.com/<<market>>
4 North American Research & Forecast Report | Q4 2014 | Office Market Outlook | Colliers International
Copyright © 2019 Colliers International.The information contained herein has been obtained from sources deemed reliable. While every reasonable effort has been made to ensure its accuracy, we cannot guarantee it. No responsibility is assumed for any inaccuracies. Readers are encouraged to consult their professional advisors prior to acting on any of the material contained in this report.
Colliers International | Austin111 Congress Avenue, Suite 750 Austin, Texas 78701+1 512 539 3000colliers.com/austin
FOR MORE INFORMATION Advisor Contacts:Travis HicksVice President | Austin+1 512 539 [email protected]
Research Contact:Kaitlin HolmResearch and Marketing Coordinator | Austin+1 512 539 [email protected]
Chase ClancyAssociate | Austin+1 512 539 [email protected]
Q1 2019 Industrial Under Construction - 20,000 SF or greater
Q1 2019 Austin Industrial Highlights
BUILDING ADDRESS SUBMARKET RBA % LEASED DEVELOPER ESTIMATED
DELIVERY DATEBUILDING
DESCRIPTION
Main St & Campo Del Sol P - Park 35 Southeast 305,768 0.0% Exeter Property Group May-19 Industrial
300 Vista Ridge Dr - Building 1 Hays County 222,800 0.0% Unknown May-19 Industrial
Hwy 183 & Burleson Rd - Phase II - Bldg 3 Southeast 150,000 0.0% Unknown Oct-19 Industrial Warehouse
Hwy 183 & Burleson Blvd - Phase II - Bldg 6 Southeast 140,000 0.0% Unknown Oct-19 Industrial Warehouse
Hwy 183 & Burleson Rd - Phase II - Bldg 7 Southeast 140,000 0.0% Unknown Oct-19 Industrial Warehouse
Hwy 183 & Burleson Rd - Phase II - Bldg 5 Southeast 140,000 0.0% Unknown Oct-19 Industrial Warehouse
Hwy 183 & Burleson Rd - Phase II - Bldg 4 Southeast 126,000 0.0% Unknown Oct-19 Industrial Warehouse
Heatherwilde and SH 45 - Building 3 Far Northeast 112,634 0.4% Unknown Apr-19 Industrial
Heatherwilde and SH 45 - Building 2 Far Northeast 100,234 24.9% Unknown Apr-19 Industrial
Platform 45 - 2301 Double Creek Dr Round Rock 57,000 0.0% Intrepid Equity and Investments May-19 Flex
Heatherwilde and SH 45 - Building 1 Far Northeast 50,806 0.0% Unknown Apr-19 Industrial
Midway Commerce Park - 200 Posey Rd Hays County 50,000 16.0% Development 2000, Inc. May-19 Industrial Warehouse
Interstate 35 @ FM 967 - Building 2 Hays County 24,000 0.0% Unknown Jul-19 Industrial
Interstate 35 - Building 3 Hays County 20,000 0.0% Unknown Jul-19 Industrial
Our philosophyrevolves around the fact
that the bestpossible results come
from linking our globalenterprise with
local advisors whounderstand your
business, your market,and how to
integrate real estateinto a successfulbusiness strategy.
C O L L I E R S I N T E R N A T I O N A L G L O B A L L O C A T I O N S
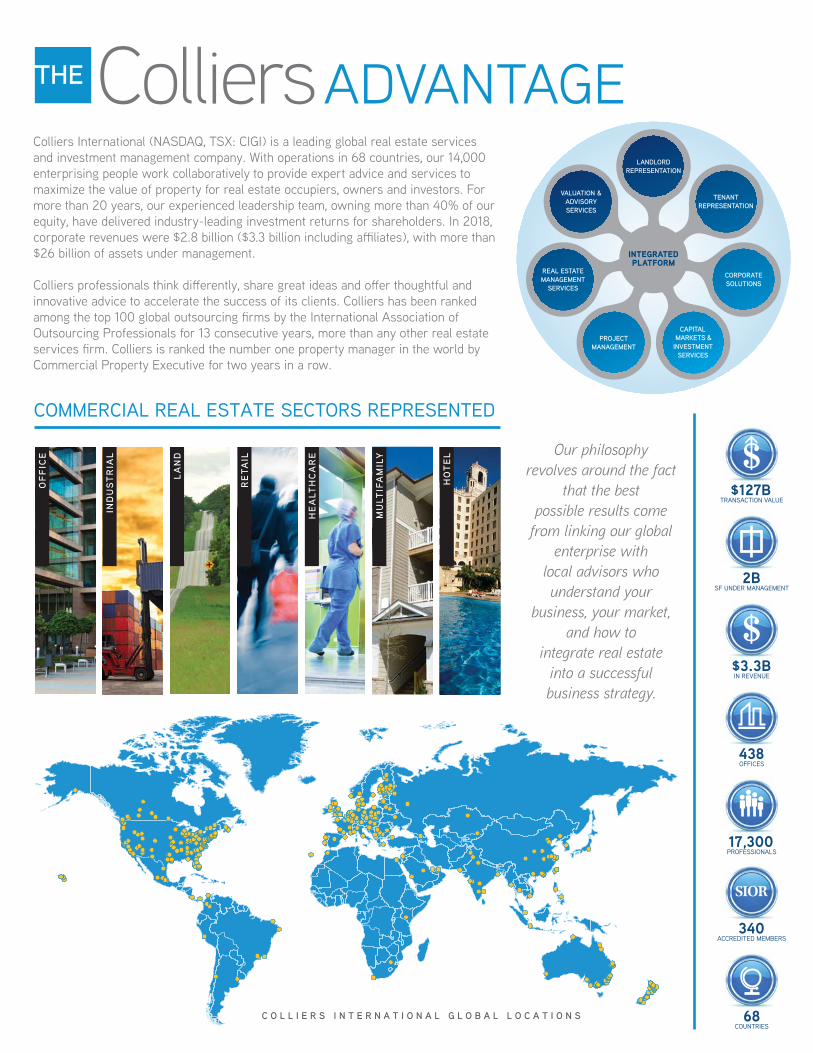
COMMERCIAL REAL ESTATE SECTORS REPRESENTED
OFF
ICE
IND
US
TR
IAL
LAN
D
RE
TAIL
HE
ALT
HC
AR
E
MU
LTIF
AM
ILY
HO
TE
L
$127BTRANSACTION VALUE
2BSF UNDER MANAGEMENT
$3.3BIN REVENUE
438OFFICES
17,300PROFESSIONALS
340ACCREDITED MEMBERS
68COUNTRIES
SIOR
ADVANTAGEColliers International (NASDAQ, TSX: CIGI) is a leading global real estate services and investment management company. With operations in 68 countries, our 14,000 enterprising people work collaboratively to provide expert advice and services to maximize the value of property for real estate occupiers, owners and investors. For more than 20 years, our experienced leadership team, owning more than 40% of our equity, have delivered industry-leading investment returns for shareholders. In 2018, corporate revenues were $2.8 billion ($3.3 billion including a�liates), with more than $26 billion of assets under management.
Colliers professionals think di�erently, share great ideas and o�er thoughtful and innovative advice to accelerate the success of its clients. Colliers has been ranked among the top 100 global outsourcing �rms by the International Association of Outsourcing Professionals for 13 consecutive years, more than any other real estate services �rm. Colliers is ranked the number one property manager in the world by Commercial Property Executive for two years in a row.


