

c03AustraliaAndTheWorldEconomy 146 29 August 2016 1:07 PM
Australia and the world economy
TOPIC 3
There has been a spectacular growth in global trade, from around 2 per cent of the world’s GDP in AD 1500 to around 60 per cent by 2016. Each year international trade in goods alone generates over $40 trillion (US) worth of production globally. This creates jobs, generates incomes, provides access to cheaper goods and improves material living standards for billions of people. However, a downside of this may be accelerated environmental damage and climate change.
Every day, Australians conduct international transactions with people from other countries through trade and capital �ows. International trade involves exporting (selling) and importing (buying) goods and services, while international capital �ows entail the movement of money capital or investments between countries.
Figure 3.1 (part a) shows Australia’s top 10 countries with which we trade, ranked by the total annual value of exports plus imports of goods and services. These include China, Japan, United States, South Korea, Sin-gapore, New Zealand, United Kingdom, Malaysia, Thailand and Germany. The �gure also shows the type or composition of Australia’s exports (part b) and imports (part c) of goods and services, ranked by value and in percentage terms.
ChinaJapanUnited StatesRepublic of KoreaSingaporeNew ZealandUnited KingdomMalaysiaThailandGermany
(a) Australia’s top 10 countries for two-way trade in goods and servicesUNCORRECTED
UNCORRECTED
UNCORRECTED There has been a spectacular growth in global trade, from around 2 per cent of the world’s GDP in AD 1500 to around
UNCORRECTED There has been a spectacular growth in global trade, from around 2 per cent of the world’s GDP in AD 1500 to around 60 per cent by 2016. Each year international trade in goods alone generates over $40 trillion (US) worth of production
UNCORRECTED 60 per cent by 2016. Each year international trade in goods alone generates over $40 trillion (US) worth of production globally. This creates jobs, generates incomes, provides access to cheaper goods and improves material living standards
UNCORRECTED globally. This creates jobs, generates incomes, provides access to cheaper goods and improves material living standards for billions of people. However, a downside of this may be accelerated environmental damage and climate change.
UNCORRECTED for billions of people. However, a downside of this may be accelerated environmental damage and climate change.
Every day, Australians conduct
UNCORRECTED
Every day, Australians conduct international transactions
UNCORRECTED
international transactionscapital �ows. International
UNCORRECTED
capital �ows. International trade
UNCORRECTED
trade capital �ows
UNCORRECTED
capital �ows entail the movement of money capital or investments between countries.
UNCORRECTED
entail the movement of money capital or investments between countries.Figure 3.1 (part a) shows Australia’s top 10 countries with which we trade, ranked by the total annual value
UNCORRECTED
Figure 3.1 (part a) shows Australia’s top 10 countries with which we trade, ranked by the total annual value
UNCORRECTED
of exports plus imports of goods and services. These include China, Japan, United States, South Korea, Sin
UNCORRECTED
of exports plus imports of goods and services. These include China, Japan, United States, South Korea, Singapore, New Zealand, United Kingdom, Malaysia, Thailand and Germany. The �gure also shows the type or
UNCORRECTED
gapore, New Zealand, United Kingdom, Malaysia, Thailand and Germany. The �gure also shows the type or composition of Australia’s exports (part b) and imports (part c) of goods and services, ranked by value and in
UNCORRECTED
composition of Australia’s exports (part b) and imports (part c) of goods and services, ranked by value and in percentage terms.
UNCORRECTED
percentage terms.
UNCORRECTED
UNCORRECTED PAGE P
ROOFS
PROOFS
PROOFS

TOPIC 3 Australia and the world economy 147
c03AustraliaAndTheWorldEconomy 147 29 August 2016 1:07 PM
AUSTRALIA’S TOP 10 GOODS & SERVICES EXPORTS (a)
(A$ million)
Rank Commodity Value % share
Total (b) 326 862
1 Iron ores & concentrates 66 008 20.2
2 Coal 37 999 11.6
3 Natural gas 17 743 5.4
4 Education-related travel services (c) 17 037 5.2
5 Personal travel (excl education) services 14 227 4.4
6 Gold 13 460 4.1
7 Crude petroleum 10 564 3.2
8 Beef, f.c.f. 7 751 2.4
9 Aluminium ores & conc (incl alumina) 6 336 1.9
10
(a) Goods trade are on a recorded trade basis, Services trade are on a balance of payments basis.(b) Total is balance of payments basis.(c) Includes international student expenditure on tuition fees and living expenses. Based on ABS trade data on DFAT STARSdatabase and ABS catalogue 5368.0.
Wheat 5 920 1.8
Exports Imports
(b) The composition of Australia’s exports
AUSTRALIA’S TOP 10 GOODS & SERVICES IMPORTS (a)
(A$ million)
Rank Commodity Value % share
Total (b) 336 957
1 Personal travel (excl education) services 24 597 7.3
2 Crude petroleum 20 050 6.0
3 Re�ned petroleum 18 579 5.5
4 Passenger motor vehicles 17 566 5.2
5 Telecom equipment & parts 9 845 2.9
6 Freight transport services 9 686 2.9
7 Medicaments (incl veterinary) 7 497 2.2
8 Computers 7 316 2.2
9 Passenger transport services (c) 6 141 1.8
10
(a) Goods trade are on a recorded trade basis, Services trade are on a balance of payments basis.(b) Total is balance of payments basis.(c) Includes Related agency fees & commissions. Based on ABS trade data on DFAT STARS database and ABS catalogue5368.0.
Goods vehicles 6 008 1.8
Exports Imports
(c) The composition of Australia’s imports
FIGURE 3.1 Australia’s top 10 two-way trading partners, and the composition of our exports and imports
Source: Graphs copied directly from DFAT, Australia’s Trade at a Glance 2015.
Note: Data is for 2014.
UNCORRECTED
UNCORRECTED
UNCORRECTED
UNCORRECTED
UNCORRECTED
UNCORRECTED
UNCORRECTED
UNCORRECTED
AUSTRALIA’S TOP 10 GOODS & SERVICES IMPORTS (a)
UNCORRECTED
AUSTRALIA’S TOP 10 GOODS & SERVICES IMPORTS (a)
Rank Commodity
UNCORRECTED
Rank Commodity
Total (b)
UNCORRECTED
Total (b)
UNCORRECTED
UNCORRECTED
1 Personal travel (excl education) services
UNCORRECTED
1 Personal travel (excl education) services
UNCORRECTED
2 Crude petroleum
UNCORRECTED
2 Crude petroleum
UNCORRECTED
3 Re�ned petroleum
UNCORRECTED
3 Re�ned petroleum
UNCORRECTED
4 Passenger motor vehicles
UNCORRECTED
4 Passenger motor vehicles
5 Telecom equipment & partsUNCORRECTED
5 Telecom equipment & parts
Exports
UNCORRECTED Exports
PAGE
PAGE
PAGE
PAGE
PAGE 6 336
PAGE 6 336
PAGE (a) Goods trade are on a recorded trade basis, Services trade are on a balance of payments basis.
PAGE (a) Goods trade are on a recorded trade basis, Services trade are on a balance of payments basis.(a) Goods trade are on a recorded trade basis, Services trade are on a balance of payments basis.
PAGE (a) Goods trade are on a recorded trade basis, Services trade are on a balance of payments basis.(a) Goods trade are on a recorded trade basis, Services trade are on a balance of payments basis.
PAGE (a) Goods trade are on a recorded trade basis, Services trade are on a balance of payments basis.(a) Goods trade are on a recorded trade basis, Services trade are on a balance of payments basis.
PAGE (a) Goods trade are on a recorded trade basis, Services trade are on a balance of payments basis.
(c) Includes international student expenditure on tuition fees and living expenses. Based on ABS trade data on DFAT STARS
PAGE (c) Includes international student expenditure on tuition fees and living expenses. Based on ABS trade data on DFAT STARS
5 920
PAGE 5 920
PAGE (c) The composition of Australia’s importsPAGE (c) The composition of Australia’s imports
PROOFS
PROOFS
PROOFS
PROOFS
PROOFS
PROOFS5.2
PROOFS5.2
PROOFS4.4
PROOFS4.4
PROOFS4.1
PROOFS4.1
PROOFS3.2
PROOFS3.2
PROOFS
7 751 PROOFS
7 751 PROOFS
148 Economics Down Under 2
c03AustraliaAndTheWorldEconomy 148 29 August 2016 1:07 PM
3.1 The relationship between trade and living standardsInternational trade occurs because it is bene�cial to nations. It helps them to improve ef�ciency and living standards. Throughout history, there are many examples of how trade has strengthened empires, grown national production and incomes, created jobs, enriched cultures, increased knowledge and raised living standards. By contrast, closed nations that restricted trade ultimately lost their prominence and power.
In order to increase the volume of international trade and raise living standards, governments over the last few decades have adopted the policy of trade liberalisation or freer trade. This has involved reducing the level of trade protection by: • cutting the level of tariffs and thereby making foreign goods cheaper • reducing government cash subsidies paid to local �rms and so allowing imports to compete on the same
basis as locally manufactured products • abolishing import quotas that restrict the volume of foreign goods entering the country • signing up to more bilateral (usually between two nations) and multilateral (between many nations) free
trade agreements (FTAs) with other countries.As a result of trade liberalisation, openness, and a greater recognition of the bene�ts of international trade,
world trade (the total value of exports plus imports of goods and services) as a percentage of GDP grew by 42 per cent over a recent 15-year period. In this section of the course, we examine some of the general bene�ts and costs of this growth in world trade, and its relationships with • material living standards (such as per capita incomes, purchasing power and consumption) • non-material living standards (such as world peace, cultural enrichment and environmental issues).
Trade can encourage international specialisationBecause countries have different combinations of natural, labour and capital resources, they are more ef�-cient at producing some types of goods or services than others. This is re�ected in their level of costs and prices. Especially in recent decades, with reduced government protection of local industry from imports and the growth of freer trade in recent decades, there has been an increase in international specialisation. Here, countries will produce only a limited range of goods and services, focusing on those areas where they have the greatest cost advantage over their international rivals. These goods and services can then be exported, and the income gained used to pay for imports that are too expensive to produce locally. By putting its resources to work in their most productive or ef�cient use, a nation can generate more output (GDP) from the same inputs (resources), and in so doing raise its income and material living standards.
Just by looking at the origin of the goods and services consumed, we can see that many countries specialise in production. For instance, you might wear a watch made in Switzerland, eat lamb grown in Australia, be entertained with movies from the United States or India, drink coffee from Brazil, holiday in Indonesia, wear shoes made in the Philippines and T-shirts sourced from Bangladesh, drive cars made in Germany or South Korea, and use a mobile phone manufactured in China.
Specialisation in production internationally can be based on two types of advantage: absolute cost advantage and comparative cost advantage. • Absolute cost advantage. An absolute cost advantage occurs if a nation is the cheapest or most ef�cient pro-
ducer of a single good or service in the world. For example, if Korea is the cheapest or most ef�cient producer of cars, it is said to have an absolute cost advantage over other countries. It is likely that its car exports will sell very well indeed. Similarly, if Australia is the cheapest producer of iron ore and has an absolute cost advantage, Korean and other manufacturers would be keen to buy from us. Clearly, both countries would bene�t from inter-national trade since each has an absolute cost advantage in different areas of production. However, as we shall see, international trade is still bene�cial even if a country has no absolute cost advantage.
• Comparative cost advantage. A nation has a comparative cost advantage if it specialises in a few key areas of production where its cost advantages are greatest or its disadvantages are lowest. This means that oppor-tunity costs (the value of production forgone or given up, which was illustrated in section 1.3 using a pro-duction possibility diagram) would be minimised and output maximised. Here, resources would be allocated most ef�ciently, and hence production, incomes and material living standards should be most favourable.The famous English economist David Ricardo (1772–1823) outlined the principle of comparative cost
advantage and supported the idea of free trade. He claimed that specialisation in international trade in areas of comparative cost advantage made countries better off economically, generating bene�ts for all. This idea probably makes good sense since, in many ways, nations are like individuals who have greater talent or ef�-ciency in some areas than in others. Logically, we too should specialise in the few things we do best of all and give up other pursuits! To illustrate this concept, Ricardo used the example of two countries, England and Portugal. Each could produce two products, cloth and wine, with the resources available. Table 3.1 summarises the comparative cost advantage of each country producing these products, measured in terms of the number of man-hours that must be worked per unit of output produced.
UNCORRECTED over their international rivals. These goods and services can then be exported, and the
UNCORRECTED over their international rivals. These goods and services can then be exported, and the income gained used to pay for imports that are too expensive to produce locally. By putting its resources to
UNCORRECTED income gained used to pay for imports that are too expensive to produce locally. By putting its resources to work in their most productive or ef�cient use, a nation can generate more output (GDP) from the same inputs
UNCORRECTED work in their most productive or ef�cient use, a nation can generate more output (GDP) from the same inputs (resources), and in so doing raise its income and material living standards.
UNCORRECTED (resources), and in so doing raise its income and material living standards.
Just by looking at the origin of the goods and services consumed, we can see that many countries specialise
UNCORRECTED Just by looking at the origin of the goods and services consumed, we can see that many countries specialise
in production. For instance, you might wear a watch made in Switzerland, eat lamb grown in Australia, be
UNCORRECTED in production. For instance, you might wear a watch made in Switzerland, eat lamb grown in Australia, be entertained with movies from the United States or India, drink coffee from Brazil, holiday in Indonesia, wear
UNCORRECTED entertained with movies from the United States or India, drink coffee from Brazil, holiday in Indonesia, wear shoes made in the Philippines and T-shirts sourced from Bangladesh, drive cars made in Germany or South
UNCORRECTED
shoes made in the Philippines and T-shirts sourced from Bangladesh, drive cars made in Germany or South Korea, and use a mobile phone manufactured in China.
UNCORRECTED
Korea, and use a mobile phone manufactured in China.Specialisation in production internationally can be based on
UNCORRECTED
Specialisation in production internationally can be based on and comparative cost advantage.
UNCORRECTED
and comparative cost advantage.Absolute cost adv
UNCORRECTED
Absolute cost advantage
UNCORRECTED
antageducer of a single good or service in the world. For example, if Korea is the cheapest or most ef�cient producer
UNCORRECTED
ducer of a single good or service in the world. For example, if Korea is the cheapest or most ef�cient producer of cars, it is said to have an absolute cost advantage over other countries. It is likely that its car exports will sell
UNCORRECTED
of cars, it is said to have an absolute cost advantage over other countries. It is likely that its car exports will sell very well indeed. Similarly, if Australia is the cheapest producer of iron ore and has an absolute cost advantage,
UNCORRECTED
very well indeed. Similarly, if Australia is the cheapest producer of iron ore and has an absolute cost advantage, Korean and other manufacturers would be keen to buy from us. Clearly, both countries would bene�t from inter
UNCORRECTED
Korean and other manufacturers would be keen to buy from us. Clearly, both countries would bene�t from international trade since each has an absolute cost advantage
UNCORRECTED
national trade since each has an absolute cost advantagesee, international trade is still bene�cial even if a country has no absolute cost advantage.
UNCORRECTED
see, international trade is still bene�cial even if a country has no absolute cost advantage.•UNCORRECTED
• ComparatiUNCORRECTED
Comparatiof production where its cost advantages are greatest or its disadvantages are lowest. This means that opporUNCORRECTED
of production where its cost advantages are greatest or its disadvantages are lowest. This means that oppor
PAGE Trade can encourage international specialisation
PAGE Trade can encourage international specialisationBecause countries have different combinations of natural, labour and capital resources, they are more ef�
PAGE Because countries have different combinations of natural, labour and capital resources, they are more ef�cient at producing some types of goods or services than others. This is re�ected in their level of costs and
PAGE cient at producing some types of goods or services than others. This is re�ected in their level of costs and prices. Especially in recent decades, with reduced government protection of local industry from imports and
PAGE prices. Especially in recent decades, with reduced government protection of local industry from imports and the growth of freer trade in recent decades, there has been an increase in
PAGE the growth of freer trade in recent decades, there has been an increase in countries will produce only a limited range of goods and services, focusing on those areas where they have the PAGE countries will produce only a limited range of goods and services, focusing on those areas where they have the
over their international rivals. These goods and services can then be exported, and the PAGE
over their international rivals. These goods and services can then be exported, and the income gained used to pay for imports that are too expensive to produce locally. By putting its resources to PAGE
income gained used to pay for imports that are too expensive to produce locally. By putting its resources to
PROOFSo nations) and multilateral (between many nations)
PROOFSo nations) and multilateral (between many nations)
As a result of trade liberalisation, openness, and a greater recognition of the bene�ts of international trade,
PROOFSAs a result of trade liberalisation, openness, and a greater recognition of the bene�ts of international trade,
world trade (the total value of exports plus imports of goods and services) as a percentage of GDP grew by
PROOFSworld trade (the total value of exports plus imports of goods and services) as a percentage of GDP grew by 42 per cent over a recent 15-year period. In this section of the course, we examine some of the general bene�ts
PROOFS42 per cent over a recent 15-year period. In this section of the course, we examine some of the general bene�ts
living standards (such as per capita incomes, purchasing power and consumption)
PROOFSliving standards (such as per capita incomes, purchasing power and consumption)
living standards (such as world peace, cultural enrichment and environmental issues).PROOFS
living standards (such as world peace, cultural enrichment and environmental issues).
Trade can encourage international specialisationPROOFS
Trade can encourage international specialisation

TOPIC 3 Australia and the world economy 149
c03AustraliaAndTheWorldEconomy 149 29 August 2016 1:07 PM
TABLE 3.1Ricardo’s example of comparative cost advantage: the number of man-hours that must be worked per unit of output produced in England and Portugal
Country Cloth (hours per unit produced) Wine (hours per unit produced)
Portugal 90 80
England 100 120
In this case, it can be seen that Portugal has lower expenses or an absolute cost advantage in producing both these products. The cost of producing cloth in Portugal is 90 per cent (90/100) of the cost of making it in Britain. By contrast, the cost of producing wine in Portugal is very much lower at only 66.6 per cent (80/120 or 2/3) of the cost in Britain. Some might conclude from this that Britain could not export to Portugal since it is uncompetitive (and to survive, its industries would need government protection). From Portugal’s point of view, it seems that it would not pay to import from England.
However, let’s re-examine the situation. Logically, both countries can bene�t from trade provided that each specialises in its area of relative or comparative cost advantage. What this means is that relatively, Portugal is an even more ef�cient producer of wine than it is of cloth. Because it has a greater comparative advantage in producing wine, it should specialise in wine rather than in cloth if it wants to maximise output and living standards. By contrast, England has a comparative advantage in cloth (where its disadvantage is least) and should allocate its resources accordingly to minimise its opportunity cost and maximise ef�ciency, produc-tion and incomes. Despite the simplistic assumptions in this example (such as the absence of transport costs involved in trade), Ricardo powerfully argues that free trade and specialisation in areas of comparative cost advantage would be bene�cial, increasing the total volume of world output, incomes and living standards.
Trade promotes economies of large-scale productionEconomies of large-scale production are reductions in a �rm’s average �xed costs per unit associated with an increase in its production levels. Fixed costs like equipment, product design, research, advertising and (up to a point) management can be spread more thinly when there are larger production runs. What international trade can do is encourage specialisation and help businesses grow their sales volumes by allowing them to produce on a much larger scale — for a potential global market of up to 7.4 billion people instead of only the local market. In turn this would lower �xed costs, strengthen competitiveness, grow incomes and boost mat-erial living standards.
The spreading of a �rm’s �xed costs over higher annual levels of output to gain economies of large-scale production is illustrated hypothetically in �gure 3.2. Notice that as a �rm’s annual level of production rises from 1000 to 5000 units per year (perhaps enabled by growing its global exports), the average �xed costs of making each unit fall from $3 to just $1. Clearly, trade can boost production and ef�ciency, lower prices, strengthen competitiveness and sales, and thereby improve real incomes and material living standards.
00
1
2
3
1 2 3 4 65
Ann
ual �x
ed c
ost
per
unit
of o
utpu
t pr
oduc
ed (
$)
A firm’s annual level of production/sales (’000)
High perunit cost
Low perunit cost
Maximum economies of large scaleFew economies of scale
Fixedcostcurve
A
B
Notice that the per unit cost of each extra unit of production by this �rm falls from $3.00 (at point A) to only $1.00 (at point B) as the company raises its annual production and sales from 1000 units to 5000 units. At higher levels of output, �xed costs can be spread more thinly. Exporting can help local �rms justify higher output levels and can enable them to move from point A to point B on the �xed cost curve. This helps increase pro�ts and competitiveness.
FIGURE 3.2 International trade can increase economies of large-scale production for businesses by reducing their �xed costs of production per unit of output.
UNCORRECTED local market. In turn this would lower �xed costs, strengthen competitiveness, grow incomes and boost mat
UNCORRECTED local market. In turn this would lower �xed costs, strengthen competitiveness, grow incomes and boost mat
UNCORRECTED The spreading of a �rm’s �xed costs over higher annual levels of output to gain economies of large-scale
UNCORRECTED The spreading of a �rm’s �xed costs over higher annual levels of output to gain economies of large-scale
production is illustrated hypothetically in �gure 3.2. Notice that as a �rm’s annual level of production rises
UNCORRECTED production is illustrated hypothetically in �gure 3.2. Notice that as a �rm’s annual level of production rises from 1000 to 5000 units per year (perhaps enabled by growing its global exports), the average �xed costs
UNCORRECTED from 1000 to 5000 units per year (perhaps enabled by growing its global exports), the average �xed costs of making each unit fall from $3 to just $1. Clearly, trade can boost production and ef�ciency, lower prices,
UNCORRECTED of making each unit fall from $3 to just $1. Clearly, trade can boost production and ef�ciency, lower prices, strengthen competitiveness and sales, and thereby improve real incomes and material living standards.
UNCORRECTED strengthen competitiveness and sales, and thereby improve real incomes and material living standards.
UNCORRECTED
Ann
ual �x
ed c
ost
per
unit
UNCORRECTED
Ann
ual �x
ed c
ost
per
unit
of o
utpu
t pr
oduc
ed (
$)
UNCORRECTED
of o
utpu
t pr
oduc
ed (
$) High per
UNCORRECTED
High perunit cost
UNCORRECTED
unit cost
PAGE Trade promotes economies of large-scale production
PAGE Trade promotes economies of large-scale productionare reductions in a �rm’s average �xed costs per unit associated with
PAGE are reductions in a �rm’s average �xed costs per unit associated with
an increase in its production levels. Fixed costs like equipment, product design, research, advertising and (up
PAGE an increase in its production levels. Fixed costs like equipment, product design, research, advertising and (up to a point) management can be spread more thinly when there are larger production runs. What international
PAGE to a point) management can be spread more thinly when there are larger production runs. What international trade can do is encourage specialisation and help businesses grow their sales volumes by allowing them to
PAGE trade can do is encourage specialisation and help businesses grow their sales volumes by allowing them to produce on a much larger scale — for a potential global market of up to 7.4 billion people instead of only the PAGE produce on a much larger scale — for a potential global market of up to 7.4 billion people instead of only the local market. In turn this would lower �xed costs, strengthen competitiveness, grow incomes and boost matPAGE
local market. In turn this would lower �xed costs, strengthen competitiveness, grow incomes and boost mat
PROOFSHowever, let’s re-examine the situation. Logically, both countries can bene�t from trade provided that each
PROOFSHowever, let’s re-examine the situation. Logically, both countries can bene�t from trade provided that each , Portugal
PROOFS, Portugal is an even more ef�cient producer of wine than it is of cloth. Because it has a greater comparative advantage
PROOFSis an even more ef�cient producer of wine than it is of cloth. Because it has a greater comparative advantage in producing wine, it should specialise in wine rather than in cloth if it wants to maximise output and living
PROOFSin producing wine, it should specialise in wine rather than in cloth if it wants to maximise output and living standards. By contrast, England has a comparative advantage in cloth (where its disadvantage is least) and
PROOFSstandards. By contrast, England has a comparative advantage in cloth (where its disadvantage is least) and should allocate its resources accordingly to minimise its opportunity cost and maximise ef�ciency, produc
PROOFSshould allocate its resources accordingly to minimise its opportunity cost and maximise ef�ciency, production and incomes. Despite the simplistic assumptions in this example (such as the absence of transport costs
PROOFStion and incomes. Despite the simplistic assumptions in this example (such as the absence of transport costs involved in trade), Ricardo powerfully argues that free trade and specialisation in areas of comparative cost
PROOFSinvolved in trade), Ricardo powerfully argues that free trade and specialisation in areas of comparative cost advantage would be bene�cial, increasing the total volume of world output, incomes and living standards.PROOFS
advantage would be bene�cial, increasing the total volume of world output, incomes and living standards.
Trade promotes economies of large-scale productionPROOFS
Trade promotes economies of large-scale production

150 Economics Down Under 2
c03AustraliaAndTheWorldEconomy 150 29 August 2016 1:07 PM
Trade helps lower prices for consumersAs a general rule, the rapid growth of international trade (assisted by trade liberalisation or reduced protec-tion of local industry) has slowed in�ation rates. Certainly this has been the experience of most countries, including Australia. For example, studies (such as those by Melitz, Schwerhoff and Sy in 2003 and 2013) showed that when tariffs came down, they caused the volume of global trade (as judged by the total ratio of world exports and imports to international production) to increase from an average of 38 per cent of GDP in 1990 to 54 per cent recently while reducing the average annual in�ation rate for the same period from 26 per cent to just 4 per cent (based on over 120 countries). Indeed, freer and more open international trade has generated windfall gains for people around the world by increasing their purchasing power. Some of this data are shown in �gure 3.3.
0
10
3426
10
20
30
40
50
60
Ann
ual a
vera
ge p
erce
ntag
e
38
Average global rateof tariffs
Average global rateof in�ation
Average global rate of exportsand imports to world GDP
1990
4
54
2010*
*Note: Data for average global tariffs is for 2005 not 2010.
FIGURE 3.3 Relationships between the average global rate of trade to world GDP, average tariff rates and average global in�ation rates
Source: Data rounded and derived from EconoMonitor.com, How Globalization Helped Decreasing In�ation, 6 August 2013.
There are several reasons why the growth in global trade has generally been associated with lower in�ation: • Access to cheapest suppliers. Freer trade allows domestic households and �rms to purchase imported
goods (mobile phones, cars, appliances, clothes, machinery, steel, coal, meat) and services (education, health, travel, �nance, entertainment) from the cheapest suppliers around the world. This has been boosted by the explosion of online shopping and trading, and much cheaper and faster transportation.
• Increased local competition. Reducing industry protection around the world as a way of growing trade has dra-matically increased competition in local markets, thereby encouraging international specialisation in production and higher productivity. Without protection, resources must be allocated to their relatively most ef�cient use where the cost advantage is greatest and the opportunity cost is least. This should lead to lower in�ation.
• Reduced market power. The growth of trade has helped to reduce the degree of market power that exists in some domestic industries, because �rms face �ercer competition from imports. In their �ght for survival, businesses must now cut their costs, innovate, restructure production and use the latest technology (perhaps purchased more cheaply from overseas due to lower tariffs) in order to keep their prices down and quality up. In short, they are forced to become more internationally competitive.
• Increased wage competition. In domestic labour markets, the growth of trade through liberalisation and reduced protection has increased the level of competition from low-wage countries. This has helped to slow the growth of wage costs around the world, enabling �rms to sell their product more cheaply and competitively.
• Economies of large-scale production. The growth in trade allows competitive �rms to produce and sell on a bigger scale so that their �xed production costs per unit (including advertising, product design, tooling and equipment) can be spread more thinly and the product sold at a lower price both at home and abroad.Ultimately, what lower in�ation means is that the real purchasing power of average incomes is usually
higher (other things being equal). This enables per capita consumption to rise, thereby bolstering material living standards.
Trade boosts GDP and incomesEspecially in the longer-term, nations with open economies who have adopted the principles of trade liberal-isation (combined with certain other policy measures) are far more likely to have higher levels of ef�ciency, national output and hence per capita incomes than those with trade barriers. This can occur for the following reasons: • Greater ef�ciency. Countries will be forced to specialise in the production of commodities where they are
most ef�cient (or least inef�cient) and have a comparative cost advantage (where opportunity costs are
UNCORRECTED There are several reasons why the growth in global trade has generally been associated with
UNCORRECTED There are several reasons why the growth in global trade has generally been associated with Freer trade allows domestic households and �rms to purchase imported
UNCORRECTED Freer trade allows domestic households and �rms to purchase imported goods (mobile phones, cars, appliances, clothes, machinery, steel, coal, meat) and services (education,
UNCORRECTED goods (mobile phones, cars, appliances, clothes, machinery, steel, coal, meat) and services (education, health, travel, �nance, entertainment) from the cheapest suppliers around the world. This has been boosted
UNCORRECTED health, travel, �nance, entertainment) from the cheapest suppliers around the world. This has been boosted by the explosion of online shopping and trading, and much cheaper and faster transportation.
UNCORRECTED by the explosion of online shopping and trading, and much cheaper and faster transportation.
Reducing industry protection around the world as a way of growing trade has dra
UNCORRECTED Reducing industry protection around the world as a way of growing trade has dra
matically increased competition in local markets, thereby encouraging international specialisation in production
UNCORRECTED matically increased competition in local markets, thereby encouraging international specialisation in production
UNCORRECTED
and higher productivity. Without protection, resources must be allocated to their relatively most ef�cient use
UNCORRECTED
and higher productivity. Without protection, resources must be allocated to their relatively most ef�cient use where the cost advantage is greatest and the opportunity cost is least. This should lead to lower in�ation.
UNCORRECTED
where the cost advantage is greatest and the opportunity cost is least. This should lead to lower in�ation.et power.
UNCORRECTED
et power. The growth of trade has helped to reduce the degree of market power that exists
UNCORRECTED
The growth of trade has helped to reduce the degree of market power that exists in some domestic industries, because �rms face �ercer competition from imports. In their �ght for survival,
UNCORRECTED
in some domestic industries, because �rms face �ercer competition from imports. In their �ght for survival, businesses must now cut their costs, innovate, restructure production and use the latest technology (perhaps
UNCORRECTED
businesses must now cut their costs, innovate, restructure production and use the latest technology (perhaps purchased more cheaply from overseas due to lower tariffs) in order to keep their prices down and quality
UNCORRECTED
purchased more cheaply from overseas due to lower tariffs) in order to keep their prices down and quality up. In short, they are forced to become more internationally competitive.
UNCORRECTED
up. In short, they are forced to become more internationally competitive.Incr
UNCORRECTED
Increased wage competition.
UNCORRECTED
eased wage competition. reduced protection has increased the level of competition from low-wage countries. This has helped to slow the
UNCORRECTED
reduced protection has increased the level of competition from low-wage countries. This has helped to slow the growth of wage costs around the world, enabling �rms to sell their product more cheaply and competitively.
UNCORRECTED
growth of wage costs around the world, enabling �rms to sell their product more cheaply and competitively.•UNCORRECTED
• Economies of larUNCORRECTED
Economies of lara bigger scale so that their �xed production costs per unit (including advertising, product design, tooling UNCORRECTED
a bigger scale so that their �xed production costs per unit (including advertising, product design, tooling
PAGE
PAGE Relationships between the average global rate of trade to world GDP, average tariff rates and average
PAGE Relationships between the average global rate of trade to world GDP, average tariff rates and average
Data rounded and derived from EconoMonitor.com, How Globalization Helped Decreasing In�ation, 6 August 2013.PAGE Data rounded and derived from EconoMonitor.com, How Globalization Helped Decreasing In�ation, 6 August 2013.
There are several reasons why the growth in global trade has generally been associated with PAGE
There are several reasons why the growth in global trade has generally been associated with
PROOFS
PROOFS
PROOFS
PROOFS
PROOFS
PROOFS
PROOFS
PROOFS
PROOFS
PROOFS
Average global ratePROOFS
Average global rateof in�ationPROOFS
of in�ation
1990
PROOFS1990
PROOFS

TOPIC 3 Australia and the world economy 151
c03AustraliaAndTheWorldEconomy 151 29 August 2016 1:07 PM
relatively lowest). Greater ef�ciency in resource allocation grows their productive capacity and the size of their production possibility frontier, causing real incomes, consumption and living standards to be higher.
• Economies of scale. Nations will gain cost reductions or economies of large-scale production in design, production, marketing, �nance and transport. This advances ef�ciency, pro�tability and the expansion of businesses, leading to higher output, incomes, consumption and material living standards.
• Innovation. Because of stiffer global competition promoted through freer trade, �rms are more likely to innovate and use new technology to lower their costs and grow technical ef�ciency, again boosting the nation’s productive capacity, real GDP, incomes and material living standards.
• Imports of capital. Through imports of machinery, resources, technology and know-how, trade facilitates the growth of a nation’s productive capacity, GDP, real incomes and material living standards.
Trade can create jobsOverall, it seems that increased international trade creates jobs and lowers unemployment, especially in the long term. This is because trade increases ef�ciency in resource allocation, lowers production costs, strengthens business pro�tability and expansion, and boosts economic growth. This should create more jobs, reduce unem-ployment, lift average incomes and improve both material and non-material living standards. In Australia’s case, around one in four jobs are now generated from our exports alone.
However, especially in the short term, it is possible that the growth in trade (facilitated by trade liberalisa-tion measures) might cause a rise in structural unemployment as uncompetitive �rms close down, relocate to low-wage countries or restructure their production by substituting machines for workers. When this occurs, living standards could fall temporarily.
Trade enables access to more resourcesNations have different endowments of natural, labour and capital resources, causing them to specialise in producing particular types of goods and services. Some countries (including Australia) have vast natural resources that allow them to competitively produce more food and minerals than are needed locally. They can export the rest and use the income gained to purchase needed imports. For instance, nations like China, India and Indonesia have plenty of cheap labour available for supporting manufacturing industries, while others (including Japan and Singapore) have good access to inexpensive �nance that makes their purchase of capital equipment more affordable. It is through trade or exchange that a country can access the resources, goods and services that it lacks or cannot produce itself at the lowest possible price.
What international trade does is to grow the quantity and quality of resources available to local businesses, allowing them to boost their production. Similarly, by growing businesses, jobs, incomes and pro�ts, trade allows governments to access and pay for the various types of resources it needs to produce public goods and infrastructure like transport, education, health and defence, thus improving our living standards.
Trade means greater consumer choiceInternational trade has created a shopper’s paradise that should increase the extent to which wants can be sat-is�ed. Consumers now have an exciting smorgasbord of offerings from which to choose when buying clothes, cars, cosmetics, computers, holidays or foods. The range of goods and services is so wide that it would be impossible for any single country’s producers to cater ef�ciently for all tastes. Having freer access to imports solves this problem and helps to raise living standards.
Trade can promote peaceTrade brings people from different countries together and creates dialogue, understanding and cooperation. In addition, it encourages nations to have cordial relationships with each other to promote exports and to maintain the supply of needed imports. Some studies have shown that when there are economic opportuni-ties to improve incomes and living standards, civil war and con�ict are less likely. This especially improves non-material living standards.
Trade enriches the cultureTrade creates a great diversity of goods and services that enriches the culture of nations and leads to more vibrant and interesting societies. This supports non-material living standards.
Trade has mixed effects on income distributionAround the world it has been observed that although real incomes have generally increased, there has been a rise in income inequality coinciding with the accelerated growth in international trade. This has provoked academic debate about whether trade is responsible for this.
UNCORRECTED equipment more affordable. It is through trade or exchange that a country can access the resources, goods and
UNCORRECTED equipment more affordable. It is through trade or exchange that a country can access the resources, goods and services that it lacks or cannot produce itself at the lowest possible price.
UNCORRECTED services that it lacks or cannot produce itself at the lowest possible price.
UNCORRECTED What international trade does is to grow the quantity and quality of resources available to local businesses,
UNCORRECTED What international trade does is to grow the quantity and quality of resources available to local businesses,
allowing them to boost their production. Similarly, by growing businesses, jobs, incomes and pro�ts, trade
UNCORRECTED allowing them to boost their production. Similarly, by growing businesses, jobs, incomes and pro�ts, trade allows governments to access and pay for the various types of resources it needs to produce public goods and
UNCORRECTED allows governments to access and pay for the various types of resources it needs to produce public goods and infrastructure like transport, education, health and defence, thus improving our living standards.
UNCORRECTED infrastructure like transport, education, health and defence, thus improving our living standards.
Trade means greater consumer choice
UNCORRECTED
Trade means greater consumer choiceInternational trade has created a shopper’s paradise that should increase the extent to which wants can be sat
UNCORRECTED
International trade has created a shopper’s paradise that should increase the extent to which wants can be satis�ed. Consumers now have an exciting smorgasbord of offerings from which to choose when buying clothes,
UNCORRECTED
is�ed. Consumers now have an exciting smorgasbord of offerings from which to choose when buying clothes, cars, cosmetics, computers, holidays or foods. The range of goods and services is so wide that it would be
UNCORRECTED
cars, cosmetics, computers, holidays or foods. The range of goods and services is so wide that it would be
UNCORRECTED
impossible for any single country’s producers to cater ef�ciently for all tastes. Having freer access to imports
UNCORRECTED
impossible for any single country’s producers to cater ef�ciently for all tastes. Having freer access to imports solves this problem and helps to raise living standards.
UNCORRECTED
solves this problem and helps to raise living standards.
Trade can promote peace
UNCORRECTED
Trade can promote peaceTrade brings people from different countries together and creates dialogue, understanding and cooperation.
UNCORRECTED
Trade brings people from different countries together and creates dialogue, understanding and cooperation.
UNCORRECTED
In addition, it encourages nations to have cordial relationships with each other to promote exports and to UNCORRECTED
In addition, it encourages nations to have cordial relationships with each other to promote exports and to maintain the supply of needed imports. Some studies have shown that when there are economic opportuniUNCORRECTED
maintain the supply of needed imports. Some studies have shown that when there are economic opportunities to improve incomes and living standards, civil war and con�ict are less likely. This especially improves UNCORRECTED
ties to improve incomes and living standards, civil war and con�ict are less likely. This especially improves
PAGE Nations have different endowments of natural, labour and capital resources, causing them to specialise in
PAGE Nations have different endowments of natural, labour and capital resources, causing them to specialise in producing particular types of goods and services. Some countries (including Australia) have vast natural
PAGE producing particular types of goods and services. Some countries (including Australia) have vast natural resources that allow them to competitively produce more food and minerals than are needed locally. They can
PAGE resources that allow them to competitively produce more food and minerals than are needed locally. They can export the rest and use the income gained to purchase needed imports. For instance, nations like China, India
PAGE export the rest and use the income gained to purchase needed imports. For instance, nations like China, India and Indonesia have plenty of cheap labour available for supporting manufacturing industries, while others
PAGE and Indonesia have plenty of cheap labour available for supporting manufacturing industries, while others (including Japan and Singapore) have good access to inexpensive �nance that makes their purchase of capital PAGE (including Japan and Singapore) have good access to inexpensive �nance that makes their purchase of capital equipment more affordable. It is through trade or exchange that a country can access the resources, goods and PAGE
equipment more affordable. It is through trade or exchange that a country can access the resources, goods and
PROOFSOverall, it seems that increased international trade creates jobs and lowers unemployment, especially in the
PROOFSOverall, it seems that increased international trade creates jobs and lowers unemployment, especially in the long term. This is because trade increases ef�ciency in resource allocation, lowers production costs, strengthens
PROOFSlong term. This is because trade increases ef�ciency in resource allocation, lowers production costs, strengthens business pro�tability and expansion, and boosts economic growth. This should create more jobs, reduce unem
PROOFSbusiness pro�tability and expansion, and boosts economic growth. This should create more jobs, reduce unem-
PROOFS-ployment, lift average incomes and improve both material and non-material living standards. In Australia’s
PROOFSployment, lift average incomes and improve both material and non-material living standards. In Australia’s
However, especially in the short term, it is possible that the growth in trade (facilitated by trade liberalisa
PROOFSHowever, especially in the short term, it is possible that the growth in trade (facilitated by trade liberalisa
as uncompetitive �rms close down, relocate to
PROOFS as uncompetitive �rms close down, relocate to
low-wage countries or restructure their production by substituting machines for workers. When this occurs,
PROOFSlow-wage countries or restructure their production by substituting machines for workers. When this occurs,

152 Economics Down Under 2
c03AustraliaAndTheWorldEconomy 152 29 August 2016 1:07 PM
On the one hand, by accelerating economic growth, creating jobs and supressing in�ation, global trade is likely to have led to higher real per capita incomes, purchasing power and living standards for many. In addi-tion, trade has increased government revenues, making it more affordable for governments to provide better education, health and economic infrastructure that are required for economic growth.
These positive outcomes seem to especially apply in countries like China, where the rise in interna-tional trade since the early 1990s appears to have been one of the key factors in reducing global poverty rates among people on very low incomes of less than $1.25 a day. Figure 3.4 shows that since 1990, pov-erty reductions have been greatest in East Asia (which includes China) and the Paci�c, South Asia and Sub-Saharan Africa.
Pov
erty
rat
es c
onti
nue
to f
all
People living on less than $1.25 a day (% of population)
Year
60
40
20
01990 1995 2000 2005 2010 2015
Sub-Saharan Africa
South Asia
Middle East &North AfricaLatin America & Caribbean
East Asia & Paci�c
Europe & Central Asia
FIGURE 3.4 Trends in the reduction of extreme poverty by global region
Source: Graph copied directly from World Bank 2014, Development Indicators, p. 2.
On the other hand, experience from particular countries, especially over the shorter term, shows that the rise in global trade (facilitated by trade liberalisation and structural reforms) may have contributed to lower incomes and greater inequality. This could be due to the effect of stronger competition from imports depressing real wages by driving up the local price of basic food. This occurs when domestic producers are encouraged to sell overseas where they can get better prices for their crops than selling locally. In addition, trade has caused some local businesses to close down, possibly leading to structural unemployment and lower incomes.
Trade has mixed effects on economic stability and other aspects affecting living standardsTrade can have mixed effects on a nation’s economic stability and living standards.
Trade can increase economic instabilityWith growing dependence on international trade, momentous economic events like the GFC (2008–10) or a slowdown in a major economy (as happened in China in 2013–16) can spread globally and drag other nations into recession. In turn, this causes rising unemployment, falling incomes and depressed living standards across the world.
Despite this, the opposite is true too. If overseas conditions are strong, these can help offset periods of weak domestic economic activity locally and reduce instability, helping to maintain living standards.
Trade can weaken the environment and living standardsBy growing exports and accelerating production, trade can have adverse direct and indirect effects on the envi-ronment both now and into the future: • Natural and other resources will be depleted and degraded at a faster rate, as is evident in many countries
like Indonesia, Nigeria, Ecuador and Brazil. • Carbon emissions from production and the transportation of goods will increase. This will accelerate climate
change and severe weather events, along with the pollution of rivers and soils as seen in China.
UNCORRECTED
UNCORRECTED
UNCORRECTED Trends in the reduction of extreme poverty by global region
UNCORRECTED Trends in the reduction of extreme poverty by global region
Graph copied directly from World Bank 2014,
UNCORRECTED Graph copied directly from World Bank 2014, Development Indicators
UNCORRECTED Development Indicators
On the other hand, experience from particular countries, especially over the shorter term, shows that
UNCORRECTED On the other hand, experience from particular countries, especially over the shorter term, shows that
the rise in global trade (facilitated by trade liberalisation and structural reforms) may have contributed to
UNCORRECTED the rise in global trade (facilitated by trade liberalisation and structural reforms) may have contributed to lower incomes and greater inequality. This could be due to the effect of stronger competition from imports
UNCORRECTED lower incomes and greater inequality. This could be due to the effect of stronger competition from imports depressing real wages by driving up the local price of basic food. This occurs when domestic producers are
UNCORRECTED
depressing real wages by driving up the local price of basic food. This occurs when domestic producers are encouraged to sell overseas where they can get better prices for their crops than selling locally. In addition,
UNCORRECTED
encouraged to sell overseas where they can get better prices for their crops than selling locally. In addition, trade has caused some local businesses to close down, possibly leading to structural unemployment and
UNCORRECTED
trade has caused some local businesses to close down, possibly leading to structural unemployment and
Trade has mixed effects on economic stability and other aspects
UNCORRECTED
Trade has mixed effects on economic stability and other aspects
UNCORRECTED
affecting living standards
UNCORRECTED
affecting living standardsTrade can have mixed effects on a nation’s economic stability and living standards.
UNCORRECTED
Trade can have mixed effects on a nation’s economic stability and living standards.
Trade can increase economic instability
UNCORRECTED
Trade can increase economic instabilityWith growing dependence on international trade, momentous economic events like the GFC (2008–10) or a UNCORRECTED
With growing dependence on international trade, momentous economic events like the GFC (2008–10) or a slowdown in a major economy (as happened in China in 2013–16) can spread globally and drag other nations UNCORRECTED
slowdown in a major economy (as happened in China in 2013–16) can spread globally and drag other nations
PAGE
PAGE
PAGE
PAGE
PAGE
PAGE
PAGE YearPAGE Year
1990 1995 2000 2005 2010 2015
PAGE 1990 1995 2000 2005 2010 2015
PAGE
Trends in the reduction of extreme poverty by global regionPAGE
Trends in the reduction of extreme poverty by global region
PROOFS
PROOFS
PROOFS
PROOFS
PROOFS
PROOFSSouth Asia
PROOFSSouth Asia
Middle East &PROOFS
Middle East &

TOPIC 3 Australia and the world economy 153
c03AustraliaAndTheWorldEconomy 153 29 August 2016 1:07 PM
• The growth of cities is likely to quicken, creating a host of urban problems, including overcrowding, waste disposal, transport congestion, injury from disasters and reduced health outcomes.With weaker environmental outcomes, material and especially non-material living standards are likely to
suffer.
Trade can prevent the development of new infant industriesThe liberalisation and growth of trade exposes domestic industries to stronger competition from often cheaper imports. This can discourage the growth of domestic infant industries, which typically have higher production costs and limited cash �ow during their start-up phase than well-established foreign rivals. As a result, growth in capacity and job creation may be limited, with negative consequences for economic activity and therefore living standards.
Weblinks The weblinks in these activities are available in this chapter’s student resources tab.• The big ideas of trade• Why international trade?• Foreign trade — an introduction• How international trade works (1951)• Better understanding global trade �ows• International trade (unit 7, lecture 1)• How bene�cial is world trade?• Comparative advantage and terms of trade,
ACDC Econ 1.3
• The gains from trade• International trade: Absolute and comparative advantage • Comparative advantage and the tragedy of Tasmania • Basic economic principles 3: Specialisation and trade• Another look at comparative advantage• Comparative advantage• Chapter # 2 division of labour specialisation, trade
comparative advantage• Chapter # 2 division of labour and specialisation
CHECK YOUR UNDERSTANDING
1 Identify and explain four important ways whereby the growth of global trade (partly assisted by trade liberalisation policies) might help to increase overall living standards.
2 Identify and explain two important ways whereby the growth of global trade (assisted by trade liberalisation policies) might undermine general living standards.
APPLIED ECONOMIC EXERCISES
Apply your understanding of this subtopic by accessing and completing the Applied economic exercise(s).
• School-assessed coursework > Applied economic exercises > Question 1
3.2 Recording international transactions on the balance of payments accountThe balance of payments account (BOP) is an annual statistical record of the money value of different types of �nancial transactions between Australia and the rest of the world. For accounting purposes, money received by Australian residents is regarded as a credit, while money paid by us to overseas is classi�ed as a debit. Because this is a zero balance account, the overall balance of payments account always balances and the total value of credits is equal to the total value of debits. The items recorded on the BOP are grouped into either current account transactions or capital and �nancial account transactions, before being further subdivided. These transactions are illustrated in �gure 3.5.
Balance on current accountFrom �gure 3.5 you will notice that the balance on current account is broken down into four sub-accounts:1. Net goods. This is the difference in total value between export credits for goods or merchandise sold over-
seas (for example, wool, minerals and manufactured items) minus import debits for goods purchased from abroad (for example, oil, electronic equipment and machinery).
2. Net services. This is the difference between the value of service credits received by Australia (for example from tourism, education, transportation, construction, �nancial, royalties and licence fees) minus service
UNCORRECTED
UNCORRECTED
UNCORRECTED eby the growth of global trade (partly assisted by trade
UNCORRECTED eby the growth of global trade (partly assisted by trade liberalisation policies) might help to increase overall living standards.
UNCORRECTED liberalisation policies) might help to increase overall living standards.eby the growth of global trade (assisted by trade liberalisation
UNCORRECTED eby the growth of global trade (assisted by trade liberalisation policies) might undermine general living standards.
UNCORRECTED policies) might undermine general living standards.
UNCORRECTED
UNCORRECTED
UNCORRECTED
UNCORRECTED ES
UNCORRECTED ES
Apply your understanding of this subtopic by accessing and completing the Applied economic exercise(s).
UNCORRECTED
Apply your understanding of this subtopic by accessing and completing the Applied economic exercise(s).
School-assessed coursework > Applied economic exercises >
UNCORRECTED
School-assessed coursework > Applied economic exercises >
3.2 Recording international transactions on the
UNCORRECTED
3.2 Recording international transactions on the balance of payments account
UNCORRECTED
balance of payments accountbalance of payments account (BOP)
UNCORRECTED
balance of payments account (BOP)of �nancial transactions between Australia and the rest of the world. For accounting purposes, money received UNCORRECTED
of �nancial transactions between Australia and the rest of the world. For accounting purposes, money received by Australian residents is regarded as a UNCORRECTED
by Australian residents is regarded as a Because this is a zero balance account, the overall balance of payments account always balances and the total UNCORRECTED
Because this is a zero balance account, the overall balance of payments account always balances and the total
PAGE
PAGE comparative advantage
PAGE comparative advantageChapter # 2 division of labour and specialisation
PAGE Chapter # 2 division of labour and specialisation
PAGE
PAGE
PAGE
eby the growth of global trade (partly assisted by trade PAGE
eby the growth of global trade (partly assisted by trade liberalisation policies) might help to increase overall living standards.PAGE
liberalisation policies) might help to increase overall living standards.
PROOFS
PROOFSInternational trade: Absolute and comparative advantage
PROOFSInternational trade: Absolute and comparative advantage Comparative advantage and the tragedy of Tasmania
PROOFSComparative advantage and the tragedy of Tasmania Basic economic principles 3: Specialisation and trade
PROOFSBasic economic principles 3: Specialisation and tradeAnother look at comparative advantage
PROOFSAnother look at comparative advantage
Chapter # 2 division of labour specialisation, trade PROOFS
Chapter # 2 division of labour specialisation, trade
Chapter # 2 division of labour and specialisationPROOFS
Chapter # 2 division of labour and specialisationPROOFS

154 Economics Down Under 2
c03AustraliaAndTheWorldEconomy 154 29 August 2016 1:07 PM
debits paid abroad (for example, for transportation, tourism, education, royalties and licence fees, and insurance).
3. Net primary incomes. This is the difference in value between income credits received from overseas (for example, wages, salaries, interest, dividends and pro�ts) minus income debits paid out abroad (for wages, salaries, interest, rent, dividends and pro�t remittances, for example).
4. Net secondary incomes. This is the difference between the value of secondary income credits received by our residents (for example, non-life insurance transfers such as pensions) minus the value of secondary income debits paid abroad (such as gifts, taxes and some foreign food aid donated by our residents). Secondary incomes are dif-ferent from other transactions in that they are a one-way transaction with nothing exchanged in return.
1 — Net goods(credits for goods exported
MINUS debits for goods imported)
Net capitaltransfers(capitaltransfercreditsMINUScapitaltransferdebits)
Netacquisition
of non-produced�nancialassets
(creditsMINUSdebits)
Netinvestment
(equalsnet direct +
net portfolio +net other)= creditsMINUSdebits
Netreserveassets(by theRBA)
= creditsMINUSdebits
1 — Balance oncapital account
2 — Balance on�nancial account
2 — Net services(credits for services exported
MINUS debits for services imported)
3 — Net primary incomes(credits for primary incomes received
MINUS debits for primary incomes paid)
4 — Net secondaryincomes
(credits for secondary incomes receivedMINUS debits for secondary incomes paid)
The balance oncurrent account
The balance on capitaland �nancial accounts
The overall balance of payments account (BOP)
FIGURE 3.5 Structure of Australia’s balance of payments account
To calculate the overall balance on current account, remember the following relationships.
How to calculate the balance of payments on current accountNet goods (credits for goods minus debits for goods)+ Net services (credits for services minus debits for services)+ Net primary incomes (credits for incomes minus debits for incomes)+ Net secondary incomes (credits for secondary incomes minus debits for secondary incomes)= Overall balance on current account
In Australia’s case, the overall balance turns out to be a large current account de�cit (CAD), where the total value of debits exceeds the total value of credits. As we shall see, the existence of the CAD means that there will need to be a rise in the nation’s net external liabilities, which are made up of debt (borrowed money) and equity (ownership).
Balance on capital and �nancial accountsThe balance on capital and �nancial accounts is broken down into two main sub-accounts: the balance on cap-ital account and the balance on �nancial account.1. Balance on capital account. Capital transactions include net capital transfers and the net acquisition of
non-produced, non-�nancial assets. • Capital transfers generally involve the net in�ow of funds into Australia by permanent migrants.
UNCORRECTED
UNCORRECTED
UNCORRECTED
UNCORRECTED
Structure of Australia’s balance of payments account
UNCORRECTED
Structure of Australia’s balance of payments account
To calculate the overall balance on current account, remember the following relationships.
UNCORRECTED
To calculate the overall balance on current account, remember the following relationships.
UNCORRECTED
UNCORRECTED
UNCORRECTED
ow to calculate the balance of payments on current account
UNCORRECTED
ow to calculate the balance of payments on current accountNet goods (credits for goods minus debits for goods)
UNCORRECTED
Net goods (credits for goods minus debits for goods)+
UNCORRECTED
+ Net services (credits for services minus debits for services)
UNCORRECTED
Net services (credits for services minus debits for services)+
UNCORRECTED
+ Net primary incomes (credits for incomes minus debits for incomes)
UNCORRECTED
Net primary incomes (credits for incomes minus debits for incomes)+UNCORRECTED
+ Net secondary incomes (credits for secondary incomes minus debits for secondary incomes)UNCORRECTED
Net secondary incomes (credits for secondary incomes minus debits for secondary incomes)=UNCORRECTED
= Overall balance on current accountUNCORRECTED
Overall balance on current account
PAGE
PAGE MINUS
PAGE MINUScapital
PAGE capitaltransfer
PAGE transferdebits)
PAGE debits)
PAGE
PAGE MINUS debits for secondary incomes paid) PAGE MINUS debits for secondary incomes paid) PAGE
PAGE
PAGE
PAGE PROOFS
PROOFS
PROOFS
PROOFS
credits PROOFS
credits PROOFSNet
PROOFSNet
acquisition
PROOFSacquisition
of non-
PROOFSof non-
produced
PROOFS
produced
PROOFS

TOPIC 3 Australia and the world economy 155
c03AustraliaAndTheWorldEconomy 155 29 August 2016 1:07 PM
• The net acquisition/disposal of non-produced, non-�nancial assets covers the excess of credits over debits for the sale of copyright, patents, overseas franchises (such as KFC and McDonald’s) and trade-marks of a tangible nature.
Of these two items, capital transfers are by far the largest item.2. Balance on �nancial account. The �nancial account shows how Australia funds or pays for its CAD. The bal-
ance on �nancial account records the value of total credits for investments and borrowing received by Australia from abroad (the in�ow of funds) minus total debits for investments and lending by Australians abroad (the out�ow of funds). It records the following transactions involving foreign �nancial assets and liabilities. • Net direct investment involves the purchase, setting up or expansion of companies and assets in Australia
by foreigners classi�ed as credits (the in�ow of funds or assets) minus similar investments overseas by Australian residents classi�ed as debits (the out�ow of funds or liabilities).
• Net portfolio investment is the difference in the value of transactions by foreign individuals purchasing Australian shares, debt and securities minus the value of similar assets purchased by our residents. Port-folio investment �owing in from overseas is recorded as a credit (the in�ow of funds or assets), while this sort of investment abroad by Australian residents is recorded as a debit (the out�ow of funds or liabili-ties) on our �nancial account.
• Other investment includes credits (the in�ow of funds or assets) minus debits (the out�ow of funds or liabilities) for loans, deposits and trade credits.
• Net reserve assets contains both RBA and government transactions involving dealings in reserves of foreign currencies, gold, special drawing rights and required contributions to the International Monetary Fund (IMF). Moneys received from overseas are categorised as credits (the in�ow of funds or assets), while payments overseas are categorised as debits (the out�ow of funds or liabilities) on Australia’s �nancial account.
• Net errors and omissions re�ects inaccuracies in the above calculations and estimations. When this cat-egory is taken into account, the positive balance on Australia’s capital and �nancial account will exactly offset the negative balance on current account (the CAD).
Overall, Australia’s balance on capital and �nancial accounts is positive. This means there has been a net �nancial in�ow seen as a rise in the nation’s liabilities overseas (consisting of either foreign debt or foreign equity in the case of ownership of Australian assets like property or shares). It will exactly offset the de�cit recorded on our current account, allowing the overall BOP account to be in balance.
Relationship between the current account and the capital and �nancial accountsThe overall BOP account should exactly balance or equal zero, at least in theory. That is, Australia’s current account de�cit (where the total value of debits exceeds credits for goods, services, primary incomes and sec-ondary incomes) is exactly equal to or offset by a capital and �nancial account surplus (where the total value of credits exceeds debits for net capital and investments). This directly increases our net foreign debt (NFD).
As shown in �gure 3.6, the existence of ongoing CADs means that there has to be an offsetting rise in the nation’s net external liabilities, consisting of foreign debt (borrowed money) and foreign equity (ownership). Here, we are essentially drawing on savings from the rest of the world to �nance our high levels of investment and consumption, and recording this as a net surplus (in�ow) on our capital and �nancial accounts. Clearly this is a two-way relation-ship between the current account and the capital and �nancial accounts making up the overall BOP.
Australia’s CADs are exactlyoffset by a surplus on thecapital and �nancialaccounts — mostlyinvolving an increase inour foreign liabilities(debt and equity)
Australia generallyruns large CADs
FIGURE 3.6 The relationship between Australia’s current account and the capital and �nancial accounts
As we shall see later, the main problem is that Australia has a national savings-investment gap. Here, there is a low level of savings by households, �rms and governments relative to our high level of investment by households, �rms and governments. This tends to make foreign borrowing and interest rates relatively cheaper
UNCORRECTED Relationship between the current account and the capital and
UNCORRECTED Relationship between the current account and the capital and
UNCORRECTED The overall BOP account should exactly balance or equal zero, at least in theory. That is, Australia’s
UNCORRECTED The overall BOP account should exactly balance or equal zero, at least in theory. That is, Australia’s
(where the total value of debits exceeds credits for goods, services, primary incomes and sec
UNCORRECTED (where the total value of debits exceeds credits for goods, services, primary incomes and sec
ondary incomes) is exactly equal to or offset by a
UNCORRECTED ondary incomes) is exactly equal to or offset by a capital and �nancial account surplus
UNCORRECTED capital and �nancial account surplus
of credits exceeds debits for net capital and investments). This directly increases our net foreign debt (NFD).
UNCORRECTED of credits exceeds debits for net capital and investments). This directly increases our net foreign debt (NFD).
As shown in �gure 3.6, the existence of ongoing CADs means that there has to be an offsetting rise in the nation’s
UNCORRECTED
As shown in �gure 3.6, the existence of ongoing CADs means that there has to be an offsetting rise in the nation’s net external liabilities, consisting of foreign debt (borrowed money) and foreign equity (ownership). Here, we are
UNCORRECTED
net external liabilities, consisting of foreign debt (borrowed money) and foreign equity (ownership). Here, we are essentially drawing on savings from the rest of the world to �nance our high levels of investment and consumption,
UNCORRECTED
essentially drawing on savings from the rest of the world to �nance our high levels of investment and consumption,
UNCORRECTED
and recording this as a net surplus (in�ow) on our capital and �nancial accounts. Clearly this is a two-way relation
UNCORRECTED
and recording this as a net surplus (in�ow) on our capital and �nancial accounts. Clearly this is a two-way relationship between the current account and the capital and �nancial accounts making up the overall BOP.
UNCORRECTED
ship between the current account and the capital and �nancial accounts making up the overall BOP.
PAGE egory is taken into account, the positive balance on Australia’s capital and �nancial account will exactly
PAGE egory is taken into account, the positive balance on Australia’s capital and �nancial account will exactly
is positive. This means there has been a net
PAGE is positive. This means there has been a net
overseas (consisting of either foreign debt or foreign
PAGE overseas (consisting of either foreign debt or foreign
equity in the case of ownership of Australian assets like property or shares). It will exactly offset the de�cit
PAGE equity in the case of ownership of Australian assets like property or shares). It will exactly offset the de�cit recorded on our current account, allowing the overall BOP account to be in balance.
PAGE recorded on our current account, allowing the overall BOP account to be in balance.
Relationship between the current account and the capital and PAGE
Relationship between the current account and the capital and
PROOFS the value of similar assets purchased by our residents. Port
PROOFS the value of similar assets purchased by our residents. Port
folio investment �owing in from overseas is recorded as a credit (the in�ow of funds or assets), while this
PROOFSfolio investment �owing in from overseas is recorded as a credit (the in�ow of funds or assets), while this sort of investment abroad by Australian residents is recorded as a debit (the out�ow of funds or liabili
PROOFSsort of investment abroad by Australian residents is recorded as a debit (the out�ow of funds or liabili-
PROOFS-debits (the out�ow of funds or
PROOFSdebits (the out�ow of funds or
contains both RBA and government transactions involving dealings in reserves of foreign
PROOFScontains both RBA and government transactions involving dealings in reserves of foreign
currencies, gold, special drawing rights and required contributions to the International Monetary Fund (IMF).
PROOFScurrencies, gold, special drawing rights and required contributions to the International Monetary Fund (IMF). Moneys received from overseas are categorised as credits (the in�ow of funds or assets), while payments
PROOFSMoneys received from overseas are categorised as credits (the in�ow of funds or assets), while payments overseas are categorised as debits (the out�ow of funds or liabilities) on Australia’s �nancial account.
PROOFS
overseas are categorised as debits (the out�ow of funds or liabilities) on Australia’s �nancial account.re�ects inaccuracies in the above calculations and estimations. When this catPROOFS
re�ects inaccuracies in the above calculations and estimations. When this category is taken into account, the positive balance on Australia’s capital and �nancial account will exactly PROOFS
egory is taken into account, the positive balance on Australia’s capital and �nancial account will exactly

156 Economics Down Under 2
c03AustraliaAndTheWorldEconomy 156 29 August 2016 1:07 PM
and, by adding to our NFD, it means there are heavy primary income debits to pay out (interest on borrowed credit, dividends to foreign shareholders, and pro�ts to foreign owned �rms), adding greatly to our CAD.
Weblinks The weblinks in these activities are available in this chapter’s student resources tab.
• Investopedia video: The balance of payments• 11 Understanding the capital account
CHECK YOUR UNDERSTANDING
1 What is the BOP account?2 Draw and label a structural diagram representing the BOP account for Australia, giving two relevant
examples of each speci�c type of transaction.3 What is the CAD and why is this typically large for Australia?4 Explain the relationship between the CAD and balance on capital and �nancial accounts.
APPLIED ECONOMIC EXERCISES
Apply your understanding of this subtopic by accessing and completing the Applied economic exercise(s).
• School-assessed coursework > Applied economic exercises > Question 2
3.3 The current account de�cit and its causesEach year Australia records a substantial current account de�cit (CAD) on its balance of payments account (BOP). As shown in �gure 3.7, Australia has a persistent current account de�cit (CAD). This means that the total value of debits for goods, services, primary incomes and secondary incomes is greater than the equivalent value of credits. Commentators often seize on the CAD as a sign of external instability or weakness, especially when its value (expressed as a percentage of GDP — measuring the size of the economy) is high, perhaps at a level above 3–4 per cent. This is sometimes taken as an indication that Australia is not paying its way in its international �nancial transactions.
10
0
20
02
–03
20
04
–05
20
05
–06
20
03
–04
20
06
–07
20
07
–08
20
08
–09
20
09
–10
20
10
–11
20
11
–12
20
12
–13
20
13
–14
20
14
–15
20
30
40
50
60
70
80
11.5
00.5
22.53
43.5
4.5
5.5
6.5
5
6
7
CA
D (
$ b
illio
ns)
Rat
io o
f C
AD
:GD
P (
per
cent
)
Year
CAD ($ billions);see LHS
CAD:GDP ratio forAustralia (annualpercentage, GDPreference year2011–12). A possiblegovernment’s targetmight be around3–4 per cent;see RHS
40.184
47.8
57.252.8
58.4
38.8
53.3
43.7
49.4
58.5
51.956.8
68.2
5.1
5.9
6.7
5.55.6
6.2
3.1
4.1
2.5
3.4
4
3
3.6
FIGURE 3.7 Indicators of Australia’s external imbalance and weakness, 2002–03 to 2014–15
Source: Data derived from ABS 5302.0 (Tables 1 and 35).
Figure 3.8 breaks down Australia’s current account into its four sub-accounts: net goods, net services, net primary incomes and net secondary incomes. As can be seen from the lower part of the graph, overall there is usually a CAD because most of the components are negative. Of special importance, however, is the huge de�cit recorded every year for net primary incomes. This signals that Australia is very dependent on heavy overseas borrowing and relying on capital in�ow, necessitating high levels of income debits.
UNCORRECTED value of credits. Commentators often seize on the CAD as a sign of
UNCORRECTED value of credits. Commentators often seize on the CAD as a sign of when its value (expressed as a percentage of GDP — measuring the size of the economy) is high, perhaps at
UNCORRECTED when its value (expressed as a percentage of GDP — measuring the size of the economy) is high, perhaps at a level above 3–4 per cent. This is sometimes taken as an indication that Australia is not
UNCORRECTED a level above 3–4 per cent. This is sometimes taken as an indication that Australia is not
UNCORRECTED
UNCORRECTED
UNCORRECTED
UNCORRECTED
UNCORRECTED
UNCORRECTED
UNCORRECTED
UNCORRECTED
UNCORRECTED
UNCORRECTED
UNCORRECTED
UNCORRECTED
UNCORRECTED
UNCORRECTED
UNCORRECTED
10
UNCORRECTED
10
UNCORRECTED
0UNCORRECTED
0
20
UNCORRECTED
20
UNCORRECTED
UNCORRECTED
UNCORRECTED
UNCORRECTED
UNCORRECTED
UNCORRECTED
UNCORRECTED
40.184
UNCORRECTED
40.184
47.8
UNCORRECTED
47.8
57.2
UNCORRECTED
57.252.8
UNCORRECTED
52.858.4
UNCORRECTED
58.4
68.2
UNCORRECTED
68.25.6
UNCORRECTED
5.66.2
UNCORRECTED 6.2
PAGE
PAGE
PAGE 3.3 The current account de�cit and its causes
PAGE 3.3 The current account de�cit and its causes
current account de�cit
PAGE current account de�cit (CAD) on its balance of payments account
PAGE (CAD) on its balance of payments account current account de�cit (CAD) on its balance of payments account current account de�cit
PAGE current account de�cit (CAD) on its balance of payments account current account de�cit
(BOP). As shown in �gure 3.7, Australia has a persistent current account de�cit (CAD). This means that the
PAGE (BOP). As shown in �gure 3.7, Australia has a persistent current account de�cit (CAD). This means that the total value of debits for goods, services, primary incomes and secondary incomes is greater than the equivalent PAGE total value of debits for goods, services, primary incomes and secondary incomes is greater than the equivalent value of credits. Commentators often seize on the CAD as a sign of PAGE
value of credits. Commentators often seize on the CAD as a sign of when its value (expressed as a percentage of GDP — measuring the size of the economy) is high, perhaps at PAGE
when its value (expressed as a percentage of GDP — measuring the size of the economy) is high, perhaps at
PROOFS
PROOFS
PROOFSepresenting the BOP account for Australia, giving two relevant
PROOFSepresenting the BOP account for Australia, giving two relevant
PROOFS
PROOFS
PROOFS
Apply your understanding of this subtopic by accessing and completing the Applied economic exercise(s).
PROOFS
Apply your understanding of this subtopic by accessing and completing the Applied economic exercise(s).
Question 2 PROOFS
Question 2

TOPIC 3 Australia and the world economy 157
c03AustraliaAndTheWorldEconomy 157 29 August 2016 1:07 PM
Net
bal
ance
s m
akin
g up
the
ove
rall
bala
nce
on c
urre
nt a
ccou
nt (
$ b
illio
ns)
Year
Trends in the values of the components making up Australia’s balance of payments oncurrent account, 2003–04 to 2015–16
–80
20
03
–04
20
04
–05
20
05
–06
20
06
–07
20
07
–08
20
08
–09
20
09
–10
20
10
–11
20
11
–12
20
12
–13
20
13
–14
20
14
–15
20
16
–17
20
15
–16
–60
–40
–20
0
20
40
4 Net secondaryincomes ($b)
1 Net goods($b)
2 Net services($b)
3 Net primaryincomes ($b)
–0.3
–23.7
–0.3
–0.4
–31.2
–1.9
–15.3 –14
–45.9
–0.3
–0.1
–50.2
–20.8
–3.3 –7.3 –10.7
–45.1–38
–13.6
–4.6
6.4
–14.3
–41.9–34
–7.7
–13.2
–56.3
–45.4
–0.9–1.5
–47.8
–1.1–2.9
21.9
8.7
–2
–2.3 –2.3 –2.1 –1.9
2.9
10.9
1.8
–37.6
–0.7
0.8
–23.5–23.6
FIGURE 3.8 Changes in the components making up Australia’s balance of payments current account
Source: Data derived from ABS 5302.0 (Tables 1 and 35).
To explain why Australia has a persistent CAD and ongoing external problems, we need to investigate the roles played by both aggregate demand-side factors and aggregate supply-side factors. The in�uence of these two sets of factors on the size of the CAD is illustrated hypothetically in �gure 3.9.
6
CyclicalCAD
Structural CAD
3
0CA
D:G
DP
rat
io (
perc
enta
ge)
Years
1. Aggregate demand-side factors. When stronger aggregatedemand conditions cause Australians to increase theirspending, or when there are weaker demand conditionsabroad, our cyclical CAD:GDP ratio will tend to rise fromaround 3 per cent to 6 per cent. Conversely, weakerspending locally or stronger spending overseas will usuallycause the cyclical CAD:GDP ratio to fall.
2. Aggregate supply-side factors. Ongoing unfavourableaggregate supply-side factors cause Australia’s structuralCAD:GDP ratio to be around 3 per cent. They re�ect ourdependence on overseas borrowing and debt due to thesavings–investment gap, our lower ef�ciency and high costs,and our poor international competitiveness.
FIGURE 3.9 How aggregate demand- and supply-side factors can contribute to Australia’s CAD and external instability
1. Changing aggregate demand-side conditionsAs we shall soon see, generally stronger demand-side conditions originating from within Australia (such as rises in our levels of consumer and business con�dence, disposable incomes and population), and higher levels of activity, tend to cause a rise in the size of our cyclical CAD. This is shown in �gure 3.9 where the CAD:GDP ratio ranges from perhaps 3 to 6 per cent of GDP or even higher. There are several reasons why stronger spending domestically can increase the cyclical CAD: • Strong spending can sometimes cause increased shortages and higher domestic prices for locally produced
goods and services. This makes imports relatively more attractive, increasing the CAD. • Strong domestic spending reduces the potential level of Australia’s exports and makes them less attractive,
increasing the CAD.
UNCORRECTED To explain why Australia has a persistent CAD and ongoing external problems, we need to investigate the
UNCORRECTED To explain why Australia has a persistent CAD and ongoing external problems, we need to investigate the
aggregate demand-side factors
UNCORRECTED aggregate demand-side factors and
UNCORRECTED and
sets of factors on the size of the CAD is illustrated hypothetically in �gure 3.9.
UNCORRECTED sets of factors on the size of the CAD is illustrated hypothetically in �gure 3.9.
UNCORRECTED
UNCORRECTED
UNCORRECTED
UNCORRECTED
UNCORRECTED
Structural CAD
UNCORRECTED
Structural CAD
UNCORRECTED
UNCORRECTED
UNCORRECTED
UNCORRECTED
UNCORRECTED
UNCORRECTED
R UNCORRECTED
REUNCORRECTED
E 3.9UNCORRECTED
3.9
PAGE
PAGE 2
01
3–1
4
PAGE 2
01
3–1
4
20
14
–15
PAGE 2
01
4–1
5
20
15
–16
PAGE 2
01
5–1
6
PAGE
PAGE
PAGE
PAGE
PAGE Changes in the components making up Australia’s balance of payments current accountPAGE Changes in the components making up Australia’s balance of payments current account
PROOFS
20
16
–17PROOFS
20
16
–17
4 Net secondary
PROOFS4 Net secondaryincomes ($b)
PROOFSincomes ($b)
3 Net primary
PROOFS3 Net primaryincomes ($b)
PROOFSincomes ($b)
PROOFS
PROOFS
PROOFS
PROOFS
PROOFS
PROOFS

158 Economics Down Under 2
c03AustraliaAndTheWorldEconomy 158 29 August 2016 1:07 PM
• Stronger domestic spending can cause the RBA to raise interest rates to control in�ation. This then tends to make Australia relatively more appealing to investors, attracting additional capital in�ow. This drives up our exchange rate, thereby reducing the value of our exports relative to imports and increasing the CAD.In reverse, when aggregate demand-side conditions within Australia are generally weaker and domestic
spending and activity are growing more slowly, the cyclical CAD usually shrinks.One slight complication here is that when economic conditions overseas are stronger and these accelerate
the value of spending on Australian exports (due to higher volumes and/or better commodity prices), our cyclical CAD should fall, whereas a slowdown in external demand can mean a larger CAD.
2. Changing aggregate supply-side conditionsFigure 3.9 also shows that generally less favourable aggregate supply-side conditions — such as the lack of domestic savings, higher costs of production, poor international competitiveness and severe weather events — cause Australia to have an ongoing structural CAD, perhaps equal to at least around 3 per cent of GDP. • The lack of domestic savings causes us to depend on borrowing from overseas, leading to income payments
abroad and a bigger structural CAD. • Higher production costs and poor international competitiveness reduce exports sales while encouraging
imports, thereby adding to our structural CAD.However, if supply-side conditions (including lower labour and other costs, improved productivity, a higher
savings ratio and ideal climatic conditions) generally become more favourable, the structural CAD should fall.Let us now take a closer look at the speci�c aggregate demand-side factors and aggregate supply-side factors
that determine the size of Australia’s CAD.
Aggregate demand-side causes of Australia’s cyclical CADAs already mentioned, changing domestic and international aggregate demand-side conditions can cause cyclical changes (both up and down) in the size of Australia’s CAD. As a general rule, if demand conditions overall cause spending on imports to rise and our exports to fall, the cyclical CAD will increase; while if spending conditions cause imports to fall and our exports to rise, the cyclical CAD will decrease. For various reasons, there was some rise in the CAD:GDP ratio during 2010–11 and 2012–13, followed more recently by generally lower levels during 2013–14 and 2014–15.
Changes in economic activity overseas and our terms of trade indexThe level of overseas economic activity (relating to the strength of GDP and economic growth among our major trading partners like China, Japan, South Korea, Europe and the United States) is an important aggregate demand-side factor that affects spending on Australia’s exports and hence our cyclical CAD. Overseas growth rates also directly affect the favourability of Australia’s terms of trade (the ratio of the prices the world is pre-pared to pay us for our commodity exports against the prices we have to pay for imports). • In general, weaker overseas activity depresses commodity prices and our terms of trade. This tends to reduce
the value of Australia’s exports relative to imports, increasing the size of the cyclical CAD. • By contrast, when economic growth abroad is stronger with higher terms of trade, the value of net exports
tends to rise faster, reducing our cyclical CAD.This relationship is illustrated in �gure 3.10. It shows how changes in the rate of economic growth in China, our
most important customer for exports, has affected our terms of trade and Australia’s CAD. Weaker GDP growth in China in the last few years has tended to depress the terms of trade and cause a rise in our cyclical CAD.
10.7 10.3
9.4 7.4 7.5 7.5
7
0
2
4
6
8
10
12
0
20
40
60
80
100
120
20
08
–09
20
09
–10
20
10
–11
20
11
–12
20
12
–13
20
13
–14
20
14
–15
20
15
–16
20
16
–17
20
17
–18A
ustr
alia
’s t
erm
s of
tra
de in
dex
and
CA
D (
$ b
illio
ns)
Year
Chi
na’s
ann
ual r
ate
ofG
DP
gro
wth
(pe
rcen
tage
)
Australia’s CAD($ billions); LHS
Terms of trade index at June(base year 2012–13 = 100index points); LHS
China’s annual rate of GDPgrowth (percentage); RHS
FIGURE 3.10 Relationship between China’s rate of economic growth, and Australia’s terms of trade and CAD
Sources: Data derived from ABS 5206.0 (Table 3); and Trading Economics, http://www.tradingeconomics.com/china/gdp-growth-annual.
UNCORRECTED Changes in economic activity overseas and our terms of trade index
UNCORRECTED Changes in economic activity overseas and our terms of trade index(relating to the strength of GDP and economic growth among our
UNCORRECTED (relating to the strength of GDP and economic growth among our major trading partners like China, Japan, South Korea, Europe and the United States) is an important aggregate
UNCORRECTED major trading partners like China, Japan, South Korea, Europe and the United States) is an important aggregate demand-side factor that affects spending on Australia’s exports and hence our cyclical CAD. Overseas growth
UNCORRECTED demand-side factor that affects spending on Australia’s exports and hence our cyclical CAD. Overseas growth rates also directly affect the favourability of Australia’s
UNCORRECTED rates also directly affect the favourability of Australia’s pared to pay us for our commodity exports against the prices we have to pay for imports).
UNCORRECTED pared to pay us for our commodity exports against the prices we have to pay for imports).
er overseas activity depresses commodity prices and our terms of trade. This tends to reduce
UNCORRECTED er overseas activity depresses commodity prices and our terms of trade. This tends to reduce
the value of Australia’s exports relative to imports, increasing the size of the cyclical CAD.
UNCORRECTED
the value of Australia’s exports relative to imports, increasing the size of the cyclical CAD.By contrast, when economic gro
UNCORRECTED
By contrast, when economic growth abroad is stronger with higher terms of trade, the value of net exports
UNCORRECTED
wth abroad is stronger with higher terms of trade, the value of net exports tends to rise faster, reducing our cyclical CAD.
UNCORRECTED
tends to rise faster, reducing our cyclical CAD.This relationship is illustrated in �gure 3.10. It shows how changes in the rate of economic growth in China, our
UNCORRECTED
This relationship is illustrated in �gure 3.10. It shows how changes in the rate of economic growth in China, our most important customer for exports, has affected our terms of trade and Australia’s CAD. Weaker GDP growth in
UNCORRECTED
most important customer for exports, has affected our terms of trade and Australia’s CAD. Weaker GDP growth in China in the last few years has tended to depress the terms of trade and cause a rise in our cyclical CAD.
UNCORRECTED
China in the last few years has tended to depress the terms of trade and cause a rise in our cyclical CAD.
UNCORRECTED
UNCORRECTED
UNCORRECTED
UNCORRECTED
10.7
UNCORRECTED
10.7 10.3
UNCORRECTED
10.3
80
UNCORRECTED
80
100
UNCORRECTED
100
120
UNCORRECTED
120
Aus
tral
ia’s
ter
ms
of t
rade
inde
x an
d
UNCORRECTED
Aus
tral
ia’s
ter
ms
of t
rade
inde
x an
dC
AD
($
bill
ions
)
UNCORRECTED
CA
D (
$ b
illio
ns)
UNCORRECTED
UNCORRECTED
UNCORRECTED
UNCORRECTED
UNCORRECTED
UNCORRECTED PAGE As already mentioned, changing domestic and international aggregate demand-side conditions can cause
PAGE As already mentioned, changing domestic and international aggregate demand-side conditions can cause changes (both up and down) in the size of Australia’s CAD. As a general rule, if demand conditions
PAGE changes (both up and down) in the size of Australia’s CAD. As a general rule, if demand conditions overall cause spending on imports to rise and our exports to fall, the
PAGE overall cause spending on imports to rise and our exports to fall, the cyclical CAD
PAGE cyclical CAD
spending conditions cause imports to fall and our exports to rise, the cyclical CAD will decrease. For various
PAGE spending conditions cause imports to fall and our exports to rise, the cyclical CAD will decrease. For various reasons, there was some rise in the CAD:GDP ratio during 2010–11 and 2012–13, followed more recently by
PAGE reasons, there was some rise in the CAD:GDP ratio during 2010–11 and 2012–13, followed more recently by
Changes in economic activity overseas and our terms of trade indexPAGE Changes in economic activity overseas and our terms of trade index
(relating to the strength of GDP and economic growth among our PAGE
(relating to the strength of GDP and economic growth among our
PROOFSlack of domestic savings causes us to depend on borrowing from overseas, leading to income payments
PROOFSlack of domestic savings causes us to depend on borrowing from overseas, leading to income payments
veness reduce exports sales while encouraging
PROOFSveness reduce exports sales while encouraging
However, if supply-side conditions (including lower labour and other costs, improved productivity, a higher
PROOFSHowever, if supply-side conditions (including lower labour and other costs, improved productivity, a higher
savings ratio and ideal climatic conditions) generally become more favourable, the structural CAD should fall.
PROOFSsavings ratio and ideal climatic conditions) generally become more favourable, the structural CAD should fall.
Let us now take a closer look at the speci�c aggregate demand-side factors and aggregate supply-side factors
PROOFSLet us now take a closer look at the speci�c aggregate demand-side factors and aggregate supply-side factors
Aggregate demand-side causes of Australia’s cyclical CADPROOFS
Aggregate demand-side causes of Australia’s cyclical CADAs already mentioned, changing domestic and international aggregate demand-side conditions can cause PROOFS
As already mentioned, changing domestic and international aggregate demand-side conditions can cause changes (both up and down) in the size of Australia’s CAD. As a general rule, if demand conditions PROOFS
changes (both up and down) in the size of Australia’s CAD. As a general rule, if demand conditions

TOPIC 3 Australia and the world economy 159
c03AustraliaAndTheWorldEconomy 159 29 August 2016 1:07 PM
Changes in the exchange rate for the Australian dollarThe exchange rate for the Australian dollar can be an aggregate demand-side factor that affects spending and hence the cyclical CAD. • A weaker Australian dollar, as seen between 2013 and 2016, tends to reduce the cyclical CAD. This is
because exports are relatively cheaper and boost the value of sales or credits, while imports are dearer and depress our spending. As a result, the CAD tends to fall.
• A stronger Australian dollar results in lower net exports of goods and services (X – M), and this tends to increase the CAD.
Changes in consumer sentiment, business con�dence and real disposable incomeChanging levels of domestic consumer sentiment and business con�dence about the future are aggregate demand-side factors that greatly affect our spending on imports of both goods and services, thus affecting the size of Australia’s CAD. • When households and businesses are more pessimistic about their future economic circumstances or expe-
rience a fall in real household disposable income as occurred during 2013–15, they tend to save rather than spend, thereby slowing their purchases of imports such as appliances, cars, overseas holidays, machinery and materials. This reduces our cyclical CAD.
• In contrast, greater optimism and faster rises in disposable income tend to cause spending on imports to rise, increasing the cyclical CAD.
Changes in interest ratesAs an aggregate demand-side factor, interest rates have an effect on the levels of both household consumption and business investment spending. At least some of this spending involves imports of goods and services, and hence interest rates will directly affect the CAD. • Lower interest rates and cheaper credit offered to households and �rms during 2011 and 2016 have
encouraged more spending on imports of cars, electronics, clothes, overseas holidays and equipment, thus increasing the CAD.
• However, higher interest rates tend to discourage borrowing and spending on imports because of the increased costs of repaying debt. This should help reduce Australia’s CAD.A slight complication with interest rates is that they also affect the exchange rate and thus the CAD. For
instance, we will soon see that reductions in interest rates by the RBA in 2011–16 relative to those abroad (which would normally increase spending on imports and raise the CAD) have also weakened the Australian dollar. This offsetting factor tends to boost net exports and lower the CAD.
Changes in government defence spending and foreign aidLevels of federal government budget outlays on defence equipment, peacekeeping and foreign aid all affect the CAD. • Imports of defence equipment, including submarines and aircraft, along with foreign aid and spending on
peacekeeping operations in Afghanistan, the Solomon Islands, Iraq and Timor-Leste, have all contributed to Australia’s large CAD.
• However, the recent cuts in foreign aid would tend to reduce the cyclical CAD by decreasing secondary income debits.
Aggregate supply-side causes of Australia’s structural CADAggregate supply-side factors also help to explain Australia’s big and ongoing structural CAD and our net foreign debt (NFD). These factors relate to the way our economy is organised and how production is carried out. Structural problems can re�ect various adverse supply-side conditions such as • poor labour ef�ciency and rising production costs for local �rms that reduce our business competitiveness
against imports • a lack of domestic savings leading to higher interest rates here relative to those overseas • bottlenecks or constraints such as labour shortages • an ageing population • droughts and �oods
all lower our ability to competitively produce exports. These structural problems worsen the structural CAD and erode our living standards.
In recent years, a number of supply-side factors (many of them adverse) have affected Australia’s interna-tional transactions and added to our structural CAD (and NFD). We will now take a closer look at them.
An overall de�ciency of national savings and dependence on overseas borrowingThe level of national savings relative to investment is perhaps the most important aggregate supply-side factor in�uencing the size of a nation’s structural CAD.
UNCORRECTED A slight complication with interest rates is that they also affect the exchange rate and thus the CAD. For
UNCORRECTED A slight complication with interest rates is that they also affect the exchange rate and thus the CAD. For instance, we will soon see that reductions in interest rates by the RBA in 2011–16 relative to those abroad
UNCORRECTED instance, we will soon see that reductions in interest rates by the RBA in 2011–16 relative to those abroad (which would normally increase spending on imports and raise the CAD) have also weakened the Australian
UNCORRECTED (which would normally increase spending on imports and raise the CAD) have also weakened the Australian dollar. This offsetting factor tends to boost net exports and lower the CAD.
UNCORRECTED dollar. This offsetting factor tends to boost net exports and lower the CAD.
UNCORRECTED Changes in government defence spending and foreign aid
UNCORRECTED Changes in government defence spending and foreign aidLevels of federal government budget outlays on defence equipment, peacekeeping and foreign aid all affect
UNCORRECTED Levels of federal government budget outlays on defence equipment, peacekeeping and foreign aid all affect
Imports of defence equipment, including
UNCORRECTED
Imports of defence equipment, including peacekeeping operations in Afghanistan, the Solomon Islands, Iraq and Timor-Leste, have all contributed to
UNCORRECTED
peacekeeping operations in Afghanistan, the Solomon Islands, Iraq and Timor-Leste, have all contributed to
wever, the recent cuts in foreign aid would tend to reduce the cyclical CAD by decreasing secondary
UNCORRECTED
wever, the recent cuts in foreign aid would tend to reduce the cyclical CAD by decreasing secondary
Aggregate supply-side causes of Australia’s structural CAD
UNCORRECTED
Aggregate supply-side causes of Australia’s structural CADAggregate supply-side factors
UNCORRECTED
Aggregate supply-side factors
UNCORRECTED
foreign debt (NFD). These factors relate to the way our economy is organised and how production is carried
UNCORRECTED
foreign debt (NFD). These factors relate to the way our economy is organised and how production is carried out. Structural problems can re�ect various adverse supply-side conditions such asUNCORRECTED
out. Structural problems can re�ect various adverse supply-side conditions such aspoor labour ef�ciencUNCORRECTED
poor labour ef�ciencagainst importsUNCORRECTED
against imports
PAGE and business investment spending. At least some of this spending involves imports of goods and services, and
PAGE and business investment spending. At least some of this spending involves imports of goods and services, and
wer interest rates and cheaper credit offered to households and �rms during 2011 and 2016 have
PAGE wer interest rates and cheaper credit offered to households and �rms during 2011 and 2016 have
encouraged more spending on imports of cars, electronics, clothes, overseas holidays and equipment, thus
PAGE encouraged more spending on imports of cars, electronics, clothes, overseas holidays and equipment, thus
wever, higher interest rates tend to discourage borrowing and spending on imports because of the
PAGE wever, higher interest rates tend to discourage borrowing and spending on imports because of the
increased costs of repaying debt. This should help reduce Australia’s CAD.PAGE increased costs of repaying debt. This should help reduce Australia’s CAD.A slight complication with interest rates is that they also affect the exchange rate and thus the CAD. For PAGE
A slight complication with interest rates is that they also affect the exchange rate and thus the CAD. For instance, we will soon see that reductions in interest rates by the RBA in 2011–16 relative to those abroad PAGE
instance, we will soon see that reductions in interest rates by the RBA in 2011–16 relative to those abroad
PROOFSdemand-side factors that greatly affect our spending on imports of both goods and services, thus affecting the
PROOFSdemand-side factors that greatly affect our spending on imports of both goods and services, thus affecting the
usinesses are more pessimistic about their future economic circumstances or expe
PROOFSusinesses are more pessimistic about their future economic circumstances or expe-
PROOFS-rience a fall in real household disposable income as occurred during 2013–15, they tend to save rather than
PROOFSrience a fall in real household disposable income as occurred during 2013–15, they tend to save rather than spend, thereby slowing their purchases of imports such as appliances, cars, overseas holidays, machinery
PROOFSspend, thereby slowing their purchases of imports such as appliances, cars, overseas holidays, machinery
aster rises in disposable income tend to cause spending on imports to rise,
PROOFSaster rises in disposable income tend to cause spending on imports to rise,
have an effect on the levels of both household consumption PROOFS
have an effect on the levels of both household consumption and business investment spending. At least some of this spending involves imports of goods and services, and PROOFS
and business investment spending. At least some of this spending involves imports of goods and services, and

160 Economics Down Under 2
c03AustraliaAndTheWorldEconomy 160 29 August 2016 1:07 PM
Unfortunately, Australian households, businesses and governments generally do not save enough to �nance the high level of national investment spending by �rms and governments needed to grow the economy’s pro-ductive capacity and maintain high living standards. This causes Australia to have a large, long-term national savings–investment gap that has become the biggest single reason for our large structural CAD. Figure 3.11 illustrates this diagrammatically. Here, for example, national savings level of say, $200 billion a year, is insuf-�cient to �nance national investment of $300 billion a year. As a result, there has been an increase in foreign borrowing and liabilities of, say, $100 billion a year. This adds to our net foreign debt or NFD (the amount by which Australia’s liabilities abroad exceeds what people abroad owe us).
National savings byhouseholds,
businesses andgovernments
= $200 billion
National investmentby the private and
governmentsectors
= $300 billion
Savings–investment gap(�lled by overseas borrowing)
Valu
e ($
bill
ions
)
300
200
100
0
FIGURE 3.11 Australia’s savings–investment gap shown hypothetically
Australia’s NFD has increased from 46 per cent of GDP in 2002–03 to a record high of 61 per cent by 2014–15. This is largely attributed to rising private sector debt or equity. However, the return of massive government budget de�cits since 2008–09 (possibly to continue beyond 2019–20), partly �nanced by bor-rowing abroad, has pushed up our NFD. Additionally, as shown in �gure 3.12, private borrowing overseas by Australians is encouraged by higher interest rates here against those overseas.
Of�
cial
inte
rest
rat
e se
t by
the
cen
tral
bank
(pe
rcen
tage
)
Australia Euro area UnitedKingdom
USA Japan0
0.5
1.0
1.5
2.0
2.5
3.0
3.5
0.50
0.05 0.13 0.10
2.0
FIGURE 3.12 Differences between of�cial interest rates (percentage in July 2015) in Australia and those overseas contribute to our structural CAD and growing NFD.
Source: Data derived from RBA Statistics, Table F13.
We face high interest rates partly because of the relatively low supply of national savings (as a result of inadequate savings by Australian households, �rms and government) combined with a high demand for credit (by Australian governments, businesses and households). In turn, large interest rate differentials like these not only make Australia look attractive to foreign investors or lenders seeking relatively high returns, they also encourage Australians wanting cheaper credit to borrow overseas. Either way, this causes Australia’s NFD and the structural CAD to remain high, with potentially adverse implications for our living standards.
Additionally, when extra credit is sucked into Australia from overseas following rises in domestic interest rates, this helps to drive up the demand for the Australian dollar and tends to lift the exchange rate. In turn, this makes our exports of goods and services less competitive relative to imports, thereby worsening our long-term structural CAD. By contrast, when the RBA cuts domestic interest rates as a result of weaker economic activity (as happened in between 2011 and 2016), interest rate differentials between Australia and overseas narrow. In itself, this development should help to lower production costs locally, weaken the exchange rate (as a result of the exit of money capital) and stimulate exports relative to imports, perhaps reducing the CAD.
UNCORRECTED
UNCORRECTED
UNCORRECTED
UNCORRECTED
UNCORRECTED
UNCORRECTED
UNCORRECTED
UNCORRECTED
UNCORRECTED
UNCORRECTED
UNCORRECTED
UNCORRECTED
UNCORRECTED
UNCORRECTED
UNCORRECTED
UNCORRECTED
UNCORRECTED
UNCORRECTED
Of�
cial
inte
rest
rat
e se
t by
the
cen
tral
UNCORRECTED
Of�
cial
inte
rest
rat
e se
t by
the
cen
tral
bank
(pe
rcen
tage
)
UNCORRECTED
bank
(pe
rcen
tage
)
0
UNCORRECTED
0
0.5
UNCORRECTED
0.5
1.0
UNCORRECTED
1.0
UNCORRECTED
UNCORRECTED
UNCORRECTED
UNCORRECTED
UNCORRECTED
UNCORRECTED
UNCORRECTED
UNCORRECTED
UNCORRECTED
UNCORRECTED
UNCORRECTED
UNCORRECTED
UNCORRECTED 2.0
UNCORRECTED 2.0
UNCORRECTED
UNCORRECTED
UNCORRECTED
I
UNCORRECTED
IGU
UNCORRECTED
GUR
UNCORRECTED
RE
UNCORRECTED
E 3.12
UNCORRECTED
3.12
Source: UNCORRECTED
Source: Data derived from RBA Statistics, Table F13.UNCORRECTED
Data derived from RBA Statistics, Table F13.
We face high interest rates partly because of the relatively low supply of national savings (as a result of UNCORRECTED
We face high interest rates partly because of the relatively low supply of national savings (as a result of
PAGE Australia’s savings–investment gap shown hypothetically
PAGE Australia’s savings–investment gap shown hypothetically
Australia’s NFD has increased from 46 per cent of GDP in 2002–03 to a record high of 61 per cent by
PAGE Australia’s NFD has increased from 46 per cent of GDP in 2002–03 to a record high of 61 per cent by
2014–15. This is largely attributed to rising private sector debt or equity. However, the return of massive
PAGE 2014–15. This is largely attributed to rising private sector debt or equity. However, the return of massive government budget de�cits since 2008–09 (possibly to continue beyond 2019–20), partly �nanced by bor
PAGE government budget de�cits since 2008–09 (possibly to continue beyond 2019–20), partly �nanced by borrowing abroad, has pushed up our NFD. Additionally, as shown in �gure 3.12, private borrowing overseas by
PAGE rowing abroad, has pushed up our NFD. Additionally, as shown in �gure 3.12, private borrowing overseas by Australians is encouraged by higher interest rates here against those overseas.PAGE Australians is encouraged by higher interest rates here against those overseas.
PROOFS
PROOFSNational investment
PROOFSNational investmentby the private and
PROOFSby the private and
government
PROOFSgovernment
sectors
PROOFSsectors
= $300 billion
PROOFS
= $300 billion
PROOFS

TOPIC 3 Australia and the world economy 161
c03AustraliaAndTheWorldEconomy 161 29 August 2016 1:07 PM
In contrast to the situation in Australia, countries that have relatively high levels of national savings often have a current account surplus (CAS) from receiving substantial primary income credits for interest from their loans abroad, and dividends and pro�ts from their ownership of shares and companies overseas.
Weaker growth in productivityProductivity indicates ef�ciency. There are two main measures of productivity. Labour productivity re�ects changes in GDP divided by the total number of hours worked, while multifactor productivity is calculated by dividing GDP by the total value of labour, capital and other inputs used. Ef�ciency levels are seen as an aggregate supply-side factor that can affect our competitiveness and the size of the country’s structural CAD.
Strong rises in labour and multifactor productivity during the 1990s meant more output per unit of labour and capital resources, lowering production costs for local �rms. Unfortunately, productivity has also been rela-tively weaker in recent years. This has adversely affected Australia’s international competitiveness, slowing export sales, lifting imports and adding to the structural CAD. Indeed, current ef�ciency levels in most indus-tries are only around 80 per cent of those in the United States, and even weaker relative to some other countries.
Changes in real unit labour costs (RULCs)Wages are the major production cost in many industries, often accounting for around 60–70 per cent of the overall total. Hence, the level of real wage costs per unit is an important aggregate supply-side factor that can help determine whether or not locally made goods and services can compete with imports. In turn, this affects our structural CAD. • Australia’s real unit labour costs recently recorded a zero increase, on average, during 2011–12 to 2014–15.
This helped to keep a key production cost lower, making our exports more competitive or attractive and tending to lower the structural CAD.
• Yet in absolute terms, Australia’s average hourly pay rates are almost the highest in the world, and we have the highest minimum wage of any country. From an economic perspective, this is a problem. It reduces our international competitiveness and net export sales, pushing up the structural CAD.
Severe climatic conditionsAustralia’s productive and export capacities are increasingly in�uenced by severe climatic conditions that have the ability to affect net exports of goods and services, and hence the structural CAD. • Droughts (to 2010, again in 2012–16), �oods (in 2011 and 2013), �res (in 2011 and 2013) and other extreme
weather events in eastern and northern parts of Australia, have limited our capacity to produce some exports. These include rural production (grains, meat, wool, fruit, vegetables), minerals (due to �ooded mines and destroyed transport infrastructure) and tourism (destroyed by storms and �oods). As a consequence of slowing exports and, in some cases, a greater food dependence on imports, the structural CAD was pushed higher.
• By contrast, ideal climatic events would increase the value of net exports and reduce the CAD.
Changes in oil pricesOil is an important production and distribution cost for many local producers. It is a signi�cant import item that is re�ected in the �nal selling price and hence competitiveness of locally produced goods and services. • High oil prices (over US$100 per barrel in 2008 and 2012) greatly increased the cost and value of Australia’s
oil imports (upon which we rely for around 60 per cent of our needs) and exerted upward pressure on the CAD and a downward force on the exchange rate.
• However, much lower oil prices (under US$50 per barrel in 2014–16) helped to reduce imports and took some pressure off our structural CAD.
Demographic events, including ageingA country’s population growth and age distribution is an aggregate supply factor that can affect our productive capacity, exports and the structural CAD. • Australia’s ageing population and decreasing participation rate slow the growth in labour resources and
increase wages. This reduces the competitiveness of our exports. Additionally, labour and skills shortages act as a bottleneck, limiting the growth of exports and adding to the structural CAD.
• Immigration on the other hand (around 190 000 per year, of whom around 65 per cent are skilled with an average age of around 37) is potentially a more favourable supply-side factor that keeps wage costs lower and eases labour bottlenecks. As a result, exports become more internationally competitive, thus tending to reduce our structural CAD.
Weblinks The weblinks in these activities are available in this chapter’s student resources in tab.• The relationship between the current account balance and exchange rates• Economics 1, Lecture 23: Exchange rates and balance of payments
UNCORRECTED weather events in eastern and northern parts of Australia, have limited our capacity to produce some exports.
UNCORRECTED weather events in eastern and northern parts of Australia, have limited our capacity to produce some exports. These include rural production (grains, meat, wool, fruit, vegetables), minerals (due to �ooded mines and
UNCORRECTED These include rural production (grains, meat, wool, fruit, vegetables), minerals (due to �ooded mines and destroyed transport infrastructure) and tourism (destroyed by storms and �oods). As a consequence of slowing
UNCORRECTED destroyed transport infrastructure) and tourism (destroyed by storms and �oods). As a consequence of slowing exports and, in some cases, a greater food dependence on imports, the structural CAD was pushed higher.
UNCORRECTED exports and, in some cases, a greater food dependence on imports, the structural CAD was pushed higher.
UNCORRECTED contrast, ideal climatic events would increase the value of net exports and reduce the CAD.
UNCORRECTED contrast, ideal climatic events would increase the value of net exports and reduce the CAD.
Oil is an important production and distribution cost for many local producers. It is a signi�cant import
UNCORRECTED
Oil is an important production and distribution cost for many local producers. It is a signi�cant import item that is re�ected in the �nal selling price and hence competitiveness of locally produced goods and services.
UNCORRECTED
item that is re�ected in the �nal selling price and hence competitiveness of locally produced goods and services.ver US$100 per barrel in 2008 and 2012) greatly increased the cost and value of Australia’s
UNCORRECTED
ver US$100 per barrel in 2008 and 2012) greatly increased the cost and value of Australia’s oil imports (upon which we rely for around 60 per cent of our needs) and exerted upward pressure on the
UNCORRECTED
oil imports (upon which we rely for around 60 per cent of our needs) and exerted upward pressure on the CAD and a downward force on the exchange rate.
UNCORRECTED
CAD and a downward force on the exchange rate.wever, much lower oil prices (under US$50 per barrel in 2014–16) helped to reduce imports and took
UNCORRECTED
wever, much lower oil prices (under US$50 per barrel in 2014–16) helped to reduce imports and took some pressure off our structural CAD.
UNCORRECTED
some pressure off our structural CAD.
UNCORRECTED
mographic events, including ageing
UNCORRECTED
mographic events, including ageingA country’s population growth and age distribution is an aggregate supply factor that can affect our productive
UNCORRECTED
A country’s population growth and age distribution is an aggregate supply factor that can affect our productive capacity, exports and the structural CAD.UNCORRECTED
capacity, exports and the structural CAD.Australia’UNCORRECTED
Australia’s ageing population and decreasing participation rate slow the growth in labour resources and UNCORRECTED
s ageing population and decreasing participation rate slow the growth in labour resources and increase wages. This reduces the competitiveness of our exports. Additionally, labour and skills shortages UNCORRECTED
increase wages. This reduces the competitiveness of our exports. Additionally, labour and skills shortages
PAGE the highest minimum wage of any country. From an economic perspective, this is a problem. It reduces our
PAGE the highest minimum wage of any country. From an economic perspective, this is a problem. It reduces our international competitiveness and net export sales, pushing up the structural CAD.
PAGE international competitiveness and net export sales, pushing up the structural CAD.
Australia’s productive and export capacities are increasingly in�uenced by severe climatic conditions that have
PAGE Australia’s productive and export capacities are increasingly in�uenced by severe climatic conditions that have the ability to affect net exports of goods and services, and hence the structural CAD.
PAGE the ability to affect net exports of goods and services, and hence the structural CAD.
ain in 2012–16), �oods (in 2011 and 2013), �res (in 2011 and 2013) and other extreme PAGE ain in 2012–16), �oods (in 2011 and 2013), �res (in 2011 and 2013) and other extreme
weather events in eastern and northern parts of Australia, have limited our capacity to produce some exports. PAGE
weather events in eastern and northern parts of Australia, have limited our capacity to produce some exports.
PROOFStries are only around 80 per cent of those in the United States, and even weaker relative to some other countries.
PROOFStries are only around 80 per cent of those in the United States, and even weaker relative to some other countries.
Wages are the major production cost in many industries, often accounting for around 60–70 per cent of the overall
PROOFSWages are the major production cost in many industries, often accounting for around 60–70 per cent of the overall total. Hence, the level of real wage costs per unit is an important aggregate supply-side factor that can help determine
PROOFStotal. Hence, the level of real wage costs per unit is an important aggregate supply-side factor that can help determine whether or not locally made goods and services can compete with imports. In turn, this affects our structural CAD.
PROOFSwhether or not locally made goods and services can compete with imports. In turn, this affects our structural CAD.
s real unit labour costs recently recorded a zero increase, on average, during 2011–12 to 2014–15.
PROOFSs real unit labour costs recently recorded a zero increase, on average, during 2011–12 to 2014–15.
This helped to keep a key production cost lower, making our exports more competitive or attractive and
PROOFSThis helped to keep a key production cost lower, making our exports more competitive or attractive and
et in absolute terms, Australia’s average hourly pay rates are almost the highest in the world, and we have PROOFS
et in absolute terms, Australia’s average hourly pay rates are almost the highest in the world, and we have the highest minimum wage of any country. From an economic perspective, this is a problem. It reduces our PROOFS
the highest minimum wage of any country. From an economic perspective, this is a problem. It reduces our

162 Economics Down Under 2
c03AustraliaAndTheWorldEconomy 162 29 August 2016 1:07 PM
CHECK YOUR UNDERSTANDING
1 Identify and explain three important aggregate demand-side factors affecting Australia’s cyclical CAD.2 Identify and explain three important aggregate supply-side factors affecting Australia’s structural CAD.3 Explain the meaning of the savings–investment gap, giving reasons for its existence.
APPLIED ECONOMIC EXERCISES
Apply your understanding of this subtopic by accessing and completing the Applied economic exercise(s).
• School-assessed coursework > Applied economic exercises > Question 3
3.4 The net foreign debt (NFD)Foreign debt is often associated with a country not living within its means or paying its way in international �nancial transactions. Here we might think of the problems experienced in recent years by countries like Greece, Spain and Italy, where there has been poor �nancial management over many years. Hence, debt levels often tell us something about the country’s external situation.
De�nition of the NFD and NFENet foreign debt (NFD) is the difference in value between what Australia has borrowed from and owes over-seas (our liabilities) minus what Australia has lent or invested abroad (our assets). It is sometimes used as an indicator of Australia’s external position and includes borrowing through the issue of bonds, loans, advances and overdrafts.
The NFD differs from foreign equity (the ownership of assets like shares and property) because debt implies that there is an obligation to pay interest and, at some time in the future, to repay the original capital borrowed. As previously mentioned, the NFD is largely the consequence of a de�ciency of national savings by the pri-vate sector (households and �rms) and the public sector (various governments) to �nance our high levels of national investment. As mentioned already, this is called the savings–investment gap.
Foreign borrowing through the creation of debt is one type of overseas capital in�ow. The other (and much less signi�cant) type of capital in�ow is foreign equity. Net foreign equity (NFE) represents the excess value of foreign-owned Australian assets (such as property, shares and the retained earnings of overseas-owned com-panies operating here) over overseas assets owned by Australian residents.
Composition of and trends in the NFDAustralia’s NFD has grown quite rapidly over the last decade (see �gure 3.13). It is now almost $980 000 billion, or equal to over 61 per cent of GDP (as a measure of the overall size of the economy). For Australia, there are two main types of overseas borrowers: • of�cial (public or government sector) borrowers, who generate of�cial debt • non-of�cial (private sector) borrowers, who generate non-of�cial debt.
535964675246
750435
976056
–200000
0
200000
400000
600000
800000
1000000
1200000
20
06
–07
20
07
–08
20
08
–09
20
09
–10
20
10
–11
20
11
–12
20
12
–13
20
13
–14
20
14
–15
20
15
–16
20
16
–17
20
17
–18N
et e
xter
nal d
ebt
($ b
illio
ns)
Year
Of�cial or publicsector debt
Non-of�cial orprivate sector debt
Total NFD
FIGURE 3.13 The composition of Australia’s net foreign liabilities ($ billions at June)
Source: Data derived from RBA Statistics, International Trade and External Finance, Table I5.
UNCORRECTED vate sector (households and �rms) and the public sector (various governments) to �nance our high levels of
UNCORRECTED vate sector (households and �rms) and the public sector (various governments) to �nance our high levels of national investment. As mentioned already, this is called the savings–investment gap.
UNCORRECTED national investment. As mentioned already, this is called the savings–investment gap.Foreign borrowing through the creation of debt is one type of overseas capital in�ow. The other (and much
UNCORRECTED Foreign borrowing through the creation of debt is one type of overseas capital in�ow. The other (and much
less signi�cant) type of capital in�ow is foreign equity.
UNCORRECTED less signi�cant) type of capital in�ow is foreign equity. of foreign-owned Australian assets (such as property, shares and the retained earnings of overseas-owned com
UNCORRECTED of foreign-owned Australian assets (such as property, shares and the retained earnings of overseas-owned companies operating here) over overseas assets owned by Australian residents.
UNCORRECTED panies operating here) over overseas assets owned by Australian residents.
Composition of and trends in the NFD
UNCORRECTED
Composition of and trends in the NFDAustralia’s NFD has grown quite rapidly over the last decade (see �gure 3.13). It is now almost $980
UNCORRECTED
Australia’s NFD has grown quite rapidly over the last decade (see �gure 3.13). It is now almost $980ver 61 per cent of GDP (as a measure of the overall size of the economy). For Australia, there are
UNCORRECTED
ver 61 per cent of GDP (as a measure of the overall size of the economy). For Australia, there are main types of overseas borrowers:
UNCORRECTED
main types of overseas borrowers: (public or government sector) borrowers, who generate
UNCORRECTED
(public or government sector) borrowers, who generate non-of�cial
UNCORRECTED
non-of�cial (private sector) borrowers, who generate
UNCORRECTED
(private sector) borrowers, who generate
800000UNCORRECTED
800000
1000000
UNCORRECTED
1000000
1200000
UNCORRECTED
1200000
Net
ext
erna
l deb
t ($
bill
ions
)
UNCORRECTED
Net
ext
erna
l deb
t ($
bill
ions
)
PAGE in value between what Australia has borrowed from and owes over
PAGE in value between what Australia has borrowed from and owes over what Australia has lent or invested abroad (our assets). It is sometimes used as an
PAGE what Australia has lent or invested abroad (our assets). It is sometimes used as an indicator of Australia’s external position and includes borrowing through the issue of bonds, loans, advances
PAGE indicator of Australia’s external position and includes borrowing through the issue of bonds, loans, advances
The NFD differs from foreign equity (the ownership of assets like shares and property) because debt implies
PAGE The NFD differs from foreign equity (the ownership of assets like shares and property) because debt implies
that there is an obligation to pay interest and, at some time in the future, to repay the original capital borrowed.
PAGE that there is an obligation to pay interest and, at some time in the future, to repay the original capital borrowed. As previously mentioned, the NFD is largely the consequence of a de�ciency of national savings by the priPAGE As previously mentioned, the NFD is largely the consequence of a de�ciency of national savings by the private sector (households and �rms) and the public sector (various governments) to �nance our high levels of PAGE
vate sector (households and �rms) and the public sector (various governments) to �nance our high levels of
PROOFS
PROOFS
PROOFSpaying its way
PROOFSpaying its way in international
PROOFS in international
�nancial transactions. Here we might think of the problems experienced in recent years by countries like
PROOFS�nancial transactions. Here we might think of the problems experienced in recent years by countries like Greece, Spain and Italy, where there has been poor �nancial management over many years. Hence, debt levels
PROOFSGreece, Spain and Italy, where there has been poor �nancial management over many years. Hence, debt levels
in value between what Australia has borrowed from and owes overPROOFS
in value between what Australia has borrowed from and owes over

TOPIC 3 Australia and the world economy 163
c03AustraliaAndTheWorldEconomy 163 29 August 2016 1:07 PM
1. Public sector or of�cial government borrowingDuring and following the global �nancial crisis (GFC) of 2008–10, the federal and some state and local governments borrowed money overseas to help �nance their often large budget de�cits (the federal budget de�cits alone total around $325 billion over eight years). To the extent to which governments depended on credit sourced overseas, this added to our NFD. Indeed, in 2014–15 the of�cial or public sector’s foreign debt comprised approximately 25 per cent of our overall NFD.
2. Private sector or non-of�cial borrowingThe main private sector or non-of�cial borrowers are large companies that need to raise capital for �nancing business expansion and takeovers. Part of this represents net foreign equities that arise from the excess value of foreign-owned Australian assets (like companies, shares and property) over overseas assets owned by Australian residents. Additionally, our banks now source from overseas a large proportion of the money they use for lending to households and �rms. Indeed, Australia’s high domestic interest rates and lack of national savings have exacerbated this problem.
Contrary to popular opinion, debt is not always bad. It can be good — provided it is used wisely for sound investment projects that deliver ongoing returns and future bene�ts. Our overseas debt can also make up for the de�ciency in local savings and make access to credit more affordable when domestic interest rates are high. However, as with all debt, the main problem is affording the interest payments. When the Australian dollar depreciates, the debt burden (if denominated in a stronger currency like the US dollar) may become very heavy indeed. Interest and other repayments then require more Australian dollars to be converted into other currencies. Additionally, if our foreign debt rises too quickly and exceeds our capacity to sustain repayments, our credit rating as a nation may be downgraded by rating agencies (Standard & Poors or Moody’s) to re�ect a higher risk. This downgrading translates into even higher domestic interest rates (as found in countries with high levels of sovereign or government debt like Greece).
Causes of the net foreign debtThere are many reasons for the rise in Australia’s NFD, some of which have already been mentioned: • Lack of domestic savings. We have a national savings–investment gap, where current savings by Australian
households, businesses and governments are not suf�cient to �nance our high levels of investment. This has contributed to our interest rates being high relative to those abroad. In turn, high domestic interest rates encourage our banks, businesses and governments to borrow overseas, thereby adding to our NFD.
• Many budget de�cits. The recent slowdown in Australia’s economic activity has led to expansionary government budget de�cits (where the value of the government’s budget outlays is greater than the value of budget receipts) between 2008 and 2016, which were designed to stimulate spending. In part, these de�cits were �nanced by borrowing abroad, usually by selling government bonds.
• Opportunities for foreign investors. Because of Australia’s vast natural resources, there are many oppor-tunities for foreign investors to make high returns. Although this in�ow of investment capital helps grow our economy’s productive capacity, it also adds to our external liabilities.
• Sound economic, political and social climate. Australia offers foreign investors a relatively stable economic and political environment, with sound infrastructure, ef�cient institutions (including the legal and �nancial systems), and an educated and skilled labour force. In addition, Australia is regarded as a good place to live and hence there has been massive foreign investment in residential property. In addition, countries like China are using rural investment here to enhance their food and resource security at home. This adds to our external liabilities.
• A lower value for the Australian dollar. A lower Australian dollar, as seen recently between 2013 and 2016, makes the purchase of our assets (businesses, shares, property) by non-residents relatively cheaper and hence more attractive. This adds to Australia’s external liabilities.
• Financial sector deregulation and globalisation. In recent decades, there has been considerable �nancial sector deregulation. Combined with trade liberalisation, deregulation has increased overseas capital in�ow and foreign ownership of assets like businesses, shares and property, despite supervision of large projects by the Foreign Investment Review Board (FIRB).
The effects of Australia’s foreign debtForeign debt can have both positive and negative effects for a country.
Some bene�ts of foreign debtSustainable levels of debt can be a good thing, providing that it is used wisely to �nance investment expendi-ture rather than consumption spending. Foreign debt provides the following bene�ts: • Finance for expansion. Foreign debt can make up for a de�ciency in local savings, which are needed to
�nance investment and business expansion, expand GDP and create new jobs. • Access to cheaper credit. As Australian interest rates are often higher than rates overseas, foreign debt can
provide access to cheaper credit.
UNCORRECTED has contributed to our interest rates being high relative to those abroad. In turn, high domestic interest rates
UNCORRECTED has contributed to our interest rates being high relative to those abroad. In turn, high domestic interest rates encourage our banks, businesses and governments to borrow overseas, thereby adding to our NFD.
UNCORRECTED encourage our banks, businesses and governments to borrow overseas, thereby adding to our NFD.The recent slowdown in Australia’s economic activity has led to expansionary
UNCORRECTED The recent slowdown in Australia’s economic activity has led to expansionary government budget de�cits (where the value of the government’s budget outlays is greater than the value of
UNCORRECTED government budget de�cits (where the value of the government’s budget outlays is greater than the value of budget receipts) between 2008 and 2016, which were designed to stimulate spending. In part, these de�cits
UNCORRECTED budget receipts) between 2008 and 2016, which were designed to stimulate spending. In part, these de�cits were �nanced by borrowing abroad, usually by selling government bonds.
UNCORRECTED were �nanced by borrowing abroad, usually by selling government bonds.
or foreign investors.
UNCORRECTED or foreign investors. Because of Australia’s vast natural resources, there are many oppor
UNCORRECTED Because of Australia’s vast natural resources, there are many oppor
tunities for foreign investors to make high returns. Although this in�ow of investment capital helps grow our
UNCORRECTED tunities for foreign investors to make high returns. Although this in�ow of investment capital helps grow our economy’s productive capacity, it also adds to our external liabilities.
UNCORRECTED
economy’s productive capacity, it also adds to our external liabilities.Sound economic, political and social climate.
UNCORRECTED
Sound economic, political and social climate.political environment, with sound infrastructure, ef�cient institutions (including the legal and �nancial systems),
UNCORRECTED
political environment, with sound infrastructure, ef�cient institutions (including the legal and �nancial systems), and an educated and skilled labour force. In addition, Australia is regarded as a good place to live and hence there
UNCORRECTED
and an educated and skilled labour force. In addition, Australia is regarded as a good place to live and hence there has been massive foreign investment in residential property. In addition, countries like China are using rural
UNCORRECTED
has been massive foreign investment in residential property. In addition, countries like China are using rural investment here to enhance their food and resource security at home. This adds to our external liabilities.
UNCORRECTED
investment here to enhance their food and resource security at home. This adds to our external liabilities.lower value for the Australian dollar.
UNCORRECTED
lower value for the Australian dollar. 2016, makes the purchase of our assets (businesses, shares, property) by non-residents relatively cheaper
UNCORRECTED
2016, makes the purchase of our assets (businesses, shares, property) by non-residents relatively cheaper and hence more attractive. This adds to Australia’s external liabilities.
UNCORRECTED
and hence more attractive. This adds to Australia’s external liabilities.Financial sector der
UNCORRECTED
Financial sector der
UNCORRECTED
sector deregulation. Combined with trade liberalisation, deregulation has increased overseas capital in�ow UNCORRECTED
sector deregulation. Combined with trade liberalisation, deregulation has increased overseas capital in�ow and foreign ownership of assets like businesses, shares and property, despite supervision of large projects by UNCORRECTED
and foreign ownership of assets like businesses, shares and property, despite supervision of large projects by
PAGE There are many reasons for the rise in Australia’s NFD, some of which have already been mentioned:
PAGE There are many reasons for the rise in Australia’s NFD, some of which have already been mentioned:
We have a national savings–investment gap, where current savings by
PAGE We have a national savings–investment gap, where current savings by
usinesses and governments are not suf�cient to �nance our high levels of investment. This PAGE usinesses and governments are not suf�cient to �nance our high levels of investment. This
has contributed to our interest rates being high relative to those abroad. In turn, high domestic interest rates PAGE has contributed to our interest rates being high relative to those abroad. In turn, high domestic interest rates encourage our banks, businesses and governments to borrow overseas, thereby adding to our NFD.PAGE
encourage our banks, businesses and governments to borrow overseas, thereby adding to our NFD.
PROOFSuse for lending to households and �rms. Indeed, Australia’s high domestic interest rates and lack of national
PROOFSuse for lending to households and �rms. Indeed, Australia’s high domestic interest rates and lack of national
Contrary to popular opinion, debt is not always bad. It can be good — provided it is used wisely for sound
PROOFSContrary to popular opinion, debt is not always bad. It can be good — provided it is used wisely for sound investment projects that deliver ongoing returns and future bene�ts. Our overseas debt can also make up for
PROOFSinvestment projects that deliver ongoing returns and future bene�ts. Our overseas debt can also make up for the de�ciency in local savings and make access to credit more affordable when domestic interest rates are
PROOFSthe de�ciency in local savings and make access to credit more affordable when domestic interest rates are high. However, as with all debt, the main problem is affording the interest payments. When the Australian
PROOFShigh. However, as with all debt, the main problem is affording the interest payments. When the Australian dollar depreciates, the debt burden (if denominated in a stronger currency like the US dollar) may become very
PROOFSdollar depreciates, the debt burden (if denominated in a stronger currency like the US dollar) may become very heavy indeed. Interest and other repayments then require more Australian dollars to be converted into other
PROOFSheavy indeed. Interest and other repayments then require more Australian dollars to be converted into other currencies. Additionally, if our foreign debt rises too quickly and exceeds our capacity to sustain repayments,
PROOFScurrencies. Additionally, if our foreign debt rises too quickly and exceeds our capacity to sustain repayments, our credit rating as a nation may be downgraded by rating agencies (Standard & Poors or Moody’s) to re�ect
PROOFS
our credit rating as a nation may be downgraded by rating agencies (Standard & Poors or Moody’s) to re�ect a higher risk. This downgrading translates into even higher domestic interest rates (as found in countries with PROOFS
a higher risk. This downgrading translates into even higher domestic interest rates (as found in countries with

164 Economics Down Under 2
c03AustraliaAndTheWorldEconomy 164 29 August 2016 1:07 PM
Some costs of foreign debtThere are some downsides to foreign debt: • Creation of economic hardship. As with all debt, the main problem is repaying interest and the principal.
Excessive levels of government or sovereign debt create great hardship, forcing governments to lift taxes and cut spending, contracting economic activity. As seen in some European countries like Greece, this causes economic activity to shrink and unemployment to rise.
• The burden of debt repayment. The burden of debt repayment is especially heavy if the debt is expressed in another currency and the value of the Australian dollar falls against that currency. It can mean a reduction in our credit rating and, ultimately, higher interest rates.
• Adds to the CAD. The NFD is the major reason for Australia’s large de�cit in net primary incomes and our big CAD. This ultimately weakens the currency and diminishes its purchasing power.
Weblinks The weblinks in these activities are available in this chapter’s student resources tab.• Foreign-held public debt and �scal sustainability: Is China owning the US?• Top 10 countries with largest external debt• Foreign debt
CHECK YOUR UNDERSTANDING
1 What is the NFD? How is this different from the NFE?2 Identify and explain three causes of Australia’s NFD.3 Identify and discuss two important costs and two bene�ts of a rise in Australia’s NFD.
APPLIED ECONOMIC EXERCISES
Apply your understanding of this subtopic by accessing and completing the Applied economic exercise(s).
• School-assessed coursework > Applied economic exercises > Question 4
3.5 The terms of tradeThe terms of trade (TOT) measures the ratio for the average price the world is prepared to pay Australia for our exports against the average price we pay the world for our imports. Put another way, it is the amount of imported goods that can be purchased with a unit of exported goods. • The TOT is said to rise or become more favourable for a country when the export prices we receive rise faster,
or fall less, than import prices. As a result, a nation can purchase more imports with a unit of its exports. • The TOT is regarded as less favourable for a country when export prices rise more slowly, or fall more
quickly, than import prices. As a result, a nation can purchase fewer imports with a given unit of its exports.
Measurement of the terms of tradeThe TOT is measured by means of an index that uses a base year (where the index equals 100 points) to com-pare following years.
The terms of trade index (TOT) =Export price index
× 100Import price index
Here the export price index is constructed by measuring changes in the average prices of a basket of Australian exported goods, with items weighted according to their relative importance in trade. Similarly, the import price index measures changes in the average prices of our imported goods, with items weighted according to their relative importance.
The TOT is primarily regarded as an aggregate demand factor affecting spending levels. This is because the prices we receive or pay in international transactions affect the value of our exports and the value of our imports. When, for example, the world chooses to pay us lower prices for our exports (as happened with our
UNCORRECTED
UNCORRECTED
UNCORRECTED Apply your understanding of this subtopic by accessing and completing the Applied economic exercise(s).
UNCORRECTED Apply your understanding of this subtopic by accessing and completing the Applied economic exercise(s).
School-assessed coursework > Applied economic exercises >
UNCORRECTED School-assessed coursework > Applied economic exercises >
3.5 The terms of trade
UNCORRECTED 3.5 The terms of trade
measures the ratio for the average price the world is prepared to pay Australia for
UNCORRECTED measures the ratio for the average price the world is prepared to pay Australia for
our exports against the average price we pay the world for our imports. Put another way, it is the amount of
UNCORRECTED
our exports against the average price we pay the world for our imports. Put another way, it is the amount of
UNCORRECTED
imported goods that can be purchased with a unit of exported goods.
UNCORRECTED
imported goods that can be purchased with a unit of exported goods.TOT is said to rise or become
UNCORRECTED
TOT is said to rise or become or fall less, than import prices. As a result, a nation can purchase more imports with a unit of its exports.
UNCORRECTED
or fall less, than import prices. As a result, a nation can purchase more imports with a unit of its exports.TOT is regarded as
UNCORRECTED
TOT is regarded as quickly, than import prices. As a result, a nation can purchase fewer imports with a given unit of its
UNCORRECTED
quickly, than import prices. As a result, a nation can purchase fewer imports with a given unit of its exports.
UNCORRECTED
exports.
Measurement of the terms of trade
UNCORRECTED
Measurement of the terms of tradeThe TOT is measured by means of an index that uses a base year (where the index equals 100 points) to com
UNCORRECTED
The TOT is measured by means of an index that uses a base year (where the index equals 100 points) to compare following years.UNCORRECTED
pare following years.
PAGE
PAGE
PAGE Identify and discuss two important costs and two bene�ts of a rise in Australia’
PAGE Identify and discuss two important costs and two bene�ts of a rise in Australia’
PAGE
PAGE
Apply your understanding of this subtopic by accessing and completing the Applied economic exercise(s).PAGE
Apply your understanding of this subtopic by accessing and completing the Applied economic exercise(s).
PROOFS
PROOFS
PROOFS
PROOFS
PROOFS
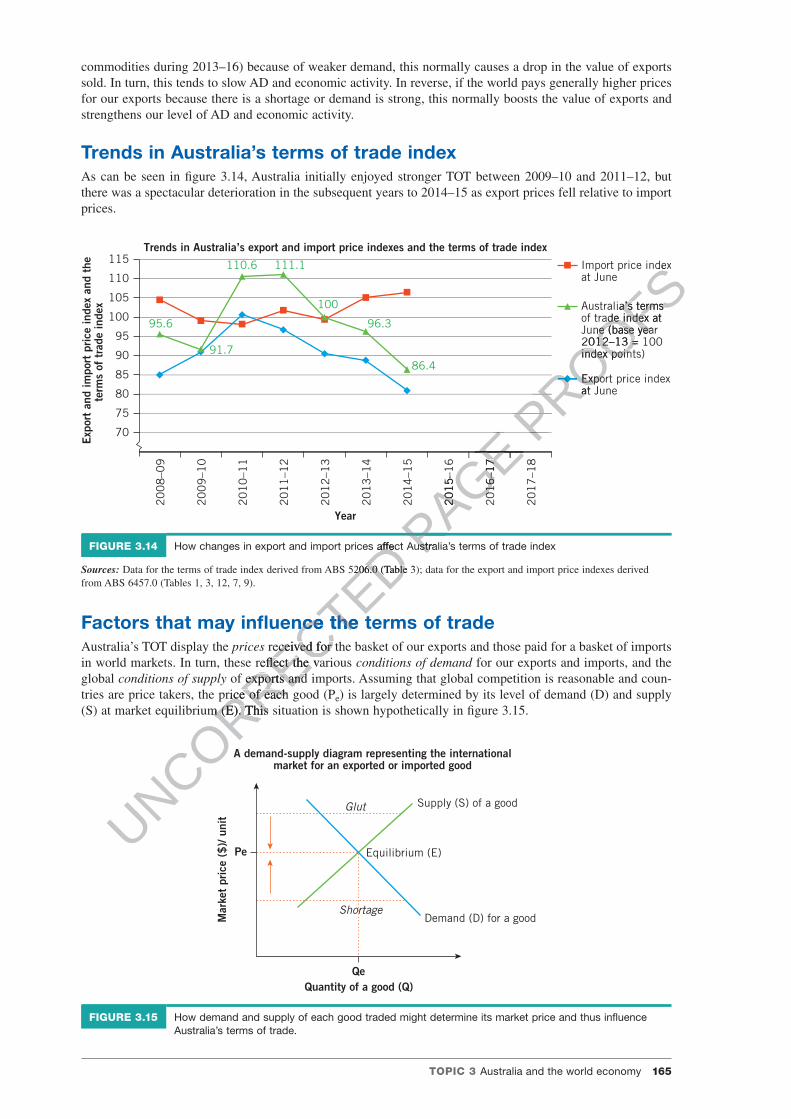
TOPIC 3 Australia and the world economy 165
c03AustraliaAndTheWorldEconomy 165 29 August 2016 1:07 PM
commodities during 2013–16) because of weaker demand, this normally causes a drop in the value of exports sold. In turn, this tends to slow AD and economic activity. In reverse, if the world pays generally higher prices for our exports because there is a shortage or demand is strong, this normally boosts the value of exports and strengthens our level of AD and economic activity.
Trends in Australia’s terms of trade indexAs can be seen in �gure 3.14, Australia initially enjoyed stronger TOT between 2009–10 and 2011–12, but there was a spectacular deterioration in the subsequent years to 2014–15 as export prices fell relative to import prices.
95.6
91.7
110.6 111.1
100
96.3
86.4
70
75
80
85
90
95
100
105
110
115
20
08
–09
20
09
–10
20
10
–11
20
11
–12
20
12
–13
20
13
–14
20
14
–15
20
15
–16
20
16
–17
20
17
–18
Exp
ort
and
impo
rt p
rice
inde
x an
d th
ete
rms
of t
rade
inde
x
Trends in Australia’s export and import price indexes and the terms of trade index
Year
Export price indexat June
Import price indexat June
Australia’s termsof trade index atJune (base year2012–13 = 100index points)
FIGURE 3.14 How changes in export and import prices affect Australia’s terms of trade index
Sources: Data for the terms of trade index derived from ABS 5206.0 (Table 3); data for the export and import price indexes derived from ABS 6457.0 (Tables 1, 3, 12, 7, 9).
Factors that may in�uence the terms of tradeAustralia’s TOT display the prices received for the basket of our exports and those paid for a basket of imports in world markets. In turn, these re�ect the various conditions of demand for our exports and imports, and the global conditions of supply of exports and imports. Assuming that global competition is reasonable and coun-tries are price takers, the price of each good (Pe) is largely determined by its level of demand (D) and supply (S) at market equilibrium (E). This situation is shown hypothetically in �gure 3.15.
A demand-supply diagram representing the internationalmarket for an exported or imported good
Mar
ket
pric
e ($
)/ u
nit
Glut Supply (S) of a good
Pe
ShortageDemand (D) for a good
Quantity of a good (Q)Qe
Equilibrium (E)
FIGURE 3.15 How demand and supply of each good traded might determine its market price and thus in�uence Australia’s terms of trade.
UNCORRECTED How changes in export and import prices affect Australia’s terms of trade index
UNCORRECTED How changes in export and import prices affect Australia’s terms of trade index
Data for the terms of trade index derived from ABS 5206.0 (Table 3); data for the export and import price indexes derived
UNCORRECTED Data for the terms of trade index derived from ABS 5206.0 (Table 3); data for the export and import price indexes derived
Factors that may in�uence the terms of trade
UNCORRECTED Factors that may in�uence the terms of trade
received for the basket of our exports and those paid for a basket of imports
UNCORRECTED received for the basket of our exports and those paid for a basket of imports
UNCORRECTED
in world markets. In turn, these re�ect the various
UNCORRECTED
in world markets. In turn, these re�ect the various of exports and imports. Assuming that global competition is reasonable and coun
UNCORRECTED
of exports and imports. Assuming that global competition is reasonable and countries are price takers, the price of each good (P
UNCORRECTED
tries are price takers, the price of each good (P(S) at market equilibrium (E). This situation is shown hypothetically in �gure 3.15.
UNCORRECTED
(S) at market equilibrium (E). This situation is shown hypothetically in �gure 3.15.
PAGE
PAGE
PAGE
PAGE 2
01
5–1
6
PAGE 2
01
5–1
6
20
16
–17
PAGE 2
01
6–1
7
PAGE
PAGE
PAGE
PAGE
How changes in export and import prices affect Australia’s terms of trade indexPAGE
How changes in export and import prices affect Australia’s terms of trade index
PROOFS
PROOFS
PROOFS
PROOFS
PROOFS
PROOFSExport price index
PROOFSExport price indexat June
PROOFSat June
Import price index
PROOFSImport price index
Australia’s terms
PROOFSAustralia’s termsof trade index at
PROOFSof trade index atJune (base year
PROOFSJune (base year2012–13 = 100
PROOFS2012–13 = 100index points)
PROOFSindex points)
PROOFS
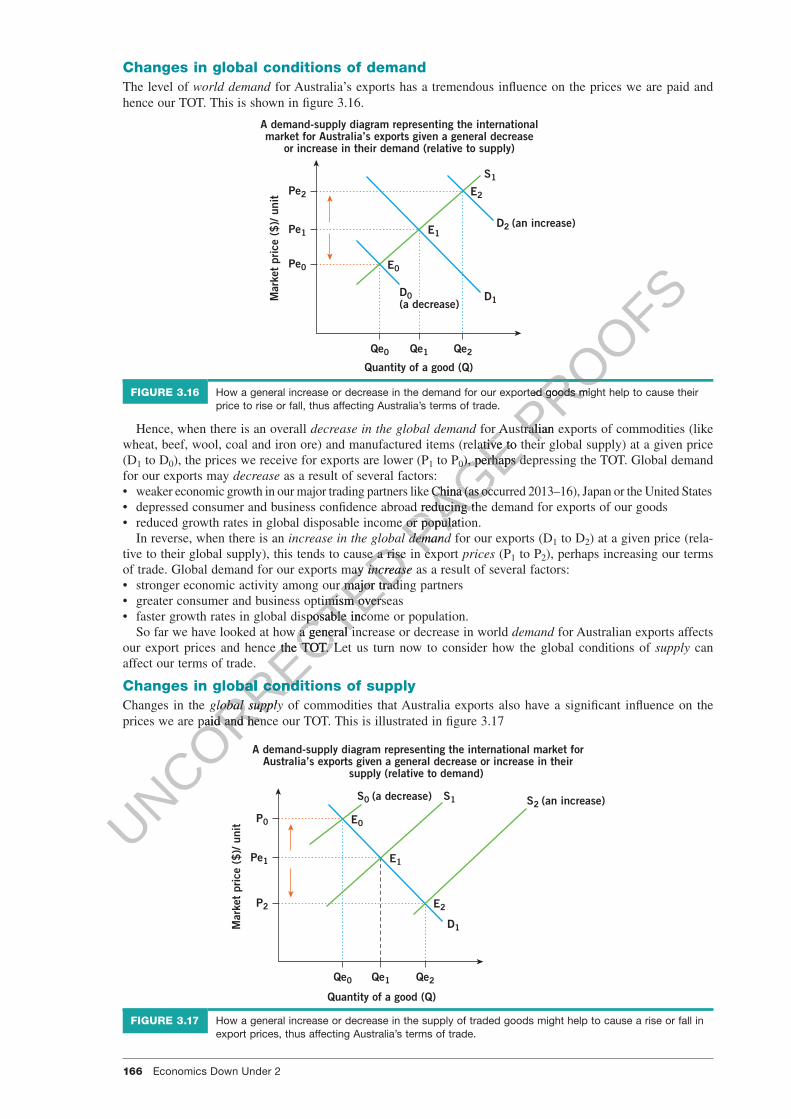
166 Economics Down Under 2
c03AustraliaAndTheWorldEconomy 166 29 August 2016 1:07 PM
Changes in global conditions of demandThe level of world demand for Australia’s exports has a tremendous in�uence on the prices we are paid and hence our TOT. This is shown in �gure 3.16.
A demand-supply diagram representing the internationalmarket for Australia’s exports given a general decrease
or increase in their demand (relative to supply)
Mar
ket
pric
e ($
)/ u
nit
S1
D1
Pe2
Pe1
Pe0
D0(a decrease)
E2
E1
E0
D2 (an increase)
Qe0 Qe1 Qe2
Quantity of a good (Q)
FIGURE 3.16 How a general increase or decrease in the demand for our exported goods might help to cause their price to rise or fall, thus affecting Australia’s terms of trade.
Hence, when there is an overall decrease in the global demand for Australian exports of commodities (like wheat, beef, wool, coal and iron ore) and manufactured items (relative to their global supply) at a given price (D1 to D0), the prices we receive for exports are lower (P1 to P0), perhaps depressing the TOT. Global demand for our exports may decrease as a result of several factors: • weaker economic growth in our major trading partners like China (as occurred 2013–16), Japan or the United States • depressed consumer and business con�dence abroad reducing the demand for exports of our goods • reduced growth rates in global disposable income or population.
In reverse, when there is an increase in the global demand for our exports (D1 to D2) at a given price (rela-tive to their global supply), this tends to cause a rise in export prices (P1 to P2), perhaps increasing our terms of trade. Global demand for our exports may increase as a result of several factors: • stronger economic activity among our major trading partners • greater consumer and business optimism overseas • faster growth rates in global disposable income or population.
So far we have looked at how a general increase or decrease in world demand for Australian exports affects our export prices and hence the TOT. Let us turn now to consider how the global conditions of supply can affect our terms of trade.
Changes in global conditions of supplyChanges in the global supply of commodities that Australia exports also have a signi�cant in�uence on the prices we are paid and hence our TOT. This is illustrated in �gure 3.17
A demand-supply diagram representing the international market forAustralia’s exports given a general decrease or increase in their
supply (relative to demand)
Mar
ket
pric
e ($
)/ u
nit
S0 (a decrease) S1 S2 (an increase)
E0
E1
E2
D1
P0
Qe0
Quantity of a good (Q)
Qe1 Qe2
Pe1
P2
FIGURE 3.17 How a general increase or decrease in the supply of traded goods might help to cause a rise or fall in export prices, thus affecting Australia’s terms of trade.
UNCORRECTED increase in the global demand
UNCORRECTED increase in the global demandtive to their global supply), this tends to cause a rise in export
UNCORRECTED tive to their global supply), this tends to cause a rise in export of trade. Global demand for our exports may
UNCORRECTED of trade. Global demand for our exports may increase
UNCORRECTED increase
economic activity among our major trading partners
UNCORRECTED economic activity among our major trading partners
consumer and business optimism overseas
UNCORRECTED consumer and business optimism overseas
UNCORRECTED aster growth rates in global disposable income or population.
UNCORRECTED aster growth rates in global disposable income or population.
So far we have looked at how a general increase or decrease in world
UNCORRECTED So far we have looked at how a general increase or decrease in world
our export prices and hence the TOT. Let us turn now to consider how the global conditions of
UNCORRECTED our export prices and hence the TOT. Let us turn now to consider how the global conditions of
Changes in global conditions of supply
UNCORRECTED
Changes in global conditions of supply
UNCORRECTED
global supply
UNCORRECTED
global supplyprices we are paid and hence our TOT. This is illustrated in �gure 3.17
UNCORRECTED
prices we are paid and hence our TOT. This is illustrated in �gure 3.17
PAGE for Australian exports of commodities (like
PAGE for Australian exports of commodities (like wheat, beef, wool, coal and iron ore) and manufactured items (relative to their global supply) at a given price
PAGE wheat, beef, wool, coal and iron ore) and manufactured items (relative to their global supply) at a given price 0
PAGE 0), perhaps depressing the TOT. Global demand
PAGE ), perhaps depressing the TOT. Global demand
er economic growth in our major trading partners like China (as occurred 2013–16), Japan or the United States
PAGE er economic growth in our major trading partners like China (as occurred 2013–16), Japan or the United States
consumer and business con�dence abroad reducing the demand for exports of our goods
PAGE consumer and business con�dence abroad reducing the demand for exports of our goods
growth rates in global disposable income or population.PAGE growth rates in global disposable income or population.
increase in the global demandPAGE
increase in the global demandtive to their global supply), this tends to cause a rise in export PAGE
tive to their global supply), this tends to cause a rise in export
PROOFS
PROOFSHow a general increase or decrease in the demand for our exported goods might help to cause their
PROOFSHow a general increase or decrease in the demand for our exported goods might help to cause their
for Australian exports of commodities (like PROOFS
for Australian exports of commodities (like wheat, beef, wool, coal and iron ore) and manufactured items (relative to their global supply) at a given price PROOFS
wheat, beef, wool, coal and iron ore) and manufactured items (relative to their global supply) at a given price

TOPIC 3 Australia and the world economy 167
c03AustraliaAndTheWorldEconomy 167 29 August 2016 1:07 PM
Hence, when there is an increase in the global supply (S1 to S2) of the commodities Australia exports (like wheat, beef, wool, coal and iron ore) and manufactured items (relative to their global demand) at a given price, the general prices we receive for exports are lower (P1 to P2). This tends to make our TOT less favourable. Global supply of the things we export may increase due to the following: • new discoveries of minerals or the opening of new mines • the effect of new technology on productivity and hence production • domestic and international growing conditions for crops.
By contrast, when there is a decrease in the global supply of the commodities and goods that Australia exports at a given price (S1 to S0), the prices received tend to rise (P1 to P0), and with them, possibly our terms of trade. Supply might fall due to the following: • resource depletion and exhaustion • declining productivity • severe climatic conditions here and overseas.
Effects of movements in the terms of tradeAustralia’s TOT has signi�cant effects, not just on the CAD and exchange rate, but also on AD and the level of domestic economic activity.
Effects of the terms of trade on Australia’s CADWhen the terms of trade rise or fall (due to changes in our export prices relative to import prices), this will affect the values of both exports and imports and hence the size of Australia’s CAD. • A fall in the TOT tends to cause the CAD to rise. This is because when we receive lower prices, for example,
it often means that there is a relatively weaker demand internationally for our exports. In turn, the value of credits for our exports usually decreases, while dearer global prices paid by us for imports tend to increase the value of import debits.
• A rise in the TOT usually results in a decrease in the CAD due to higher prices causing a rise in the value of credits for exports relative to debits for imports.
Effects of the terms of trade on Australia’s exchange rateChanges in the TOT have a powerful effect on the exchange rate for the Australian dollar. Our dollar’s exchange rate or value is what it is worth when swapped for other currencies to help facilitate international transactions between countries. The exchange rate is determined in the foreign exchange market by buyers (D) and sellers (S) of the currency. A rise in the D for our currency relative to its S will push the dollar higher, while a fall in D relative to S will weaken the exchange rate. • A fall in our TOT tends to weaken Australia’s exchange rate. This is because lower export prices often
indicate that there is relatively less international demand for our exports. This tends to reduce the value of exports relative to imports, in turn causing a decrease in the demand for the Australian dollar relative to its supply in the foreign exchange market. This weakens the exchange rate.
• A rise in our TOT often pushes up the value of the Australian dollar. This is because receiving better export prices relative to those paid for imports tends to increase the value of net exports. In turn, this means there is a rise in the demand for the dollar relative to its supply, causing the dollar to strengthen.
Effects of the terms of trade on AD and domestic economic activityThe TOT is an aggregate demand-side factor that can affect the level of spending and economic activity. • A decline in the TOT tends to weaken the value of our export sales relative to import spending, and hence
in itself tends to slow AD and the level of economic activity. • A rise in the TOT, which means receiving better prices for our exports relative to those paid for imports,
tends to boost the value of net exports, AD and domestic economic activity.
Weblinks The weblinks in these activities are available in this chapter’s student resources tab.• Comparative advantage and terms of trade, ACDC Econ 1.3• Why are commodity prices falling?
CHECK YOUR UNDERSTANDING
1 Explain what is meant by the TOT, noting how it is measured.2 What is meant by the phrase less favourable TOT for Australia?3 Identify and explain how both demand and supply factors can affect Australia’s TOT.4 Explain how you would expect a fall in Australia’s TOT to affect each of the following variables:
a the CAD b the exchange rate.
UNCORRECTED rate or value is what it is worth when swapped for other currencies to help facilitate international transactions
UNCORRECTED rate or value is what it is worth when swapped for other currencies to help facilitate international transactions between countries. The exchange rate is determined in the foreign exchange market by buyers (D) and sellers
UNCORRECTED between countries. The exchange rate is determined in the foreign exchange market by buyers (D) and sellers (S) of the currency. A rise in the D for our currency relative to its S will push the dollar higher, while a fall in
UNCORRECTED (S) of the currency. A rise in the D for our currency relative to its S will push the dollar higher, while a fall in
in our TOT tends to weaken Australia’s exchange rate. This is because lower export prices often
UNCORRECTED in our TOT tends to weaken Australia’s exchange rate. This is because lower export prices often
indicate that there is relatively less international demand for our exports. This tends to reduce the value of
UNCORRECTED indicate that there is relatively less international demand for our exports. This tends to reduce the value of exports relative to imports, in turn causing a decrease in the demand for the Australian dollar relative to its
UNCORRECTED exports relative to imports, in turn causing a decrease in the demand for the Australian dollar relative to its supply in the foreign exchange market. This weakens the exchange rate.
UNCORRECTED
supply in the foreign exchange market. This weakens the exchange rate. in our TOT often pushes up the value of the Australian dollar. This is because receiving better export
UNCORRECTED
in our TOT often pushes up the value of the Australian dollar. This is because receiving better export prices relative to those paid for imports tends to increase the value of net exports. In turn, this means there
UNCORRECTED
prices relative to those paid for imports tends to increase the value of net exports. In turn, this means there is a rise in the demand for the dollar relative to its supply, causing the dollar to strengthen.
UNCORRECTED
is a rise in the demand for the dollar relative to its supply, causing the dollar to strengthen.
fects of the terms of trade on
UNCORRECTED
fects of the terms of trade on The TOT is an aggregate demand-side factor that can affect the level of spending and economic activity.
UNCORRECTED
The TOT is an aggregate demand-side factor that can affect the level of spending and economic activity. in the TOT tends to weaken the value of our export sales relative to import spending, and hence
UNCORRECTED
in the TOT tends to weaken the value of our export sales relative to import spending, and hence in itself tends to slow AD and the level of economic activity.
UNCORRECTED
in itself tends to slow AD and the level of economic activity. in the TOT, which means receiving better prices for our exports relative to those paid for imports,
UNCORRECTED
in the TOT, which means receiving better prices for our exports relative to those paid for imports, tends to boost the value of net exports, AD and domestic economic activity.
UNCORRECTED
tends to boost the value of net exports, AD and domestic economic activity.
UNCORRECTED
UNCORRECTED
UNCORRECTED PAGE credits for our exports usually decreases, while dearer global prices paid by us for imports tend to increase
PAGE credits for our exports usually decreases, while dearer global prices paid by us for imports tend to increase
in the TOT usually results in a decrease in the CAD due to higher prices causing a rise in the value
PAGE in the TOT usually results in a decrease in the CAD due to higher prices causing a rise in the value
ustralia’s exchange rate
PAGE ustralia’s exchange rate
Changes in the TOT have a powerful effect on the exchange rate for the Australian dollar. Our dollar’s exchange PAGE Changes in the TOT have a powerful effect on the exchange rate for the Australian dollar. Our dollar’s exchange rate or value is what it is worth when swapped for other currencies to help facilitate international transactions PAGE
rate or value is what it is worth when swapped for other currencies to help facilitate international transactions between countries. The exchange rate is determined in the foreign exchange market by buyers (D) and sellers PAGE
between countries. The exchange rate is determined in the foreign exchange market by buyers (D) and sellers
PROOFSAustralia’s TOT has signi�cant effects, not just on the CAD and exchange rate, but also on AD and the level
PROOFSAustralia’s TOT has signi�cant effects, not just on the CAD and exchange rate, but also on AD and the level
When the terms of trade rise or fall (due to changes in our export prices relative to import prices), this will
PROOFSWhen the terms of trade rise or fall (due to changes in our export prices relative to import prices), this will
in the TOT tends to cause the CAD to rise. This is because when we receive lower prices, for example,
PROOFS
in the TOT tends to cause the CAD to rise. This is because when we receive lower prices, for example, it often means that there is a relatively weaker demand internationally for our exports. In turn, the value of PROOFS
it often means that there is a relatively weaker demand internationally for our exports. In turn, the value of credits for our exports usually decreases, while dearer global prices paid by us for imports tend to increase PROOFS
credits for our exports usually decreases, while dearer global prices paid by us for imports tend to increase
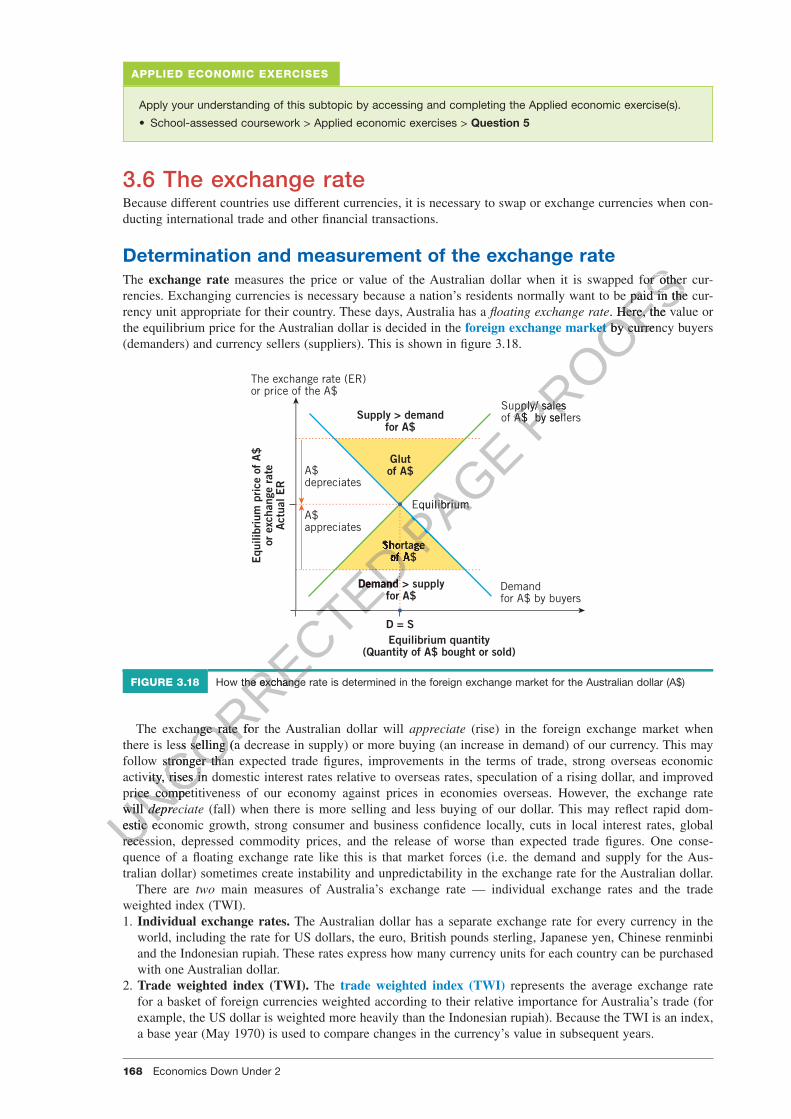
168 Economics Down Under 2
c03AustraliaAndTheWorldEconomy 168 29 August 2016 1:07 PM
APPLIED ECONOMIC EXERCISES
Apply your understanding of this subtopic by accessing and completing the Applied economic exercise(s).
• School-assessed coursework > Applied economic exercises > Question 5
3.6 The exchange rateBecause different countries use different currencies, it is necessary to swap or exchange currencies when con-ducting international trade and other �nancial transactions.
Determination and measurement of the exchange rateThe exchange rate measures the price or value of the Australian dollar when it is swapped for other cur-rencies. Exchanging currencies is necessary because a nation’s residents normally want to be paid in the cur-rency unit appropriate for their country. These days, Australia has a �oating exchange rate. Here, the value or the equilibrium price for the Australian dollar is decided in the foreign exchange market by currency buyers (demanders) and currency sellers (suppliers). This is shown in �gure 3.18.
Equilibrium quantity(Quantity of A$ bought or sold)
Equilibrium
Equ
ilibr
ium
pri
ce o
f A
$or
exc
hang
e ra
teA
ctua
l ER
The exchange rate (ER)or price of the A$
A$depreciates
A$appreciates
Supply/ salesof A$ by sellers
Demandfor A$ by buyers
D = S
Supply > demandfor A$
Shortageof A$
Demand > supplyfor A$
Glutof A$
FIGURE 3.18 How the exchange rate is determined in the foreign exchange market for the Australian dollar (A$)
The exchange rate for the Australian dollar will appreciate (rise) in the foreign exchange market when there is less selling (a decrease in supply) or more buying (an increase in demand) of our currency. This may follow stronger than expected trade �gures, improvements in the terms of trade, strong overseas economic activity, rises in domestic interest rates relative to overseas rates, speculation of a rising dollar, and improved price competitiveness of our economy against prices in economies overseas. However, the exchange rate will depreciate (fall) when there is more selling and less buying of our dollar. This may re�ect rapid dom-estic economic growth, strong consumer and business con�dence locally, cuts in local interest rates, global recession, depressed commodity prices, and the release of worse than expected trade �gures. One conse-quence of a �oating exchange rate like this is that market forces (i.e. the demand and supply for the Aus-tralian dollar) sometimes create instability and unpredictability in the exchange rate for the Australian dollar.
There are two main measures of Australia’s exchange rate — individual exchange rates and the trade weighted index (TWI).1. Individual exchange rates. The Australian dollar has a separate exchange rate for every currency in the
world, including the rate for US dollars, the euro, British pounds sterling, Japanese yen, Chinese renminbi and the Indonesian rupiah. These rates express how many currency units for each country can be purchased with one Australian dollar.
2. Trade weighted index (TWI). The trade weighted index (TWI) represents the average exchange rate for a basket of foreign currencies weighted according to their relative importance for Australia’s trade (for example, the US dollar is weighted more heavily than the Indonesian rupiah). Because the TWI is an index, a base year (May 1970) is used to compare changes in the currency’s value in subsequent years.
UNCORRECTED
UNCORRECTED
UNCORRECTED
UNCORRECTED
UNCORRECTED
UNCORRECTED
UNCORRECTED
UNCORRECTED Shortage
UNCORRECTED Shortageof A$
UNCORRECTED of A$of A$
UNCORRECTED of A$
Demand > supply
UNCORRECTED Demand > supplyDemand > supply
UNCORRECTED Demand > supply
for A$
UNCORRECTED for A$
UNCORRECTED
How the exchange rate is determined in the foreign exchange market for the Australian dollar (A$)
UNCORRECTED
How the exchange rate is determined in the foreign exchange market for the Australian dollar (A$)
The exchange rate for the Australian dollar will
UNCORRECTED
The exchange rate for the Australian dollar will there is less selling (a decrease in supply) or more buying (an increase in demand) of our currency. This may
UNCORRECTED
there is less selling (a decrease in supply) or more buying (an increase in demand) of our currency. This may follow stronger than expected trade �gures, improvements in the terms of trade, strong overseas economic
UNCORRECTED
follow stronger than expected trade �gures, improvements in the terms of trade, strong overseas economic activity, rises in domestic interest rates relative to overseas rates, speculation of a rising dollar, and improved
UNCORRECTED
activity, rises in domestic interest rates relative to overseas rates, speculation of a rising dollar, and improved price competitiveness of our economy against prices in economies overseas. However, the exchange rate
UNCORRECTED
price competitiveness of our economy against prices in economies overseas. However, the exchange rate will
UNCORRECTED
will depreciate
UNCORRECTED
depreciate estic economic growth, strong consumer and business con�dence locally, cuts in local interest rates, global UNCORRECTED
estic economic growth, strong consumer and business con�dence locally, cuts in local interest rates, global recession, depressed commodity prices, and the release of worse than expected trade �gures. One conseUNCORRECTED
recession, depressed commodity prices, and the release of worse than expected trade �gures. One conse
PAGE
PAGE
PAGE Equilibrium
PAGE Equilibrium
PAGE
ShortagePAGE
Shortage
PROOFS measures the price or value of the Australian dollar when it is swapped for other cur
PROOFS measures the price or value of the Australian dollar when it is swapped for other currencies. Exchanging currencies is necessary because a nation’s residents normally want to be paid in the cur
PROOFSrencies. Exchanging currencies is necessary because a nation’s residents normally want to be paid in the cur�oating exchange rate
PROOFS�oating exchange rate. Here, the value or
PROOFS. Here, the value or foreign exchange market
PROOFSforeign exchange market by currency buyers
PROOFSby currency buyers
Supply/ sales
PROOFS
Supply/ salesof A$ by sellersPROOFS
of A$ by sellers

TOPIC 3 Australia and the world economy 169
c03AustraliaAndTheWorldEconomy 169 29 August 2016 1:07 PM
Recent trends in Australia’s exchange rateFigure 3.19 shows that over the past decade, the exchange rate for the Australian dollar has moved cyclically. Peaks in 2007–08 and 2011–12 were followed by troughs in 2008–09 and 2014–15.
0.4
0.5
0.6
0.7
0.8
0.9
1.0
1.1
1.2
40
45
50
55
60
65
70
75
802
00
4–0
5
20
05
–06
20
06
–07
20
07
–08
20
08
–09
20
09
–10
20
10
–11
20
11
–12
20
12
–13
20
13
–14
20
14
–15
20
15
–16
20
16
–17
20
17
–18
20
18
–19
TWI
(bas
e ye
ar 1
97
0 =
10
0 p
oint
s)
Year
A$
exc
hang
e ra
te w
ith
US
$
TWI for the exchange rate atJune (1970 = 100 points)59.1; LHS
A$ exchange rate with theUS$ (at June) 0.69; RHS
FIGURE 3.19 Trends in Australia’s exchange rate indicated by the TWI and US dollar
Source: Data derived from RBA Statistics.
Causes of changes in the exchange rateRises and falls in the exchange rate come down to changing aggregate demand- and supply-side conditions here and abroad. These in�uence the level of purchases and sales of the Australian dollar in the foreign exchange market.
Factors affecting the sale or supply (S) of the Australian dollarWhen Australian residents purchase imports of goods or services, make income payments or invest overseas, they must sell their Australian dollars (A$) to buy another currency. Figure 3.20 shows what happens in the foreign exchange market when sales of the A$ rise or fall. If sales of the A$ rise (S1 to S2 in part a ) and exceed the demand for the currency at the original price or exchange rate (ER1), there will be a depreciation of the exchange rate (to ER2). However, in reverse, when sales of the A$ fall (S1 to S2 in part b) relative to the demand for the A$ at the original price or exchange rate (ER1), there will be an appreciation of the currency (to ER2).
Quantity of A$
Pri
ce/e
xcha
nge
rate
(A
$)
Part (a) An increase in selling (S1 to S2) weakensthe Australian dollar (A$).
D1 for the A$
S1 of the A$
S2 of the A$
ER2
ER1
Q1 Q2
Quantity of A$
Part (b) A decrease in selling (S1 to S2) strengthensthe Australian dollar (A$).
D1 for the A$
S2 of the A$
S1 of the A$
Q2 Q1
ER2
Pri
ce/e
xcha
nge
rate
(A
$)
ER1
FIGURE 3.20 How changes in sales of the Australian dollar (A$) affect the exchange rate in the foreign exchange market
The number of dollars sold (S) in the foreign exchange market (for example, to pay for imports of goods and services, and incomes abroad) is affected by the following factors: • local consumer con�dence • local business con�dence
UNCORRECTED S
UNCORRECTED S) o
UNCORRECTED ) of the
UNCORRECTED f the When Australian residents purchase imports of goods or services, make income payments or invest overseas,
UNCORRECTED When Australian residents purchase imports of goods or services, make income payments or invest overseas,
their Australian dollars (A$) to buy another currency. Figure 3.20 shows what happens in the
UNCORRECTED their Australian dollars (A$) to buy another currency. Figure 3.20 shows what happens in the
foreign exchange market when sales of the A$ rise or fall. If sales of the A$
UNCORRECTED foreign exchange market when sales of the A$ rise or fall. If sales of the A$ the demand for the currency at the original price or exchange rate (ER
UNCORRECTED the demand for the currency at the original price or exchange rate (ER
). However, in reverse, when sales of the A$
UNCORRECTED ). However, in reverse, when sales of the A$
for the A$ at the original price or exchange rate (ER
UNCORRECTED
for the A$ at the original price or exchange rate (ER
UNCORRECTED
UNCORRECTED
UNCORRECTED
UNCORRECTED
UNCORRECTED
UNCORRECTED
UNCORRECTED
Pri
ce/e
xcha
nge
rate
(A
$)
UNCORRECTED
Pri
ce/e
xcha
nge
rate
(A
$)
Part (a) An increase in selling (S
UNCORRECTED
Part (a) An increase in selling (Sthe Australian dollar (A$).
UNCORRECTED
the Australian dollar (A$).
UNCORRECTED
ERUNCORRECTED
ER2UNCORRECTED
2
ER
UNCORRECTED
ER1
UNCORRECTED
1
UNCORRECTED
UNCORRECTED
UNCORRECTED
UNCORRECTED
UNCORRECTED
UNCORRECTED
UNCORRECTED PAGE
Causes of changes in the exchange rate
PAGE Causes of changes in the exchange rateRises and falls in the exchange rate come down to changing aggregate demand- and supply-side conditions
PAGE Rises and falls in the exchange rate come down to changing aggregate demand- and supply-side conditions here and abroad. These in�uence the level of purchases and sales of the Australian dollar in the foreign
PAGE here and abroad. These in�uence the level of purchases and sales of the Australian dollar in the foreign
PROOFS
PROOFS
Trends in Australia’s exchange rate indicated by the TWI and US dollar PROOFS
Trends in Australia’s exchange rate indicated by the TWI and US dollar

170 Economics Down Under 2
c03AustraliaAndTheWorldEconomy 170 29 August 2016 1:07 PM
• changes in our tax rates and disposable income • movements in the terms of trade and the prices of imports • levels of in�ation, production costs and competitiveness, relative to those overseas • levels of interest rates on loans and overdrafts, relative to those overseas • changes in budget tax receipts, outlays and the overall outcome (equal to budget receipts minus outlays) • population growth • household savings ratio (the percentage of income not spent) • speculation about future changes in the exchange rate.
Factors affecting the purchase or demand (D) for the Australian dollarWhen people overseas want to purchase our exports, make income payments or invest in our assets, they must sell their currency and buy Australian dollars. Figure 3.21 shows what happens in the foreign exchange market when purchases of the A$ rise or fall.
Pri
ce/e
xcha
nge
rate
(A
$)
ER1
ER2
Quantity of A$
Q1 Q2
Part (a) A rise in buying (D1 to D2) strengthensthe Australian dollar (A$).
D1 for the A$
D2 for the $A
S1 of the A$
Quantity of A$
Q2 Q1
Part (b) A decrease in buying (D1 to D2)weakens the Australian dollar (A$).
D2 for the A$
D1 for the A$
S1 of the A$
Pri
ce/e
xcha
nge
rate
(A
$)
ER2
ER1
FIGURE 3.21 How changes in purchases of the Australian dollar (A$) affect the exchange rate in the foreign exchange market
If the demand for our currency rises relative to its supply of the A$ (the shift from D1 to D2 shown in part a), the price of the dollar or exchange rate will appreciate (ER1 to ER2). If fewer A$ are bought relative to the supply in the foreign exchange market (the shift from D1 to D2 shown in part b), the A$ will depreciate (ER1 to ER2).
The number of dollars bought (D) in the foreign exchange market (for example, when those overseas pay us for our exports and incomes) is affected by the following factors: • the level of economic activity overseas in our major trading partners (e.g. China, Japan and the United
States) and globally • consumer con�dence in our major trading partners and globally • the terms of trade and changes in our export commodity prices • changes in our productivity, international competitiveness and relative in�ation rate • speculation about future changes in the exchange rate • our level of production costs and in�ation rate, relative to other suppliers abroad • the interest rate differential (gap) between Australia and other nations.
Effects of exchange rate movements on domestic macroeconomic goals and the current account balanceChanges in the price of the A$ in the foreign exchange market have powerful effects on our key domestic mac-roeconomic goals (low in�ation, strong and sustainable economic growth, and full employment). In addition, the exchange rate can cause the size of the CAD to rise or fall. This is largely because the exchange rate can act as an aggregate demand-side factor affecting levels of net export spending (X – M) and economic activity, as well as an aggregate supply-side factor affecting our international competitiveness. Now let us look more closely at the effects of a changing exchange rate on the Australian economy.
Effects of the exchange rate on in�ationThe RBA and the government try to pursue the goal of low in�ation — keeping the in�ation rate rising slowly at an average rate of 2–3 per cent annually over the cycle. Rises and falls in the exchange rate for the A$ can affect the rate of demand in�ation and/or cost in�ation.
UNCORRECTED How changes in purchases of the Australian dollar (A$) affect the exchange rate in the foreign
UNCORRECTED How changes in purchases of the Australian dollar (A$) affect the exchange rate in the foreign
relative to its supply of the A$ (the shift from D
UNCORRECTED relative to its supply of the A$ (the shift from D
price of the dollar or exchange rate will
UNCORRECTED price of the dollar or exchange rate will appreciate
UNCORRECTED appreciate
foreign exchange market (the shift from D
UNCORRECTED foreign exchange market (the shift from D1
UNCORRECTED 1 to D
UNCORRECTED to D
The number of dollars bought (D) in the foreign exchange market (for example, when those overseas pay us
UNCORRECTED The number of dollars bought (D) in the foreign exchange market (for example, when those overseas pay us
for our exports and incomes) is affected by the following factors:
UNCORRECTED
for our exports and incomes) is affected by the following factors:vel of economic activity overseas in our major trading partners (e.g. China, Japan and the United
UNCORRECTED
vel of economic activity overseas in our major trading partners (e.g. China, Japan and the United States) and globally
UNCORRECTED
States) and globallycon�dence in our major trading partners and globally
UNCORRECTED
con�dence in our major trading partners and globally
UNCORRECTED
terms of trade and changes in our export commodity prices
UNCORRECTED
terms of trade and changes in our export commodity pricesin our productivity, international competitiveness and relative in�ation rate
UNCORRECTED
in our productivity, international competitiveness and relative in�ation ratespeculation
UNCORRECTED
speculation about future changes in the exchange rate
UNCORRECTED
about future changes in the exchange rateour
UNCORRECTED
our level of production costs and in�ation rate, relative to other suppliers abroad
UNCORRECTED
level of production costs and in�ation rate, relative to other suppliers abroadthe
UNCORRECTED
the interest rate differential (gap) between Australia and other nations.
UNCORRECTED
interest rate differential (gap) between Australia and other nations.
Effects of exchange rate movements on domestic UNCORRECTED
Effects of exchange rate movements on domestic macroeconomic goals and the current account balanceUNCORRECTED
macroeconomic goals and the current account balance
PAGE
PAGE
PAGE
PAGE
PAGE
PAGE
PAGE
How changes in purchases of the Australian dollar (A$) affect the exchange rate in the foreign PAGE
How changes in purchases of the Australian dollar (A$) affect the exchange rate in the foreign
PROOFS
PROOFS
PROOFS
PROOFS
PROOFS
PROOFS
PROOFS
PROOFSPart (b) A decrease in buying (D
PROOFSPart (b) A decrease in buying (D1
PROOFS1 to D
PROOFS to D2
PROOFS2)
PROOFS)weakens the Australian dollar (A$).
PROOFSweakens the Australian dollar (A$).
PROOFS
PROOFS
PROOFSS
PROOFSS1
PROOFS1 of the A$
PROOFS of the A$
PROOFS
PROOFS

TOPIC 3 Australia and the world economy 171
c03AustraliaAndTheWorldEconomy 171 29 August 2016 1:07 PM
• Demand in�ation can occur when there is excessive and strongly rising spending in an economy that has little or no unused productive capacity. Here, there will be boom conditions with widespread shortages of goods and services. As an aggregate demand-side factor, a falling A$ can further stimulate exports (because they are more attractive abroad) while depressing imports (because they appear dearer to us). When the value of net exports (X – M) rises, and there is already low unemployment, stocks fall and �rms cannot readily replace them, leading to widespread shortages and hence demand in�ation. In reverse, when the A$ appreciates, demand in�ation slows. The higher dollar tends to reduce net exports, slow AD and cause unplanned rises in stocks, and thus widespread price discounting will slow in�ation.
• Cost in�ation occurs when production costs (such as wages, equipment and materials) rise, eroding busi-ness pro�ts. As a result, �rms are typically forced to pass on higher costs to consumers, so prices rise. As an aggregate supply-side factor, a falling A$ can add to cost in�ation because many local �rms need to purchase imported equipment and materials. In reverse, when the A$ appreciates, costs for some local pro-ducers become cheaper, allowing �rms to cut prices to compete and easing cost in�ation.
Effects of the exchange rate on economic growthThe government generally seeks to promote the macro goal of a strong and sustainable rate of economic growth — keeping the GDP increasing at the fastest rate that is economically and environmentally sustain-able — perhaps at around 3 per cent or a little more. Rises and falls in the exchange rate for the A$ can in�u-ence economic growth by affecting the level of aggregate demand and or aggregate supply. • As an aggregate demand-side factor, changes in A$ can alter AD by affecting net export spending (X – M)
and hence AD and the cyclical level of economic activity. A weaker A$ (as occurred in 2013–16) will tend to boost overseas spending on our exports, while slowing our spending on imports. As AD strengthens and stocks fall, �rms will try to lift production, accelerating the rate of economic growth. In reverse, a stronger A$ will tend to slow net exports and weaken AD, causing stocks to rise and output to be cut.
• As an aggregate supply-side factor, changes in the A$ can make conditions for local businesses either more or less favourable, thereby affecting productive capacity and the potential rate of economic growth. For instance, a lower A$ will be less favourable for those �rms importing materials and equipment since they face higher production costs and lower pro�ts, possibly leading to business closures. Capacity would prob-ably be reduced and the rate of growth slowed. However, these negatives might be partly offset since a weaker exchange rate also makes some businesses more competitive at home and abroad. In reverse, a stronger A$ has mixed effects too. While this is good for �rms importing materials and equipment because it reduces costs and stimulates growth, it also makes other local businesses that do not have to import mate-rials and equipment less competitive, possibly leading to closures and a lower rate of economic growth.
Effects of the exchange rate on employment and unemploymentA third domestic government macroeconomic objective is to promote the goal of full employment or the lowest unemployment rate that doesn’t add to in�ation. Changes in the exchange rate can affect rates of both cyclical and structural unemployment because the A$ can act as an aggregate demand- or an aggregate supply-side factor. • As an aggregate demand factor, the exchange rate can affect net exports (X − M), production, the demand
for resources and unemployment. By boosting exports and slowing import, a weaker A$ helps to accelerate AD (as happened in 2013–16), causes �rms to lift production and employ more labour, thereby decreasing cyclical unemployment. In reverse, a rising A$ slows net exports and aggregate demand, and leads to �rms cutting their output and employment.
• As an aggregate supply factor, the A$ can alter production costs and our international competitiveness. On the one hand, a lower A$ means dearer imports and higher production costs for some (but not all) �rms, reducing their pro�ts and possibly leading to closures and structural unemployment. On the other hand, this problem may be partly offset by improved competitiveness for other local businesses, leading to fewer clo-sures and less unemployment.UNCORRECTED A$ has mixed effects too. While this is good for �rms importing materials and equipment because
UNCORRECTED A$ has mixed effects too. While this is good for �rms importing materials and equipment because it reduces costs and stimulates growth, it also makes other local businesses that do not have to import mate
UNCORRECTED it reduces costs and stimulates growth, it also makes other local businesses that do not have to import materials and equipment less competitive, possibly leading to closures and a lower rate of economic growth.
UNCORRECTED rials and equipment less competitive, possibly leading to closures and a lower rate of economic growth.
fects of the exchange rate on employment and unemployment
UNCORRECTED fects of the exchange rate on employment and unemployment
A third domestic government macroeconomic objective is to promote the goal of full employment or the lowest
UNCORRECTED A third domestic government macroeconomic objective is to promote the goal of full employment or the lowest unemployment rate that doesn’t add to in�ation. Changes in the exchange rate can affect rates of both cyclical
UNCORRECTED unemployment rate that doesn’t add to in�ation. Changes in the exchange rate can affect rates of both cyclical and structural unemployment because the A$ can act as an aggregate demand- or an aggregate supply-side
UNCORRECTED
and structural unemployment because the A$ can act as an aggregate demand- or an aggregate supply-side
gate demand factor, the exchange rate can affect net exports (X − M), production, the demand
UNCORRECTED
gate demand factor, the exchange rate can affect net exports (X − M), production, the demand for resources and unemployment. By boosting exports and slowing import, a
UNCORRECTED
for resources and unemployment. By boosting exports and slowing import, a AD (as happened in 2013–16), causes �rms to lift production and employ more labour, thereby decreasing
UNCORRECTED
AD (as happened in 2013–16), causes �rms to lift production and employ more labour, thereby decreasing cyclical unemployment. In reverse, a
UNCORRECTED
cyclical unemployment. In reverse, a cutting their output and employment.
UNCORRECTED
cutting their output and employment.As an aggre
UNCORRECTED
As an aggregate supply factor, the A$ can alter production costs and our international competitiveness. On
UNCORRECTED
gate supply factor, the A$ can alter production costs and our international competitiveness. On the one hand, a
UNCORRECTED
the one hand, a lower
UNCORRECTED
lowerreducing their pro�ts and possibly leading to closures and structural unemployment. On the other hand, this
UNCORRECTED
reducing their pro�ts and possibly leading to closures and structural unemployment. On the other hand, this
UNCORRECTED
problem may be partly offset by improved competitiveness for other local businesses, leading to fewer clo
UNCORRECTED
problem may be partly offset by improved competitiveness for other local businesses, leading to fewer closures and less unemployment.UNCORRECTED
sures and less unemployment.
PAGE A$ will tend to slow net exports and weaken AD, causing stocks to rise and output to be cut.
PAGE A$ will tend to slow net exports and weaken AD, causing stocks to rise and output to be cut.gate supply-side factor, changes in the A$ can make conditions for local businesses either more
PAGE gate supply-side factor, changes in the A$ can make conditions for local businesses either more or less favourable, thereby affecting productive capacity and the potential rate of economic growth. For
PAGE or less favourable, thereby affecting productive capacity and the potential rate of economic growth. For
A$ will be less favourable for those �rms importing materials and equipment since they
PAGE A$ will be less favourable for those �rms importing materials and equipment since they
face higher production costs and lower pro�ts, possibly leading to business closures. Capacity would prob
PAGE face higher production costs and lower pro�ts, possibly leading to business closures. Capacity would probably be reduced and the rate of growth slowed. However, these negatives might be partly offset since a
PAGE ably be reduced and the rate of growth slowed. However, these negatives might be partly offset since a weaker exchange rate also makes some businesses more competitive at home and abroad. In reverse, a PAGE weaker exchange rate also makes some businesses more competitive at home and abroad. In reverse, a
A$ has mixed effects too. While this is good for �rms importing materials and equipment because PAGE
A$ has mixed effects too. While this is good for �rms importing materials and equipment because it reduces costs and stimulates growth, it also makes other local businesses that do not have to import matePAGE
it reduces costs and stimulates growth, it also makes other local businesses that do not have to import mate
PROOFSgoal of a strong and sustainable rate of economic
PROOFSgoal of a strong and sustainable rate of economic — keeping the GDP increasing at the fastest rate that is economically and environmentally sustain
PROOFS — keeping the GDP increasing at the fastest rate that is economically and environmentally sustain
able — perhaps at around 3 per cent or a little more. Rises and falls in the exchange rate for the A$ can in�u
PROOFSable — perhaps at around 3 per cent or a little more. Rises and falls in the exchange rate for the A$ can in�uence economic growth by affecting the level of aggregate demand and or aggregate supply.
PROOFSence economic growth by affecting the level of aggregate demand and or aggregate supply.
gate demand-side factor, changes in A$ can alter AD by affecting net export spending (X – M)
PROOFSgate demand-side factor, changes in A$ can alter AD by affecting net export spending (X – M)
and hence AD and the cyclical level of economic activity. A weaker A$ (as occurred in 2013–16) will tend
PROOFSand hence AD and the cyclical level of economic activity. A weaker A$ (as occurred in 2013–16) will tend to boost overseas spending on our exports, while slowing our spending on imports. As AD strengthens and
PROOFS
to boost overseas spending on our exports, while slowing our spending on imports. As AD strengthens and stocks fall, �rms will try to lift production, accelerating the rate of economic growth. In reverse, a stronger PROOFS
stocks fall, �rms will try to lift production, accelerating the rate of economic growth. In reverse, a stronger A$ will tend to slow net exports and weaken AD, causing stocks to rise and output to be cut.PROOFS
A$ will tend to slow net exports and weaken AD, causing stocks to rise and output to be cut.gate supply-side factor, changes in the A$ can make conditions for local businesses either more PROOFS
gate supply-side factor, changes in the A$ can make conditions for local businesses either more

172 Economics Down Under 2
c03AustraliaAndTheWorldEconomy 172 29 August 2016 1:07 PM
Effects of the exchange rate on the current account balance
In international trade, it is essential that we have a system to swap or exchange the currency of one country (like the Japanese yen, the euro or the US dollar) into that of another (like the Australian dollar or the British pound). Currencies are swapped at different exchange rates, and these rates are generally determined by the number of buyers and sellers of each currency in the foreign exchange market. Over time, exchange rates move up and down. Among other things, this affects the prices we pay for imports of foreign goods like electronics and oil, and the prices people overseas pay for Australian goods like iron ore and holidays, and the levels of AD, GDP and employment.
Australia’s current account records transactions between Australia and the rest of the world. These involve credits minus debits for goods and services, along with primary and secondary incomes. Australia typ-ically runs a CAD. A rise or fall in the exchange rate for the A$ can affect the size of our CAD in two main ways: through the value of exports and imports, and through the value of primary income credits and debits.
1. Value of exports and imports of goods and services
Changes in the exchange rate for the A$ affect the price, attractiveness and value of Australia’s exports and imports of goods and services, thereby affecting the balance on current account. • A fall in in the A$ makes Australia’s exports of goods (minerals like coal and iron ore, rural commodities
such as wheat and beef) and services (tourism, education) relatively cheaper to overseas buyers in terms of their currency. As a result, the value of our export sales typically rises, causing the CAD to shrink. In addition, a lower exchange rate often makes imports of goods (oil, cars, electrical appliances) and services (overseas travel) dearer in terms of our currency. This tends to slow purchases of imports, reduce debits and decrease the CAD.
• A stronger A$ often leads to a larger CAD. Our exports of goods and services become dearer, reducing the value of sales, while imports become cheaper, increasing purchases. As a result of decreased debits relative to credits, the CAD tends to increase.
2. Value of primary income credits and debits
Changes in the exchange rate for the A$ alter the cost or attractiveness of overseas capital in�ow and out�ow associated with buying and selling assets internationally. As a consequence, this can indirectly impact on net primary incomes and thus the balance on current account. • A fall in the A$ tends to make the purchase of shares and property, denominated in Australian dollars,
cheaper and more attractive for non-residents. By increasing net capital in�ow and foreign liabilities, this
UNCORRECTED In international trade, it is essential that we have a system to swap or exchange the currency of one country (like the
UNCORRECTED In international trade, it is essential that we have a system to swap or exchange the currency of one country (like the Japanese yen, the euro or the US dollar) into that of another (like the Australian dollar or the British pound). Currencies
UNCORRECTED Japanese yen, the euro or the US dollar) into that of another (like the Australian dollar or the British pound). Currencies are swapped at different exchange rates, and these rates are generally determined by the number of buyers and sellers
UNCORRECTED are swapped at different exchange rates, and these rates are generally determined by the number of buyers and sellers of each currency in the foreign exchange market. Over time, exchange rates move up and down. Among other things,
UNCORRECTED of each currency in the foreign exchange market. Over time, exchange rates move up and down. Among other things, this affects the prices we pay for imports of foreign goods like electronics and oil, and the prices people overseas pay for
UNCORRECTED this affects the prices we pay for imports of foreign goods like electronics and oil, and the prices people overseas pay for Australian goods like iron ore and holidays, and the levels of AD, GDP and employment.
UNCORRECTED Australian goods like iron ore and holidays, and the levels of AD, GDP and employment.
Australia’s current account records transactions between Australia and the rest of the world. These involve
UNCORRECTED
Australia’s current account records transactions between Australia and the rest of the world. These involve credits minus debits for goods and services, along with primary and secondary incomes. Australia typ
UNCORRECTED
credits minus debits for goods and services, along with primary and secondary incomes. Australia typically runs a CAD. A rise or fall in the exchange rate for the A$ can affect the size of our CAD in
UNCORRECTED
ically runs a CAD. A rise or fall in the exchange rate for the A$ can affect the size of our CAD in ain ways: through the value of exports and imports, and through the value of primary income credits
UNCORRECTED
ain ways: through the value of exports and imports, and through the value of primary income credits
1. Value of exports and imports of goods and services
UNCORRECTED
1. Value of exports and imports of goods and services
Changes in the exchange rate for the A$ affect the price, attractiveness and value of Australia’s exports and
UNCORRECTED
Changes in the exchange rate for the A$ affect the price, attractiveness and value of Australia’s exports and imports of goods and services, thereby affecting the balance on current account.
UNCORRECTED
imports of goods and services, thereby affecting the balance on current account.A
UNCORRECTED
A fall
UNCORRECTED
fall in in the A$ makes Australia’s exports of goods (minerals like coal and iron ore, rural commodities
UNCORRECTED
in in the A$ makes Australia’s exports of goods (minerals like coal and iron ore, rural commodities fall in in the A$ makes Australia’s exports of goods (minerals like coal and iron ore, rural commodities fall
UNCORRECTED
fall in in the A$ makes Australia’s exports of goods (minerals like coal and iron ore, rural commodities fallsuch as wheat and beef) and services (tourism, education) relatively cheaper to overseas buyers in terms UNCORRECTED
such as wheat and beef) and services (tourism, education) relatively cheaper to overseas buyers in terms of their currency. As a result, the value of our export sales typically rises, causing the CAD to shrink. In UNCORRECTED
of their currency. As a result, the value of our export sales typically rises, causing the CAD to shrink. In addition, a lower exchange rate often makes imports of goods (oil, cars, electrical appliances) and services UNCORRECTED
addition, a lower exchange rate often makes imports of goods (oil, cars, electrical appliances) and services
PAGE
PAGE
PAGE
In international trade, it is essential that we have a system to swap or exchange the currency of one country (like the PAGE
In international trade, it is essential that we have a system to swap or exchange the currency of one country (like the
PROOFS

TOPIC 3 Australia and the world economy 173
c03AustraliaAndTheWorldEconomy 173 29 August 2016 1:07 PM
could ultimately add to primary income debits involving the payment of dividends, rent and pro�ts abroad, and thus the CAD. Additionally, the weaker dollar could make it dearer and less attractive for Australian investors to purchase foreign assets, at least those denominated in foreign currencies. In the longer term, this may indirectly tend to slow our primary income credits and add to our CAD.
• By contrast, a stronger A$ can sometimes encourage capital out�ow associated with the purchase of overseas assets by residents. These assets become relatively cheaper and more attractive if denominated in foreign currencies. In the long term, this could lead to higher primary income credits while discour-aging foreign capital in�ow and primary income debits. As a consequence, there could be a reduction in the CAD.
Weblinks The weblinks in these activities are available in this chapter’s student resources tab.• The relationship between the current account balance and exchange rates • Foreign exchange (FOREX), Macro 5.2• Foreign exchange practice, Macro 5.3• Economics made easy — Lesson 9: Exchange rate policy (devaluation)
CHECK YOUR UNDERSTANDING
1 What is the exchange rate and how is it determined for Australia?2 Explain how Australia’s exchange rate is measured.3 Identify and explain any three domestic and two international factors that are likely to affect Australia’s
exchange rate.4 Explain how you would expect a rise or a fall in the value of the A$ to affect each of the following
economic variables.a The government’s domestic macroeconomic goalsb The balance of payments on current account
APPLIED ECONOMIC EXERCISES
Apply your understanding of this subtopic by accessing and completing the Applied economic exercise(s).
• School-assessed coursework > Applied economic exercises > Question 6
3.7 Australia’s international competitivenessAs discussed earlier, Australia gains huge economic bene�ts from international trade. So it is hardly surprising that the federal government uses policies to encourage trade and make local �rms more internationally competitive. This helps Australia to ‘pay its way in international transactions’ and ‘live within its means’, thereby promoting the Australian government’s goal of external stability. In addition, being internationally competitive strengthens the goals associated with domestic economic stability (simultaneously achieving low in�ation, strong and sustainable economic growth and full employment), ultimately promoting Australian living standards.
What is international competitiveness?The Australian government wants local businesses to be internationally competitive. International competitiveness simply means that Australian producers of goods and services can compete, survive, expand and �ourish against foreign rivals, allowing them to capture a growing share of global sales and incomes, and in the process increasing our living standards. Typically, local �rms can get the sales edge over foreign counterparts through several means: • A competitive selling price. The selling price paid for goods and services greatly in�uences the purchasing
decisions of many consumers. Hence, to grow their global market share, local sellers need to be able to trade pro�tably at relatively low prices against similar items made abroad (preferably without government �nancial assistance). This means that �rms need to focus on maximising ef�ciency in their use of resources and keeping production costs down.
• Non-price factors. Consumer decisions are also affected by non-price factors such as:– offering better quality goods or services that match or exceed those available abroad– catering for and satisfying the changing needs of consumers better than rival suppliers overseas– providing superior customer service, including prompt and courteous delivery.
UNCORRECTED
UNCORRECTED
UNCORRECTED
UNCORRECTED Apply your understanding of this subtopic by accessing and completing the Applied economic exercise(s).
UNCORRECTED Apply your understanding of this subtopic by accessing and completing the Applied economic exercise(s).
School-assessed coursework > Applied economic exercises >
UNCORRECTED School-assessed coursework > Applied economic exercises >
3.7 Australia’s international competitiveness
UNCORRECTED
3.7 Australia’s international competitiveness
UNCORRECTED
As discussed earlier, Australia gains huge economic bene�ts from international trade. So it is hardly surprising that
UNCORRECTED
As discussed earlier, Australia gains huge economic bene�ts from international trade. So it is hardly surprising that the federal government uses policies to encourage trade and make local �rms more
UNCORRECTED
the federal government uses policies to encourage trade and make local �rms more This helps Australia to ‘pay its way in international transactions’ and ‘live within its means’, thereby promoting the
UNCORRECTED
This helps Australia to ‘pay its way in international transactions’ and ‘live within its means’, thereby promoting the Australian government’s
UNCORRECTED
Australian government’s goal of external stability.
UNCORRECTED
goal of external stability.goals associated with
UNCORRECTED
goals associated with domestic economic stability
UNCORRECTED
domestic economic stabilityeconomic growth and full employment), ultimately promoting Australian living standards.
UNCORRECTED
economic growth and full employment), ultimately promoting Australian living standards.
UNCORRECTED
What is international competitiveness?
UNCORRECTED
What is international competitiveness?The Australian government wants local businesses to be internationally competitive. UNCORRECTED
The Australian government wants local businesses to be internationally competitive. competitiUNCORRECTED
competitivenessUNCORRECTED
veness
PAGE
PAGE
PAGE ee domestic and two international factors that are likely to affect Australia’s
PAGE ee domestic and two international factors that are likely to affect Australia’s
Explain how you would expect a rise or a fall in the value of the A$ to af
PAGE Explain how you would expect a rise or a fall in the value of the A$ to affect each of the following
PAGE fect each of the following Explain how you would expect a rise or a fall in the value of the A$ to affect each of the following Explain how you would expect a rise or a fall in the value of the A$ to af
PAGE Explain how you would expect a rise or a fall in the value of the A$ to affect each of the following Explain how you would expect a rise or a fall in the value of the A$ to af
PROOFS
PROOFS
PROOFS
PROOFS
PROOFS
ee domestic and two international factors that are likely to affect Australia’s PROOFS
ee domestic and two international factors that are likely to affect Australia’s

174 Economics Down Under 2
c03AustraliaAndTheWorldEconomy 174 29 August 2016 1:07 PM
Factors that may in�uence Australia’s international competitivenessMany factors in�uence whether Australian �rms are internationally competitive. They include production costs such as wage rates, productivity, availability of resources, the exchange rate, relative rates of in�ation, inno-vation and R&D, rates of company tax and government subsidies.
Production costs of businesses, including wagesThe price and competitiveness of local �rms is affected by how our costs of production compare with those abroad. Here, production costs for businesses might include • wages and labour on-costs like compulsory superannuation, leave entitlements and workers compensation • the costs of utilities such as power, gas and water, as well as the costs of communications and transport • the costs of �rms borrowing credit or �nance (the rate of interest on business overdrafts) • the costs of purchasing raw materials and equipment.
If these costs overall are higher relative to those overseas, it is likely that local �rms will be uncompetitive. Businesses will have to sell their products at a higher and therefore less attractive price in local and foreign markets, leading to lower exports, higher imports and a bigger CAD.
ProductivityProductivity relates to ef�ciency or the level of output gained from a given quantity of inputs or resources. Labour productivity is commonly measured by the level of GDP per hour worked, while multifactor prod-uctivity measures the ef�ciency with which the combined inputs of labour, capital and natural resources are converted into production. Low productivity translates into higher production costs, and hence act as a less favourable aggregate supply-side factor. It makes locally produced goods less attractive to imports. This weakens our international competitiveness.
Figure 3.22 shows how Australia’s labour and multifactor productivity have changed over the last 18 years, along with the recent changes by industry.
The graph in part (a) of �gure 3.22 shows that, despite some good rises in labour productivity over the period, multifactor productivity overall has been decreasing since 2001–02. Looking at the graph in part (b) of the �gure showing particular industries, multifactor productivity has recently been negative, especially in the mining and utilities sectors. While a few of these industries (especially services) do not directly compete with imports, most do; hence lower productivity is a worry. There are a number of explanations for these changes in ef�ciency that undermine our international competitiveness: • Productivity often moves in cycles and is dif�cult to measure, as it is hard to determine the exact origin of
the change. • Industries where there have been rapid changes in technology record faster improvements. • In the case of agriculture, severe weather events of late would not help, along with the use of more marginal land. • In mining, there has been heavy investment of capital resources, but the full production returns have not yet
been realised. In addition, the remaining natural resources are becoming more costly to extract since the easier ones have already been exploited.
• The rise in labour productivity may have been helped by the general increase in unpaid overtime.
Availability of natural resourcesAustralia is relatively rich in natural resources (coal, bauxite, iron ore, alumina) that are wanted by many nations, and we also have a relatively large area of productive land for grazing and agriculture. This means that mineral and rural commodities can often be produced at lower and more competitive prices, making us more internationally competitive.
The exchange rateAs we know, the exchange rate for the A$ affects the price of exports and imports of goods and services. • A generally lower exchange rate (as occurred between 2013 and 2016) allows Australian-made goods and
services to be sold relatively cheaply. This usually helps to make local industry more competitive at home and abroad.
• In reverse, a higher A$ (as occurred between 2010 and 2013) makes our exports relatively dearer against imports, undermining our international competitiveness.
Relative rates of in�ationAustralia’s in�ation rate compared against rates abroad affects the international attractiveness of locally made goods and services. • A relatively lower in�ation rate here makes our goods and services more attractive to buyers at home and
abroad, making us more internationally competitive. • In reverse, a relatively higher in�ation rate here erodes our international competitiveness and sales.
UNCORRECTED mining and utilities sectors. While a few of these industries (especially services) do not directly compete with
UNCORRECTED mining and utilities sectors. While a few of these industries (especially services) do not directly compete with imports, most do; hence lower productivity is a worry. There are a number of explanations for these changes
UNCORRECTED imports, most do; hence lower productivity is a worry. There are a number of explanations for these changes in ef�ciency that undermine our international competitiveness:
UNCORRECTED in ef�ciency that undermine our international competitiveness:
vity often moves in cycles and is dif�cult to measure, as it is hard to determine the exact origin of
UNCORRECTED vity often moves in cycles and is dif�cult to measure, as it is hard to determine the exact origin of
where there have been rapid changes in technology record faster improvements.
UNCORRECTED where there have been rapid changes in technology record faster improvements.
UNCORRECTED vere weather events of late would not help, along with the use of more marginal land.
UNCORRECTED vere weather events of late would not help, along with the use of more marginal land.
In mining, there has been hea
UNCORRECTED
In mining, there has been heavy investment of capital resources, but the full production returns have not yet
UNCORRECTED
vy investment of capital resources, but the full production returns have not yet been realised. In addition, the remaining natural resources are becoming more costly to extract since the
UNCORRECTED
been realised. In addition, the remaining natural resources are becoming more costly to extract since the easier ones have already been exploited.
UNCORRECTED
easier ones have already been exploited.rise in labour productivity may have been helped by the general increase in unpaid overtime.
UNCORRECTED
rise in labour productivity may have been helped by the general increase in unpaid overtime.
ailability of natural resources
UNCORRECTED
ailability of natural resources
UNCORRECTED
Australia is relatively rich in natural resources (coal, bauxite, iron ore, alumina) that are wanted by many
UNCORRECTED
Australia is relatively rich in natural resources (coal, bauxite, iron ore, alumina) that are wanted by many nations, and we also have a relatively large area of productive land for grazing and agriculture. This means that
UNCORRECTED
nations, and we also have a relatively large area of productive land for grazing and agriculture. This means that mineral and rural commodities can often be produced at lower and more competitive prices, making us more
UNCORRECTED
mineral and rural commodities can often be produced at lower and more competitive prices, making us more internationally competitive.
UNCORRECTED
internationally competitive.
The exchange rateUNCORRECTED
The exchange rateAs we know, the exchange rate for the A$ affects the price of exports and imports of goods and services.UNCORRECTED
As we know, the exchange rate for the A$ affects the price of exports and imports of goods and services.
PAGE less favourable aggregate supply-side factor. It makes locally produced goods less attractive to imports. This
PAGE less favourable aggregate supply-side factor. It makes locally produced goods less attractive to imports. This
Figure 3.22 shows how Australia’s labour and multifactor productivity have changed over the last 18 years,
PAGE Figure 3.22 shows how Australia’s labour and multifactor productivity have changed over the last 18 years,
The graph in part (a) of �gure 3.22 shows that, despite some good rises in labour productivity over the
PAGE The graph in part (a) of �gure 3.22 shows that, despite some good rises in labour productivity over the
period, multifactor productivity overall has been decreasing since 2001–02. Looking at the graph in part (b) of
PAGE period, multifactor productivity overall has been decreasing since 2001–02. Looking at the graph in part (b) of the �gure showing particular industries, multifactor productivity has recently been negative, especially in the PAGE the �gure showing particular industries, multifactor productivity has recently been negative, especially in the mining and utilities sectors. While a few of these industries (especially services) do not directly compete with PAGE
mining and utilities sectors. While a few of these industries (especially services) do not directly compete with imports, most do; hence lower productivity is a worry. There are a number of explanations for these changes PAGE
imports, most do; hence lower productivity is a worry. There are a number of explanations for these changes
PROOFSIf these costs overall are higher relative to those overseas, it is likely that local �rms will be uncompetitive.
PROOFSIf these costs overall are higher relative to those overseas, it is likely that local �rms will be uncompetitive. Businesses will have to sell their products at a higher and therefore less attractive price in local and foreign
PROOFSBusinesses will have to sell their products at a higher and therefore less attractive price in local and foreign
relates to ef�ciency or the level of output gained from a given quantity of inputs or resources.
PROOFS relates to ef�ciency or the level of output gained from a given quantity of inputs or resources.
is commonly measured by the level of GDP per hour worked, while
PROOFS is commonly measured by the level of GDP per hour worked, while
measures the ef�ciency with which the combined inputs of labour, capital and natural resources
PROOFS
measures the ef�ciency with which the combined inputs of labour, capital and natural resources are converted into production. Low productivity translates into higher production costs, and hence act as a PROOFS
are converted into production. Low productivity translates into higher production costs, and hence act as a less favourable aggregate supply-side factor. It makes locally produced goods less attractive to imports. This PROOFS
less favourable aggregate supply-side factor. It makes locally produced goods less attractive to imports. This

TOPIC 3 Australia and the world economy 175
c03AustraliaAndTheWorldEconomy 175 29 August 2016 1:07 PM
110Index
100
Part (a) Australia: Overall trends in labour and multifactor productivity
90
80
70LP
2013–142010–112007–082004–052001–021998–991995–96
MFP
Finance & insurance
Average annual change to 2013–14
Part (b) Australia: Changes in multifactor productivity by industry
Agriculture, forestry & �shing
Retail trade
Construction
Wholesale trade
Accommodation, cafes & restaurants
Arts & recreation
Transport, postal & warehousing
Information media & telecomms
Administration & support
Manufacturing
Professional, scienti�c & technical
Other services
Rental, hiring & real estate
Electricity, gas, water & waste
Mining
Market sector
–6 –4 –2
Change over 5 years
0
Per cent
2 4
Change over 10 years
FIGURE 3.22 Trends in Australia’s labour and multifactor productivity
Sources: Graph (a) copied from ABS 5260.0.55.002, Estimates of Industry Multifactor Productivity, 2013–14 (latest 5/12/14); graph (b) copied from Department of Industry and Science, Competitiveness at a Glance, http://www.industry.gov.au/Of�ce-of-the-Chief-Economist/Publications/IndustryMonitor/section1.html.
UNCORRECTED
UNCORRECTED
UNCORRECTED
UNCORRECTED
UNCORRECTED Accommodation, cafes & restaurants
UNCORRECTED Accommodation, cafes & restaurants
Arts & recreation
UNCORRECTED Arts & recreation
Transport, postal & warehousing
UNCORRECTED
Transport, postal & warehousing
Information media & telecomms
UNCORRECTED
Information media & telecomms
Administration & support
UNCORRECTED
Administration & support
Manufacturing
UNCORRECTED
Manufacturing
Professional, scienti�c & technical
UNCORRECTED
Professional, scienti�c & technical
Rental, hiring & real estate
UNCORRECTED
Rental, hiring & real estate
UNCORRECTED
UNCORRECTED
UNCORRECTED
UNCORRECTED PAGE
PAGE
PAGE
PAGE
PAGE Part (b) Australia: Changes in multifactor productivity by industry
PAGE Part (b) Australia: Changes in multifactor productivity by industry
PAGE
PAGE
PAGE
PAGE
PAGE
PAGE PROOFS
PROOFS
PROOFS
PROOFS
PROOFS
PROOFS
PROOFS
PROOFS
PROOFS
PROOFS70
PROOFS70LP
PROOFSLP
2013–14
PROOFS2013–14

176 Economics Down Under 2
c03AustraliaAndTheWorldEconomy 176 29 August 2016 1:07 PM
InnovationR&D and innovation (the development of new products and different ways of making things, and adapting to the changing wants of consumers) can all help give a nation a competitive edge and allow it to sell more strongly in both local and international markets. In contrast to some countries, Australian businesses spend less than 1.2 per cent of GDP on R&D (down from around 1.4 per cent over the last �ve years). Government spending on education is also needed to grow our creativity and innovation, but this is also down. We are being overtaken by other countries, and this too helps to explain the fall in our international competitiveness.
Rates of company taxCompany tax rates affect the after-tax pro�ts of �rms and hence the price they must charge to make reasonable returns. With few exceptions, Australia’s corporate tax rates of 30 per cent for large �rms and 28.5 per cent for small �rms (in 2015–16), are generally higher than our competitors in Asia (China, Vietnam, India and Indonesia, where in 2016 the average tax rate was just over 21 per cent) and in Europe (Italy, Germany and Ireland, where it was just 22 per cent). It also means that local �rms cannot afford to purchase more ef�cient technology and equipment needed to improve their productivity. In these ways, higher corporate tax rates help to explain why local businesses need to charge higher prices than some businesses overseas, making them less internationally competitive.
Government subsidiesThe Australian government pays cash subsidies to local producers to help encourage structural change and cover some production costs. This allows businesses to sell their product at a lower price in both local and international markets. Sometimes the decision to pay subsidies is designed to correct market failure, but at other times it could be to help support infant industries and win greater political popularity. Whatever the case, subsidies can make local �rms more internationally competitive.
Weblinks The weblinks in these activities are available in this chapter’s student resources tab.• What is competitiveness?• Global Competitiveness Report 2015–16
CHECK YOUR UNDERSTANDING
1 De�ne the term international competitiveness.2 How internationally competitive is Australian business generally?3 Explain how each of the following might affect Australia’s international competitiveness.
a High production costsb Weaker multifactor productivityc Readily available natural resourcesd Low domestic in�ation ratese A lower exchange ratef High rates of company tax
APPLIED ECONOMIC EXERCISES
Apply your understanding of this subtopic by accessing and completing the Applied economic exercise(s).
• School-assessed coursework > Applied economic exercises > Question 7UNCORRECTED
UNCORRECTED
UNCORRECTED
UNCORRECTED international competitiveness
UNCORRECTED international competitiveness
nationally competitive is Australian business generally?
UNCORRECTED nationally competitive is Australian business generally?
Explain how each of the following might af
UNCORRECTED Explain how each of the following might af
eaker multifactor productivity
UNCORRECTED
eaker multifactor productivityReadily available natural r
UNCORRECTED
Readily available natural resources
UNCORRECTED
esourcesLow domestic in�ation rates
UNCORRECTED
Low domestic in�ation ratesA lower exchange rate
UNCORRECTED
A lower exchange rateHigh rates of company tax
UNCORRECTED
High rates of company tax
UNCORRECTED
UNCORRECTED
UNCORRECTED
UNCORRECTED
UNCORRECTED
UNCORRECTED
P
UNCORRECTED
PL
UNCORRECTED
LI
UNCORRECTED
IE
UNCORRECTED
ED E
UNCORRECTED
D EC
UNCORRECTED
CO
UNCORRECTED
ON
UNCORRECTED
N
Apply your understanding of this subtopic by accessing and completing the Applied economic exercise(s).
UNCORRECTED
Apply your understanding of this subtopic by accessing and completing the Applied economic exercise(s).
•UNCORRECTED
• School-assessed coursework > Applied economic exercises > UNCORRECTED
School-assessed coursework > Applied economic exercises >
PAGE
PAGE The weblinks in these activities are available in this chapter’s student resources tab.
PAGE The weblinks in these activities are available in this chapter’s student resources tab.
PAGE PROOFS
Indonesia, where in 2016 the average tax rate was just over 21 per cent) and in Europe (Italy, Germany and
PROOFSIndonesia, where in 2016 the average tax rate was just over 21 per cent) and in Europe (Italy, Germany and Ireland, where it was just 22 per cent). It also means that local �rms cannot afford to purchase more ef�cient
PROOFSIreland, where it was just 22 per cent). It also means that local �rms cannot afford to purchase more ef�cient technology and equipment needed to improve their productivity. In these ways, higher corporate tax rates help
PROOFStechnology and equipment needed to improve their productivity. In these ways, higher corporate tax rates help to explain why local businesses need to charge higher prices than some businesses overseas, making them less
PROOFSto explain why local businesses need to charge higher prices than some businesses overseas, making them less
The Australian government pays cash subsidies to local producers to help encourage structural change and
PROOFSThe Australian government pays cash subsidies to local producers to help encourage structural change and cover some production costs. This allows businesses to sell their product at a lower price in both local and
PROOFScover some production costs. This allows businesses to sell their product at a lower price in both local and international markets. Sometimes the decision to pay subsidies is designed to correct market failure, but at
PROOFS
international markets. Sometimes the decision to pay subsidies is designed to correct market failure, but at other times it could be to help support infant industries and win greater political popularity. Whatever the case, PROOFS
other times it could be to help support infant industries and win greater political popularity. Whatever the case,

TOPIC 3 Australia and the world economy 177
c03AustraliaAndTheWorldEconomy 177 29 August 2016 1:07 PM
3.8 The effect of trade liberalisation on Australia’s international competitiveness, domestic macroeconomic goals and living standards
Most economists believe that free trade, or the absence of government protection of local industry from imports, helps to increase ef�ciency in the use or allocation of resources. In the long term, this should raise national output, employment, incomes and material living standards. Unfortunately, some countries (like Japan, China, United States and certain members of the European Union) still use subsidies and tariffs to protect their farmers and manufacturing industries.
Australia’s policy of trade liberalisationEspecially since the 1990s, the Australian government (like most governments around the world) has gradually adopted the policy of trade liberalisation. Essentially, trade liberalisation involves progressively reducing the various forms of protection of local industry, including the following: • cutting tariffs • reducing subsidies and industry assistance • abolishing import quotas • increasing the number of free trade agreements (FTAs) • scaling back other protective devices.
This approach differs from the policy of free trade, which is the complete removal of all forms of government industry protection. The key policy elements involved in Australia’s policy of trade liberalisation are summar-ised in �gure 3.23.
UNCORRECTED incomes and material living standards. Unfortunately, some countries (like Japan, China, United States and certain
UNCORRECTED incomes and material living standards. Unfortunately, some countries (like Japan, China, United States and certain members of the European Union) still use subsidies and tariffs to protect their farmers and manufacturing industries.
UNCORRECTED members of the European Union) still use subsidies and tariffs to protect their farmers and manufacturing industries.
Australia’s policy of trade liberalisation
UNCORRECTED Australia’s policy of trade liberalisationEspecially since the 1990s, the Australian government (like most governments around the world) has gradually
UNCORRECTED Especially since the 1990s, the Australian government (like most governments around the world) has gradually adopted the policy of trade liberalisation. Essentially,
UNCORRECTED adopted the policy of trade liberalisation. Essentially, various forms of protection of local industry
UNCORRECTED
various forms of protection of local industry, including the following:
UNCORRECTED
, including the following:
subsidies and industry assistance
UNCORRECTED
subsidies and industry assistanceimport quotas
UNCORRECTED
import quotasthe number of free trade agreements (FTAs)
UNCORRECTED
the number of free trade agreements (FTAs)
UNCORRECTED
back other protective devices.
UNCORRECTED
back other protective devices.This approach differs from the policy of
UNCORRECTED
This approach differs from the policy of industry protection. The key policy elements involved in Australia’s policy of trade liberalisation are summar
UNCORRECTED
industry protection. The key policy elements involved in Australia’s policy of trade liberalisation are summarised in �gure 3.23.
UNCORRECTED
ised in �gure 3.23.
PAGE
PAGE
PAGE Most economists believe that free trade, or the absence of government protection of local industry from imports, helps to
PAGE Most economists believe that free trade, or the absence of government protection of local industry from imports, helps to increase ef�ciency in the use or allocation of resources. In the long term, this should raise national output, employment, PAGE increase ef�ciency in the use or allocation of resources. In the long term, this should raise national output, employment, incomes and material living standards. Unfortunately, some countries (like Japan, China, United States and certain PAGE
incomes and material living standards. Unfortunately, some countries (like Japan, China, United States and certain members of the European Union) still use subsidies and tariffs to protect their farmers and manufacturing industries.PAGE
members of the European Union) still use subsidies and tariffs to protect their farmers and manufacturing industries.
PROOFS
PROOFS

178 Economics Down Under 2
c03AustraliaAndTheWorldEconomy 178 29 August 2016 1:07 PM
0
5
10
15
20
25
30
35
40
19
70
–71
19
80
–81
19
90
–91
20
00
–01
20
10
–11
20
14
–15
20
19
–20
Tari
ff r
ate
(per
cent
age)
, su
bsid
ies
($ b
illio
ns)
and
cum
ulat
ive
num
ber
of F
TAs
Year
Indicators of trade liberalisation in Australia
Cumulative number offree trade agreements
General rate ofmanufacturing tariffs(percentage)
Rate of agriculturaltariffs (percentage)
Estimated value of netsubsidies and industryassistance ($ billions)
Year 1970–71 1980–81 1990–91 2000–01 2010–11 2014–15 2019–20
Cumulative number of free trade agreements 0 0 1 1 7 10
General rate of manufacturing tariffs (percentage) 36 23 16 5 5 5
Rate of agricultural tariffs (percentage) 28 12 13 6 0 0
Estimated value of net subsidies and industry assistance ($billion) 25 20 18 8 11 9
FIGURE 3.23 Indicators of the Australian government’s adoption of trade liberalisation measures, 1970 to 2016
Sources: Data derived from many sources including AGPS; Industry Commission; 2002 Trade Policy Review for Australia; Productivity Commission, Trade and Assistance Review 2015; DFAT; Budget Review 2006–07; and budget papers 2008–09 to 2015–16. Note: Data for 2014–15 represents an estimate only.
Reducing industry protection and liberalising trade allowed Australia to become part of the process of globali-sation in the following ways: • It forced us to specialise and allocate resources more ef�ciently into areas of production where we had a com-
parative cost advantage (or the least cost disadvantage). This meant that more output could be gained from the same inputs of resources, accelerating the sustainable rate of economic and income growth. It also helped to keep in�ation in check, thereby lifting the purchasing power of incomes and material living standards.
• It gave local �rms a clear choice: become internationally competitive by cutting costs and adopting world’s best practice in production, or face extinction. By restructuring their production, some local �rms have become exporters to a huge world market, strengthening our balance of payments current account. Despite the possibility of structural unemployment in some industries, especially in the shorter term, trade liberali-sation has helped to grow employment, real incomes and material living standards.Trade liberalisation also made the government more economically accountable and caused it to focus on
other supply-side ef�ciency measures needed for survival in an open economy. Let us �nd out more about the speci�c policy measures associated with the adoption of trade liberalisation by the Australian government.
Tariff cutsTariffs (also called import duties) represent an indirect tax levied on selected imported goods. In general, tariffs are added onto the price of imports to make them dearer or less attractive to local consumers. They limit foreign competition and restrict the supply of goods in local markets. Because of this, economists agree that high tariffs cause resources to be allocated inef�ciently into industries where we have no comparative cost advantage. This type of protection weakens competition. It means that local �rms can remain inef�cient and uncompetitive and still survive, while local households and businesses must pay higher prices for these items, reducing living standards. These costs offset any gains from a possible increase in incomes and employment arising in the short term from having tariffs. Additionally, when one country raises its tariffs, this becomes a justi�cation for other nations to retaliate and increase their protection. This reduces trade volumes, real incomes, consumption and living standards.
In contrast to high rates of tariff protection, a gradual reduction of protection, as implemented in Australia over the past 50 years, helps to improve allocative, technical and dynamic ef�ciency. Importantly, tariff cuts encourage local �rms to become more internationally competitive by forcing them to cut costs and restructure production operations so as to become internationally competitive. In so doing, this helps to grow Australia’s productive capacity, incomes and living standards. Figure 3.24 shows how tariff protection of Australian industry has been gradually reduced.
UNCORRECTED Reducing industry protection and liberalising trade allowed Australia to become part of the process of globali
UNCORRECTED Reducing industry protection and liberalising trade allowed Australia to become part of the process of globali
It forced us to specialise and allocate resources more ef�ciently into areas of production where we had a
UNCORRECTED It forced us to specialise and allocate resources more ef�ciently into areas of production where we had a
(or the least cost disadvantage). This meant that more output could be gained from the
UNCORRECTED (or the least cost disadvantage). This meant that more output could be gained from the
same inputs of resources, accelerating the sustainable rate of economic and income growth. It also helped to
UNCORRECTED same inputs of resources, accelerating the sustainable rate of economic and income growth. It also helped to
UNCORRECTED keep in�ation in check, thereby lifting the purchasing power of incomes and material living standards.
UNCORRECTED keep in�ation in check, thereby lifting the purchasing power of incomes and material living standards.
ave local �rms a clear choice: become internationally competitive by cutting costs and adopting world’s
UNCORRECTED
ave local �rms a clear choice: become internationally competitive by cutting costs and adopting world’s best practice in production, or face extinction. By restructuring their production, some local �rms have
UNCORRECTED
best practice in production, or face extinction. By restructuring their production, some local �rms have become exporters to a huge world market, strengthening our balance of payments current account. Despite
UNCORRECTED
become exporters to a huge world market, strengthening our balance of payments current account. Despite the possibility of structural unemployment in some industries, especially in the shorter term, trade liberali
UNCORRECTED
the possibility of structural unemployment in some industries, especially in the shorter term, trade liberalisation has helped to grow employment, real incomes and material living standards.
UNCORRECTED
sation has helped to grow employment, real incomes and material living standards.Trade liberalisation also made the government more economically accountable and caused it to focus on
UNCORRECTED
Trade liberalisation also made the government more economically accountable and caused it to focus on other supply-side ef�ciency measures needed for survival in an open economy. Let us �nd out more about the
UNCORRECTED
other supply-side ef�ciency measures needed for survival in an open economy. Let us �nd out more about the
UNCORRECTED
speci�c policy measures associated with the adoption of trade liberalisation by the Australian government.
UNCORRECTED
speci�c policy measures associated with the adoption of trade liberalisation by the Australian government.
Tariff cuts
UNCORRECTED
Tariff cutsTariffs
UNCORRECTED
Tariffs (also called
UNCORRECTED
(also called are added onto the price of imports to make them dearer or less attractive to local consumers. They limit foreign UNCORRECTED
are added onto the price of imports to make them dearer or less attractive to local consumers. They limit foreign competition and restrict the supply of goods in local markets. Because of this, economists agree that high tariffs UNCORRECTED
competition and restrict the supply of goods in local markets. Because of this, economists agree that high tariffs
PAGE
PAGE
PAGE
PAGE
PAGE 25 20 18 8 11
PAGE 25 20 18 8 11
Indicators of the Australian government’s adoption of trade liberalisation measures, 1970 to 2016
PAGE Indicators of the Australian government’s adoption of trade liberalisation measures, 1970 to 2016
Data derived from many sources including AGPS; Industry Commission; 2002 Trade Policy Review for Australia; Productivity
PAGE Data derived from many sources including AGPS; Industry Commission; 2002 Trade Policy Review for Australia; Productivity
Commission, Trade and Assistance Review 2015; DFAT; Budget Review 2006–07; and budget papers 2008–09 to 2015–16.
PAGE Commission, Trade and Assistance Review 2015; DFAT; Budget Review 2006–07; and budget papers 2008–09 to 2015–16.
Reducing industry protection and liberalising trade allowed Australia to become part of the process of globaliPAGE
Reducing industry protection and liberalising trade allowed Australia to become part of the process of globali
PROOFS
PROOFS
PROOFS
PROOFS
PROOFS1970–71 1980–81 1990–91 2000–01 2010–11 2014–15 2019–20
PROOFS1970–71 1980–81 1990–91 2000–01 2010–11 2014–15 2019–20
7
PROOFS7
36 23 16 5
PROOFS36 23 16 5 5
PROOFS5
28 12 13 6PROOFS
28 12 13 6
25 20 18 8 11PROOFS
25 20 18 8 11

TOPIC 3 Australia and the world economy 179
c03AustraliaAndTheWorldEconomy 179 29 August 2016 1:07 PM
0
20
40
60
80
100
120
140
160
180
200
19
68
–69
19
70
–71
19
80
–81
19
85
–86
19
90
–91
19
95
–96
20
00
–01
20
05
–06
20
10
–11
20
15
–16
Eff
ecti
ve r
ate
of t
arif
f pr
otec
tion
(pe
rcen
tage
)Clothing apparel tariffs(percentage)
General manufacturing tariff(percentage)
Passenger motor vehicles tariffs(percentage)
White goods tariffs(percentage)
Agricultural tariffs(percentage)
FIGURE 3.24 Changes in tariff protection of Australian industry, 1968–69 to 2015–16
Sources: Data derived from many sources including AGPS; Industry Commission; 2002 Trade Policy Review for Australia; Productivity Commission, Trade and Assistance Review 2015; DFAT; Budget Review 2006–07; and budget papers 2008–09 to 2016–17.
Notice the following trends in tariff rates shown in �gure 3.24: • General tariff rate. The general tariff rate on most manufactured items was cut from 36 per cent in 1968–69
to only around 5 per cent from 1995–96 onwards (where the tariff level has since remained). • Special tariff rates. Tariffs applied to special industries like agriculture, TC&F (textiles, clothing, and foot-
wear), kitchen whitegoods and passenger cars have all come down at varying rates. These industries initially enjoyed more protection and cutting them too quickly to 5 per cent would have meant certain collapse. From 2010, rates on cars came down to 5 per cent and TC&F to 10 per cent, while in 2015 most tariffs for TC&F were reduced to 5 per cent.
Reduced net subsidies and other assistance to local producersSubsidies are government cash payments made to local producers and industries designed to help them cover some of their production costs. In so doing, they can grow local industry and may help businesses compete internationally. Subsidies or industry assistance can come in many forms but most are normally �nanced through the government’s annual budget outlays. After a peak of $25 billion a year in 1970, overallnet subsidies and budget assistance were generally reduced to roughly $9 billion by 2015. Lower sub-sidies are justi�ed on the grounds that some subsidies damage ef�ciency in resource allocation and create costs that reduce overall living standards. Indeed, in times past, some Australian industries had become dependent on government protective handouts. They had not restructured their production to become inter-nationally competitive.
Nevertheless, today, we still have some industry assistance in cases where there is market failure and various long-term bene�ts can be gained. Here we might think of the following schemes: • Export Development Grants (EMDG) are managed through AUSTRADE. They seek to help �rms cover up
to 50 per cent of the costs involved with the promotion of their goods and services in foreign markets. • There is a Tax Incentive Scheme for investment in R&D by smaller companies involved in innovation and
the commercialisation of ideas for manufacturing and rural industry. It is designed to lift productivity and sales. This accounts for around a third of all budget assistance.
• The Farm Household Allowance provides �nancial assistance to those experiencing �nancial hardship to support measures to improve their long-term situation. This also includes concessional loans.
• The Manufacturing Transition Program provides �nance for individual businesses moving into different areas of production.
• Tasmanian Freight Equalisation Scheme aims to reduce the transport cost disadvantage for businesses oper-ating in that state.
UNCORRECTED The general tariff rate on most manufactured items was cut from 36 per cent in 1968–69
UNCORRECTED The general tariff rate on most manufactured items was cut from 36 per cent in 1968–69 to only around 5 per cent from 1995–96 onwards (where the tariff level has since remained).
UNCORRECTED to only around 5 per cent from 1995–96 onwards (where the tariff level has since remained). Tariffs applied to special industries like agriculture, TC&F (textiles, clothing, and foot
UNCORRECTED Tariffs applied to special industries like agriculture, TC&F (textiles, clothing, and foot
wear), kitchen whitegoods and passenger cars have all come down at varying rates. These industries initially
UNCORRECTED wear), kitchen whitegoods and passenger cars have all come down at varying rates. These industries initially enjoyed more protection and cutting them too quickly to 5 per cent would have meant certain collapse.
UNCORRECTED enjoyed more protection and cutting them too quickly to 5 per cent would have meant certain collapse. From 2010, rates on cars came down to 5 per cent and TC&F to 10 per cent, while in 2015 most tariffs for
UNCORRECTED From 2010, rates on cars came down to 5 per cent and TC&F to 10 per cent, while in 2015 most tariffs for TC&F were reduced to 5 per cent.
UNCORRECTED TC&F were reduced to 5 per cent.
Reduced net subsidies and other assistance to local producers
UNCORRECTED
Reduced net subsidies and other assistance to local producersare government cash payments made to local producers and industries designed to help them
UNCORRECTED
are government cash payments made to local producers and industries designed to help them cover some of their production costs. In so doing, they can grow local industry and may help businesses
UNCORRECTED
cover some of their production costs. In so doing, they can grow local industry and may help businesses compete internationally. Subsidies or industry assistance can come in many forms but most are normally
UNCORRECTED
compete internationally. Subsidies or industry assistance can come in many forms but most are normally
UNCORRECTED
�nanced through the government’s annual budget outlays. After a peak of $25 billion a year in 1970, overall
UNCORRECTED
�nanced through the government’s annual budget outlays. After a peak of $25 billion a year in 1970, overall and budget assistance were generally reduced to roughly $9 billion by 2015. Lower sub
UNCORRECTED
and budget assistance were generally reduced to roughly $9 billion by 2015. Lower subsidies are justi�ed on the grounds that some subsidies damage ef�ciency in resource allocation and create
UNCORRECTED
sidies are justi�ed on the grounds that some subsidies damage ef�ciency in resource allocation and create costs that reduce overall living standards. Indeed, in times past, some Australian industries had become
UNCORRECTED
costs that reduce overall living standards. Indeed, in times past, some Australian industries had become
UNCORRECTED
dependent on government protective handouts. They had not restructured their production to become inter
UNCORRECTED
dependent on government protective handouts. They had not restructured their production to become internationally competitive.UNCORRECTED
nationally competitive.UNCORRECTED
Nevertheless, today, we still have some industry assistance in cases where there is market failure and various UNCORRECTED
Nevertheless, today, we still have some industry assistance in cases where there is market failure and various
PAGE
PAGE Changes in tariff protection of Australian industry, 1968–69 to 2015–16
PAGE Changes in tariff protection of Australian industry, 1968–69 to 2015–16
Data derived from many sources including AGPS; Industry Commission; 2002 Trade Policy Review for Australia; Productivity
PAGE Data derived from many sources including AGPS; Industry Commission; 2002 Trade Policy Review for Australia; Productivity
Commission, Trade and Assistance Review 2015; DFAT; Budget Review 2006–07; and budget papers 2008–09 to 2016–17.
PAGE Commission, Trade and Assistance Review 2015; DFAT; Budget Review 2006–07; and budget papers 2008–09 to 2016–17.
Notice the following trends in tariff rates shown in �gure 3.24:PAGE Notice the following trends in tariff rates shown in �gure 3.24:
The general tariff rate on most manufactured items was cut from 36 per cent in 1968–69 PAGE
The general tariff rate on most manufactured items was cut from 36 per cent in 1968–69
PROOFS

180 Economics Down Under 2
c03AustraliaAndTheWorldEconomy 180 29 August 2016 1:07 PM
• The Automotive Transformation Scheme provided help that was conditional upon car companies under-taking investment to upgrade plant, equipment and technology. Despite the announced exit of local car makers Toyota, Ford and Holden by 2017, it was announced in 2015 that this scheme will be retained to help �rms in the automotive supply chain diversify and develop new markets.If applied carefully and in moderation, there is sometimes a case for the limited use of subsidies. They can act as a
microeconomic, aggregate supply-side measure that grows productive capacity and our international competitiveness.
Abolition of import quotas and licencesImport quotas are designed to restrict the supply or quantity of speci�c types of imports allowed into the country. They act to protect local businesses and limit foreign competition. In order to achieve a stated volume target, prospective importers must obtain a licence that gives them permission to bring in a certain maximum number of articles of a particular description.
Quotas were commonplace in Australia during the 1970s and early 1980s, especially on cars, textiles, foot-wear and clothing. However, with the adoption of trade liberalisation, these were progressively abolished. The last quotas, applying to cheese, were terminated in 2000–01. Clearly the government believes that, in the long term, their removal will increase ef�ciency in resource allocation, boost productive capacity and sustainable economic growth, slow cost in�ation, improve international competitiveness and, ultimately, strengthen our living standards.
The increased role of free trade agreementsAustralia has membership of various multinational trading groups (involving many countries) like the World Trade Organization (WTO). Through the Doha rounds of trade negotiations with the WTO (so named because negotiations originally took place in Doha, the capital of Qatar), Australia has pushed hard for general reduc-tions in global tariffs and the abolition of subsidies, along with increased access to agricultural, manufacturing and services markets internationally. Indeed, Australia was instrumental in setting up the Cairns group of fair agricultural traders bent on eliminating the agricultural subsidies commonly found in Europe, Japan and the United States. Despite these efforts, progress has been slow due to signi�cant opposition from interest groups.
Given this slow pace of multilateral trade reform, Australia has increasingly negotiated bilateral free trade agreements (FTAs) with two or more individual countries. For example, by early 2016, we had ten FTAs: • Australia–New Zealand FTA (also known as Closer Economic Relations) commenced in 1983 • Australia–Singapore FTA in 2005 • Australia–Thailand FTA in 2005 • Australia–United States FTA in 2005 • Australia–Chile FTA in 2007 • ASEAN–Australia–New Zealand FTA in 2009 • Malaysia–Australia FTA in 2012 • Korea–Australia FTA in 2014 • Australia–Japan FTA in 2014 • China–Australia FTA in 2015.
In addition, negotiations are well underway for striking new bilateral FTAs with India and Indonesia, along with an Australia–Europe FTA. Furthermore, in October 2015, Australia was one of 12 countries (United States, Japan, New Zealand, Canada, Mexico, Brunei, Chile, Malaysia, Peru, Singapore and Vietnam) to sign the massive Trans-Paci�c Partnership Agreement (TPP) covering 40 per cent of the global economy and elim-inating 98 per cent of tariffs on our agricultural exports. However, this agreement still needs to be rati�ed by the Australian Parliament later in 2016 and by those of other signatories.
Essentially, FTAs involve the removal of industry protection. This includes cutting tariff rates applied on trade between member countries, increasing access to services and easing restrictions on foreign investment. In addition to exposing local �rms to more intense foreign competition and forcing them to become more cost ef�cient and improve their international competitiveness, FTAs help Australian producers gain access to potentially huge export markets abroad. They can allow our businesses to expand GDP, gain economies of large scale production, grow Australia’s share of export sales and incomes, improve living standards and reduce our CAD.
Impacts on other government policiesTrade liberalisation is regarded by economists as an important government supply-side microeconomic reform policy designed to improve ef�ciency in the use of resources, and grow Australia’s international competitive-ness and living standards. Additionally, as a direct consequence of adopting trade liberalisation and openness, other productivity-promoting government reform policies have also had to be undertaken. More speci�cally, these included the following: • reform of the labour market • development of a national competition policy • taxation reform, including the lowering of rates and changes to the tax mix.
These measures also sought to strengthen Australia’s international competitiveness, domestic economic stability and general wellbeing. We will see that although trade liberalisation can sometimes have negative effects in some industries, particularly in the short term, the overall bene�ts normally become more apparent in the longer term.
UNCORRECTED in 2009
UNCORRECTED in 2009
UNCORRECTED in 2015.
UNCORRECTED in 2015.
In addition, negotiations are well underway for striking new bilateral FTAs with India and Indonesia, along
UNCORRECTED
In addition, negotiations are well underway for striking new bilateral FTAs with India and Indonesia, along with an Australia–Europe FTA. Furthermore, in October 2015, Australia was one of 12 countries (United
UNCORRECTED
with an Australia–Europe FTA. Furthermore, in October 2015, Australia was one of 12 countries (United States, Japan, New Zealand, Canada, Mexico, Brunei, Chile, Malaysia, Peru, Singapore and Vietnam) to sign
UNCORRECTED
States, Japan, New Zealand, Canada, Mexico, Brunei, Chile, Malaysia, Peru, Singapore and Vietnam) to sign the massive Trans-Paci�c Partnership Agreement (TPP) covering 40 per cent of the global economy and elim
UNCORRECTED
the massive Trans-Paci�c Partnership Agreement (TPP) covering 40 per cent of the global economy and eliminating 98 per cent of tariffs on our agricultural exports. However, this agreement still needs to be rati�ed by
UNCORRECTED
inating 98 per cent of tariffs on our agricultural exports. However, this agreement still needs to be rati�ed by the Australian Parliament later in 2016 and by those of other signatories.
UNCORRECTED
the Australian Parliament later in 2016 and by those of other signatories.Essentially, FTAs involve the removal of industry protection. This includes cutting tariff rates applied on trade
UNCORRECTED
Essentially, FTAs involve the removal of industry protection. This includes cutting tariff rates applied on trade
UNCORRECTED
between member countries, increasing access to services and easing restrictions on foreign investment. In addition
UNCORRECTED
between member countries, increasing access to services and easing restrictions on foreign investment. In addition to exposing local �rms to more intense foreign competition and forcing them to become more cost ef�cient and
UNCORRECTED
to exposing local �rms to more intense foreign competition and forcing them to become more cost ef�cient and improve their international competitiveness, FTAs help Australian producers gain access to potentially huge export
UNCORRECTED
improve their international competitiveness, FTAs help Australian producers gain access to potentially huge export markets abroad. They can allow our businesses to expand GDP, gain economies of large scale production, grow UNCORRECTED
markets abroad. They can allow our businesses to expand GDP, gain economies of large scale production, grow AUNCORRECTED
Australia’s share of export sales and incomes, improve living standards and reduce our CAD.UNCORRECTED
ustralia’s share of export sales and incomes, improve living standards and reduce our CAD.
PAGE agricultural traders bent on eliminating the agricultural subsidies commonly found in Europe, Japan and the
PAGE agricultural traders bent on eliminating the agricultural subsidies commonly found in Europe, Japan and the United States. Despite these efforts, progress has been slow due to signi�cant opposition from interest groups.
PAGE United States. Despite these efforts, progress has been slow due to signi�cant opposition from interest groups.Given this slow pace of multilateral trade reform, Australia has increasingly negotiated
PAGE Given this slow pace of multilateral trade reform, Australia has increasingly negotiated
with two or more individual countries. For example, by early 2016, we had ten FTAs:
PAGE with two or more individual countries. For example, by early 2016, we had ten FTAs:
(also known as Closer Economic Relations) commenced in 1983
PAGE (also known as Closer Economic Relations) commenced in 1983
PROOFSwear and clothing. However, with the adoption of trade liberalisation, these were progressively abolished. The last
PROOFSwear and clothing. However, with the adoption of trade liberalisation, these were progressively abolished. The last quotas, applying to cheese, were terminated in 2000–01. Clearly the government believes that, in the long term,
PROOFSquotas, applying to cheese, were terminated in 2000–01. Clearly the government believes that, in the long term, their removal will increase ef�ciency in resource allocation, boost productive capacity and sustainable economic
PROOFStheir removal will increase ef�ciency in resource allocation, boost productive capacity and sustainable economic growth, slow cost in�ation, improve international competitiveness and, ultimately, strengthen our living standards.
PROOFSgrowth, slow cost in�ation, improve international competitiveness and, ultimately, strengthen our living standards.
(involving many countries) like the World
PROOFS (involving many countries) like the World
of trade negotiations with the WTO (so named because
PROOFS of trade negotiations with the WTO (so named because
negotiations originally took place in Doha, the capital of Qatar), Australia has pushed hard for general reduc
PROOFSnegotiations originally took place in Doha, the capital of Qatar), Australia has pushed hard for general reductions in global tariffs and the abolition of subsidies, along with increased access to agricultural, manufacturing
PROOFS
tions in global tariffs and the abolition of subsidies, along with increased access to agricultural, manufacturing and services markets internationally. Indeed, Australia was instrumental in setting up the Cairns group of fair PROOFS
and services markets internationally. Indeed, Australia was instrumental in setting up the Cairns group of fair agricultural traders bent on eliminating the agricultural subsidies commonly found in Europe, Japan and the PROOFS
agricultural traders bent on eliminating the agricultural subsidies commonly found in Europe, Japan and the

TOPIC 3 Australia and the world economy 181
c03AustraliaAndTheWorldEconomy 181 29 August 2016 1:07 PM
FIGURE 3.25 ‘According to critics of agricultural protectionism, consumers and governments in rich countries have paid $350 billion per year supporting agriculture — enough to �y their 41 million dairy cows �rst class around the world one and a half times.’
Source: WTO.
Effects of trade liberalisation on Australia’s international competitivenessAs a policy, trade liberalisation has been under way for some decades now, and is one of a number of government measures designed to strengthen Australia’s international competitiveness and living standards. Remember that international competitiveness gives �rms the ability to expand their share of global sales and incomes against foreign rivals by selling better quality goods and services at relatively lower prices without government support. Govern-ment measures such as lowering tariffs, reducing subsidies, abolishing import quotas and negotiating FTAs should: • increase competition for local businesses from imports of goods and services, forcing them to lower prices
and improve quality and service • encourage Australian �rms to specialise their production in areas of comparative cost advantage, minimising
opportunity costs and allowing them to sell their products more competitively at a lower price • allow local �rms to gain economies of large-scale production and an ability to sell exports at a lower, more
competitive price through larger production runs made possible by selling in massive export markets • force �rms to restructure their operations, lift ef�ciency and cut their production costs, thereby allowing
them to sell at a lower, more competitive price • allow local �rms to gain access to the latest technology at the lowest cost, increasing technical ef�ciency
and helping them to compete more effectively • encourage �rms to think creatively, provide better service and meet customers changing needs, thus helping
to strengthen our international competitiveness.While it is dif�cult to precisely measure the effects of trade liberalisation and to know what would have
occurred in its absence, we do have some research that compares changes in Australia’s international compet-itiveness. For instance, �gure 3.26 uses data comparing Australia’s rank out of 60 countries (shown in part a), and looks at scores on speci�c aspects of competitiveness that were used to compile this data (in part b).
0
5
18171615
9
577
12
6
10
15
20
25
20
05
–06
20
06
–07
20
07
–08
20
08
–09
20
09
–10
20
10
–11
20
11
–12
20
12
–13
20
13
–14
20
14
–15
20
17
–18
20
16
–17
20
15
–16
Aus
tral
ia’s
wor
ld r
anki
ng f
orco
mpe
titi
vene
ss (
from
hig
hest
to lo
wes
t ou
t of
60
nat
ions
)
Part (a) Change in Australia’s international competitiveness ranking (out of 60 countries,the lower the better)
Year
FIGURE 3.26 Changes in Australia’s international competitiveness ranking and perceived attractiveness or strengths (continued)
UNCORRECTED competitive price through larger production runs made possible by selling in massive export markets
UNCORRECTED competitive price through larger production runs made possible by selling in massive export marketsforce �rms to restructure their operations, lift ef�cienc
UNCORRECTED force �rms to restructure their operations, lift ef�ciency and cut their production costs, thereby allowing
UNCORRECTED y and cut their production costs, thereby allowing them to sell at a lower, more competitive price
UNCORRECTED them to sell at a lower, more competitive price
w local �rms to gain access to the latest technology at the lowest cost, increasing technical ef�ciency
UNCORRECTED w local �rms to gain access to the latest technology at the lowest cost, increasing technical ef�ciency
and helping them to compete more effectively
UNCORRECTED and helping them to compete more effectively
vely, provide better service and meet customers changing needs, thus helping
UNCORRECTED vely, provide better service and meet customers changing needs, thus helping
to strengthen our international competitiveness.
UNCORRECTED to strengthen our international competitiveness.While it is dif�cult to precisely measure the effects of trade liberalisation and to know what would have
UNCORRECTED
While it is dif�cult to precisely measure the effects of trade liberalisation and to know what would have occurred in its absence, we do have some research that compares changes in Australia’s international compet
UNCORRECTED
occurred in its absence, we do have some research that compares changes in Australia’s international competitiveness. For instance, �gure 3.26 uses data comparing Australia’s rank out of 60 countries (shown in part a),
UNCORRECTED
itiveness. For instance, �gure 3.26 uses data comparing Australia’s rank out of 60 countries (shown in part a), and looks at scores on speci�c aspects of competitiveness that were used to compile this data (in part b).
UNCORRECTED
and looks at scores on speci�c aspects of competitiveness that were used to compile this data (in part b).
UNCORRECTED
UNCORRECTED
UNCORRECTED
UNCORRECTED
UNCORRECTED
UNCORRECTED
UNCORRECTED
UNCORRECTED
UNCORRECTED
UNCORRECTED
15UNCORRECTED
15
20
UNCORRECTED
20
UNCORRECTED
com
peti
tive
ness
(fr
om h
ighe
st
UNCORRECTED
com
peti
tive
ness
(fr
om h
ighe
stto
low
est
out
of 6
0 n
atio
ns)
UNCORRECTED
to lo
wes
t ou
t of
60
nat
ions
)
Part (a) Change in Australia’s international competitiveness ranking (out of 60 countries,
UNCORRECTED
Part (a) Change in Australia’s international competitiveness ranking (out of 60 countries,
PAGE rivals by selling better quality goods and services at relatively lower prices without government support. Govern
PAGE rivals by selling better quality goods and services at relatively lower prices without government support. Government measures such as lowering tariffs, reducing subsidies, abolishing import quotas and negotiating FTAs should:
PAGE ment measures such as lowering tariffs, reducing subsidies, abolishing import quotas and negotiating FTAs should:usinesses from imports of goods and services, forcing them to lower prices
PAGE usinesses from imports of goods and services, forcing them to lower prices
Australian �rms to specialise their production in areas of comparative cost advantage, minimising
PAGE Australian �rms to specialise their production in areas of comparative cost advantage, minimising
opportunity costs and allowing them to sell their products more competitively at a lower price
PAGE opportunity costs and allowing them to sell their products more competitively at a lower price
w local �rms to gain economies of large-scale production and an ability to sell exports at a lower, more PAGE w local �rms to gain economies of large-scale production and an ability to sell exports at a lower, more
competitive price through larger production runs made possible by selling in massive export marketsPAGE
competitive price through larger production runs made possible by selling in massive export markets
PROOFS‘According to critics of agricultural protectionism, consumers and governments in rich countries have
PROOFS‘According to critics of agricultural protectionism, consumers and governments in rich countries have paid $350 billion per year supporting agriculture — enough to �y their 41 million dairy cows �rst class
PROOFSpaid $350 billion per year supporting agriculture — enough to �y their 41 million dairy cows �rst class
Effects of trade liberalisation on Australia’s international
PROOFSEffects of trade liberalisation on Australia’s international
As a policy, trade liberalisation has been under way for some decades now, and is one of a number of government
PROOFSAs a policy, trade liberalisation has been under way for some decades now, and is one of a number of government measures designed to strengthen Australia’s international competitiveness and living standards. Remember that
PROOFS
measures designed to strengthen Australia’s international competitiveness and living standards. Remember that international competitiveness gives �rms the ability to expand their share of global sales and incomes against foreign PROOFS
international competitiveness gives �rms the ability to expand their share of global sales and incomes against foreign rivals by selling better quality goods and services at relatively lower prices without government support. GovernPROOFS
rivals by selling better quality goods and services at relatively lower prices without government support. Govern

182 Economics Down Under 2
c03AustraliaAndTheWorldEconomy 182 29 August 2016 1:07 PM
FIGURE 3.26 (continued)
Effective legal environment
Reliable infrastructureAccess to �nancing
Open and positive attitudesPolicy stability & predictabilityBusiness-friendly environment
Dynamism of the economyStrong R&D culture
Competency of governmentEffective labor relationsCompetitive tax regime
Cost competitiveness
Quality of corporate governanceSkilled workforce
High educational level
0% 10% 20% 30% 40%
64.9%64.0%
63.1%56.8%
46.8%36.9%
33.3%33.3%
30.6%13.5%
11.7%11.7%
6.3%3.6%3.6%
50% 60% 70%
Part (b) Australia’s international competitiveness: some indicators of attractiveness
Sources: (a) Data was derived from CEDA, competitiveness reports various years, see http://www.ceda.com.au/research-and-policy/explore-all-ceda-research/surveys/world-competitiveness-yearbook; (b) graph copied from CEDA, Competitiveness Trends Overall, p. 2, http://adminpanel.ceda.com.au/FOLDERS/Service/Files/Documents/26525~Australia.pdf.
From the graph in �gure 3.26 (part a), notice that our relative competitiveness has slipped badly, from a high of 5th place in 2009–10, to a recent low of 18th place in 2014–15. This deterioration is shown by the upward trend line. Of the 15 indicators of competitiveness (shown in part b), the business opinion survey felt that Australia’s attractiveness was generally mediocre and outright poor in some key areas such as the R&D culture, company tax regime and cost competitiveness.
Figure 3.27 sheds additional light on some other factors in�uencing Australia’s costs and competitiveness compared with the United States.
0 200 400 600 800
6. Australia’s rate of company taxas a percentage of the US rate
5. Index of Australia’s GDP perhour worked (USA = 100)
4. Australia’s hourly minimum wageas a percentage of the US wage
2. Average number of working days lostper 100000 employees in Australia
as a percentage of the US average
3. Approximate cost of a kilowatt hour of electricity in Australia as a percentage of the US cost
1. Australia’s of�cial interest ratesas a percentage of the US rate
Australian rate as a percentage of the US rate
Indi
cato
r of
com
peti
tive
ness 143
134
132
83
75
700
FIGURE 3.27 Some factors affecting Australia’s international competitiveness compared with the United States
Notes: (a) Cost is a rough guide as special power rates apply in some countries for businesses, and rates also depend on season and quantity purchased. (b) Most data is for 2012 or 2013.
Sources: Data mostly 2013–14 or more recent. Information has been derived from many sources including the following: indicator 1 derived from RBA Statistics; indicator 2 selected from NationMaster, Labour, Strikes, Countries compared, www.nationmaster. com/country-info/stats/Labor/Strikes; indicator 3 derived from Wikipedia, the free encyclopaedia, Electricity Pricing, en.wikipedia.org/wiki/Electricity_pricing; indicator 4 derived from Wikipedia, the free encyclopaedia, countries selected from a table, en.wikipedia.org/wiki/List_of_minimum_ wages_by_country; indicator 5 derived from The Conference Board, Total Economy Database, Summary statistics 1997–2014, Summary tables; indicator 6 derived from KPMG for corporate tax rate comparisons, 2015.
UNCORRECTED Figure 3.27 sheds additional light on some other factors in�uencing Australia’s costs and competitiveness
UNCORRECTED Figure 3.27 sheds additional light on some other factors in�uencing Australia’s costs and competitiveness
UNCORRECTED
UNCORRECTED
5. Index of Australia’s GDP per
UNCORRECTED
5. Index of Australia’s GDP per
4. Australia’s hourly minimum wage
UNCORRECTED
4. Australia’s hourly minimum wageas a percentage of the US wage
UNCORRECTED
as a percentage of the US wage
2. Average number of working days lost
UNCORRECTED 2. Average number of working days lost
per 100000 employees in Australia
UNCORRECTED
per 100000 employees in Australiaas a percentage of the US average
UNCORRECTED
as a percentage of the US average
3. Approximate cost of a kilowatt
UNCORRECTED
3. Approximate cost of a kilowatt hour of electricity in Australia
UNCORRECTED
hour of electricity in Australia as a percentage of the US cost
UNCORRECTED
as a percentage of the US cost
1. Australia’s of�cial interest rates
UNCORRECTED 1. Australia’s of�cial interest rates
as a percentage of the US rate
UNCORRECTED as a percentage of the US rate
Indi
cato
r of
com
peti
tive
ness
UNCORRECTED
Indi
cato
r of
com
peti
tive
ness
UNCORRECTED
UNCORRECTED
UNCORRECTED
UNCORRECTED
UNCORRECTED
UNCORRECTED PAGE http://adminpanel.ceda.com.au/FOLDERS/Service/Files/Documents/26525~Australia.pdf.
PAGE http://adminpanel.ceda.com.au/FOLDERS/Service/Files/Documents/26525~Australia.pdf.
From the graph in �gure 3.26 (part a), notice that our relative competitiveness has slipped badly, from a
PAGE From the graph in �gure 3.26 (part a), notice that our relative competitiveness has slipped badly, from a
high of 5th place in 2009–10, to a recent low of 18th place in 2014–15. This deterioration is shown by the
PAGE high of 5th place in 2009–10, to a recent low of 18th place in 2014–15. This deterioration is shown by the upward trend line. Of the 15 indicators of competitiveness (shown in part b), the business opinion survey felt
PAGE upward trend line. Of the 15 indicators of competitiveness (shown in part b), the business opinion survey felt
s attractiveness was generally mediocre and outright poor in some key areas such as the R&D
PAGE s attractiveness was generally mediocre and outright poor in some key areas such as the R&D
culture, company tax regime and cost competitiveness. PAGE culture, company tax regime and cost competitiveness.
Figure 3.27 sheds additional light on some other factors in�uencing Australia’s costs and competitiveness PAGE
Figure 3.27 sheds additional light on some other factors in�uencing Australia’s costs and competitiveness
PROOFS
PROOFS
PROOFS
PROOFS
PROOFS
PROOFS
PROOFS
PROOFS
PROOFS50% 60% 70%
PROOFS50% 60% 70%
(a) Data was derived from CEDA, competitiveness reports various years, see http://www.ceda.com.au/research-and-policy/PROOFS
(a) Data was derived from CEDA, competitiveness reports various years, see http://www.ceda.com.au/research-and-policy/explore-all-ceda-research/surveys/world-competitiveness-yearbook; (b) graph copied from CEDA, Competitiveness Trends Overall, p. 2, PROOFS
explore-all-ceda-research/surveys/world-competitiveness-yearbook; (b) graph copied from CEDA, Competitiveness Trends Overall, p. 2,

TOPIC 3 Australia and the world economy 183
c03AustraliaAndTheWorldEconomy 183 29 August 2016 1:07 PM
With the exception of our lower rate of company tax, the data show that Australia has a competitive dis-advantage with the United States in areas including the cost of borrowing, working days lost through industrial action like strikes, electricity charges, minimum hourly pay rates and labour productivity.
What these data also show is that Australia’s international competitiveness appears to have declined against that of some other countries in recent years. However, it is probably fair to say that without the progress made through liberalising international trade, our situation would almost certainly have been even worse. It is also likely that other countries have been more successful with measures designed to strengthen international competitiveness.
Effects of trade liberalisation on domestic macroeconomic goalsTrade liberalisation (as an important microeconomic reform policy), has helped to lift allocative, technical, dynamic and even intertemporal ef�ciency, grow Australia’s productive capacity and increase AS. As a result, it has impacted on the government’s three key domestic macroeconomic goals of low in�ation, strong and sustainable economic growth, and full employment.
Effect of trade liberalisation on the achievement of low in�ationOne important domestic macroeconomic objective of the RBA and Australian government is the goal of low in�ation (keeping the average rise in price around 2–3 per cent per year over the business cycle). Trade liberalisation has helped to slow Australia’s in�ation rate (especially cost in�ation). This might have happened in several ways: • Trade liberalisation has caused resources to move into their most ef�cient uses and out of areas of inef-
�ciency and high costs. There has been an increase in allocative ef�ciency, slowing in�ation. • Trade liberalisation (especially FTAs) has grown our access to larger markets abroad, allowing local �rms to
gain economies of large-scale production and cutting �xed costs per unit. • Trade liberalisation has allowed local �rms to have cheaper input costs for equipment and raw materials accessed
from overseas. Indeed, the Productivity Commission recently estimated that, despite reductions, tariffs add over $7 billion annually to costs for manufacturing and service businesses. Reducing tariffs should therefore slow in�ation.
• Trade liberalisation has forced local �rms to restructure their operations more ef�ciently, cut production costs and apply world’s best practice. This has increased dynamic ef�ciency and helped to slow in�ationary pressures.Figure 3.28 shows that since signi�cant trade liberalisation from the early 1990s, Australia’s average in�ation
rate has slowed dramatically to just 2.7 per cent over the last 25 years, compared with 9.3 per cent during the previous 20 years. While trade liberalisation is not the only cause (there were also other microeconomic or aggregate supply-side government policies that helped to slow in�ation, such as the deregulation of the labour market), it is likely to have been an important contributing factor. In other words, cutting tariffs, import quotas and subsidies, as well as and signing FTAs, has probably helped to promote the goal of low in�ation. In turn, this has helped to increase the real purchasing power of incomes and raise material living standards.
10 9.3
2.7
12
8
Ann
ual a
vera
ge in
�ati
on r
ate
(per
cent
age)
6
4
2
Average annual in�ation rate (%)before signi�cant trade liberalisation
(1970–71/1989–90)
Average annual in�ation rate (%)since signi�cant globalisation
(1990–91/2015–16)
0
Period of time
FIGURE 3.28 The likely link between Australia’s trade liberalisation and our lower in�ation
Sources: Data derived from RBA Statistics, Occasional Paper 8A; ABS 5206.0 (Table 34).
Effect of trade liberalisation on the achievement of strong and sustainable economic growthA second core macroeconomic objective of the federal government is to promote the goal of strong and sus-tainable economic growth. This is de�ned as the fastest average rate of growth in real GDP, around 3 per cent per year or a little more, that is consistent with achieving other economic and environmental goals.
UNCORRECTED rate has slowed dramatically to just 2.7 per cent over the last 25 years, compared with 9.3 per cent during the
UNCORRECTED rate has slowed dramatically to just 2.7 per cent over the last 25 years, compared with 9.3 per cent during the previous 20 years. While trade liberalisation is not the only cause (there were also other microeconomic or
UNCORRECTED previous 20 years. While trade liberalisation is not the only cause (there were also other microeconomic or aggregate supply-side government policies that helped to slow in�ation, such as the deregulation of the labour
UNCORRECTED aggregate supply-side government policies that helped to slow in�ation, such as the deregulation of the labour market), it is likely to have been an important contributing factor. In other words, cutting tariffs, import quotas
UNCORRECTED market), it is likely to have been an important contributing factor. In other words, cutting tariffs, import quotas and subsidies, as well as and signing FTAs, has probably helped to promote the goal of low in�ation. In turn,
UNCORRECTED and subsidies, as well as and signing FTAs, has probably helped to promote the goal of low in�ation. In turn, this has helped to increase the real purchasing power of incomes and raise material living standards.
UNCORRECTED this has helped to increase the real purchasing power of incomes and raise material living standards.
UNCORRECTED
UNCORRECTED
9.3
UNCORRECTED
9.3
UNCORRECTED
UNCORRECTED
UNCORRECTED
UNCORRECTED
UNCORRECTED
Ann
ual a
vera
ge in
�ati
on r
ate
UNCORRECTED
Ann
ual a
vera
ge in
�ati
on r
ate
(per
cent
age)
UNCORRECTED
(per
cent
age)
UNCORRECTED
6
UNCORRECTED
6
UNCORRECTED
4
UNCORRECTED
4
2
UNCORRECTED
2
UNCORRECTED
UNCORRECTED
UNCORRECTED
UNCORRECTED
UNCORRECTED
UNCORRECTED
UNCORRECTED PAGE rade liberalisation has allowed local �rms to have cheaper input costs for equipment and raw materials accessed
PAGE rade liberalisation has allowed local �rms to have cheaper input costs for equipment and raw materials accessed from overseas. Indeed, the Productivity Commission recently estimated that, despite reductions, tariffs add over
PAGE from overseas. Indeed, the Productivity Commission recently estimated that, despite reductions, tariffs add over $7 billion annually to costs for manufacturing and service businesses. Reducing tariffs should therefore slow
PAGE $7 billion annually to costs for manufacturing and service businesses. Reducing tariffs should therefore slow
rade liberalisation has forced local �rms to restructure their operations more ef�ciently, cut production costs
PAGE rade liberalisation has forced local �rms to restructure their operations more ef�ciently, cut production costs
and apply world’s best practice. This has increased dynamic ef�ciency and helped to slow in�ationary pressures.
PAGE and apply world’s best practice. This has increased dynamic ef�ciency and helped to slow in�ationary pressures.Figure 3.28 shows that since signi�cant trade liberalisation from the early 1990s, Australia’s average in�ation PAGE Figure 3.28 shows that since signi�cant trade liberalisation from the early 1990s, Australia’s average in�ation
rate has slowed dramatically to just 2.7 per cent over the last 25 years, compared with 9.3 per cent during the PAGE rate has slowed dramatically to just 2.7 per cent over the last 25 years, compared with 9.3 per cent during the previous 20 years. While trade liberalisation is not the only cause (there were also other microeconomic or PAGE
previous 20 years. While trade liberalisation is not the only cause (there were also other microeconomic or
PROOFSgoal of low
PROOFSgoal of low (keeping the average rise in price around 2–3 per cent per year over the business cycle). Trade liberalisation
PROOFS (keeping the average rise in price around 2–3 per cent per year over the business cycle). Trade liberalisation
has helped to slow Australia’s in�ation rate (especially cost in�ation). This might have happened in several ways:
PROOFShas helped to slow Australia’s in�ation rate (especially cost in�ation). This might have happened in several ways:
rade liberalisation has caused resources to move into their most ef�cient uses and out of areas of inef
PROOFSrade liberalisation has caused resources to move into their most ef�cient uses and out of areas of inef
�ciency and high costs. There has been an increase in allocative ef�ciency, slowing in�ation.
PROOFS�ciency and high costs. There has been an increase in allocative ef�ciency, slowing in�ation.
rade liberalisation (especially FTAs) has grown our access to larger markets abroad, allowing local �rms to
PROOFSrade liberalisation (especially FTAs) has grown our access to larger markets abroad, allowing local �rms to
rade liberalisation has allowed local �rms to have cheaper input costs for equipment and raw materials accessed PROOFS
rade liberalisation has allowed local �rms to have cheaper input costs for equipment and raw materials accessed from overseas. Indeed, the Productivity Commission recently estimated that, despite reductions, tariffs add over PROOFS
from overseas. Indeed, the Productivity Commission recently estimated that, despite reductions, tariffs add over

184 Economics Down Under 2
c03AustraliaAndTheWorldEconomy 184 29 August 2016 1:07 PM
Trade liberalisation might have helped to strengthen the economically sustainable rate of growth in several ways, particularly in the medium to longer term: • Trade liberalisation leads to a greater specialisation and a more ef�cient allocation of resources involving
lower opportunity costs. This means there is more output gained from the same or fewer inputs, thereby growing Australia’s production possibility frontier and productive capacity. This increases the sustainable rate of GDP growth.
• With trade liberalisation, local businesses need to reorganise their operations ef�ciently to allow them to survive more intensive competition from imports. This allows for an increase in productive capacity and rate of economic growth.
• Trade liberalisation has allowed our local �rms to access equipment, materials and technology at a lower cost, creating the more favourable aggregate supply conditions needed to grow Australia’s GDP at a faster rate.
• Trade liberalisation has grown the size of Australia’s export markets, turbocharging sales and encouraging �rms to boost production levels and GDP.By increasing the growth rate of GDP, trade liberalisation helps to increase national incomes faster.
This helps to lift average real disposable income and consumption per head, and hence material living standards.
A 2009 report concluded that trade liberalisation has delivered a rise in average family incomes over two decades of around $3900 per family per year by adding 1.8 per cent to real GDP (Bene�ts of Trade and Trade Liberalisation by DFAT and Centre for International Economics). Again, in the medium to long term, some of the rise in average real disposable incomes per head might be attributable to the Australian government’s acceleration of trade liberalisation from the early 1990s. Figure 3.29 seems to con�rm that there has been a faster growth in real disposable income of 1.8 per cent per year on average in the 25 years to 2014–15 against 1.4 per cent growth in the 20 years to 1990, prior to signi�cant liberalisation. However, this could be a coinci-dence rather than proof of a causal relationship.
2.5
1.4
1.82
Ann
ual a
vera
ge p
erce
ntag
ech
ange 1.5
1
0.5
Average annual growth rate in realnet national disposable income perhead (%) before signi�cant trade
liberalisation (1970–71/1989–90)
Average annual growth rate in realnet disposable income per head (%)
since signi�cant globalisation(1990–91/2014–15)
Period of time
0
FIGURE 3.29 The possible link between Australia’s trade liberalisation and our faster growth in real net disposable income per head
Sources: Data derived from RBA Statistics, Occasional Paper 8A; ABS 5206.0 (Table 34).
Despite the bene�ts of economic growth in the medium to longer term, in the short to medium term, trade liberalisation may actually slow economic growth. The main reason is that some local �rms, unable to cut costs quickly enough and restructure, may be forced to close. Here we might think of recent examples in the car industry, TC&F and low end manufacturing. This would mean the loss of productive capacity, slower econ-omic growth and weaker living standards.
Effect of trade liberalisation on the achievement of full employmentThe goal of full employment is a third domestic macroeconomic economic objective of the federal government. This is de�ned as the lowest rate of unemployment, around 5 per cent of the labour force, that does not accel-erate in�ation.
Nearly 25 per cent of all Australian jobs are currently generated through international trade. The effect of trade liberalisation on Australia’s unemployment rate depends partly on whether we consider the short or long term period of time. As a general rule, in the long run, it seems that trade liberalisation has created more jobs and employment, albeit sometimes in different industries, whereas in the shorter term, the effects can be severe for industries that cannot become internationally competitive fast enough.
UNCORRECTED
UNCORRECTED
UNCORRECTED
UNCORRECTED
UNCORRECTED
UNCORRECTED
UNCORRECTED Average annual growth rate in real
UNCORRECTED Average annual growth rate in realnet national disposable income per
UNCORRECTED
net national disposable income perhead (%) before signi�cant trade
UNCORRECTED
head (%) before signi�cant tradeliberalisation (1970–71/1989–90)
UNCORRECTED
liberalisation (1970–71/1989–90)
UNCORRECTED
UNCORRECTED
UNCORRECTED
3.29
UNCORRECTED
3.29 The possible link between Australia’s trade liberalisation and our faster growth in real net disposable
UNCORRECTED
The possible link between Australia’s trade liberalisation and our faster growth in real net disposable income per head
UNCORRECTED
income per head
Sources:
UNCORRECTED
Sources: Data derived from RBA Statistics, Occasional Paper 8A; ABS 5206.0 (Table 34).
UNCORRECTED
Data derived from RBA Statistics, Occasional Paper 8A; ABS 5206.0 (Table 34).
Despite the bene�ts of economic growth in the medium to longer term, in the
UNCORRECTED
Despite the bene�ts of economic growth in the medium to longer term, in the liberalisation may actually slow economic growth. The main reason is that some local �rms, unable to cut UNCORRECTED
liberalisation may actually slow economic growth. The main reason is that some local �rms, unable to cut UNCORRECTED
costs quickly enough and restructure, may be forced to close. Here we might think of recent examples in the UNCORRECTED
costs quickly enough and restructure, may be forced to close. Here we might think of recent examples in the
PAGE 1.4 per cent growth in the 20 years to 1990, prior to signi�cant liberalisation. However, this could be a coinci
PAGE 1.4 per cent growth in the 20 years to 1990, prior to signi�cant liberalisation. However, this could be a coinci
PAGE
PAGE
PAGE PROOFS
rade liberalisation has grown the size of Australia’s export markets, turbocharging sales and encouraging
PROOFSrade liberalisation has grown the size of Australia’s export markets, turbocharging sales and encouraging
By increasing the growth rate of GDP, trade liberalisation helps to increase national incomes faster.
PROOFSBy increasing the growth rate of GDP, trade liberalisation helps to increase national incomes faster. This helps to lift average real disposable income and consumption per head, and hence material living
PROOFSThis helps to lift average real disposable income and consumption per head, and hence material living
A 2009 report concluded that trade liberalisation has delivered a rise in average family incomes over two
PROOFSA 2009 report concluded that trade liberalisation has delivered a rise in average family incomes over two
decades of around $3900 per family per year by adding 1.8 per cent to real GDP (
PROOFSdecades of around $3900 per family per year by adding 1.8 per cent to real GDP (Bene�ts of Trade and Trade
PROOFSBene�ts of Trade and Trade
by DFAT and Centre for International Economics). Again, in the medium to long term, some
PROOFS by DFAT and Centre for International Economics). Again, in the medium to long term, some
of the rise in average real disposable incomes per head might be attributable to the Australian government’s
PROOFSof the rise in average real disposable incomes per head might be attributable to the Australian government’s acceleration of trade liberalisation from the early 1990s. Figure 3.29 seems to con�rm that there has been a
PROOFS
acceleration of trade liberalisation from the early 1990s. Figure 3.29 seems to con�rm that there has been a faster growth in real disposable income of 1.8 per cent per year on average in the 25 years to 2014–15 against PROOFS
faster growth in real disposable income of 1.8 per cent per year on average in the 25 years to 2014–15 against 1.4 per cent growth in the 20 years to 1990, prior to signi�cant liberalisation. However, this could be a coinciPROOFS
1.4 per cent growth in the 20 years to 1990, prior to signi�cant liberalisation. However, this could be a coinci

TOPIC 3 Australia and the world economy 185
c03AustraliaAndTheWorldEconomy 185 29 August 2016 1:07 PM
Starting with the longer term, trade liberalisation might have helped to create more jobs and better material and non-material living standards in various ways: • By boosting ef�ciency and slowing domestic in�ation, trade liberalisation may make local businesses more
internationally competitive, enabling them to increase their sales in domestic and foreign markets. This can lead to higher production levels and demand for resources including labour, keeping unemployment lower.
• Trade liberalisation, especially FTAs, create bigger markets abroad, allowing for increased sales and busi-ness expansion. This creates job vacancies and helps lower unemployment.
• Trade liberalisation allows local �rms to reduce their costs of equipment and materials. This is a favourable aggregate supply-side factor that enhances business competitiveness and pro�tability, again reducing busi-ness closures and structural unemployment.
By creating more jobs and lowering unemployment, material living standards and consumption should be higher. In addition, lower unemployment can support better non-material living standards including greater happiness, less crime, improved health outcomes and less family con�ict.
However, having suggested that trade liberalisation should help to promote the goal of full employment, evidence of this appears rather thin. Indeed, average unemployment rates in the years since signi�cant trade liberalisation have tended to be signi�cantly higher (see �gure 3.30). Again, this may not entirely be the result of trade liberalisation measures but it is possible that these and related policies have contributed to the problem.
4.2
7.18
Ann
ual u
nem
ploy
men
tra
te (
perc
enta
ge)
6
4
2
Average unemployment rate (%)before signi�cant trade liberalisation
(1970–71/1989–90)
Average unemployment rate (%)since signi�cant globalisation
(1990–91/2015–16)
Period of time
0
FIGURE 3.30 The possible link between Australia’s trade liberalisation and our unemployment rate
Sources: Data derived from ABS 1350.0, 6202.0; RBA Statistics, Occasional Paper 8A (Table 4.3).
In fact, one of the main criticisms of trade liberalisation in Australia and elsewhere, especially in the shorter term, is that it prevents the growth of infant industries, destroys others that are uncompetitive and causes higher levels of structural unemployment as seen in basic manufacturing during recent decades.
Other evidence of the effects of trade liberalisation on domestic economic goalsWe will conclude this section about the effects of trade liberalisation on the domestic economy in both the short and long terms by looking at some recent research. Economic modelling has recently been concluded showing the possible annual impacts of FTAs for the Australian economy predicted for 2016 to 2035. One report looks at the results of Australia’s three FTAs with Northern Asia (with China in 2015, and with Japan and South Korea in 2014). The results are summarised in table 3.2. Notice the expected signi�cant additions to GDP, consumption and employment.
TABLE 3.2The projected economic effects of Australia’s three FTAs with North Asian Economies (Japan, China and South Korea), 2016–35
GDPReal
consumptionReal consumption
per householda Employment
A$m A$m A$ persons
2016 1 036 2 886 312 7 925
2035 2 260 4 630 370 5 434
Net present value 24 362 46 260 4 348
aPer household �gures use ABS projected number of households (series II) in the relevant year (http://www.abs.gov.au/AUSSTATS/[email protected]/allprimarymainfeatures/0AAC8BFAE9DD3241CA2568A90013942A?opendocument)Note: Present value calculations use a discount rate of 5%
Source: CIE, Economic bene�ts of Australia’s North Asian FTAs, 12 June 2015, p. 30, https://dfat.gov.au/about-us/publications/Documents/economic-modelling-of-australias-north-asia-ftas.pdf.
UNCORRECTED
UNCORRECTED Period of time
UNCORRECTED Period of time
UNCORRECTED The possible link between Australia’s trade liberalisation and our unemployment rate
UNCORRECTED The possible link between Australia’s trade liberalisation and our unemployment rate
Data derived from ABS 1350.0, 6202.0; RBA Statistics, Occasional Paper 8A (Table 4.3).
UNCORRECTED Data derived from ABS 1350.0, 6202.0; RBA Statistics, Occasional Paper 8A (Table 4.3).
In fact, one of the main criticisms of trade liberalisation in Australia and elsewhere, especially in the shorter
UNCORRECTED In fact, one of the main criticisms of trade liberalisation in Australia and elsewhere, especially in the shorter
term, is that it prevents the growth of infant industries, destroys others that are uncompetitive and causes
UNCORRECTED term, is that it prevents the growth of infant industries, destroys others that are uncompetitive and causes higher levels of structural unemployment as seen in basic manufacturing during recent decades.
UNCORRECTED
higher levels of structural unemployment as seen in basic manufacturing during recent decades.
Other evidence of the effects of trade liberalisation on domestic
UNCORRECTED
Other evidence of the effects of trade liberalisation on domestic
We will conclude this section about the effects of trade liberalisation on the domestic economy in both the
UNCORRECTED
We will conclude this section about the effects of trade liberalisation on the domestic economy in both the short and long terms by looking at some recent research. Economic modelling has recently been concluded
UNCORRECTED
short and long terms by looking at some recent research. Economic modelling has recently been concluded showing the possible annual impacts of FTAs for the Australian economy predicted for 2016 to 2035. One
UNCORRECTED
showing the possible annual impacts of FTAs for the Australian economy predicted for 2016 to 2035. One report looks at the results of Australia’s three FTAs with Northern Asia (with China in 2015, and with Japan
UNCORRECTED
report looks at the results of Australia’s three FTAs with Northern Asia (with China in 2015, and with Japan and South Korea in 2014). The results are summarised in table 3.2. Notice the expected signi�cant additions to
UNCORRECTED
and South Korea in 2014). The results are summarised in table 3.2. Notice the expected signi�cant additions to GDP, consumption and employment.
UNCORRECTED
GDP, consumption and employment.
UNCORRECTED
UNCORRECTED
TABLE 3.2UNCORRECTED
TABLE 3.2
PAGE Average unemployment rate (%)
PAGE Average unemployment rate (%)since signi�cant globalisation
PAGE since signi�cant globalisation
(1990–91/2015–16)PAGE (1990–91/2015–16)
Period of timePAGE Period of timePAGE
PAGE
PAGE PROOFS
However, having suggested that trade liberalisation should help to promote the goal of full employment,
PROOFSHowever, having suggested that trade liberalisation should help to promote the goal of full employment,
evidence of this appears rather thin. Indeed, average unemployment rates in the years since signi�cant trade
PROOFSevidence of this appears rather thin. Indeed, average unemployment rates in the years since signi�cant trade liberalisation have tended to be signi�cantly higher (see �gure 3.30). Again, this may not entirely be the
PROOFSliberalisation have tended to be signi�cantly higher (see �gure 3.30). Again, this may not entirely be the result of trade liberalisation measures but it is possible that these and related policies have contributed to the
PROOFSresult of trade liberalisation measures but it is possible that these and related policies have contributed to the
PROOFS
PROOFS
PROOFS

186 Economics Down Under 2
c03AustraliaAndTheWorldEconomy 186 29 August 2016 1:07 PM
Effects of trade liberalisation on living standardsOverall living standards or wellbeing depend on both material and non-material conditions: • Material living standards re�ect real annual levels of production, income and consumption of goods and
services per person, and the extent to which our wants are actually satis�ed. • Non-material living standards could be affected by many things, from personal happiness and free choice,
to world peace, the existence of democracy, level of cultural enrichment and experiences, the absence of crime, and a clean and sustainable environment.
Positive effectsTrade liberalisation has had mostly positive effects on the welfare of Australians, especially in the long term: • Trade liberalisation should have bolstered our economic wellbeing through:
– greater ef�ciency in resource allocation and the growth of productive capacity – faster economic growth – increased real per capita incomes and purchasing power – lower consumer prices – increased employment in the long term.
• Trade liberalisation can also enhance some aspects of non-economic wellbeing, perhaps through – increasing consumer choice – improving cooperation and world peace – enhancing cultural enrichment, and providing more exciting and diverse experiences.
Negative effectsHowever, trade liberalisation has not been without its problems: • It has led to higher structural unemployment in some uncompetitive industries that have relocated, restructured
or closed down, and it may also have sti�ed the growth of infant industries that would have provided job oppor-tunities had they been able to prosper. In turn, structural unemployment reduces incomes and consumption. It also undermines aspects of non-material living standards including personal happiness, feelings of self-worth, health outcomes and family tensions, and potentially, even increased crime rates.
• It has possibly exposed Australia to greater economic instability like the effects of the GFC. • By increasing production, it has accelerated the depletion of non-renewable natural resources and further
compromised the environment.
Weblinks The weblinks in these activities are available in this chapter’s student resources tab.• A video case study on Aaco Beef• A video case study on AusAb• A video case study on ACPET• A video case study on Burch Family Wines• A video case study on Burra Foods
• AUSTRADE: Bene�ts of trade and FTAs• Export Council of Australia• Potential FTA with India• AUSTRADE: Export Market Development Grants
CHECK YOUR UNDERSTANDING
1 Outline the main policy measures of the Australian government associated with the progressive adoption of trade liberalisation
2 How would you expect trade liberalisation to affect each of the following areas?a Our international competitivenessb Our domestic macroeconomic goals including: i in�ation rate ii rate of economic growth iii unemployment ratec Overall living standards.
APPLIED ECONOMIC EXERCISES
Apply your understanding of this subtopic by accessing and completing the Applied economic exercise(s).
• School-assessed coursework > Applied economic exercises > Question 8
UNCORRECTED it has accelerated the depletion of non-renewable natural resources and further
UNCORRECTED it has accelerated the depletion of non-renewable natural resources and further
UNCORRECTED The weblinks in these activities are available in this chapter’s student resources tab.
UNCORRECTED The weblinks in these activities are available in this chapter’s student resources tab.
A video case study on Aaco Beef
UNCORRECTED A video case study on Aaco BeefA video case study on AusAb
UNCORRECTED A video case study on AusAbA video case study on ACPET
UNCORRECTED
A video case study on ACPETA video case study on Burch Family Wines
UNCORRECTED
A video case study on Burch Family WinesA video case study on Burra Foods
UNCORRECTED
A video case study on Burra Foods
UNCORRECTED
UNCORRECTED
UNCORRECTED
UNCORRECTED
UNCORRECTED
K
UNCORRECTED
K Y
UNCORRECTED
YO
UNCORRECTED
OU
UNCORRECTED
UR
UNCORRECTED
R U
UNCORRECTED
UNDE
UNCORRECTED
NDE
1
UNCORRECTED
1 Outline the main policy measur
UNCORRECTED
Outline the main policy measurof trade liberalisation
UNCORRECTED
of trade liberalisation 2
UNCORRECTED
2 How would you expect trade liberalisation to af
UNCORRECTED
How would you expect trade liberalisation to afaUNCORRECTED
a
PAGE t has led to higher structural unemployment in some uncompetitive industries that have relocated, restructured
PAGE t has led to higher structural unemployment in some uncompetitive industries that have relocated, restructured or closed down, and it may also have sti�ed the growth of infant industries that would have provided job oppor
PAGE or closed down, and it may also have sti�ed the growth of infant industries that would have provided job opportunities had they been able to prosper. In turn, structural unemployment reduces incomes and consumption. It
PAGE tunities had they been able to prosper. In turn, structural unemployment reduces incomes and consumption. It also undermines aspects of non-material living standards including personal happiness, feelings of self-worth,
PAGE also undermines aspects of non-material living standards including personal happiness, feelings of self-worth, health outcomes and family tensions, and potentially, even increased crime rates.
PAGE health outcomes and family tensions, and potentially, even increased crime rates.
has possibly exposed Australia to greater economic instability like the effects of the GFC.PAGE has possibly exposed Australia to greater economic instability like the effects of the GFC.
it has accelerated the depletion of non-renewable natural resources and further PAGE it has accelerated the depletion of non-renewable natural resources and further
PROOFSwellbeing, perhaps through
PROOFSwellbeing, perhaps through
cultural enrichment, and providing more exciting and diverse experiences.
PROOFScultural enrichment, and providing more exciting and diverse experiences.
t has led to higher structural unemployment in some uncompetitive industries that have relocated, restructured PROOFS
t has led to higher structural unemployment in some uncompetitive industries that have relocated, restructured

TOPIC 3 Australia and the world economy 187
c03AustraliaAndTheWorldEconomy 187 29 August 2016 1:07 PM
3.9 School-assessed courseworkThree SACs are to be completed for VCE Economics Unit 3. SAC 3 is worth 30 per cent of the total assess-ment for Unit 3. It assesses the skills and knowledge associated with Outcome 3 that is largely covered in topic 3. The SAC should be part of the regular teaching and learning program, and completed mainly in class and within a limited timeframe. The SAC could involve one or more of the following: • a folio of applied economics exercises • an essay • a report • structured questions • media analysis • case study.
Courses and assessments can change, so teachers are urged to carefully check the latest VCAA assessment guide and various bulletins to ensure that all the assessment requirements are met fully.
Multiple-choice test questionsInstructions: Using the multiple-choice answer grid available in the Resources section, select the letter (A, B, C, D) that represents the most appropriate answer for each question by marking this with a tick (✓).
The answer grid for the multiple-choice questions is available in this topic’s student resources tab. Searchlight ID: doc-19065
Question 1
International relationships exist between countries. Typically, these involve:A exports of goods and services.B imports of goods and services.C exports and imports of goods and services.D exports and imports of goods and services along with movements of money capital and investments.
Question 2
Currently, Australia’s three most important export customers in descending order are:A China, Japan and the US.B the US, China and Japan.C the US, Japan and China.D Japan, China and the US.
Question 3
Freer international trade usually improves living standards by:A increasing ef�ciency in resource use, growing GDP and decreasing in�ation.B allowing countries to specialise in areas of comparative cost advantage.C growing jobs and incomes, especially in the longer term, thereby increasing our purchasing power.D all of the above.
Question 4
Study the hypothetical data below for country A and country B. It shows the total number of hours that must be worked by each employee to produce a unit of wool or a unit of wheat. Each country can produce the same two products, wool and wheat.
Country Wool (hours worked per unit produced) Wheat (hours worked per unit produced)
A 10 50
B 20 200
Based on this data:A country B has an absolute cost advantage in wheat.B country A has a comparative cost advantage in wheat.C country B has no type of cost advantage in either product.D country B has an absolute and comparative cost advantage in both goods.
Question 5
Referring to the data from question 4, which statement is false?A Country A is more ef�cient at producing both wool and wheat than country B.B Country B is less ef�cient at producing both wool and wheat than country A.
UNCORRECTED Currently, Australia’s three most important export customers in
UNCORRECTED Currently, Australia’s three most important export customers in
Freer international trade usually improves living standards by:
UNCORRECTED
Freer international trade usually improves living standards by:increasing ef�ciency in resource use, growing GDP and decreasing in�ation.
UNCORRECTED
increasing ef�ciency in resource use, growing GDP and decreasing in�ation.allowing countries to specialise in areas of comparative cost advantage.
UNCORRECTED
allowing countries to specialise in areas of comparative cost advantage.growing jobs and incomes, especially in the longer term, thereby increasing our purchasing power.
UNCORRECTED
growing jobs and incomes, especially in the longer term, thereby increasing our purchasing power.
Study the hypothetical data below for country A and country B. It shows the total number of hours that must
UNCORRECTED
Study the hypothetical data below for country A and country B. It shows the total number of hours that must be worked by each employee to produce a unit of wool or a unit of wheat. Each country can produce the same
UNCORRECTED
be worked by each employee to produce a unit of wool or a unit of wheat. Each country can produce the same two products, wool and wheat.
UNCORRECTED
two products, wool and wheat.
UNCORRECTED
UNCORRECTED
UNCORRECTED
CountryUNCORRECTED
Country
PAGE International relationships exist between countries. Typically, these involve:
PAGE International relationships exist between countries. Typically, these involve:
exports and imports of goods and services along with movements of money capital and investments.PAGE exports and imports of goods and services along with movements of money capital and investments.
descendingPAGE
descending
PROOFS Using the multiple-choice answer grid available in the Resources section, select the letter (A, B,
PROOFS Using the multiple-choice answer grid available in the Resources section, select the letter (A, B,
C, D) that represents the most appropriate answer for each question by marking this with a tick (
PROOFSC, D) that represents the most appropriate answer for each question by marking this with a tick (✓
PROOFS✓).
PROOFS).
PROOFSThe answer grid for the multiple-choice questions is available in this topic’s student resources tab.
PROOFSThe answer grid for the multiple-choice questions is available in this topic’s student resources tab.
S
PROOFS
Searchlight I
PROOFS
earchlight I
PROOFS

188 Economics Down Under 2
c03AustraliaAndTheWorldEconomy 188 29 August 2016 1:07 PM
C Country B should specialise in the production of wheat because its comparative advantage is greater than that for wool.
D Country B is relatively more ef�cient at producing wool than wheat.Question 6
Which of the following would not generally explain a country’s comparative cost advantage?A Superior access to natural resourcesB Lower productivity levels for labourC Exploitation of economies of large-scale productionD A rapid rise in the population of working age.Question 7
Examine the following hypothetical data relating to a nation’s balance of payments for 2016–17.
Balance of payments item $ million (+ surplus, − de�cit)
Net goods +100
Net services –50
Net primary incomes –100
Net secondary incomes +25
From these data, the balance of payments on current account would be:A $125 million surplus.B $125 million de�cit.C $175 million de�cit.D none of the above.Question 8
Regarding Australia’s BOP current account and the BOP capital and �nancial accounts, which statement is least correct?A In total, the capital and �nancial accounts are a surplus to offset the CAD .B Australia depends on foreign debt and liabilities to offset the excess of debits on the current account.C A rise in foreign investment in Australia normally reduces our CAD.D The existence of a national savings–investment gap ultimately adds to the CAD while creating a surplus
on the capital and �nancial accounts.Question 9
Which of the following would have the opposite effect on the size of Australia’s CAD to the other three responses? A Severe climatic conditions result in drought and cyclones in Australia.B Australia’s average in�ation rate is consistently below that of our trading competitors.C There is a rise in domestic consumer con�dence and a fall in con�dence in China.D The exchange rate for the Australian dollar rises strongly.Question 10
Which of the following would be likely to have the opposite effect on the size of Australia’s CAD to the other three responses?A Overall stronger domestic aggregate demand-side conditionsB A higher household savings ratio domestically from 3 per cent to 10 per centC Generally less favourable aggregate supply conditions including weaker rises in domestic productivity,
higher RULCs and rises in international oil prices to over US$100 a barrelD Less favourable TOT for Australia and rises in defence spending on equipmentQuestion 11
Concerning Australia’s NFD and liabilities, which statement is false?A The NFD is the excess of what Australia has lent overseas relative to what we have borrowed.B The rise in of�cial debt is partly the result of weaker economic activity and hence larger budget de�cits.C Non-of�cial, private sector debt has risen due to the savings–investment gap and lower interest rates in
some overseas countries.D In part, our abundance of natural resources and favourable economic and social institutions help to explain
the rise in our external liabilities.Question 12
Which statement about Australia’s trade liberalisation is most correct?A A reduction in the protection levels for local industriesB A general reduction of tariffs to 5 per cent or less, and the removal of higher rates of protection for TC&F
(textiles, clothing and footwear) and passenger vehicles during 2015C The abolition of import quotas, an overall reduction in the net value of producer subsidies to local
industries and the signing of additional FTAsD All of the above
UNCORRECTED opposite
UNCORRECTED opposite effect on the size of Australia’s CAD to the other three responses?
UNCORRECTED effect on the size of Australia’s CAD to the other three responses?
Severe climatic conditions result in drought and cyclones in Australia.
UNCORRECTED Severe climatic conditions result in drought and cyclones in Australia.Australia’s average in�ation rate is consistently below that of our trading competitors.
UNCORRECTED Australia’s average in�ation rate is consistently below that of our trading competitors.There is a rise in domestic consumer con�dence and a fall in con�dence in China.
UNCORRECTED There is a rise in domestic consumer con�dence and a fall in con�dence in China.The exchange rate for the Australian dollar rises strongly.
UNCORRECTED The exchange rate for the Australian dollar rises strongly.
Which of the following would be likely to have the
UNCORRECTED
Which of the following would be likely to have the other three responses?
UNCORRECTED
other three responses?Overall stronger domestic aggregate demand-side conditions
UNCORRECTED
Overall stronger domestic aggregate demand-side conditionsA higher household savings ratio domestically from 3 per cent to 10 per cent
UNCORRECTED
A higher household savings ratio domestically from 3 per cent to 10 per centGenerally less favourable aggregate supply conditions including weaker rises in domestic productivity,
UNCORRECTED
Generally less favourable aggregate supply conditions including weaker rises in domestic productivity,
UNCORRECTED
higher RULCs and rises in international oil prices to over US$100 a barrel
UNCORRECTED
higher RULCs and rises in international oil prices to over US$100 a barrelLess favourable TOT for Australia and rises in defence spending on equipment
UNCORRECTED
Less favourable TOT for Australia and rises in defence spending on equipmentQuestion 11
UNCORRECTED
Question 11
Concerning Australia’s NFD and liabilities, which statement is
UNCORRECTED
Concerning Australia’s NFD and liabilities, which statement is A UNCORRECTED
A The NFD is the excess of what Australia has lent overseas relative to what we have borrowed.UNCORRECTED
The NFD is the excess of what Australia has lent overseas relative to what we have borrowed.B UNCORRECTED
B The rise in of�cial debt is partly the result of weaker economic activity and hence larger budget de�cits.UNCORRECTED
The rise in of�cial debt is partly the result of weaker economic activity and hence larger budget de�cits.
PAGE Regarding Australia’s BOP current account and the BOP capital and �nancial accounts, which statement is
PAGE Regarding Australia’s BOP current account and the BOP capital and �nancial accounts, which statement is
In total, the capital and �nancial accounts are a surplus to offset the CAD .
PAGE In total, the capital and �nancial accounts are a surplus to offset the CAD .Australia depends on foreign debt and liabilities to offset the excess of debits on the current account.
PAGE Australia depends on foreign debt and liabilities to offset the excess of debits on the current account.A rise in foreign investment in Australia normally reduces our CAD.
PAGE A rise in foreign investment in Australia normally reduces our CAD.The existence of a national savings–investment gap ultimately adds to the CAD while creating a surplus PAGE The existence of a national savings–investment gap ultimately adds to the CAD while creating a surplus
PROOFS
Regarding Australia’s BOP current account and the BOP capital and �nancial accounts, which statement is PROOFS
Regarding Australia’s BOP current account and the BOP capital and �nancial accounts, which statement is

TOPIC 3 Australia and the world economy 189
c03AustraliaAndTheWorldEconomy 189 29 August 2016 1:07 PM
Question 13
Trade protectionism may involve:A cutting tariffs.B abolishing foreign capital or ownership restrictions.C providing Export Development Grants and other types of �nancial assistance.D removing anti-dumping legislation for foreign goods.
Question 14
Which of the following is not an advantage of free trade?A Resources are diverted to areas where cost disadvantages are relatively lowest and opportunity costs tend
to be minimised.B Local businesses need to restructure their approach to improve ef�ciency in production.C Imports of capital goods incorporating new technology become cheaper for local �rms, helping to boost
their competitiveness.D Employment rates will probably be higher in the short term.
Question 15
The dominant reason for Australia’s CAD in recent years is:A the lack of domestic savings and relatively high local interest rates, which encourage overseas borrowing
and lead to massive income repayments abroad.B too many imports of merchandise and services.C a lack of export competitiveness and sales abroad.D Australia’s secondary income debits are too high.
Question 16
The CAD represents the extent to which:A total debits for merchandise imports exceed total credits for merchandise exports.B total debits for imports of goods and services exceed total credits for exports of goods and services.C total primary and secondary income debits exceed credits.D the total value of debits exceeds credits for merchandise, services, primary incomes and secondary incomes.
Question 17
The aggregate demand-side or aggregate supply-side development most unlikely to cause an appreciation of the Australian dollar is:A a rise in world commodity prices and the terms of trade.B a recession in Japan, China and the United States.C higher domestic interest rates and the relaxation of controls on the level of foreign investment.D huge new discoveries of natural resources.
Question 18
The aggregate demand-side or aggregate supply-side development most unlikely to cause a depreciation of the Australian dollar is:A a rise in the federal government budget surplus where government receipts exceed outlays and there is no
need to borrow credit abroad.B a rise in consumer and business con�dence associated with the onset of a boom in the level of domestic
economic activity.C a drop in worker productivity.D an ongoing reduction in R&D funding by the federal government.
Question 19
Which statement is generally false for Australia?A Very strong levels of domestic economic activity usually cause a cyclical fall in the CAD.B A weaker Australian dollar can actually help improve the balance of net goods.C Very rapid economic growth resulting in higher in�ation can cause a fall in the TWI.D Foreign borrowing can tend to weaken the balance of payments current account by raising the overall
value of primary income debits relative to the overall value of primary income credits.
Question 20
Concerning the balance of payments account, which statement is false?A The sale of Australian wool to Japan would be recorded as a debit on Japan’s balance of net goods.B The payment of share dividends by Telstra Corporation Ltd to overseas shareholders would be recorded as
a debit on Australia’s capital account.C Investment by the Royal Dutch Shell oil company of the Netherlands in expanding its operations would be
initially recorded as an item on the �nancial account.D The staging of the Soccer World Cup would be likely to strengthen Australia’s net services account.
UNCORRECTED The aggregate demand-side or aggregate supply-side development
UNCORRECTED The aggregate demand-side or aggregate supply-side development
a rise in world commodity prices and the terms of trade.
UNCORRECTED a rise in world commodity prices and the terms of trade.a recession in Japan, China and the United States.
UNCORRECTED a recession in Japan, China and the United States.higher domestic interest rates and the relaxation of controls on the level of foreign investment.
UNCORRECTED higher domestic interest rates and the relaxation of controls on the level of foreign investment.huge new discoveries of natural resources.
UNCORRECTED huge new discoveries of natural resources.
The aggregate demand-side or aggregate supply-side development
UNCORRECTED
The aggregate demand-side or aggregate supply-side development
a rise in the federal government budget surplus where government receipts exceed outlays and there is no
UNCORRECTED
a rise in the federal government budget surplus where government receipts exceed outlays and there is no need to borrow credit abroad.
UNCORRECTED
need to borrow credit abroad.a rise in consumer and business con�dence associated with the onset of a boom in the level of domestic
UNCORRECTED
a rise in consumer and business con�dence associated with the onset of a boom in the level of domestic economic activity.
UNCORRECTED
economic activity.a drop in worker productivity.
UNCORRECTED
a drop in worker productivity.
UNCORRECTED
an ongoing reduction in R&D funding by the federal government.
UNCORRECTED
an ongoing reduction in R&D funding by the federal government.
Question 19
UNCORRECTED
Question 19
Which statement is generally UNCORRECTED
Which statement is generally Very strong levels of domestic economic activity usually cause a cyclical fall in the CAD.UNCORRECTED
Very strong levels of domestic economic activity usually cause a cyclical fall in the CAD.A weaker Australian dollar can actually help improve the balance of net goods.UNCORRECTED
A weaker Australian dollar can actually help improve the balance of net goods.
PAGE total debits for merchandise imports exceed total credits for merchandise exports.
PAGE total debits for merchandise imports exceed total credits for merchandise exports.total debits for imports of goods and services exceed total credits for exports of goods and services.
PAGE total debits for imports of goods and services exceed total credits for exports of goods and services.
the total value of debits exceeds credits for merchandise, services, primary incomes and secondary incomes.
PAGE the total value of debits exceeds credits for merchandise, services, primary incomes and secondary incomes.
The aggregate demand-side or aggregate supply-side development PAGE
The aggregate demand-side or aggregate supply-side development
PROOFSthe lack of domestic savings and relatively high local interest rates, which encourage overseas borrowing
PROOFSthe lack of domestic savings and relatively high local interest rates, which encourage overseas borrowing

190 Economics Down Under 2
c03AustraliaAndTheWorldEconomy 190 29 August 2016 1:07 PM
Question 21
An improvement in the terms of trade for Australia would not normally result from:A falling export prices at a rate less than the fall in import prices.B rising export prices at a rate faster than that for import prices.C rapid economic growth in Japan, the United States and Asia generally.D depressed international commodity prices for minerals, wool and cereals.Question 22
Which of the following is not normally regarded as a disadvantage of free trade?A The weakening of national defence and self-suf�ciency in times of war and isolationB A reduction in the opportunities for new industries to get started and create jobsC Greater domestic economic stability in times of global slowdownsD Dangerous or unsafe goods becoming more likely to be sold locallyQuestion 23
Trade liberalisation is likely to slow in�ation because:A resources are reallocated into areas where ef�ciency is highestB local �rms are exposed to stiffer competition from imports, especially of goods.C �rms can spread their �xed costs more thinly over larger production runs.D all of the above may be applicable.Question 24
Which statement about trade liberalisation is incorrect?A For one reason or another, the average unemployment rate appears to now be higher than before
signi�cant trade liberalisation as a policy was widely adopted.B Over a quarter of all jobs in Australia are related to international trade.C Trade liberalisation may destroy jobs in some industries but is likely to create more jobs overall, especially
in the longer term.D Recent FTAs with Northern Asia are expected to decrease GDP and employment.Question 25
A rise in the Australian dollar is most likely to be caused by:A a fall in the TOT and lower rural and mineral commodity prices.B a rise in the supply of the Australian dollar due to weaker con�dence and lower economic activity domestically.C a cut in interest rates locally, relative to those overseas.D stronger levels of global economic activity, especially in China and Japan, and a weaker US dollar.Question 26
A lower Australian dollar is likely to lead to which of the following macroeconomic effects?A Higher cost and demand in�ation, stronger economic growth and lower cyclical unemploymentB Lower in�ation and economic growth, with higher structural unemploymentC Overall reduced competitiveness of domestic manufacturing industries that export and compete with importsD A smaller number of overseas tourists coming to Australia and locals tending to holiday abroad, slowing
down the growth in GDP and employmentQuestion 27
Examine the following data for a hypothetical country’s TOT.
Year Export price index Import price index
2015–16 (base year) 100 100
2016–17 90 90
2017–18 80 70
2018–19 90 80
2019–20 120 70
Which statement is false?A There was no change in the TOT between 2015–16 and 2016–17.B The TOT moved unfavourably in 2017–18 against that for 2016–17.C The TOT moved unfavourably in 2018–19 against that for 2017–18.D The TOT moved favourably in 2019–20 against that for 2018–19.Question 28
Australia’s TOT would tend to fall and be less favourable if:A there was stronger global economic activity.B there was weaker global economic activity.C global disposable income rose.D there were generally less favourable growing conditions for crops worldwide.
UNCORRECTED a rise in the supply of the Australian dollar due to weaker con�dence and lower economic activity domestically.
UNCORRECTED a rise in the supply of the Australian dollar due to weaker con�dence and lower economic activity domestically.a cut in interest rates locally, relative to those overseas.
UNCORRECTED a cut in interest rates locally, relative to those overseas.stronger levels of global economic activity, especially in China and Japan, and a weaker US dollar.
UNCORRECTED stronger levels of global economic activity, especially in China and Japan, and a weaker US dollar.
to lead to which of the following macroeconomic effects?
UNCORRECTED to lead to which of the following macroeconomic effects?
Higher cost and demand in�ation, stronger economic growth and lower cyclical unemployment
UNCORRECTED Higher cost and demand in�ation, stronger economic growth and lower cyclical unemploymentLower in�ation and economic growth, with higher structural unemployment
UNCORRECTED Lower in�ation and economic growth, with higher structural unemploymentOverall reduced competitiveness of domestic manufacturing industries that export and compete with imports
UNCORRECTED
Overall reduced competitiveness of domestic manufacturing industries that export and compete with importsA smaller number of overseas tourists coming to Australia and locals tending to holiday abroad, slowing
UNCORRECTED
A smaller number of overseas tourists coming to Australia and locals tending to holiday abroad, slowing down the growth in GDP and employment
UNCORRECTED
down the growth in GDP and employment
Examine the following data for a hypothetical country’s TOT.
UNCORRECTED
Examine the following data for a hypothetical country’s TOT.
UNCORRECTED
UNCORRECTED
UNCORRECTED
UNCORRECTED
2015–16 (base year)
UNCORRECTED
2015–16 (base year)
2016–17
UNCORRECTED
2016–17
2017–18
UNCORRECTED
2017–18
2018–19UNCORRECTED
2018–19UNCORRECTED
2019–20UNCORRECTED
2019–20
PAGE Over a quarter of all jobs in Australia are related to international trade.
PAGE Over a quarter of all jobs in Australia are related to international trade.Trade liberalisation may destroy jobs in some industries but is likely to create more jobs overall, especially
PAGE Trade liberalisation may destroy jobs in some industries but is likely to create more jobs overall, especially
Recent FTAs with Northern Asia are expected to decrease GDP and employment.
PAGE Recent FTAs with Northern Asia are expected to decrease GDP and employment.
to be caused by:
PAGE to be caused by:
a fall in the TOT and lower rural and mineral commodity prices.PAGE a fall in the TOT and lower rural and mineral commodity prices.a rise in the supply of the Australian dollar due to weaker con�dence and lower economic activity domestically.PAGE
a rise in the supply of the Australian dollar due to weaker con�dence and lower economic activity domestically.
PROOFS
For one reason or another, the average unemployment rate appears to now be higher than before
PROOFS
For one reason or another, the average unemployment rate appears to now be higher than before
Trade liberalisation may destroy jobs in some industries but is likely to create more jobs overall, especially PROOFS
Trade liberalisation may destroy jobs in some industries but is likely to create more jobs overall, especially

TOPIC 3 Australia and the world economy 191
c03AustraliaAndTheWorldEconomy 191 29 August 2016 1:07 PM
Question 29
Which of the following macroeconomic effects would be unlikely, given a general fall in Australia’s TOT as seen between 2013 and 2016?A Rising demand in�ation and economic growthB Higher cyclical unemploymentC A slowdown in the rate of economic growthD Lower material living standardsQuestion 30
Concerning Australia’s international competitiveness, which statement is false?A Over recent years, our competitiveness has declined.B Multifactor productivity has risen strongly but the fall in labour productivity has weakened our
international competitiveness.C The cut in company tax for small businesses from 2015 (along with the announcement of further
reductions in the 2016–17 budget) should help improve our international competitiveness.D The abundance of many natural resources should enhance our international competitiveness but our
relatively high labour costs undermine it.
Applied economic exercisesInstructions: Complete a selection of the following short-answer questions.Question 1
A Why has world trade grown so quickly in recent decades? (2 marks)B Most believe that the growth in world trade has helped to increase material and non-material living
standards. Explain how each of the following points associated with the growth of international trade (and trade liberalisation) might affect general living standards.
(i) Increased international specialisation in production based on comparative cost advantage (2 marks)(ii) Greater economies of large-scale production (2 marks)
(iii) Better access to resources (1 mark)(iv) Environmental impacts (1 mark)(v) More consumer choice and lower prices (2 marks)
(vi) Higher GDP and average incomes (2 marks)(vii) Job creation (2 marks)
(viii) Promotion of world peace (1 mark)
Question 2
A What is the BOP account and how is it structured? (2 marks)B Copy the following table, then classify each transaction and indicate where and how each
would initially be recorded on Australia’s BOP account. (12 marks)
Transaction
Major section of Australia’s BOP account (e.g. current account, or capital and �nancial accounts)
Minor sub-account making up Australia’s current account, or capital and �nancial accounts
Recorded as a credit (+) or debit (–) on Australia’s BOP
(i) You purchase a laptop computer made in Korea for $2800
(ii) Australia sells lamb to the US and Indonesia worth $750 million
(iii) You donate $50 in food aid to Ethiopia
(iv) BHP-Billiton pays $15 million in dividends to overseas shareholders
(v) The government pays $12 million in interest on its overseas debt
(vi) You make a $10 phone call using an overseas phone company
(vii) An immigrant transfers $45 000 to an Australian bank account
(viii) Qantas sells an old aircraft to Indonesia’s Garuda Airlines for $7 million
(ix) Grand Prix tickets worth $4.5 million are sold to overseas visitors
(x) Chinese investors purchase residential and rural property worth $25 billion
(xi) James Packer buys shares in an overseas media company worth $9 million
(xii) Overseas students from India, China and Thailand purchase $5 billion of education from Australian secondary schools and universities
UNCORRECTED What is the BOP account and how is it structured?
UNCORRECTED What is the BOP account and how is it structured?Copy the following table, then classify each transaction and indicate where and how each
UNCORRECTED Copy the following table, then classify each transaction and indicate where and how each would initially be recorded on Australia’s BOP account.
UNCORRECTED would initially be recorded on Australia’s BOP account.
UNCORRECTED
UNCORRECTED
UNCORRECTED
UNCORRECTED
UNCORRECTED
UNCORRECTED
UNCORRECTED
UNCORRECTED
UNCORRECTED
UNCORRECTED
(i) You purchase a laptop computer made in Korea for $2800
UNCORRECTED
(i) You purchase a laptop computer made in Korea for $2800
(ii) Australia sells lamb to the US and Indonesia worth $750 million
UNCORRECTED
(ii) Australia sells lamb to the US and Indonesia worth $750 million
(iii) You donate $50 in food aid to Ethiopia
UNCORRECTED
(iii) You donate $50 in food aid to Ethiopia
(iv) BHP-Billiton pays $15 million in dividends to overseas
UNCORRECTED
(iv) BHP-Billiton pays $15 million in dividends to overseas shareholdersUNCORRECTED
shareholders
(v) The government pays $12 million in interest on its overseas debtUNCORRECTED
(v) The government pays $12 million in interest on its overseas debt
PAGE standards. Explain how each of the following points associated with the growth of international trade (and
PAGE standards. Explain how each of the following points associated with the growth of international trade (and
international specialisation in production based on comparative cost advantage
PAGE international specialisation in production based on comparative cost advantage
PROOFSThe abundance of many natural resources should enhance our international competitiveness but our
PROOFSThe abundance of many natural resources should enhance our international competitiveness but our
Most believe that the growth in world trade has helped to increase material and non-material living PROOFS
Most believe that the growth in world trade has helped to increase material and non-material living standards. Explain how each of the following points associated with the growth of international trade (and PROOFS
standards. Explain how each of the following points associated with the growth of international trade (and
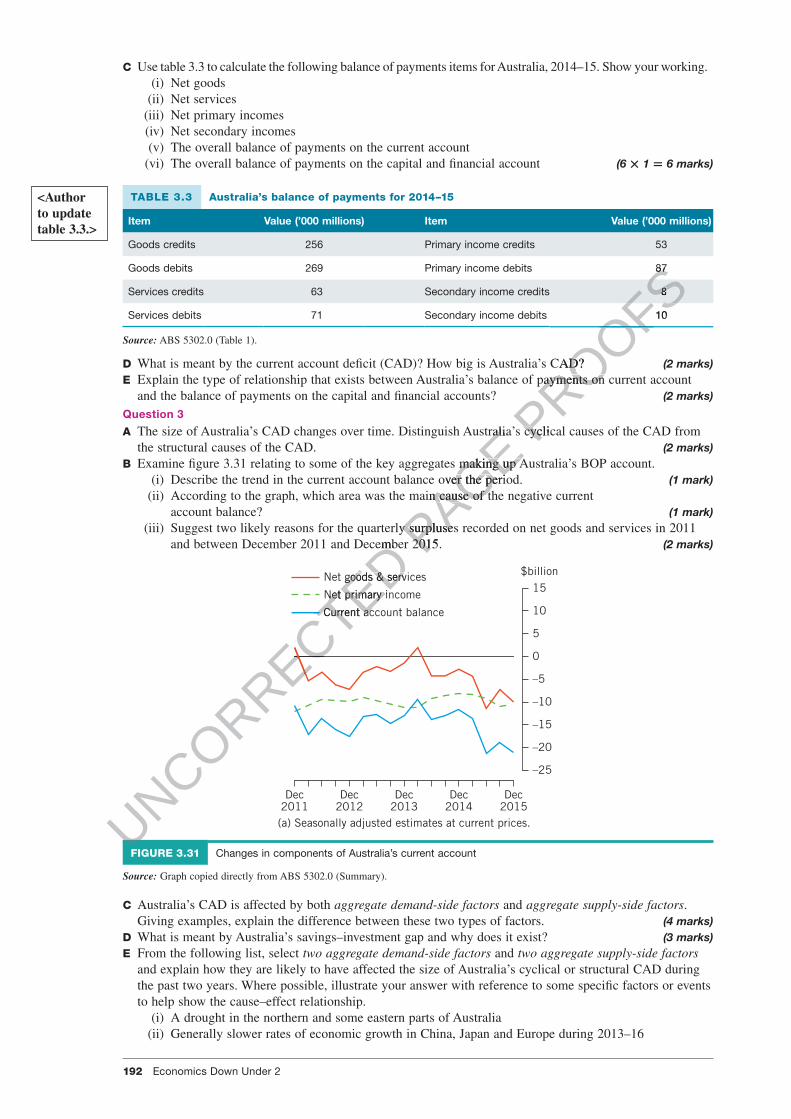
192 Economics Down Under 2
c03AustraliaAndTheWorldEconomy 192 29 August 2016 1:07 PM
C Use table 3.3 to calculate the following balance of payments items for Australia, 2014–15. Show your working. (i) Net goods (ii) Net services (iii) Net primary incomes (iv) Net secondary incomes (v) The overall balance of payments on the current account (vi) The overall balance of payments on the capital and �nancial account (6 × 1 = 6 marks)
TABLE 3.3 Australia’s balance of payments for 2014–15
Item Value (’000 millions) Item Value (’000 millions)
Goods credits 256 Primary income credits 53
Goods debits 269 Primary income debits 87
Services credits 63 Secondary income credits 8
Services debits 71 Secondary income debits 10
Source: ABS 5302.0 (Table 1).
D What is meant by the current account de�cit (CAD)? How big is Australia’s CAD? (2 marks)E Explain the type of relationship that exists between Australia’s balance of payments on current account
and the balance of payments on the capital and �nancial accounts? (2 marks) Question 3
A The size of Australia’s CAD changes over time. Distinguish Australia’s cyclical causes of the CAD from the structural causes of the CAD. (2 marks)
B Examine �gure 3.31 relating to some of the key aggregates making up Australia’s BOP account. (i) Describe the trend in the current account balance over the period. (1 mark) (ii) According to the graph, which area was the main cause of the negative current
account balance? (1 mark) (iii) Suggest two likely reasons for the quarterly surpluses recorded on net goods and services in 2011
and between December 2011 and December 2015. (2 marks)
Dec2011
Dec2012
(a) Seasonally adjusted estimates at current prices.
Dec2013
Dec2014
Dec2015
–25
–20
–15
–10
–5
0
5
10
15$billion
Current account balance
Net goods & services
Net primary income
FIGURE 3.31 Changes in components of Australia’s current account
Source: Graph copied directly from ABS 5302.0 (Summary).
C Australia’s CAD is affected by both aggregate demand-side factors and aggregate supply-side factors. Giving examples, explain the difference between these two types of factors. (4 marks)
D What is meant by Australia’s savings–investment gap and why does it exist? (3 marks)E From the following list, select two aggregate demand-side factors and two aggregate supply-side factors
and explain how they are likely to have affected the size of Australia’s cyclical or structural CAD during the past two years. Where possible, illustrate your answer with reference to some speci�c factors or events to help show the cause–effect relationship.
(i) A drought in the northern and some eastern parts of Australia (ii) Generally slower rates of economic growth in China, Japan and Europe during 2013–16
<Author to update table 3.3.>
UNCORRECTED and between December 2011 and December 2015.
UNCORRECTED and between December 2011 and December 2015.
UNCORRECTED
UNCORRECTED
UNCORRECTED
UNCORRECTED
UNCORRECTED Current account balance
UNCORRECTED Current account balance
UNCORRECTED Net goods & services
UNCORRECTED Net goods & services
Net primary income
UNCORRECTED Net primary income
PAGE The size of Australia’s CAD changes over time. Distinguish Australia’s cyclical causes of the CAD from
PAGE The size of Australia’s CAD changes over time. Distinguish Australia’s cyclical causes of the CAD from
Examine �gure 3.31 relating to some of the key aggregates making up Australia’s BOP account.
PAGE Examine �gure 3.31 relating to some of the key aggregates making up Australia’s BOP account.
the trend in the current account balance over the period.
PAGE the trend in the current account balance over the period.
to the graph, which area was the main cause of the negative current
PAGE to the graph, which area was the main cause of the negative current
two likely reasons for the quarterly surpluses recorded on net goods and services in 2011 PAGE two likely reasons for the quarterly surpluses recorded on net goods and services in 2011
and between December 2011 and December 2015.PAGE
and between December 2011 and December 2015.
PROOFS
PROOFS
PROOFS
PROOFS87
PROOFS87
8
PROOFS810
PROOFS10
What is meant by the current account de�cit (CAD)? How big is Australia’s CAD?
PROOFSWhat is meant by the current account de�cit (CAD)? How big is Australia’s CAD?Explain the type of relationship that exists between Australia’s balance of payments on current account
PROOFSExplain the type of relationship that exists between Australia’s balance of payments on current account
The size of Australia’s CAD changes over time. Distinguish Australia’s cyclical causes of the CAD from PROOFS
The size of Australia’s CAD changes over time. Distinguish Australia’s cyclical causes of the CAD from

TOPIC 3 Australia and the world economy 193
c03AustraliaAndTheWorldEconomy 193 29 August 2016 1:07 PM
(iii) Large budget de�cits totalling over $320 billion in 2008–09 to 2015–16, which the Australian government partly �nanced by overseas borrowing
(iv) The 30+ per cent fall in the exchange rate for the Australian dollar against the US dollar between 2013 and early 2016
(v) A rise in international terrorism(vi) The staging of the Soccer World Cup in Melbourne
(vii) A sustained slowdown in multifactor productivity from 2002–03 to 2015–16(viii) A heavy fall in Australia’s terms of trade index during 2013–16
(ix) A fall in oil prices from over US$100 per barrel to under US$50 per barrel in 2015–16(x) A fall in the annual level of the household savings ratio in Australia from over 10 per cent to around
8 per cent of GDP between 2013 and 2015(xi) A decline in consumer and business con�dence in Japan and China during 2013–16
(xii) A fall in or �at levels of domestic business con�dence during 2011–13(xiii) Lower world commodity prices and terms of trade during 2013–16(xiv) A decrease in the interest rate differential between 2013 and 2016, with rates in Australia falling
closer to those overseas(xv) Speculation that the exchange rate for the Australian dollar will fall even further (2 × 4 = 8 marks)
Question 4
A Australia now has over $1000 billion of NFD. De�ne the term net foreign debt (NFD). (2 marks)B Distinguish Australia’s NFD from NFE. (2 marks)C Distinguish of�cial debt from non-of�cial debt, noting which of the two is higher. (2 marks)D Identify and explain two factors that have led to the rise in of�cial foreign debt in recent times. (2 marks)E Identify and explain two factors that have led to the rise in non-of�cial foreign debt in recent times. (2 marks)F Outline one important cost and one bene�t of Australia’s NFD. (2 marks)
Question 5
A De�ne terms of trade. (2 marks)B Explain how Australia measures the terms of trade. (2 marks)C Examine the hypothetical data relating to a country’s export price index and import price
index shown in the table below. (i) Showing the formula, calculate the TOT index for the four years 2016–17 to 2019–20. (2 marks)
(ii) Describe the trend in this country’s TOT index over the period. (1 mark)
Year Export price index Import price index TOT index
2015–16 (base year) 100 100 100
2016–17 130 120
2017–18 110 110
2018–19 90 100
2019–20 80 90
D What are the general determinants or causes of changes in Australia’s TOT index? (2 marks)E Identify and explain the key factors that caused Australia’s TOT index to fall between 2013 and
2016. As part of your answer, illustrate the impacts of these factors hypothetically on D–S diagrams representing global markets for our exports and imports. (4 marks)
F How would you expect a fall in Australia’s TOT index to affect each of the following variables?(i) The size of our CAD (2 marks)
(ii) The exchange rate for the Australian dollar (2 marks)(iii) The general level of domestic economic activity (2 marks)
Question 6
A How is Australia’s exchange rate determined? Illustrate this diagrammatically for the foreign exchange market (2 + 1 = 3 marks)
B Using D–S diagrams to show the before and after situations in the foreign exchange market, explain what would happen to the exchange rate for the Australian dollar (A$) in each of the following:
(i) there was increased buying of the A$ (1 mark)(ii) there was increased selling of the A$. (1 mark)
C What does the trade weighted index or TWI measure? (2 marks)D Giving clear reasons, explain how each of the following events would be likely to affect the
exchange rate for the Australian dollar:(i) cuts in domestic interest rates, which occurred in 2011–16 (2 marks)
(ii) overall slower economic activity overseas including China and Japan, as happened in 2013–16 (2 marks)
UNCORRECTED wing the formula, calculate the TOT index for the four years 2016–17 to 2019–20.
UNCORRECTED wing the formula, calculate the TOT index for the four years 2016–17 to 2019–20.the trend in this country’s TOT index over the period.
UNCORRECTED the trend in this country’s TOT index over the period.
UNCORRECTED
UNCORRECTED
UNCORRECTED Export price index
UNCORRECTED Export price index
130
UNCORRECTED 130
110
UNCORRECTED 110
90
UNCORRECTED
90
80
UNCORRECTED
80
What are the general determinants or causes of changes in Australia’s TOT index?
UNCORRECTED
What are the general determinants or causes of changes in Australia’s TOT index?Identify and explain the key factors that caused Australia’s TOT index to fall between 2013 and
UNCORRECTED
Identify and explain the key factors that caused Australia’s TOT index to fall between 2013 and 2016. As part of your answer, illustrate the impacts of these factors hypothetically on D–S
UNCORRECTED
2016. As part of your answer, illustrate the impacts of these factors hypothetically on D–S diagrams representing global markets for our exports and imports.
UNCORRECTED
diagrams representing global markets for our exports and imports.How would you expect a fall in Australia’s TOT index to affect each of the following variables?
UNCORRECTED
How would you expect a fall in Australia’s TOT index to affect each of the following variables?The
UNCORRECTED
The size of our CAD
UNCORRECTED
size of our CAD(ii)
UNCORRECTED
(ii) The
UNCORRECTED
The exchange rate for the Australian dollar
UNCORRECTED
exchange rate for the Australian dollar
UNCORRECTED
(iii) UNCORRECTED
(iii) The UNCORRECTED
The general level of domestic economic activityUNCORRECTED
general level of domestic economic activityuestion 6UNCORRECTED
uestion 6
PAGE foreign debt in recent times.
PAGE foreign debt in recent times.
Examine the hypothetical data relating to a country’s export price index and import price
PAGE Examine the hypothetical data relating to a country’s export price index and import price
wing the formula, calculate the TOT index for the four years 2016–17 to 2019–20.PAGE
wing the formula, calculate the TOT index for the four years 2016–17 to 2019–20.the trend in this country’s TOT index over the period.PAGE
the trend in this country’s TOT index over the period.
PROOFSferential between 2013 and 2016, with rates in Australia falling
PROOFSferential between 2013 and 2016, with rates in Australia falling
4
PROOFS4 =
PROOFS= 8 marks)
PROOFS8 marks)
(2 marks)
PROOFS(2 marks)
, noting which of the two is higher.
PROOFS, noting which of the two is higher.
foreign debt in recent times.PROOFS
foreign debt in recent times. foreign debt in recent times.PROOFS
foreign debt in recent times.

194 Economics Down Under 2
c03AustraliaAndTheWorldEconomy 194 29 August 2016 1:07 PM
(iii) relatively weak business and consumer optimism in Australia, as occurred (2 marks) (iv) speculation of a future rise in the Australian dollar next week (2 marks) (v) a fall in our terms of trade index, as between 2013–15. (2 marks) (vi) a rise in interest rates in the US relative to those in Australia, as occurred in 2014–15 (2 marks) (vii) a fall in RULCs in Australia, as happened in 2012–14 (2 marks) (viii) reduced foreign aid and a substantial cut in defence spending on new equipment, such
as happened in 2014–15 (2 marks) (ix) a slower rate of in�ation in Australia than in some overseas countries. (2 marks)E Explain how a fall in the exchange rate for the Australian dollar would be likely to affect each variable: (i) size of the CAD (2 marks) (ii) rate of in�ation (2 marks) (iii) rate of economic growth (2 marks) (iv) rate of unemployment. (2 marks)
Question 7
A De�ne what is meant by international competitiveness. (2 marks)B Identify and outline four important factors that have affected Australia’s international
competitiveness over recent years. (4 marks)C Examine �gure 3.32 showing Australia’s international rankings (out of 60 nations; lower scores represent
better competitiveness) on various dimensions of international competitiveness. In which three areas of competitiveness is Australia ranked relatively
(i) highest? (1 mark) (ii) lowest? (1 mark)
Economic performance Government ef�ciency Business ef�ciency Infrastructure
Dom
esti
c ec
onom
y
Inte
rnat
iona
l tra
de
Inte
rnat
iona
l inv
estm
ent
Em
ploy
men
t
Pri
ces
Pub
lic �
nanc
e
Fisc
al p
olic
y
Inst
itut
iona
l fra
mew
ork
Bus
ines
s le
gisl
atio
n
Soc
ieta
l fra
mew
ork
Pro
duct
ivit
y &
ef�
cien
cy
Labo
r m
arke
t
Fina
nce
Man
agem
ent
prac
tice
s
Att
itud
es a
nd v
alue
s
Bas
ic in
fras
truc
ture
Tech
nolo
gica
l inf
rast
ruct
ure
Sci
enti
�c in
fras
truc
ture
Hea
lth
and
envi
ronm
ent
Edu
cati
on33
1718
4
2125
121321
2628
14
27
4654
16 18 20
9 12
FIGURE 3.32 Australia’s international competitiveness by area
Source: Graph copied directly from the Committee for Economic Development of Australia (CEDA), http://adminpanel.ceda.com.au/FOLDERS/Service/Files/Documents/26525~Australia.pdf.
Question 8
Government trade liberalisation has gained pace in recent decades, especially since the 1990s.A Detail the key policy features of Australia’s trade liberalisation policies. (3 marks)B One aspect of trade liberalisation has been the rapid growth in the number of FTAs. What are bilateral
FTAs and why are they potentially important for Australia? (2 marks)C Explain how you would expect Australia’s trade liberalisation to affect each of the following economic
variables. (i) Australia’s international competitiveness (2 marks) (ii) The in�ation rate (2 marks) (iii) The rate of economic growth (2 marks) (iv) The unemployment rate (2 marks)
(v) Living standards (2 marks)
Author to say when this occurred
UNCORRECTED
UNCORRECTED
UNCORRECTED
UNCORRECTED
UNCORRECTED
Fisc
al p
olic
y
UNCORRECTED
Fisc
al p
olic
y
Inst
itut
iona
l fra
mew
ork
UNCORRECTED
Inst
itut
iona
l fra
mew
ork
Bus
ines
s le
gisl
atio
n
UNCORRECTED
Bus
ines
s le
gisl
atio
n
Soc
ieta
l fra
mew
ork
UNCORRECTED
Soc
ieta
l fra
mew
ork
UNCORRECTED
UNCORRECTED
UNCORRECTED
UNCORRECTED
UNCORRECTED
UNCORRECTED
UNCORRECTED
UNCORRECTED
28
UNCORRECTED
28
UNCORRECTED
UNCORRECTED
UNCORRECTED
46
UNCORRECTED
46
GU
UNCORRECTED
GUR
UNCORRECTED
RE
UNCORRECTED
E 3.32
UNCORRECTED
3.32
Source:
UNCORRECTED
Source: Graph copied directly from the Committee for Economic Development of Australia (CEDA), http://adminpanel.ceda.com.au/
UNCORRECTED
Graph copied directly from the Committee for Economic Development of Australia (CEDA), http://adminpanel.ceda.com.au/FOLDERS/Service/Files/Documents/26525~Australia.pdf.UNCORRECTED
FOLDERS/Service/Files/Documents/26525~Australia.pdf.
PAGE
PAGE Economic performance Government ef�ciency Business ef�ciency
PAGE Economic performance Government ef�ciency Business ef�ciency
Soc
ieta
l fra
mew
ork PAGE
Soc
ieta
l fra
mew
ork
Pro
duct
ivit
y &
ef�
cien
cy
PAGE P
rodu
ctiv
ity
& e
f�ci
ency
PAGE PROOFS(2 marks)
PROOFS(2 marks)
Examine �gure 3.32 showing Australia’s international rankings (out of 60 nations; lower scores represent
PROOFSExamine �gure 3.32 showing Australia’s international rankings (out of 60 nations; lower scores represent better competitiveness) on various dimensions of international competitiveness. In which three areas of
PROOFSbetter competitiveness) on various dimensions of international competitiveness. In which three areas of

TOPIC 3 Australia and the world economy 195
c03AustraliaAndTheWorldEconomy 195 29 August 2016 1:07 PM
D Most commentators agree that trade liberalisation by Australia has led to faster economic growth, higher disposable incomes, lower in�ation and, possibly in the short term, higher structural unemployment. China is a country of over 1.3 billion people undergoing economic transformation. If it is not already, it will soon be the world’s largest economy. Examine �gure 3.33 showing macroeconomic data, generated through 2008 modelling, of the expected effects of the China–Australia FTA (enacted in 2015) on our economy.
(i) According to this data, by how much is this FTA expected to boost our GDP from the baseline level? (1 mark)
(ii) Explain the various ways whereby this FTA could accelerate Australia’s rate of economic growth (GDP). (4 marks)
(iii) Other things being equal, explain how would you expect this FTA to affect our unemployment rate in:(a) the short term (1 mark)(b) the long term. (1 mark)
(iv) Other things being equal, explain how you would expect this FTA to affect our incomes and material living standards. (2 marks)
(v) Explain why economists generally believe that FTAs will reduce Australia’s in�ation, and thus raise our purchasing power and material living standards. (3 marks)
Real GDP
0.0
0.2
0.4
0.6
0.8
1.0
1.2
20
08
20
10
20
12
20
14
20
16
20
18
20
20
20
22
20
24
20
26
20
28
20
30
% d
evia
tion
fro
m b
asel
ine
Real consumption
0.0
0.2
0.4
0.6
0.8
1.0
1.2
20
08
20
10
20
12
20
14
20
16
20
18
20
20
20
22
20
24
20
26
20
28
20
30
% d
evia
tion
fro
m b
asel
ine
Real imports and exports
–1.0
0.0
1.0
2.0
3.0
4.0
5.0
% d
evia
tion
fro
m b
asel
ine Imports
Exports
20
08
20
10
20
12
20
14
20
16
20
18
20
20
20
22
20
24
20
26
20
28
20
30
Change in current account
–0.4
–0.2
0.0
0.2
0.4
% o
f G
DP
20
08
20
10
20
12
20
14
20
16
20
18
20
20
20
22
20
24
20
26
20
28
20
30
Real investment
0.5
0.0
1.0
1.5
2.0
2.5
3.0
% d
evia
tion
fro
m b
asel
ine
20
08
20
10
20
12
20
14
20
16
20
18
20
20
20
22
20
24
20
26
20
28
20
30
Exchange rate (against US$)
0.0
0.5
1.0
1.5
2.0
2.5
3.0
% d
evia
tion
fro
m b
asel
ine
Nominal
Real
20
08
20
10
20
12
20
14
20
16
20
18
20
20
20
22
20
24
20
26
20
28
20
30
FIGURE 3.33 The expected economic effects of the China–Australia FTA
Source: CIE 2008, Estimating the Impact of an Australia–China Trade and Investment Agreement, p. 35 (4.1), http://acbc.com.au/admin/images/uploads/Copy3report_fta_modelling.pdf.
UNCORRECTED
UNCORRECTED
UNCORRECTED
UNCORRECTED
UNCORRECTED
UNCORRECTED
UNCORRECTED
UNCORRECTED
UNCORRECTED
UNCORRECTED
UNCORRECTED
UNCORRECTED
UNCORRECTED
UNCORRECTED
UNCORRECTED
UNCORRECTED
UNCORRECTED
UNCORRECTED
UNCORRECTED
UNCORRECTED
UNCORRECTED
UNCORRECTED
20
12
UNCORRECTED
20
12
20
14
UNCORRECTED
20
14
20
16
UNCORRECTED
20
16
20
18
UNCORRECTED
20
18
UNCORRECTED
UNCORRECTED
UNCORRECTED
2.0UNCORRECTED
2.0
2.5UNCORRECTED
2.5
3.0
UNCORRECTED
3.0
UNCORRECTED
UNCORRECTED
UNCORRECTED PAGE
PAGE
PAGE
PAGE
PAGE
PAGE
PAGE
PAGE
PAGE 0.0
PAGE 0.0
20
08PAGE
20
08
20
10PAGE
20
10PAGE
PAGE
PAGE
PAGE
PAGE
PAGE
PAGE
PAGE
PAGE
PAGE
PAGE
PAGE
PAGE PROOFS
(1 mark)
PROOFS(1 mark)
(2 marks)
PROOFS(2 marks)
(3 marks)
PROOFS(3 marks)
PROOFS
PROOFS
PROOFS
PROOFS
PROOFS
PROOFSReal consumption
PROOFSReal consumption

196 Economics Down Under 2
c03AustraliaAndTheWorldEconomy 196 29 August 2016 1:07 PM
(vi) Examine the following table showing China’s estimated tariff rates for selected products. With the China–Australia FTA now in place, these tariffs would be reduced and later abolished. How would this be likely to affect the following?
(a) Australian farmers (2 marks) (b) Australia’s BOP account (2 marks)
ProductEstimated tariff rate (percentage of price) imposed by China before the recent FTA
Wheat, corn and rice 1–10
Vegetable oils 9
Sugar 20
Wool 5.5
Cotton 26.6
Sources: Data derived from various sources including CIE 2008, Estimating the Impact of an Australia–China Trade and Investment, http://acbc.com.au/admin/images/uploads/Copy3report_fta_modelling.pdf
An essayWrite an 800 word essay in answer to one of the following questions.A Has trade liberalisation lowered Australian living standards and so done more harm than good? (20 marks)B How would you expect the recent decrease in Australia’s terms of trade to affect our standard
of living? (20 marks)C The Australian dollar is lower in early 2016 than it was four years earlier. How is this likely
to affect the government’s key domestic macroeconomic goals, the CAD and the standard of living? (20 marks)
A written reportChange to international transactionsWrite a 1000 word report on the following topic. In total, it is worth 20 marks. Ensure you include statistical data, diagrams and graphs where possible.
Recently (to 2016), Australia’s domestic economy has grown more slowly, unemployment has increased and in�ation is very low. How would each of the following events be likely to have contributed to these economic conditions during the last two or so years?A The terms of trade (5 marks)B The change in the A$ (5 marks)C The signing of FTAs (5 marks)D The decline in Australia’s international competitiveness (5 marks)
3.10 ReviewSummaryRelationship between trade and living standards
• Australia’s international relationships include international trade (involving the �ow of exports and imports of goods and services), and capital �ows (movements of money capital and investments between countries).
• Trade volumes have grown rapidly in recent decades due to trade liberalisation (reduced protection of local industry by cutting tariffs, subsidies, import quotas and signing FTAs).
• Trade generally increases material and non-material living standards by: – encouraging production specialisation in areas of comparative cost advantage – the exploitation of economies of scale – lower prices for goods and services – accelerating GDP growth – the creation of jobs, employment and incomes – increasing access to resources – growing consumer choice – reduction of con�ict – cultural enrichment.
• However, trade can bring some problems too: – possibly increased economic instability – cultural tensions – income inequality – prevention of the growth of infant industries.
UNCORRECTED Recently (to 2016), Australia’s domestic economy has grown more slowly, unemployment has increased and
UNCORRECTED Recently (to 2016), Australia’s domestic economy has grown more slowly, unemployment has increased and in�ation is very low. How would each of the following events be likely to have contributed to these economic
UNCORRECTED in�ation is very low. How would each of the following events be likely to have contributed to these economic conditions during the last two or so years?
UNCORRECTED conditions during the last two or so years?
The decline in Australia’s international competitiveness
UNCORRECTED The decline in Australia’s international competitiveness
3.10 Review
UNCORRECTED
3.10 Review
Relationship between trade and living standards
UNCORRECTED
Relationship between trade and living standards
Australia’
UNCORRECTED
Australia’s international relationships include international trade (involving the �ow of exports and imports of
UNCORRECTED
s international relationships include international trade (involving the �ow of exports and imports of goods and services), and capital �ows (movements of money capital and investments between countries).
UNCORRECTED
goods and services), and capital �ows (movements of money capital and investments between countries).rade volumes have grown rapidly in recent decades due to trade liberalisation (reduced protection of local
UNCORRECTED
rade volumes have grown rapidly in recent decades due to trade liberalisation (reduced protection of local industry by cutting tariffs, subsidies, import quotas and signing FTAs).
UNCORRECTED
industry by cutting tariffs, subsidies, import quotas and signing FTAs).•
UNCORRECTED
• T
UNCORRECTED
Trade generally increases material and non-material living standards by:
UNCORRECTED
rade generally increases material and non-material living standards by:Trade generally increases material and non-material living standards by:T
UNCORRECTED
Trade generally increases material and non-material living standards by:T–UNCORRECTED
– encouraging UNCORRECTED
encouraging –UNCORRECTED
–
PAGE to affect the government’s key domestic macroeconomic goals, the CAD and the standard of
PAGE to affect the government’s key domestic macroeconomic goals, the CAD and the standard of
Write a 1000 word report on the following topic. In total, it is worth 20 marks. Ensure you include statistical
PAGE Write a 1000 word report on the following topic. In total, it is worth 20 marks. Ensure you include statistical
Recently (to 2016), Australia’s domestic economy has grown more slowly, unemployment has increased and PAGE
Recently (to 2016), Australia’s domestic economy has grown more slowly, unemployment has increased and
PROOFS
PROOFS
PROOFSEstimating the Impact of an Australia–China Trade and Investment
PROOFSEstimating the Impact of an Australia–China Trade and Investment
Has trade liberalisation lowered Australian living standards and so done more harm than good?
PROOFSHas trade liberalisation lowered Australian living standards and so done more harm than good?How would you expect the recent decrease in Australia’s terms of trade to affect our standard
PROOFSHow would you expect the recent decrease in Australia’s terms of trade to affect our standard
The Australian dollar is lower in early 2016 than it was four years earlier. How is this likely PROOFS
The Australian dollar is lower in early 2016 than it was four years earlier. How is this likely to affect the government’s key domestic macroeconomic goals, the CAD and the standard of PROOFS
to affect the government’s key domestic macroeconomic goals, the CAD and the standard of

TOPIC 3 Australia and the world economy 197
c03AustraliaAndTheWorldEconomy 197 29 August 2016 1:07 PM
Recording international transactions on the BOP account
• De�nition: The BOP account records the various types of transactions between a country and the rest of the world over a period of time.
• Structure: The BOP account is made up of two main types of transactions, each with sub sections. – The current account records credits and debits for goods, services, primary incomes and secondary incomes.
– The capital and �nancial account records credits and debits for capital transactions, especially investments or the movements of money capital.
Relationship between the current account and the capital and �nancial; accounts
• The BOP is a zero balance account where overall, the total value of credits equals the total value of debits. • For Australia, theoretically, our CAD is exactly offset by a capital and �nancial account surplus involving
a rise in our liabilities (debt and equity) abroad.The CAD and its causes
• De�nition: The CAD represents the excess of total debits over total credits on the BOP current account (made up of net goods, net services, net primary income and net secondary income). Australia runs a CAD.
• Causes: The size of Australia’s CAD is determined by both aggregate demand and aggregate supply conditions: – Stronger domestic demand-side conditions (due to locally stronger consumer and business con�dence
and rising disposable incomes), and weaker spending from abroad (due to a slowdown in economic activity or a drop in the TOT), usually lead to increased imports and decreased exports, and hence a bigger cyclical CAD.
– Ongoing aggregate supply-side conditions also add to the structural CAD (a large savings–investment gap, rising oil prices, drought, high production costs and poor international competitiveness).
The composition and cause of the NFD and NFE
• De�nitions: The NFD represents the excess of what Australia owes the rest of the world against what the world owes us. It implies there will be interest payments as well as the repayment of the borrowed capital. Net foreign equity (NFE) is associated with foreign ownership of Australian assets (such as shares and property) minus our ownership of foreign assets.
• Composition: There is both of�cial (government sector) and non-of�cial debt (private sector). • Causes: Various factors account for our large NFD. These include the rise in of�cial debt (due to a large
number of large governments budget de�cits in recent years), the national savings–investment gap and relatively high domestic interest rates, a recent lower A$, plentiful natural resources, a skilled labour force and good economic infrastructure.
• Effects: The NFD brings bene�ts (more �nance for expansion, cheaper costs of borrowing) and costs (the burden of incomes repayments, and a bigger CAD).
The terms of trade
• De�nition and meaning: The TOT relates to the ratio of export prices Australia receives from overseas (we are mostly price takers), relative to the prices we pay for imports. A fall in the TOT means that Australia is trading under relatively less favourable conditions because we are receiving relatively lower prices against those we pay for imports. Here, a given quantity of exports will purchase a smaller quantity of imports, so we are not as well off.
• Measurement: The TOT is measured by means of an index where the base year equals 100 points.
The terms of trade index (TOT) =Export price index
× 100Import price index
• Determinants: For Australia, our TOT is greatly affected by international commodity prices that in turn re�ect the global conditions of demand (such as global economic activity) and supply (such as climatic conditions and new discoveries) for the things we trade.
• Effects: Changes in the TOT affect the balance on current account and the exchange rate. For instance: – The CAD: A fall in the TOT involving the world paying lower export prices tends to cause a drop in the value of exports and/or a rise in the value of imports, leading to a rise in our CAD.
– The A$: A fall in the TOT tends to reduce the demand for the A$ because of the likely decline in the price and value of exports, and/or an increase the supply of the A$ because of the rise in the price and value of imports (less demand for the A$ and/or more supply of the A$ tends to weaken the exchange rate).
The exchange rate
• De�nition: The exchange rate is the price of an A$ when swapped into other currencies in the foreign exchange market.
UNCORRECTED (government sector) and
UNCORRECTED (government sector) and Various factors account for our large NFD. These include the rise in of�cial debt (due to a large
UNCORRECTED Various factors account for our large NFD. These include the rise in of�cial debt (due to a large number of large governments budget de�cits in recent years), the national savings–investment gap and
UNCORRECTED number of large governments budget de�cits in recent years), the national savings–investment gap and relatively high domestic interest rates, a recent lower A$, plentiful natural resources, a skilled labour force
UNCORRECTED relatively high domestic interest rates, a recent lower A$, plentiful natural resources, a skilled labour force
UNCORRECTED The NFD brings bene�ts (more �nance for expansion, cheaper costs of borrowing) and costs (the
UNCORRECTED The NFD brings bene�ts (more �nance for expansion, cheaper costs of borrowing) and costs (the
burden of incomes repayments, and a bigger CAD).
UNCORRECTED burden of incomes repayments, and a bigger CAD).
The TOT relates to the ratio of export prices Australia receives from overseas (we
UNCORRECTED
The TOT relates to the ratio of export prices Australia receives from overseas (we are mostly price takers), relative to the prices we pay for imports. A fall in the TOT means that Australia is
UNCORRECTED
are mostly price takers), relative to the prices we pay for imports. A fall in the TOT means that Australia is trading under relatively less favourable conditions because we are receiving relatively lower prices against
UNCORRECTED
trading under relatively less favourable conditions because we are receiving relatively lower prices against those we pay for imports. Here, a given quantity of exports will purchase a smaller quantity of imports, so
UNCORRECTED
those we pay for imports. Here, a given quantity of exports will purchase a smaller quantity of imports, so we are not as well off.
UNCORRECTED
we are not as well off.
UNCORRECTED
ement:
UNCORRECTED
ement: The TOT is measured by means of an index where the base year equals 100 points.
UNCORRECTED
The TOT is measured by means of an index where the base year equals 100 points.
UNCORRECTED
UNCORRECTED
UNCORRECTED PAGE CAD (a large savings–investment
PAGE CAD (a large savings–investment gap, rising oil prices, drought, high production costs and poor international competitiveness).
PAGE gap, rising oil prices, drought, high production costs and poor international competitiveness).
NFD represents the excess of what Australia owes the rest of the world against what the
PAGE NFD represents the excess of what Australia owes the rest of the world against what the
world owes us. It implies there will be interest payments as well as the repayment of the borrowed capital.
PAGE world owes us. It implies there will be interest payments as well as the repayment of the borrowed capital. Net foreign equity (NFE) is associated with foreign ownership of Australian assets (such as shares and
PAGE Net foreign equity (NFE) is associated with foreign ownership of Australian assets (such as shares and
(government sector) and PAGE
(government sector) and non-of�cialPAGE
non-of�cial Various factors account for our large NFD. These include the rise in of�cial debt (due to a large PAGE
Various factors account for our large NFD. These include the rise in of�cial debt (due to a large
PROOFS The CAD represents the excess of total debits over total credits on the BOP current account
PROOFS The CAD represents the excess of total debits over total credits on the BOP current account (made up of net goods, net services, net primary income and net secondary income). Australia runs a
PROOFS(made up of net goods, net services, net primary income and net secondary income). Australia runs a
The size of Australia’s CAD is determined by both aggregate demand and aggregate supply
PROOFS The size of Australia’s CAD is determined by both aggregate demand and aggregate supply
domestic demand-side conditions (due to locally stronger consumer and business con�dence
PROOFSdomestic demand-side conditions (due to locally stronger consumer and business con�dence
and rising disposable incomes), and weaker spending from abroad (due to a slowdown in economic
PROOFSand rising disposable incomes), and weaker spending from abroad (due to a slowdown in economic activity or a drop in the TOT), usually lead to increased imports and decreased exports, and hence a
PROOFSactivity or a drop in the TOT), usually lead to increased imports and decreased exports, and hence a
CAD (a large savings–investment PROOFS
CAD (a large savings–investment gap, rising oil prices, drought, high production costs and poor international competitiveness).PROOFS
gap, rising oil prices, drought, high production costs and poor international competitiveness).

198 Economics Down Under 2
c03AustraliaAndTheWorldEconomy 198 29 August 2016 1:07 PM
• Determinants. Being a �oating exchange rate, the price of the A$ is determined by the forces of demand for the A$ (as affected by international commodity prices and the terms of trade, overseas economic activity, our in�ation rate) and the supply of the A$ (as affected by our levels of imports, local con�dence and economic activity, interest repayments on foreign debt) in the foreign exchange market at equilibrium.
• Measures. The TWI measures the average exchange rate, but there are also separate rates for every currency in the world. As the exchange rate appreciates or depreciates, it can have both good and bad effects on individual companies and the overall economy.
• Effects. Changes in the A$ have both good and bad effects for particular groups in our economy. The exchange rate can affect the cost/price and value of exports, the cost/price and value of imports, and the size of the CAD. It also affects the achievement of the Australian government’s key domestic macroeconomic goals by affecting the levels of AD (via changes in X and M), the in�ation rate, the rate of economic growth (GDP), and employment and unemployment rates.
• An appreciation of the A$ tends to reduce the value of exports/credits relative to imports/debits and increase the CAD. It also slows the growth in AD. This tends to weaken economic activity, reducing in�ation and economic growth, and causing a rise in unemployment.
• A depreciation of the A$ tends to increase the value of exports/credits relative to imports/debits, and decrease the CAD. It also stimulates AD and economic activity, and so tends to accelerate in�ation and economic growth while reducing unemployment.
Factors that may in�uence Australia’s international competitiveness
• International competitiveness refers to the ability of a nation’s businesses to sell goods and services at an attractive price here at home and also abroad, without special government assistance or protection.
• Trends: Recently, Australia’s international competitiveness ranking has decreased against various countries. We have become less internationally competitive according to some measures.
• Determinants: A nation’s competitiveness is affected by many factors including: – the relative production costs (including wages) for businesses – productivity growth – the availability of natural resources – the exchange rate – relative rates of in�ation – innovation and R&D – the relative rate of company tax – government subsidies.
Effects of trade liberalisation on Australia’s international competitiveness, domestic macroeconomic goals and living standards
• De�nition of trade liberalisation: Trade liberalisation involves the government policy of gradually reducing the level of protection of local industries. For Australia, trade liberalisation since the early 1970s, and especially since the early 1990s, has involved: – cutting all tariffs (the general rate is now 5 per cent or less) – reducing the overall value of government subsidies to local �rms – abolishing import quotas – signing more bilateral FTAs (10 by early 2016).
• Free trade means no protection of local industry and is the opposite of protectionism. • Effect of trade liberalisation on Australia’s international competitiveness: Trade liberalisation should help
increase our international competitiveness by forcing businesses to use resources most ef�ciently in areas of comparative cost advantage. It also forces �rms to restructure and cut production costs, and allows them to gain better economies of large-scale production by selling in bigger markets.
• Effect of trade liberalisation on domestic macroeconomic goals: It increases ef�ciency in the use of resources and promotes stiffer competition. As a result: – It can slow cost in�ation pressures by helping to lift ef�ciency and lower production costs – It can strengthen economic growth through greater ef�ciency in the use of resources, restructuring production,
growing access to overseas markets and sales, and increasing economies of large-scale production. – In the long term, it can grow ef�ciency along with markets for goods and services, thereby expanding local businesses and creating more jobs.
• Positive effects of trade liberalisation on the standard of living: Both material and non-material living standards can gain from trade liberalisation: – Material living standards can gain by raising ef�ciency, real per capita GDP, incomes and consumption. – Non-material living standards can gain perhaps by encouraging peace and cooperation through trade relationships, and culturally enriching our lives and experiences.
• Negative effects of trade liberalisation: However, trade liberalisation can present some problems for living standards. It may increase structural unemployment, especially in the short term, increase environmental problems including the depletion of resources, and possibly add to economic instability in countries.
UNCORRECTED Effects of trade liberalisation on Australia’s international competitiveness, domestic macroeconomic
UNCORRECTED Effects of trade liberalisation on Australia’s international competitiveness, domestic macroeconomic
ade liberalisation:
UNCORRECTED ade liberalisation: Trade liberalisation involves the government policy of gradually reducing
UNCORRECTED Trade liberalisation involves the government policy of gradually reducing
the level of protection of local industries. For Australia, trade liberalisation since the early 1970s, and
UNCORRECTED the level of protection of local industries. For Australia, trade liberalisation since the early 1970s, and especially since the early 1990s, has involved:
UNCORRECTED
especially since the early 1990s, has involved:all tariffs (the general rate is now 5 per cent or less)
UNCORRECTED
all tariffs (the general rate is now 5 per cent or less)
UNCORRECTED
the overall value of government subsidies to local �rms
UNCORRECTED
the overall value of government subsidies to local �rmsimport quotas
UNCORRECTED
import quotasmore bilateral FTAs (10 by early 2016).
UNCORRECTED
more bilateral FTAs (10 by early 2016).trade means no protection of local industry and is the opposite of protectionism.
UNCORRECTED
trade means no protection of local industry and is the opposite of protectionism. fect of trade liberalisation on Australia’s international competitiveness:
UNCORRECTED
fect of trade liberalisation on Australia’s international competitiveness:increase our international competitiveness by forcing businesses to use resources most ef�ciently in areas
UNCORRECTED
increase our international competitiveness by forcing businesses to use resources most ef�ciently in areas of comparative cost advantage. It also forces �rms to restructure and cut production costs, and allows them
UNCORRECTED
of comparative cost advantage. It also forces �rms to restructure and cut production costs, and allows them to gain better economies of large-scale production by selling in bigger markets.
UNCORRECTED
to gain better economies of large-scale production by selling in bigger markets.•
UNCORRECTED
• Ef
UNCORRECTED
Effect of trade liberalisation on domestic macroeconomic goals:
UNCORRECTED
fect of trade liberalisation on domestic macroeconomic goals: Effect of trade liberalisation on domestic macroeconomic goals: Ef
UNCORRECTED
Effect of trade liberalisation on domestic macroeconomic goals: Efresources and promotes stiffer competition. As a result:UNCORRECTED
resources and promotes stiffer competition. As a result:–UNCORRECTED
–
PAGE We have become less internationally competitive according to some measures.
PAGE We have become less internationally competitive according to some measures.nation’s competitiveness is affected by many factors including:
PAGE nation’s competitiveness is affected by many factors including:relative production costs (including wages) for businesses
PAGE relative production costs (including wages) for businessesPROOFS
of the A$ tends to reduce the value of exports/credits relative to imports/debits and
PROOFSof the A$ tends to reduce the value of exports/credits relative to imports/debits and
increase the CAD. It also slows the growth in AD. This tends to weaken economic activity, reducing
PROOFSincrease the CAD. It also slows the growth in AD. This tends to weaken economic activity, reducing
of the A$ tends to increase the value of exports/credits relative to imports/debits, and
PROOFSof the A$ tends to increase the value of exports/credits relative to imports/debits, and decrease the CAD. It also stimulates AD and economic activity, and so tends to accelerate in�ation and
PROOFSdecrease the CAD. It also stimulates AD and economic activity, and so tends to accelerate in�ation and
refers to the ability of a nation’s businesses to sell goods and services at an
PROOFS refers to the ability of a nation’s businesses to sell goods and services at an
attractive price here at home and also abroad, without special government assistance or protection.
PROOFSattractive price here at home and also abroad, without special government assistance or protection.
Recently, Australia’s international competitiveness ranking has decreased against various countries. PROOFS
Recently, Australia’s international competitiveness ranking has decreased against various countries. We have become less internationally competitive according to some measures.PROOFS
We have become less internationally competitive according to some measures.nation’s competitiveness is affected by many factors including:PROOFS
nation’s competitiveness is affected by many factors including:
TOPIC 3 Australia and the world economy 199
c03AustraliaAndTheWorldEconomy 199 29 August 2016 1:07 PM
Key termsA depreciation of the exchange rate occurs when the value of a nation’s currency falls against another currency.A subsidy is a cash payment by the government to local producers to help reduce their production costs and
selling price, making them more competitive against imports.A tariff is an indirect tax added onto the price of imports to make them dearer to local consumers and
protect local industries from overseas competition.Absolute cost advantage occurs if a nation is the cheapest or most ef�cient producer of a single good or
service in the world.An appreciation of the exchange rate occurs when the value of a nation’s currency rises against another
currency.An import quota is a government restriction on the quantity of particular goods that can be imported.Balance on current account is equal to the total value of all credits minus the value of all debits for goods,
services, primary incomes and secondary incomes, measured over a period of time.Comparative cost advantage occurs if a nation specialises in a few key areas of production where its cost
advantages are greatest or its disadvantages and opportunity costs are lowest.Current account de�cit (CAD) is when the value of all current account debits exceeds the total value of all current
account credits for goods, services, primary incomes and secondary incomes, measured over a period of time.Current account surplus (CAS) occurs when the total value of all current account credits exceeds the total
value of all current account debits for goods, services, primary incomes and secondary incomes, measured over a period of time.
Cyclical CAD is the rise in the CAD that occurs when there is a rise in AD or spending as a result of strong aggregate demand-side conditions.
Direct investment are capital movements into and out of Australia that involve the establishment, purchase or expansion of companies and other assets.
Dumping refers to the actions of an overseas competitor who sells a good below its cost price, thus damaging local producers.
Economies of large-scale production are reductions in a �rm’s average �xed costs per unit associated with an increase in its production levels, perhaps enabled by trade liberalisation.
Free trade agreements (FTAs) involve two or more nations agreeing to remove various forms of protection of their local industries. They are often seen as bene�cial because countries will be inclined to specialise in areas of comparative cost advantage where opportunity costs are minimised and material living standards maximised.
Free trade involves abolishing protection of local industry by removing tariffs, subsidies and import quotas, thereby forcing local �rms to become more internationally competitive.
International competitiveness means that Australian businesses are relatively ef�cient in their use of resources, and can compete or sell their goods and services both here and in markets around the world without relying on government protection. They can sell goods and services of comparable quality at a lower price than overseas rivals.
International specialisation occurs when countries produce only a limited range of goods and services, focusing on those areas where they have the greatest comparative cost advantage.
Labour productivity is commonly measured by the level of GDP per hour worked.Multifactor productivity measures the ef�ciency with which the combined inputs of labour, capital and
natural resources are converted into production.Net errors and omissions is an item that re�ects the inaccuracies in the recording of international
transactions. Its can be positive or negative.Net foreign debt (NFD) is the difference in value between what Australian households, businesses and
governments have borrowed from and owe overseas, minus what Australia has lent or invested abroad. This debt entails paying interest and repaying the capital borrowed at some time in the future.
Net foreign equity (NFE) is the difference in value between foreign-owned Australian assets (such as property, shares and the retained earnings of overseas-owned companies operating here) and overseas assets owned by Australian residents.
Net goods is a subsection of the BOP current account that records the value of credits for goods exported minus the value of debits for goods imported from overseas, measured over a period of time.
Net primary incomes is a subsection of the BOP current account that records the value of credits for primary income received from overseas minus the value of debits for primary income paid to overseas, measured over a period of time.
Net reserve assets involves both RBA and government transactions, and includes foreign currencies, monetary gold, and required contributions to overseas governments and international agencies.
Net secondary incomes is a subsection of the BOP current account that records the value of credits for secondary income received from overseas minus the value of debits for secondary income paid to overseas, measured over a period of time.
UNCORRECTED of their local industries. They are often seen as bene�cial because countries will be inclined to specialise in
UNCORRECTED of their local industries. They are often seen as bene�cial because countries will be inclined to specialise in areas of comparative cost advantage where opportunity costs are minimised and material living standards
UNCORRECTED areas of comparative cost advantage where opportunity costs are minimised and material living standards
involves abolishing protection of local industry by removing tariffs, subsidies and import quotas,
UNCORRECTED involves abolishing protection of local industry by removing tariffs, subsidies and import quotas,
thereby forcing local �rms to become more internationally competitive.
UNCORRECTED thereby forcing local �rms to become more internationally competitive.
means that Australian businesses are relatively ef�cient in their use of
UNCORRECTED means that Australian businesses are relatively ef�cient in their use of
resources, and can compete or sell their goods and services both here and in markets around the world
UNCORRECTED resources, and can compete or sell their goods and services both here and in markets around the world without relying on government protection. They can sell goods and services of comparable quality at a
UNCORRECTED
without relying on government protection. They can sell goods and services of comparable quality at a lower price than overseas rivals.
UNCORRECTED
lower price than overseas rivals. occurs when countries produce only a limited range of goods and services,
UNCORRECTED
occurs when countries produce only a limited range of goods and services, focusing on those areas where they have the greatest
UNCORRECTED
focusing on those areas where they have the greatest is commonly measured by the level of GDP per hour worked.
UNCORRECTED
is commonly measured by the level of GDP per hour worked.Multifactor productivity
UNCORRECTED
Multifactor productivity measures the ef�ciency with which the combined inputs of labour, capital and
UNCORRECTED
measures the ef�ciency with which the combined inputs of labour, capital and natural resources are converted into production.
UNCORRECTED
natural resources are converted into production.Net errors and omissions
UNCORRECTED
Net errors and omissions transactions. Its can be positive or negative.
UNCORRECTED
transactions. Its can be positive or negative.Net foreign debt (NFD)
UNCORRECTED
Net foreign debt (NFD)governments have borrowed from and owe overseas, minus what Australia has lent or invested abroad.
UNCORRECTED
governments have borrowed from and owe overseas, minus what Australia has lent or invested abroad. This debt entails paying interest and repaying the capital borrowed at some time in the future.UNCORRECTED
This debt entails paying interest and repaying the capital borrowed at some time in the future.Net foreign equity (NFE)UNCORRECTED
Net foreign equity (NFE)
PAGE are capital movements into and out of Australia that involve the establishment, purchase
PAGE are capital movements into and out of Australia that involve the establishment, purchase
refers to the actions of an overseas competitor who sells a good below its cost price, thus
PAGE refers to the actions of an overseas competitor who sells a good below its cost price, thus
are reductions in a �rm’s average �xed costs per unit associated with
PAGE are reductions in a �rm’s average �xed costs per unit associated with
an increase in its production levels, perhaps enabled by trade liberalisation.
PAGE an increase in its production levels, perhaps enabled by trade liberalisation.
involve two or more nations agreeing to remove various forms of protection PAGE involve two or more nations agreeing to remove various forms of protection
of their local industries. They are often seen as bene�cial because countries will be inclined to specialise in PAGE
of their local industries. They are often seen as bene�cial because countries will be inclined to specialise in areas of comparative cost advantage where opportunity costs are minimised and material living standards PAGE
areas of comparative cost advantage where opportunity costs are minimised and material living standards
PROOFS occurs if a nation specialises in a few key areas of production where its cost
PROOFS occurs if a nation specialises in a few key areas of production where its cost
the total value of all current
PROOFSthe total value of all current account credits for goods, services, primary incomes and secondary incomes, measured over a period of time.
PROOFSaccount credits for goods, services, primary incomes and secondary incomes, measured over a period of time.
exceeds
PROOFSexceeds the total
PROOFSthe total
value of all current account debits for goods, services, primary incomes and secondary incomes, measured
PROOFSvalue of all current account debits for goods, services, primary incomes and secondary incomes, measured
is the rise in the CAD that occurs when there is a rise in AD or spending as a result of strong
PROOFS is the rise in the CAD that occurs when there is a rise in AD or spending as a result of strong
are capital movements into and out of Australia that involve the establishment, purchase PROOFS
are capital movements into and out of Australia that involve the establishment, purchase

200 Economics Down Under 2
c03AustraliaAndTheWorldEconomy 200 29 August 2016 1:07 PM
Net services is a subsection of the BOP current account that records the value of credits for services exported minus the value of debits for services imported from overseas, measured over a period of time.
Non-of�cial debt represents borrowing overseas by Australian businesses to �nance expansion.Of�cial debt represents borrowing by the government, perhaps to �nance budget de�cits.Portfolio investment involves money transactions into and out of Australia involving shares, debt and
securities.Productivity relates to ef�ciency or the level of output gained from a given quantity of inputs or resources. Structural CAD is an ongoing de�cit on the current account resulting from structural or supply-side
problems, including our lack of national savings, high production costs and poor international competitiveness.
The balance of payments account (BOP) is an annual statistical record of Australia’s �nancial transactions with the rest of the world. In turn, these transactions are divided into two main types of transactions — current transactions, and transactions involving the capital and �nancial accounts, each recording credit and debit transactions.
The balance on capital account is a subsection in the BOP capital and �nancial accounts. It records the total value of credits minus the total value of debits for capital transfers and other intangible assets.
The balance on �nancial account is a subsection in the BOP capital and �nancial accounts. It mainly records international transactions involving the movement of money capital or investment, as well as the dealings of the Reserve Bank of Australia (RBA).
The exchange rate is the number of units of another currency that can be purchased with or swapped for one unit of our currency.
The foreign exchange market is where currencies are swapped or converted into other currencies.The national savings–investment gap is the shortfall in value between what Australian households, �rms
and governments save and the level of their investment. This must be covered by overseas borrowing or debt.
The terms of trade (TOT) represents the ratio of the export prices we receive to the import prices we pay.The trade weighted index (TWI) is a general measure of Australia’s exchange rate. It represents the value
of our dollar against a basket of foreign currencies, each weighted according to their relative importance to Australia’s trade.
Trade liberalisation is a government policy that entails reducing protection of local industry by cutting tariffs, subsidies and import quotas, and the signing of FTAs.
Trade protection is a government policy that involves using high tariffs, import quotas and subsidies to local producers to support local industry so that it can compete with imports.
UNCORRECTED tariffs, subsidies and import quotas, and the signing of FTAs.
UNCORRECTED tariffs, subsidies and import quotas, and the signing of FTAs.is a government policy that involves using high tariffs, import quotas and subsidies to local
UNCORRECTED is a government policy that involves using high tariffs, import quotas and subsidies to local producers to support local industry so that it can compete with imports.
UNCORRECTED producers to support local industry so that it can compete with imports.
PAGE and governments save and the level of their investment. This must be covered by overseas borrowing or
PAGE and governments save and the level of their investment. This must be covered by overseas borrowing or
represents the ratio of the export prices we receive to the import prices we pay.
PAGE represents the ratio of the export prices we receive to the import prices we pay.
is a general measure of Australia’s exchange rate. It represents the value
PAGE is a general measure of Australia’s exchange rate. It represents the value
of our dollar against a basket of foreign currencies, each weighted according to their relative importance to
PAGE of our dollar against a basket of foreign currencies, each weighted according to their relative importance to
is a government policy that entails reducing protection of local industry by cutting PAGE is a government policy that entails reducing protection of local industry by cutting
tariffs, subsidies and import quotas, and the signing of FTAs.PAGE
tariffs, subsidies and import quotas, and the signing of FTAs.
PROOFScurrent transactions, and transactions involving the capital and �nancial accounts, each recording credit
PROOFScurrent transactions, and transactions involving the capital and �nancial accounts, each recording credit
is a subsection in the BOP capital and �nancial accounts. It records the total
PROOFSis a subsection in the BOP capital and �nancial accounts. It records the total the total value of debits for capital transfers and other intangible assets.
PROOFSthe total value of debits for capital transfers and other intangible assets.is a subsection in the BOP capital and �nancial accounts. It mainly
PROOFSis a subsection in the BOP capital and �nancial accounts. It mainly
records international transactions involving the movement of money capital or investment, as well as the
PROOFSrecords international transactions involving the movement of money capital or investment, as well as the
is the number of units of another currency that can be purchased with or swapped for one
PROOFSis the number of units of another currency that can be purchased with or swapped for one
is where currencies are swapped or converted into other currencies.
PROOFS
is where currencies are swapped or converted into other currencies.is the shortfall in value between what Australian households, �rms PROOFS
is the shortfall in value between what Australian households, �rms and governments save and the level of their investment. This must be covered by overseas borrowing or PROOFS
and governments save and the level of their investment. This must be covered by overseas borrowing or


