
Autonomous fixed station measurements and synoptic spatial characterization provide insights into dynamics of organic matter, nutrients and algal pigments in the SF Bay-Delta
Bryan Downing, Brian Bergamaschi, Brian Pellerin, Tamara Kraus, Elizabeth Stumpner, Scott Nagel, Katy O’Donnell, Amy Story, John Franco Saraceno, Travis von Dessonneck and Roger Fujii, and many others.
2014 Bay-Delta Mtg Tuesday, October 28, 2014 @3:35 pm Room
Overarching Monitoring Goals
I. Assess and improve methods to better explain water quality conditions.
II. Characterization and interpretation of spatial and temporal patterns of nutrient and phytoplankton conditions.
III. Support other research activities through availability of consistent and scientifically valid time series.
• When, where and why does phytoplankton production occur in the CSC?
• How are nutrient, DOM, and particle dynamics affected by increased flows and changes in source waters in the CSC?
• Does the CSC act as a subsidy for dissolved and particulate material to the rest of the estuary?
• Is particle composition related to physical dynamics such as flow and turbulence?
Assessing Habitat Conditions
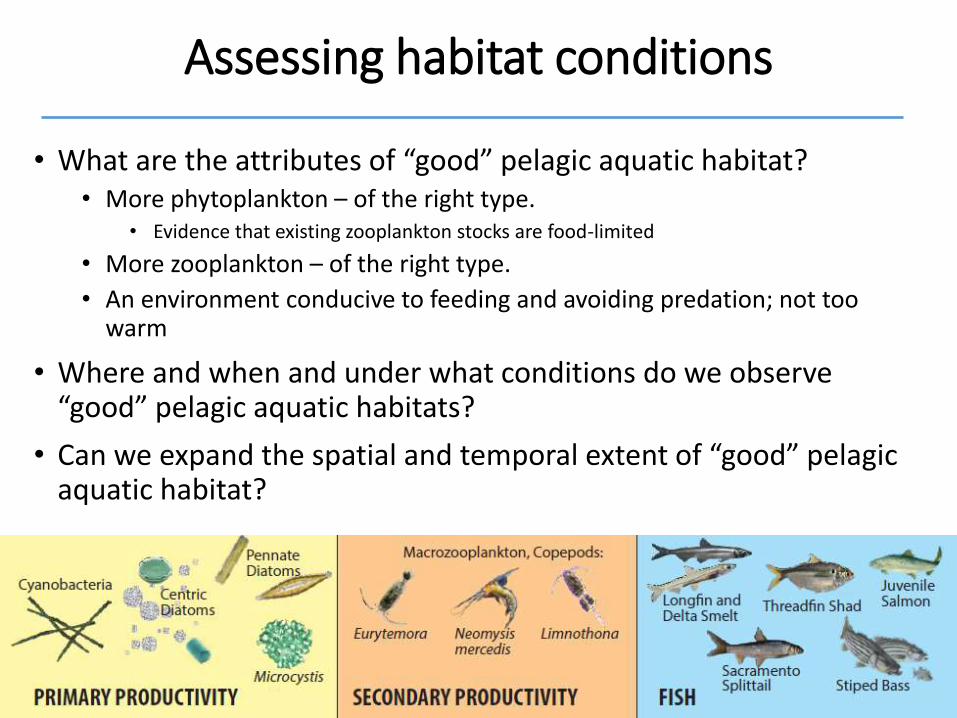
Assessing habitat conditions
• What are the attributes of “good” pelagic aquatic habitat? • More phytoplankton – of the right type.
• Evidence that existing zooplankton stocks are food-limited
• More zooplankton – of the right type.
• An environment conducive to feeding and avoiding predation; not too warm
• Where and when and under what conditions do we observe “good” pelagic aquatic habitats?
• Can we expand the spatial and temporal extent of “good” pelagic aquatic habitat?
Shag
Slo
ugh
Lib
erty
Cu
t
Stair Step
Little Holland Tract
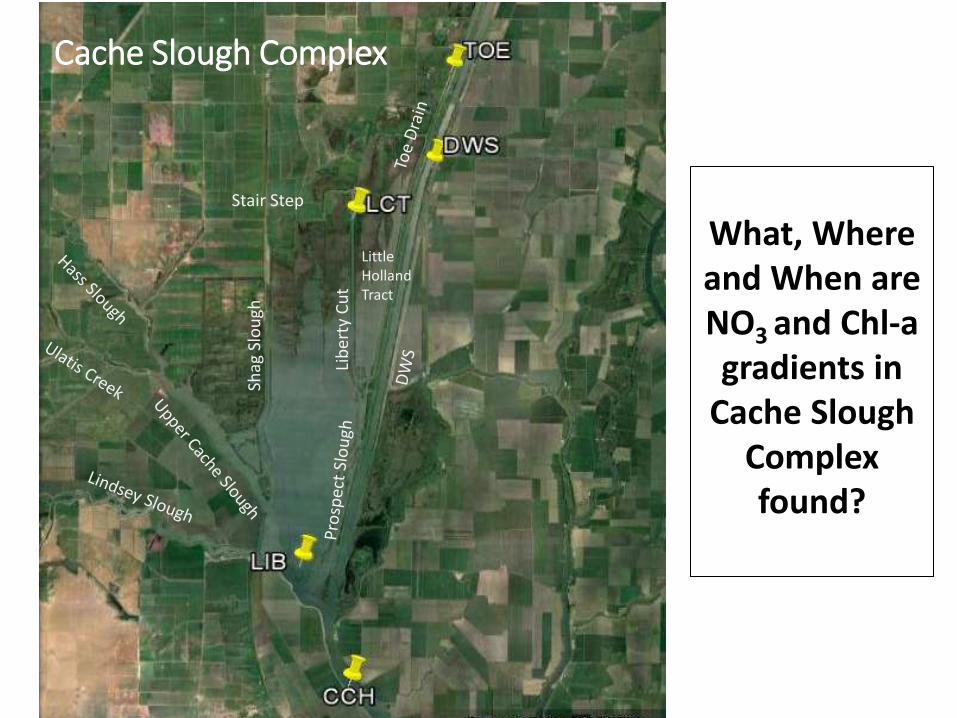
Cache Slough Complex
What, Where and When are NO3 and Chl-a gradients in
Cache Slough Complex found?
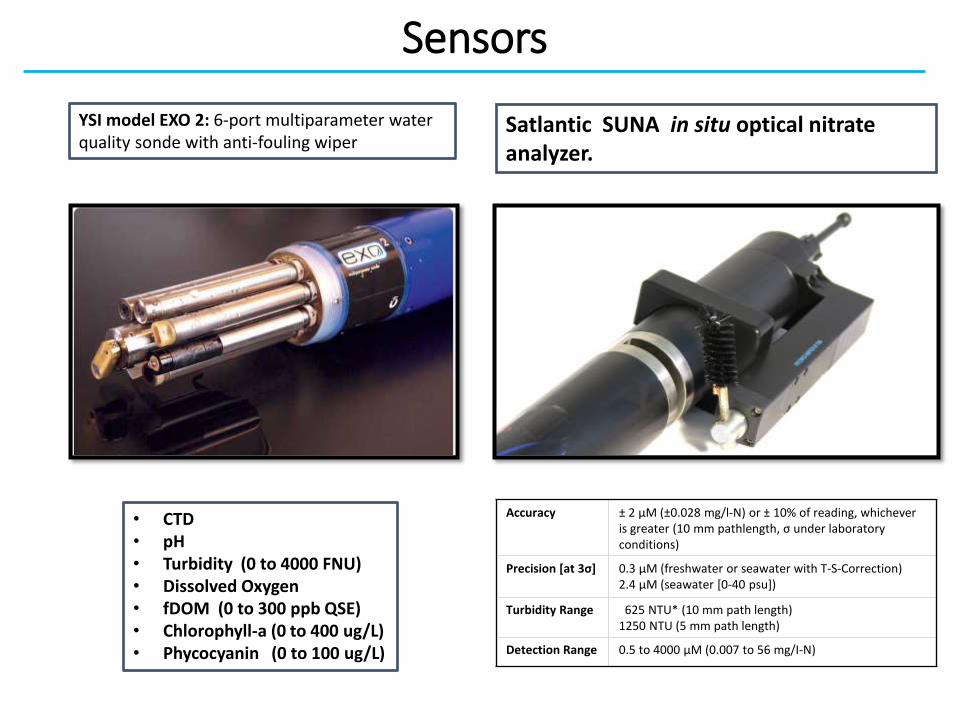
Satlantic SUNA in situ optical nitrate analyzer.
Sensors
Accuracy ± 2 μM (±0.028 mg/l-N) or ± 10% of reading, whichever is greater (10 mm pathlength, σ under laboratory conditions)
Precision [at 3σ] 0.3 μM (freshwater or seawater with T-S-Correction) 2.4 μM (seawater [0-40 psu])
Turbidity Range 625 NTU* (10 mm path length) 1250 NTU (5 mm path length)
Detection Range 0.5 to 4000 μM (0.007 to 56 mg/I-N)
YSI model EXO 2: 6-port multiparameter water quality sonde with anti-fouling wiper
• CTD • pH • Turbidity (0 to 4000 FNU) • Dissolved Oxygen • fDOM (0 to 300 ppb QSE) • Chlorophyll-a (0 to 400 ug/L) • Phycocyanin (0 to 100 ug/L)

Continuous monitoring at flow stations
7
monitoring at flow stations
USGS 381443121405701, LIBERTY ISLAND AT HASTINGS TRACT
thli. .... P'-••™..,......,!9d10,_,_,...__. ........ i. .... ~--a""" ~ .. od niwt ,..._ \9 ..... o COAUCl .-~ ....._ rianoit, ... ~ .... '11-1l'l'31Sl)j0t ..... tlolo," ... _
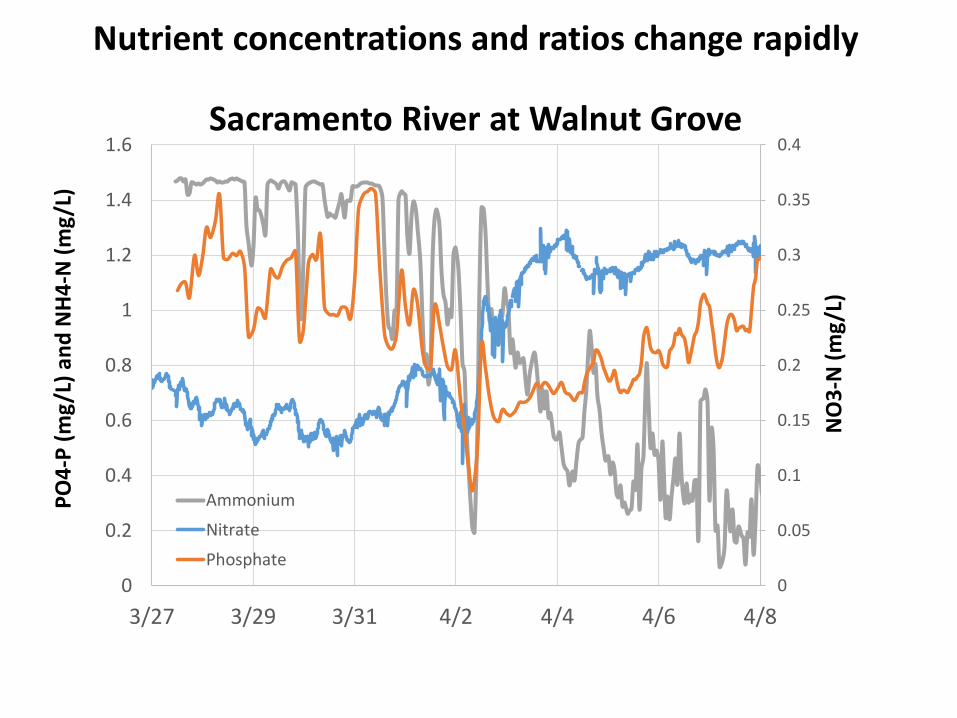
Nutrient concentrations and ratios change rapidly
Sacramento River at Walnut Grove
0
0.05
0.1
0.15
0.2
0.25
0.3
0.35
0.4
0
0.2
0.4
0.6
0.8
1
1.2
1.4
1.6
3/27 3/29 3/31 4/2 4/4 4/6 4/8
Ammonium
Nitrate
Phosphate
PO
4-P
(m
g/L
) an
d N
H4
-N (
mg/
L)
NO
3-N
(m
g/L)

0.1
0.2
0.3
0.4
0.5
0.06
0.07
0.08
0.09
0.1
0.11
6/13/2013 6/23/2013 7/3/2013 7/13/2013 7/23/2013 8/2/2013
NO
3 (m
g/L) P
O4
(m
g/L)
PO4 (mg/L)
Nitrate (mg/L)
Stage
Nitrate and Phosphate dynamics in Cache Slough
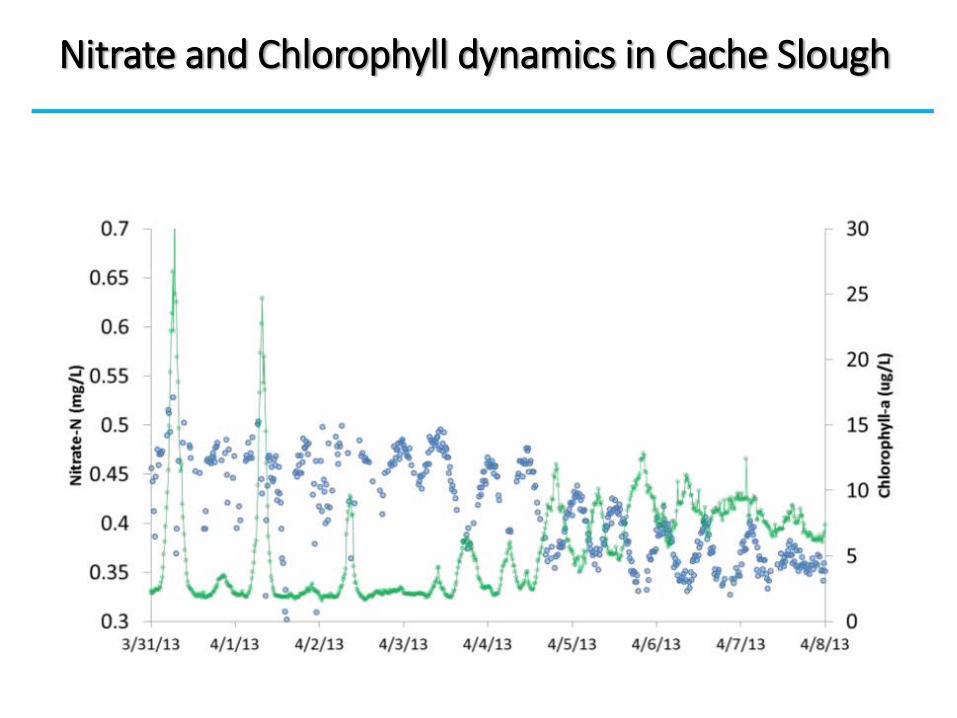
Nitrate and Chlorophyll dynamics in Cache Slough Nitrate and Chlorophyll dynamics in Cache Slough
0.7 l 0.65
0.6 1 ~0.55 "° E -
0.3
0
• • .__
3/31/13 4/ 1/ 13 4/ 2/ 13 4/ 3/ 13 4/ 4/ 13 4/5/13 4/ 6/ 13 4/7/13
- 30
r 25
20 ~ -"° :I -ra •
15 > ~ a.. e .E
10 6
5
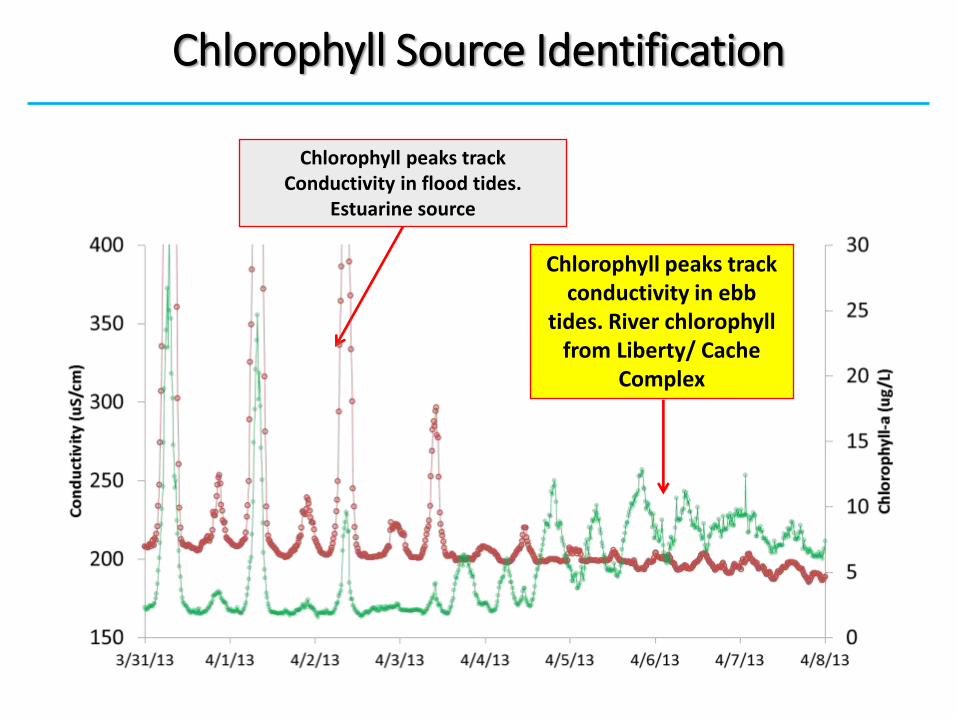
Chlorophyll Source Identification
Chlorophyll peaks track Conductivity in flood tides.
Estuarine source
Chlorophyll peaks track conductivity in ebb
tides. River chlorophyll from Liberty/ Cache
Complex
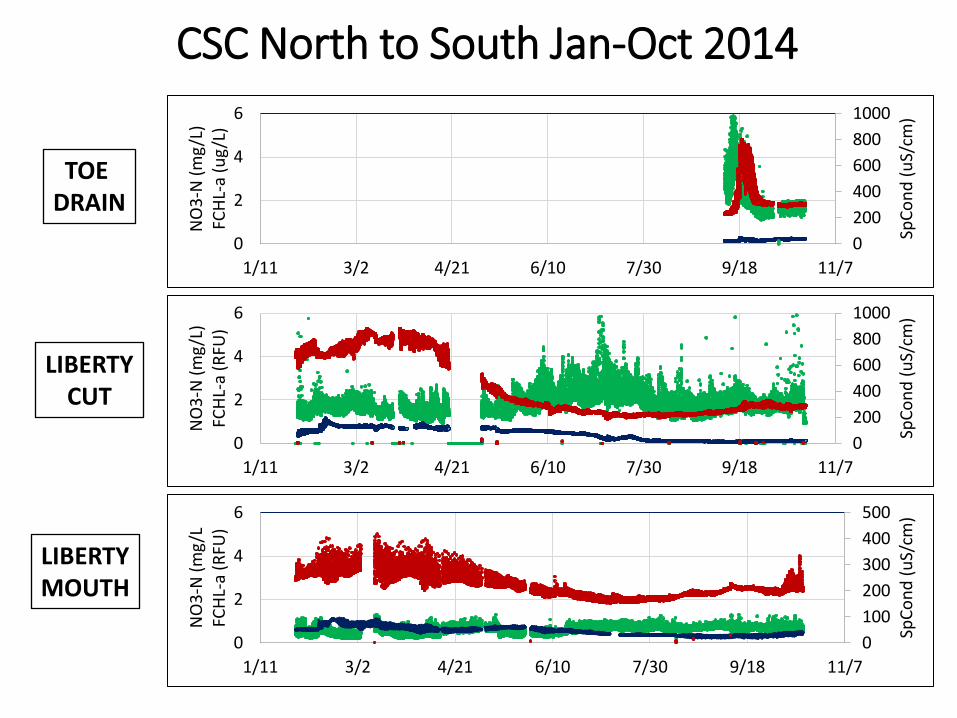
CSC North to South Jan-Oct 2014
0
200
400
600
800
1000
0
2
4
6
1/11 3/2 4/21 6/10 7/30 9/18 11/7
SpC
on
d (
uS/
cm)
NO
3-N
(m
g/L
)
FCH
L-a
(RFU
)
TOE DRAIN
LIBERTY CUT
LIBERTY MOUTH
0
100
200
300
400
500
0
2
4
6
1/11 3/2 4/21 6/10 7/30 9/18 11/7
SpC
on
d (
uS/
cm)
NO
3-N
(m
g/L
FC
HL-
a (R
FU)
0
200
400
600
800
1000
0
2
4
6
1/11 3/2 4/21 6/10 7/30 9/18 11/7
SpC
on
d (
uS/
cm)
NO
3-N
(m
g/L
)
FCH
L-a
(ug
/L)

Panel A and B: 1. Thermosalinograph (Sea-Bird), 2. CDOM fluorometer (WET Labs), 3. Chl-a fluorometer (WET Labs), 4. Transmissometer (WET Labs), 5. ISUS nitrate sensor (Satlantic), 6. Custom fluorometer (WET Labs) Panel C: CR1000 (Campbell Scientific) integrated into the data collection platform
Spatial mapping using underway measurements
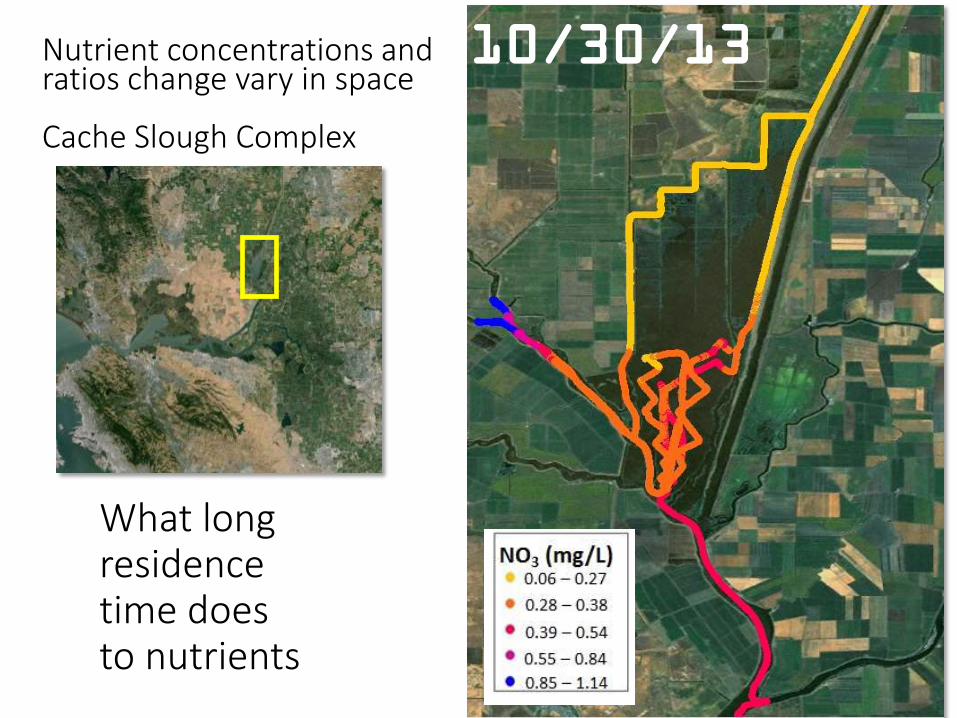
What long residence time does to nutrients
Nutrient concentrations and ratios change vary in space Cache Slough Complex
10/30/13
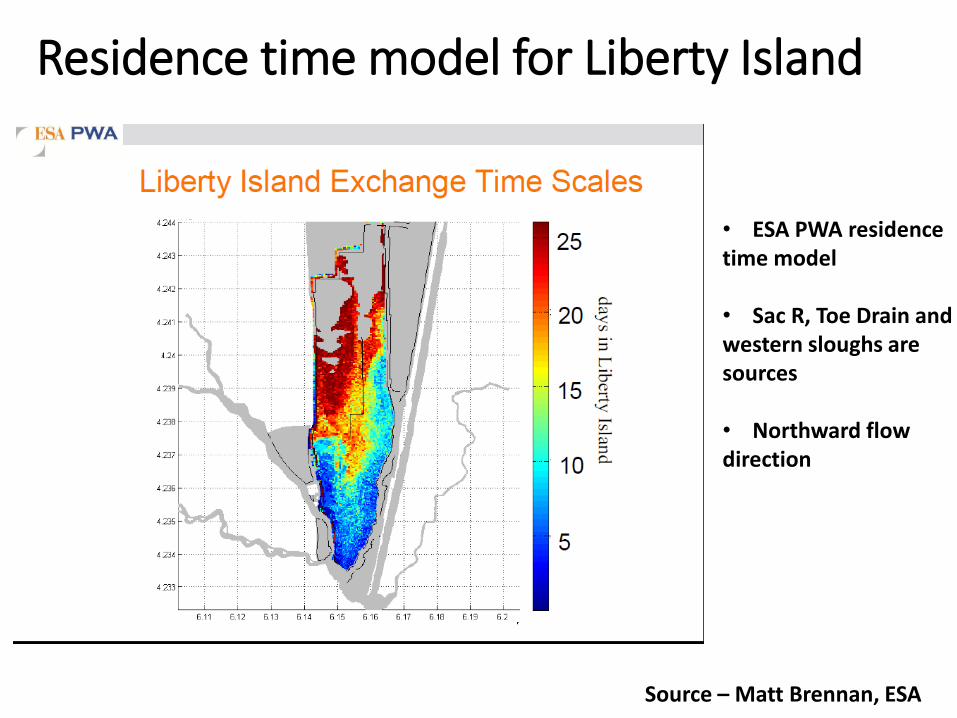
Residence time model for Liberty Island
• ESA PWA residence time model • Sac R, Toe Drain and western sloughs are sources • Northward flow direction
Source – Matt Brennan, ESA

Spatial Mapping & Fixed Stations NO3 (mg/L) 5/14
LIB
DWS
LCT
CCH
ISUS
0.10 - 0.50
0.51 - 0.75
0.76 - 0.85
0.86 - 1.00
1.01 - 2.00

LCT
LIB
CCH
DWS
Spatial Mapping & Fixed Stations Chl-a (µg/L)
WS_Chl
0.11 - 3.00
3.01 - 5.00
5.01 - 8.00
8.01 - 17.00
17.01 - 38.00
5/14
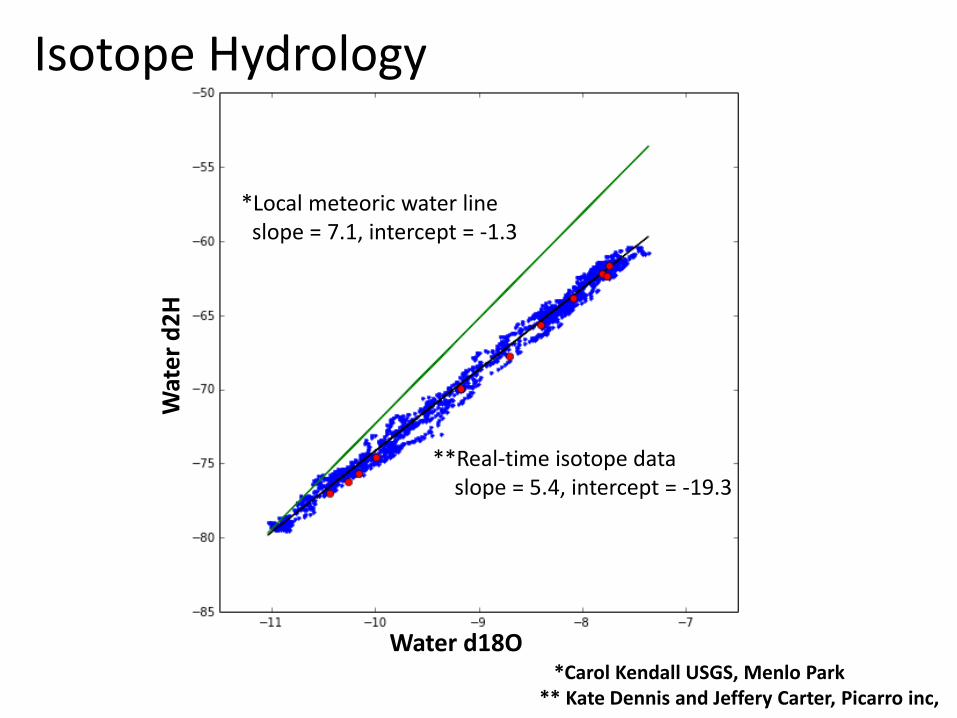
*Local meteoric water line slope = 7.1, intercept = -1.3
**Real-time isotope data slope = 5.4, intercept = -19.3
*Carol Kendall USGS, Menlo Park ** Kate Dennis and Jeffery Carter, Picarro inc,
Isotope Hydrology
Wat
er
d2
H
Water d18O

10/1/14 data
dH_60
-79.56 - -75.00
-74.99 - -71.00
-70.99 - -67.00
-66.99 - -63.00
-62.99 - -60.00
dO_60
-10.77 - -9.75
-9.74 - -8.75
-8.74 - -7.75
-7.74 - -7.00
Data collection: 8:30 – 15:00 High Tide @ 11:15 Low Tide @15:45
ISUS
0.34 - 0.40
0.41 - 0.50
0.51 - 0.60
0.61 - 0.70
0.71 - 0.80
NO3 mg/L d2H d18O
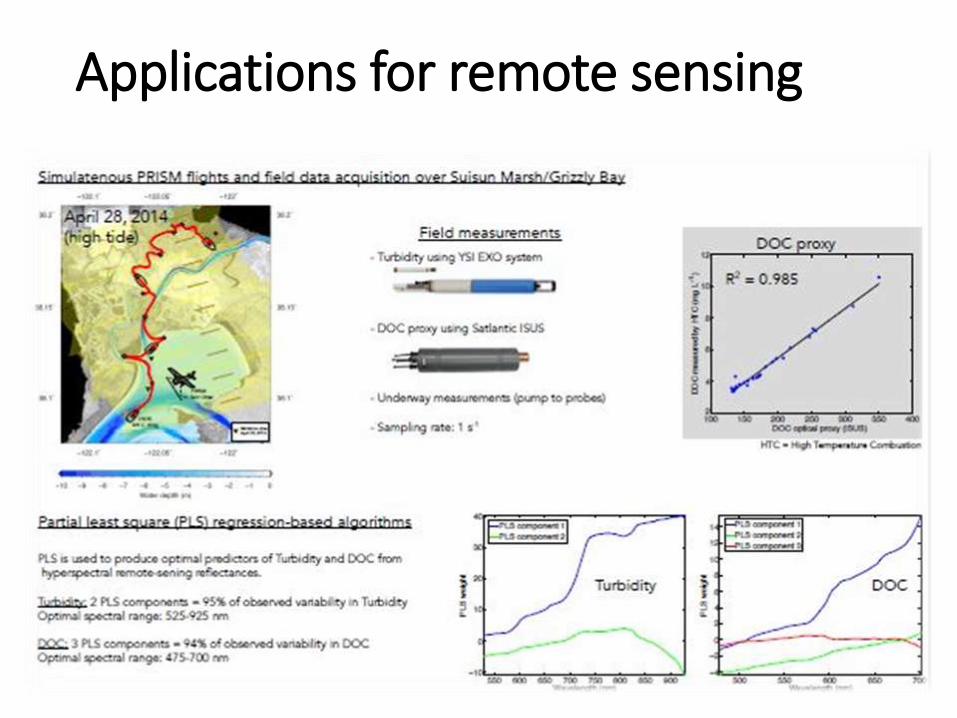
Applications for remote sensing
Conclusions
• Nutrient concentrations change quickly: need continuous high freq. sampling < 1 hour.
• Continuous sampling useful to understand biological processes associated with nutrient cycling.
• Spatial mapping can help us understand links between nutrients and primary production.
• The combined approach provides additional insight in the shallow water habitat of CSC.

Acknowledgements
We thank Erwin Van Nieuwenhuyse / BOR for funding this project. Jon Burau for continued support, hours of advice and fair warnings. Special thanks to Scott Nagel, Paul Kreun, Katy O’Donnell, Angela Hansen and Travis von Dessonneck for technical and lab support.


