
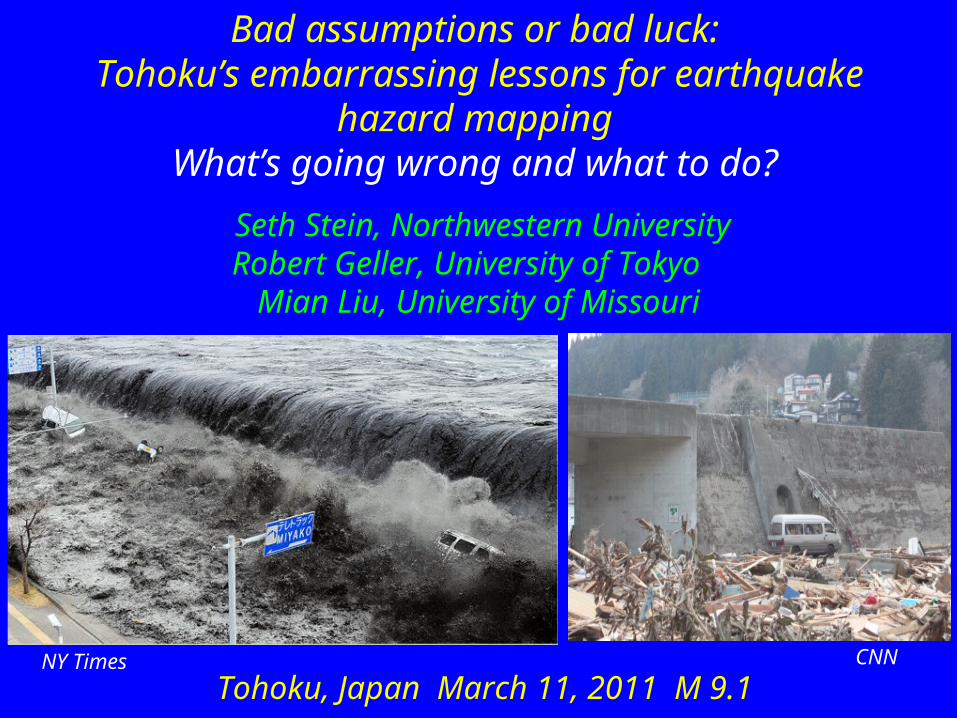
Bad assumptions or bad luck: Tohoku’s embarrassing lessons for
earthquake hazard mappingWhat’s going wrong and what to do?
Tohoku, Japan March 11, 2011 M 9.1NY Times CNN
Seth Stein, Northwestern University Robert Geller, University of Tokyo
Mian Liu, University of Missouri
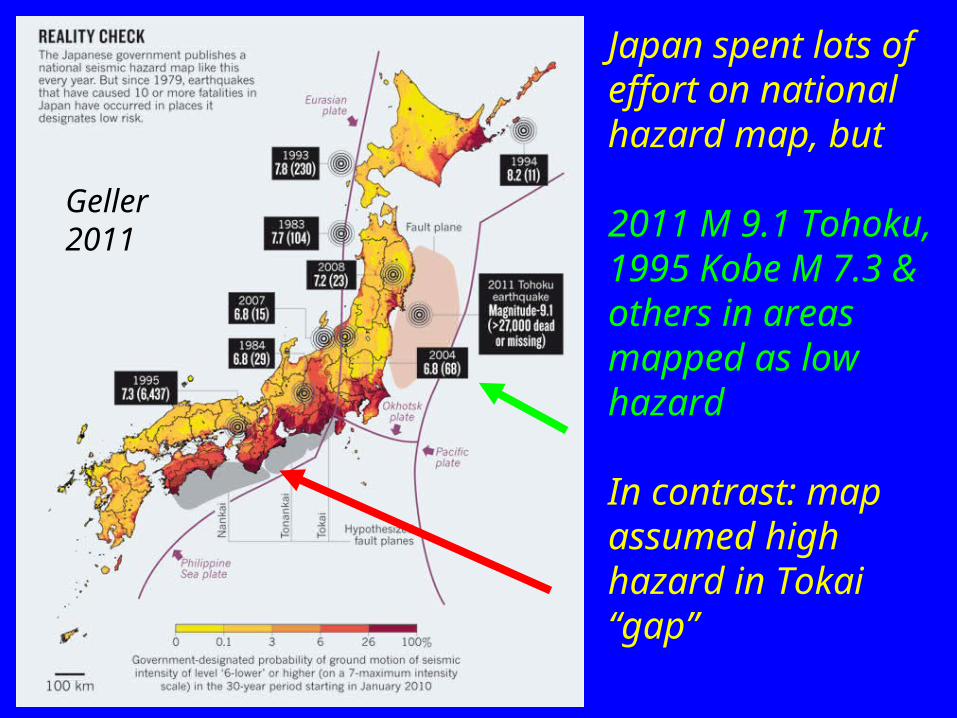
Japan spent lots of effort on national hazard map, but
2011 M 9.1 Tohoku, 1995 Kobe M 7.3 & others in areas mapped as low hazard
In contrast: map assumed high hazard in Tokai “gap”
Geller 2011
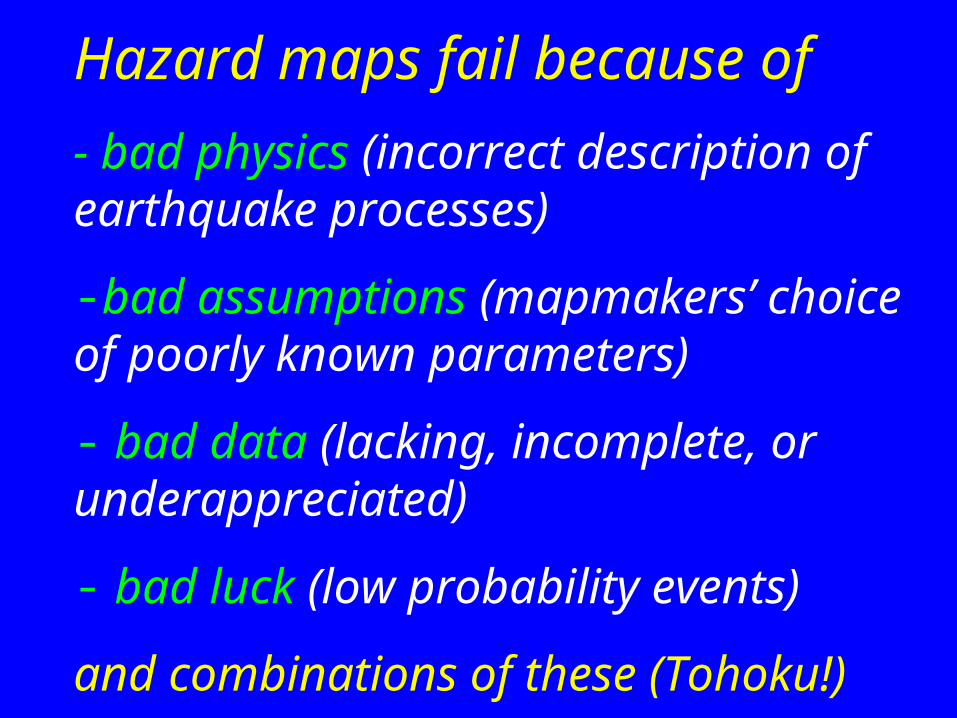
Hazard maps fail because of
- bad physics (incorrect description of earthquake processes)
-bad assumptions (mapmakers’ choice of poorly known parameters)
- bad data (lacking, incomplete, or underappreciated)
- bad luck (low probability events)
and combinations of these (Tohoku!)
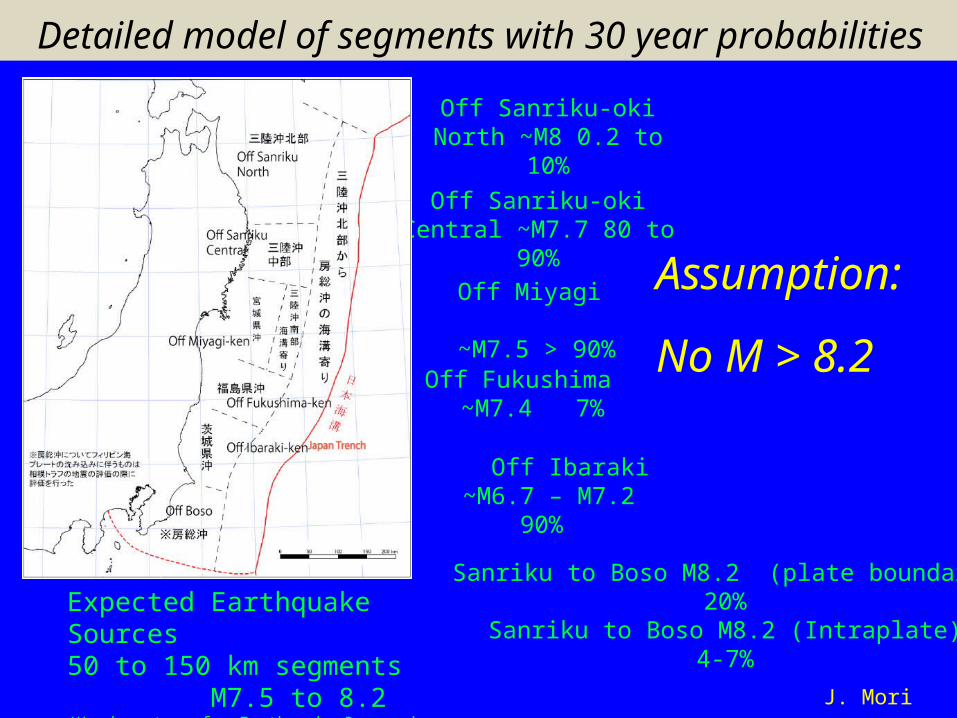
Expected Earthquake Sources 50 to 150 km segments M7.5 to 8.2(Headquarters for Earthquake Research Promotion)
Off Sanriku-oki North ~M8 0.2 to 10%
Off Sanriku-oki Central ~M7.7 80 to 90%
Off Fukushima ~M7.4 7%
Off Ibaraki ~M6.7 – M7.2 90%
Detailed model of segments with 30 year probabilities
Sanriku to Boso M8.2 (plate boundary)20%
Sanriku to Boso M8.2 (Intraplate)4-7%
Off Miyagi ~M7.5 > 90%
J. Mori
Assumption:
No M > 8.2
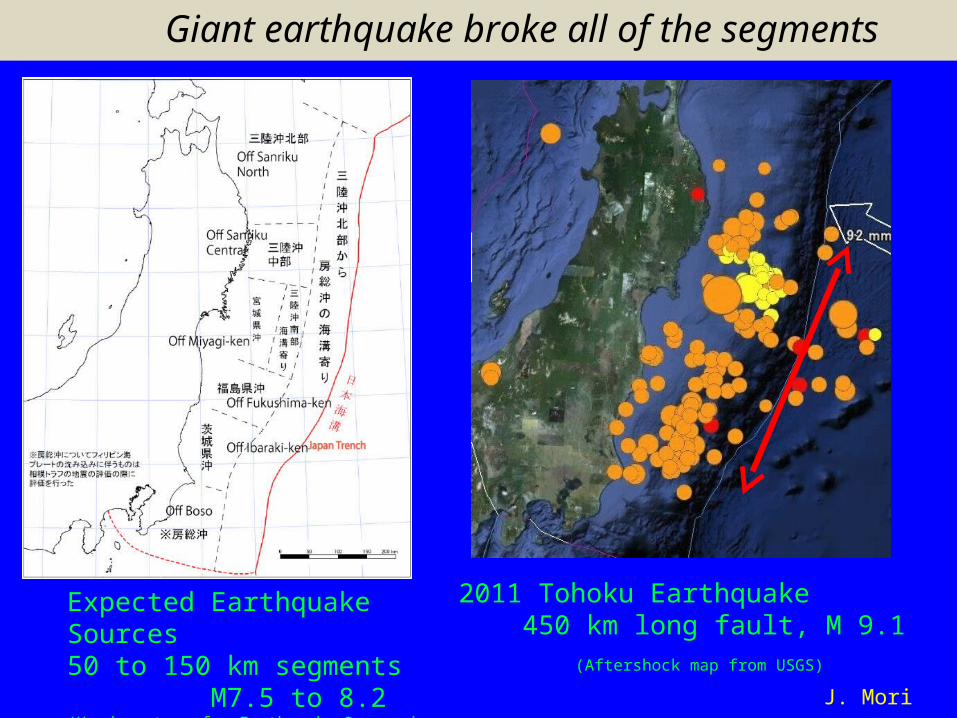
Giant earthquake broke all of the segments
2011 Tohoku Earthquake 450 km long fault, M 9.1 (Aftershock map from USGS)
J. Mori
Expected Earthquake Sources 50 to 150 km segments M7.5 to 8.2(Headquarters for Earthquake Research Promotion)

Tsunami runup approximately twice
fault slip (Plafker, Okal &
Synolakis 2004)
M9 generates much larger tsunami
Planning assumed maximum magnitude 8 Seawalls 5-10 m high
CNN
NYTStein & Okal, 2011
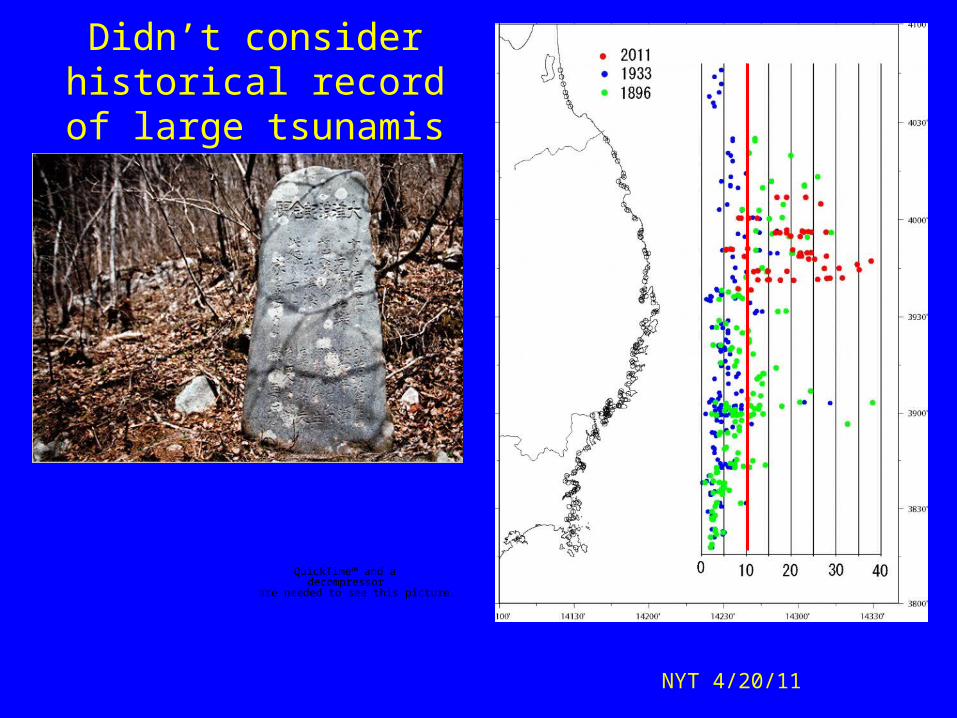
Didn’t consider historical record of large tsunamis
QuickTime™ and a decompressor
are needed to see this picture.
NYT 4/20/11
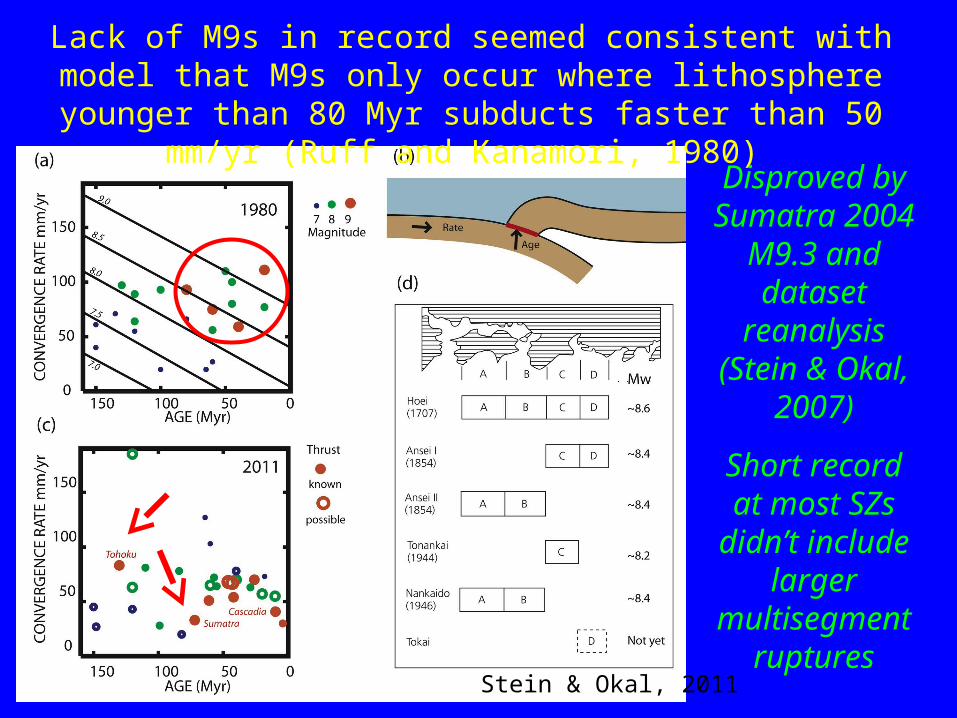
Lack of M9s in record seemed consistent with model that M9s only occur where lithosphere younger than 80 Myr subducts faster than 50
mm/yr (Ruff and Kanamori, 1980) Disproved by Sumatra 2004 M9.3
and dataset
reanalysis (Stein & Okal, 2007)
Short record at most SZs didn’t include larger
multisegment
ruptures
Stein & Okal, 2011
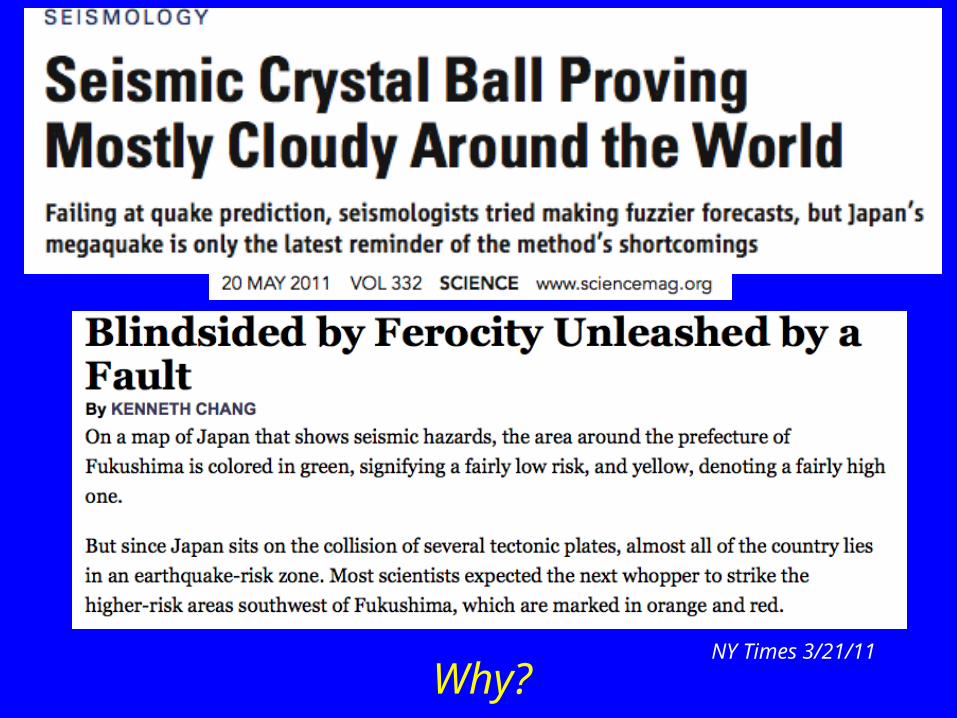
NY Times 3/21/11
Why?

Hazard maps are hard to get right: success depends on accuracy of four assumptions
Where will large earthquakes occur?
When will they occur?
How large will they be?
How strong will their shaking be?
Uncertainty & map failure often result because these are often poorly known
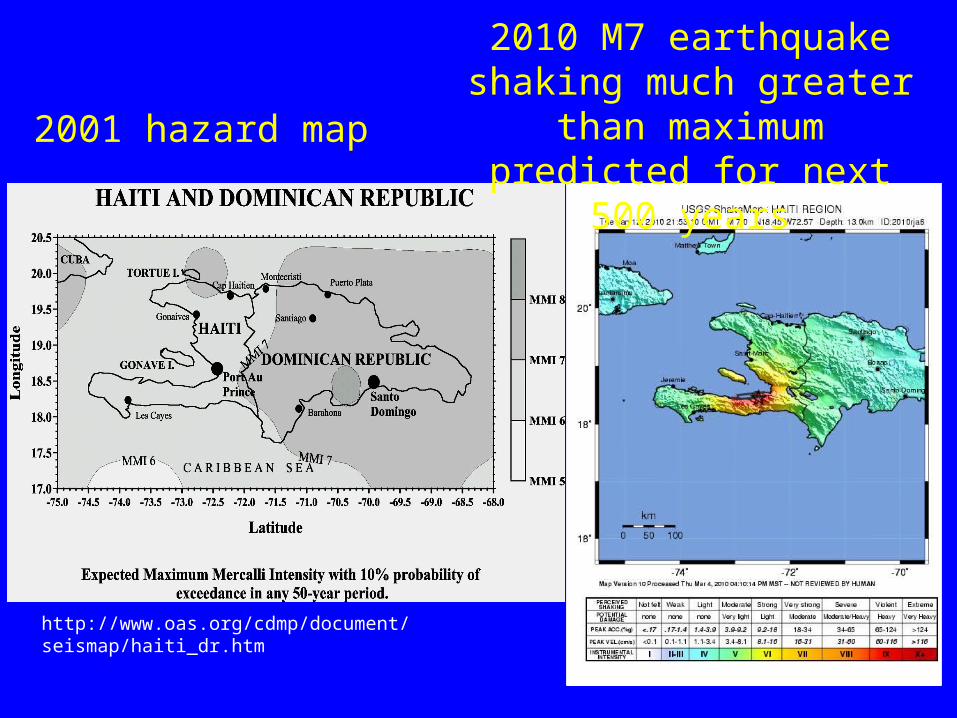
2001 hazard map
http://www.oas.org/cdmp/document/seismap/haiti_dr.htm
2010 M7 earthquake shaking much greater
than maximum predicted for next
500 years

2008 Wenchuan earthquake (Mw 7.9) was not expected: map showed low hazard based on lack of recent
earthquakes
Didn’t use GPS data showing 1-2 mm/yr (~ Wasatch)
Earthquakes prior to the 2008 Wenchuan event
Aftershocks of the Wenchuan event delineating the rupture zone
QuickTime™ and a decompressor
are needed to see this picture.
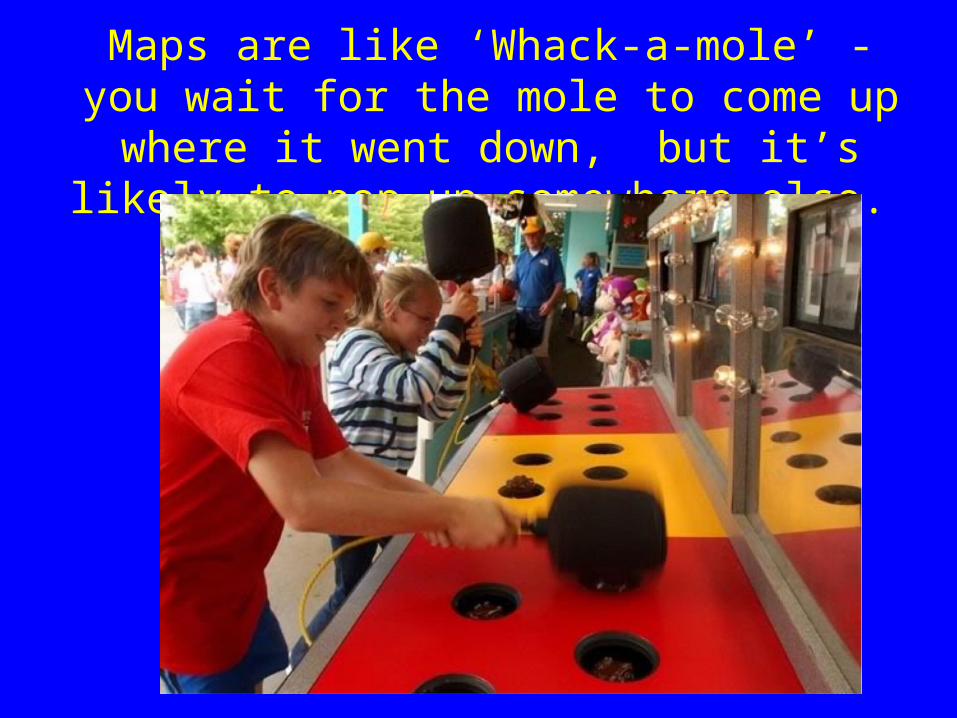
Maps are like ‘Whack-a-mole’ - you wait for the mole to come up where it went down, but it’s
likely to pop up somewhere else.

What to doContinue research on fundamental scientific questions (partly UNAVCO’ community’s job!)
Realistically assess map uncertainties and present them to help users decide how much credence to place in maps
Develop methods to objectively test hazard maps and guide future improvements

Comparing map predictions shows the large uncertainties (~3X) resulting from different
assumptions
Shows uncertainties without subjective weighting
Stein et al, 2012

Testing analogy: evidence-based medicine objectively evaluates widely used treatments, often with embarrassing
results
Although more than 650,000 arthroscopic knee surgeries at a cost of roughly $5,000 each were being performed each year, a controlled experiment showed that "the outcomes were no
better than a placebo procedure."
QuickTime™ and a decompressor
are needed to see this picture.

Bad luck or bad map?
Compare maximum acceleration observed to that predicted by both map and null hypotheses.
A simple null hypothesis is regionally uniformly distributed hazard.
Japanese map seems to be doing worse than this null hypothesis.
Geller 2011
Test maps by comparison to what happened after they were
published.

Avoid biases from new maps made after a large earthquake that
earlier maps missed.
QuickTime™ and a decompressor
are needed to see this picture.
Frankel et al, 2010
Before 2010 Haiti M7 After 2010 Haiti M7
4X

A posteriori changes to a model are "Texas sharpshooting:” shoot at the barn and then draw circles around
the bullet holes.
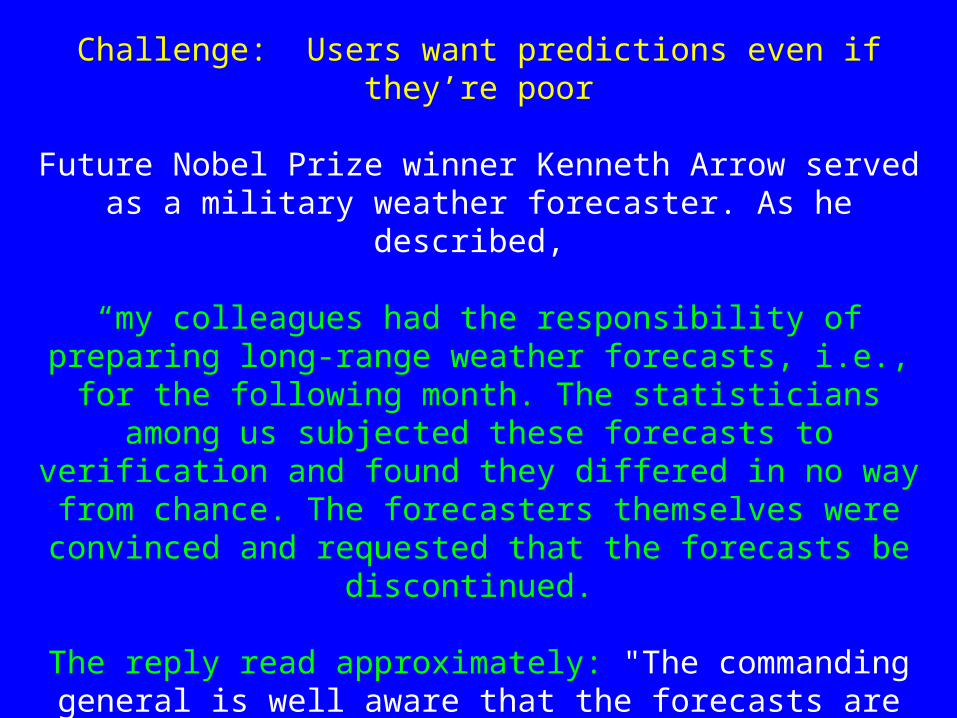
Challenge: Users want predictions even if they’re poor
Future Nobel Prize winner Kenneth Arrow served as a military weather forecaster. As he
described,
“my colleagues had the responsibility of preparing long-range weather forecasts, i.e., for the following month. The statisticians
among us subjected these forecasts to verification and found they differed in no way from chance. The forecasters themselves were convinced and requested that the forecasts be
discontinued.
The reply read approximately: "The commanding general is well aware that the forecasts are no good. However, he needs them for planning
purposes."
Gardner, D., Future Babble: Why Expert Predictions Fail - and Why We Believe Them Anyway, 2010


