
Balanced Mix Design (BMD)
ASPHALT PAVEMENT ASSOCIAT ION OF MICHIGAN (APAM)2017 ASPHALT PAVING CONFERENCE
SHANE BUCHANAN
OLDCASTLE MATERIALS
Discussion Items
Need for Balanced Mix Design Performance Testing Discussion Balanced Mix Design Task Force Activities Agency Practices Related to Balanced Mix Design
Future Work
AMAP | 2017
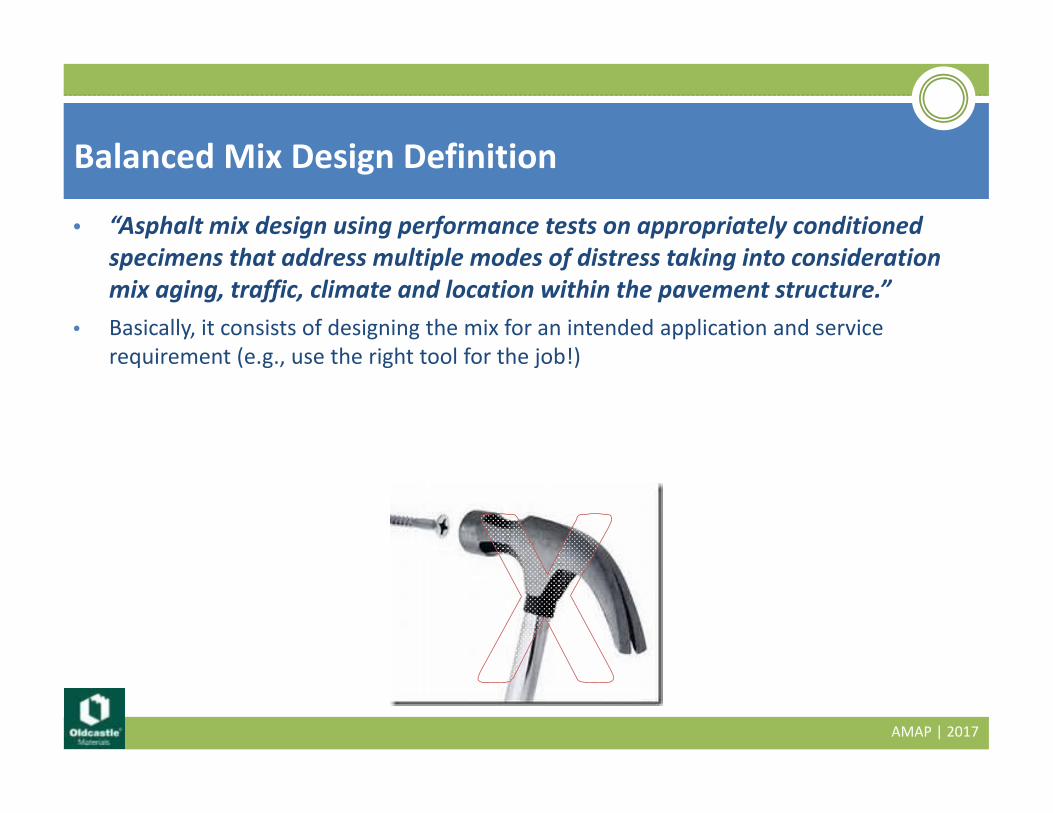
• “Asphalt mix design using performance tests on appropriately conditioned specimens that address multiple modes of distress taking into consideration mix aging, traffic, climate and location within the pavement structure.”
• Basically, it consists of designing the mix for an intended application and service requirement (e.g., use the right tool for the job!)
Balanced Mix Design Definition
AMAP | 2017
Need for Balanced Mix Design
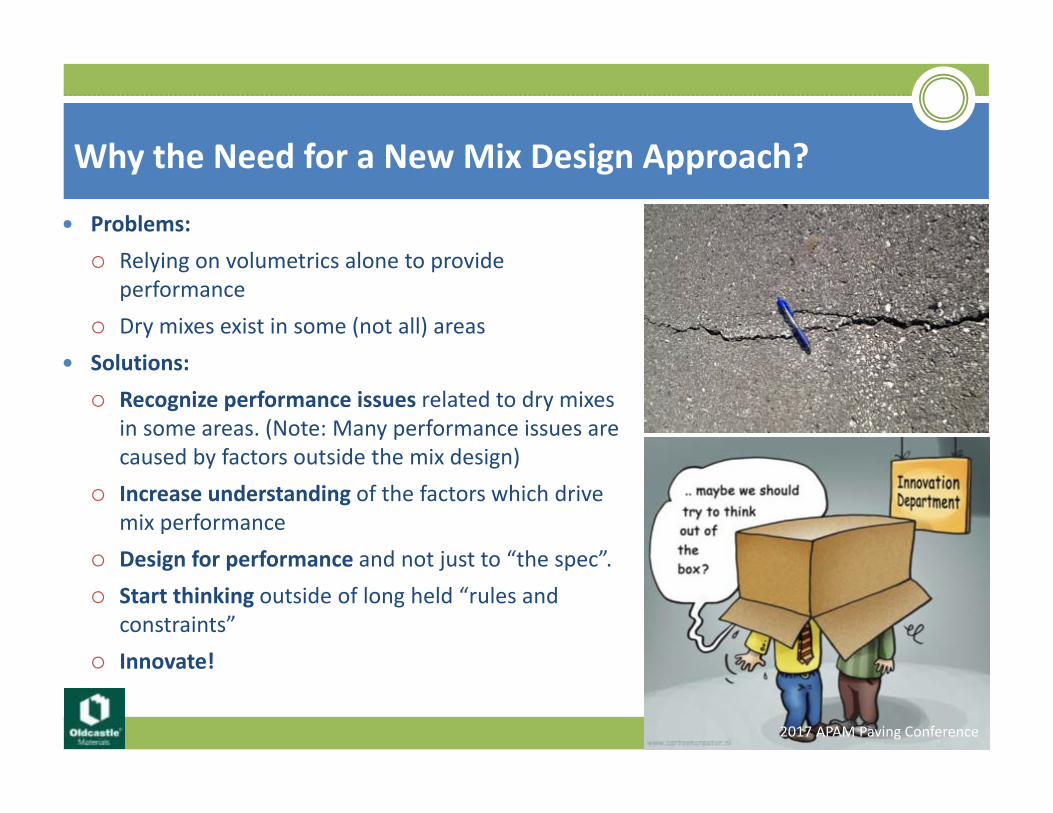
Problems: Relying on volumetrics alone to provide
performance Dry mixes exist in some (not all) areas
Solutions: Recognize performance issues related to dry mixes
in some areas. (Note: Many performance issues are caused by factors outside the mix design)
Increase understanding of the factors which drive mix performance
Design for performance and not just to “the spec”. Start thinking outside of long held “rules and
constraints” Innovate!
Why the Need for a New Mix Design Approach?
2017 APAM Paving Conference
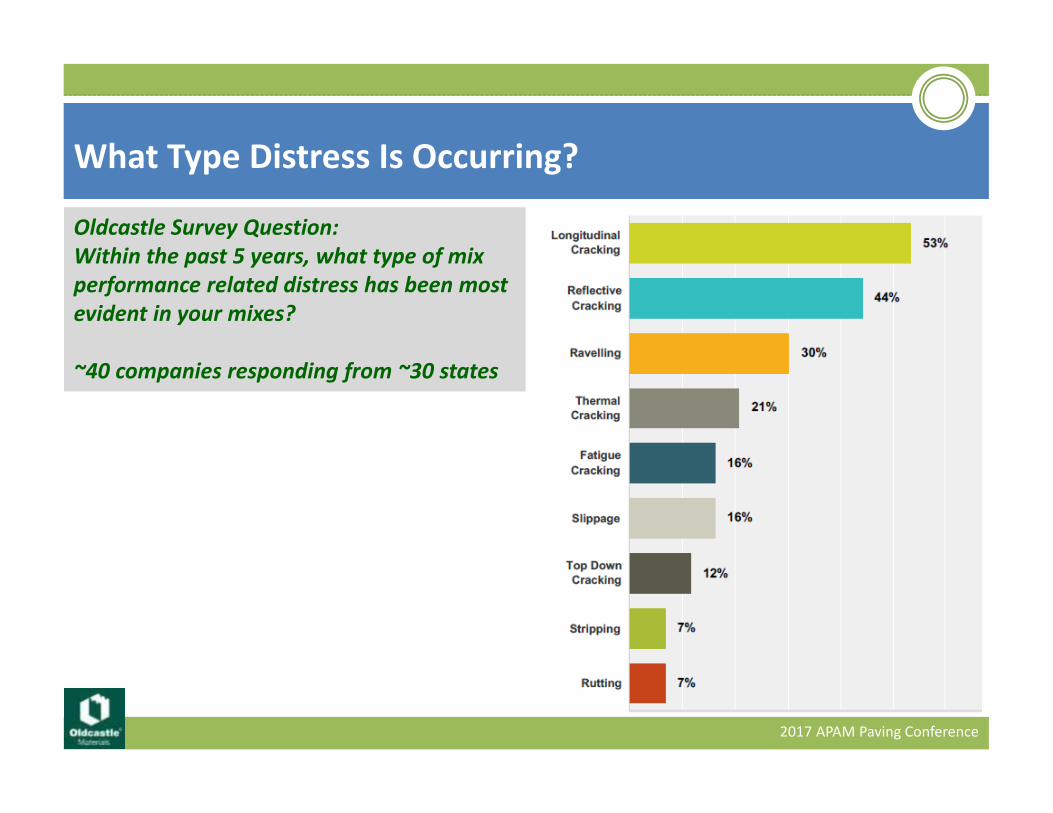
What Type Distress Is Occurring?
Oldcastle Survey Question: Within the past 5 years, what type of mix performance related distress has been most evident in your mixes?
~40 companies responding from ~30 states
Oldcastle Survey Question: Within the past 5 years, what type of mix performance related distress has been most evident in your mixes?
~40 companies responding from ~30 states
2017 APAM Paving Conference
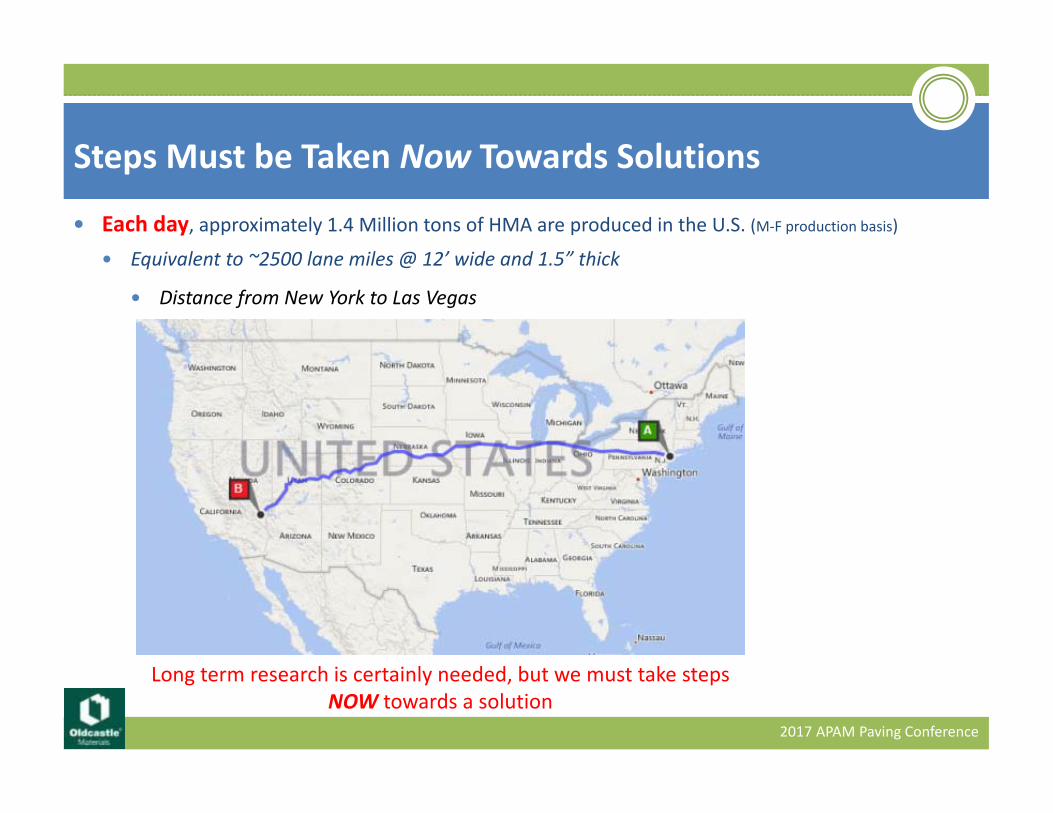
Each day, approximately 1.4 Million tons of HMA are produced in the U.S. (M‐F production basis)
Equivalent to ~2500 lane miles @ 12’ wide and 1.5” thick
Distance from New York to Las Vegas
Steps Must be Taken Now Towards Solutions
Long term research is certainly needed, but we must take steps NOW towards a solution
2017 APAM Paving Conference
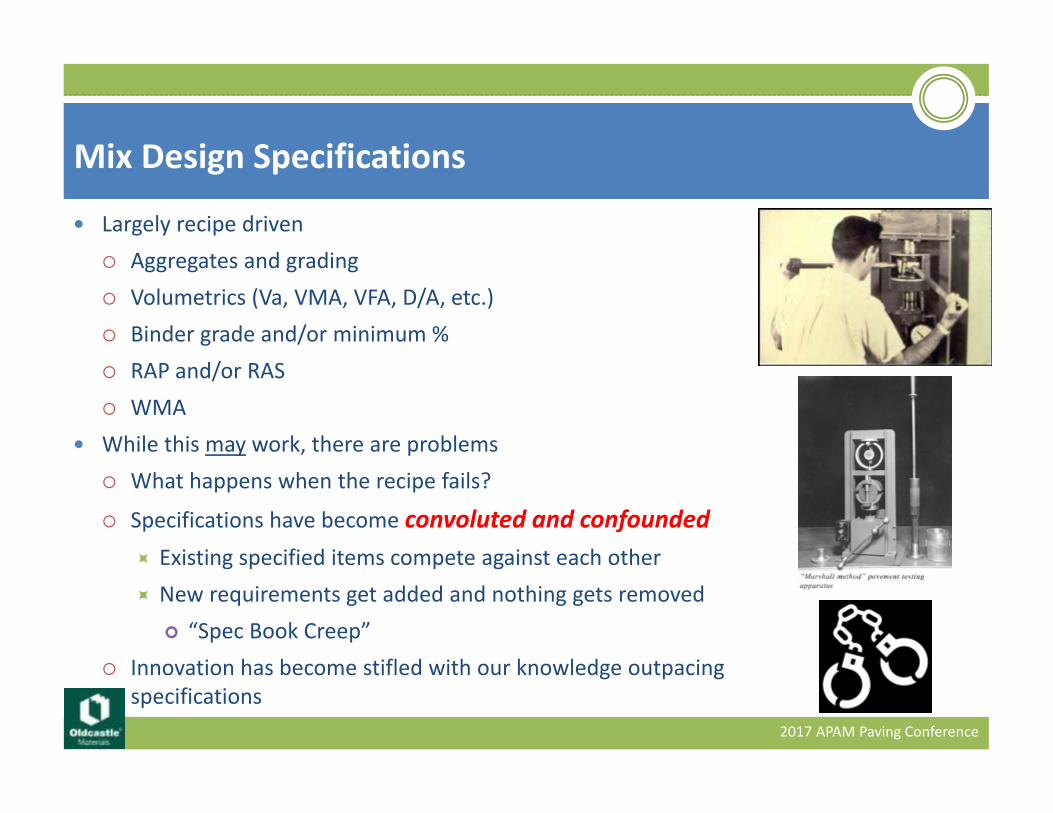
Largely recipe driven Aggregates and grading Volumetrics (Va, VMA, VFA, D/A, etc.) Binder grade and/or minimum % RAP and/or RAS WMA
While this may work, there are problems What happens when the recipe fails?
Specifications have become convoluted and confounded Existing specified items compete against each other New requirements get added and nothing gets removed “Spec Book Creep”
Innovation has become stifled with our knowledge outpacing specifications
Mix Design Specifications
2017 APAM Paving Conference
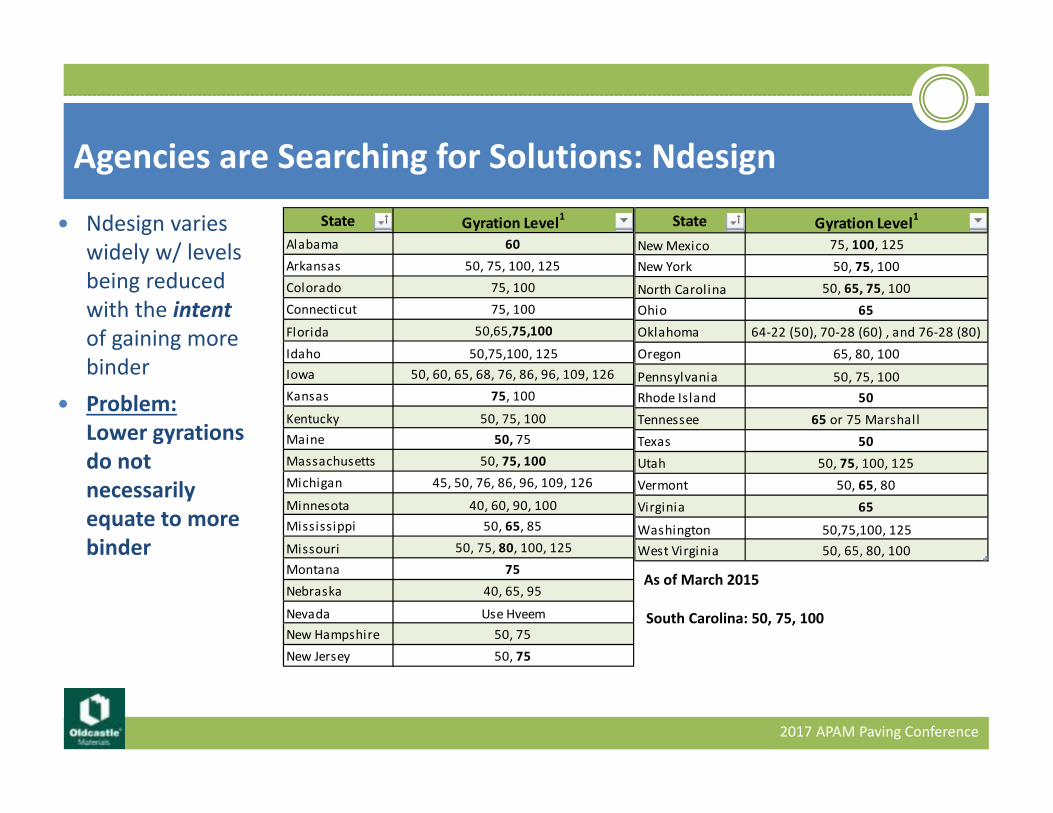
State Gyration Level1
New Mexico 75, 100, 125New York 50, 75, 100
North Carolina 50, 65, 75, 100Ohio 65Oklahoma 64‐22 (50), 70‐28 (60) , and 76‐28 (80)Oregon 65, 80, 100
Pennsylvania 50, 75, 100Rhode Island 50Tennessee 65 or 75 MarshallTexas 50Utah 50, 75, 100, 125Vermont 50, 65, 80Virginia 65
Washington 50,75,100, 125West Virginia 50, 65, 80, 100
State Gyration Level1
Alabama 60Arkansas 50, 75, 100, 125Colorado 75, 100Connecticut 75, 100
Florida 50,65,75,100
Idaho 50,75,100, 125Iowa 50, 60, 65, 68, 76, 86, 96, 109, 126Kansas 75, 100
Kentucky 50, 75, 100Maine 50, 75Massachusetts 50, 75, 100Michigan 45, 50, 76, 86, 96, 109, 126
Minnesota 40, 60, 90, 100Mississippi 50, 65, 85
Missouri 50, 75, 80, 100, 125Montana 75Nebraska 40, 65, 95
Nevada Use HveemNew Hampshire 50, 75New Jersey 50, 75
Ndesign varies widely w/ levels being reduced with the intentof gaining more binder
Problem:Lower gyrations do not necessarily equate to more binder
Agencies are Searching for Solutions: Ndesign
As of March 2015
2017 APAM Paving Conference
South Carolina: 50, 75, 100

Enhancing the Durability of Asphalt Pavements
“Volume of Effective Binder (Vbe) is the primary mixture design factor affecting both durability and fatigue cracking resistance.” Vbe = VMA – Air Voids
“A number of state highway agencies have decreased the design gyration levels in an attempt to increase effective binder contents. However, decreasing the design gyrations may not always produce mixtures with higher Vbe.”
2017 APAM Paving Conference
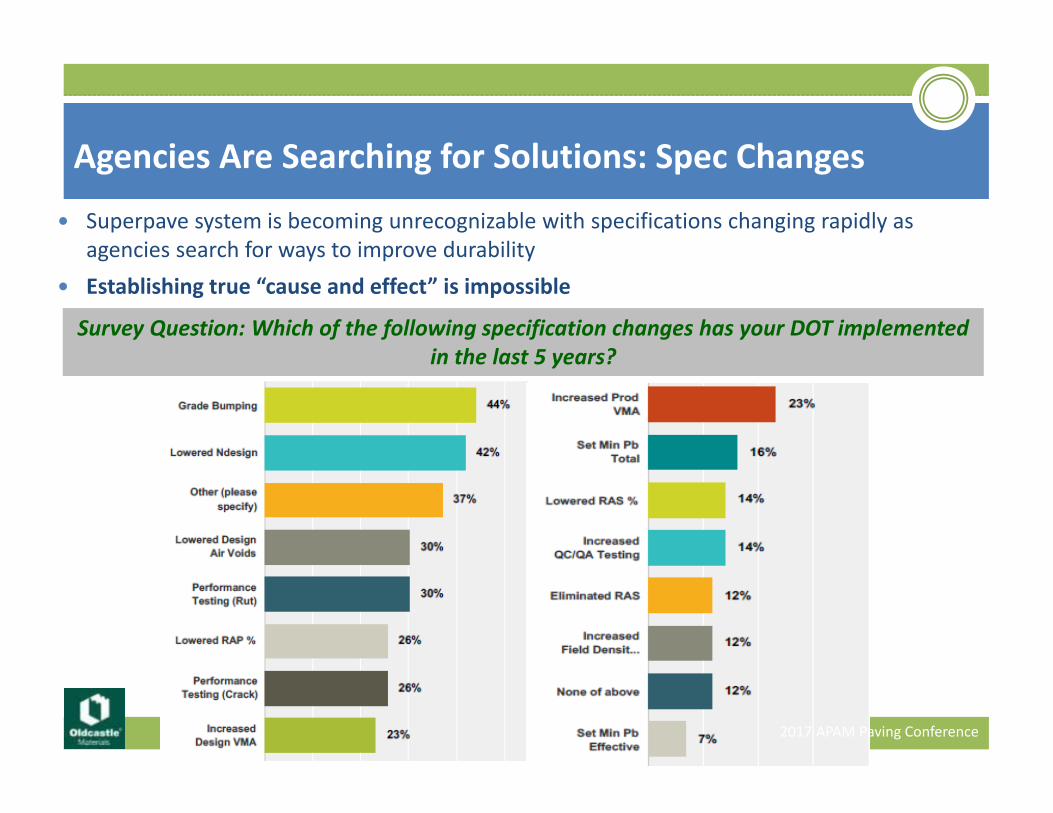
Superpave system is becoming unrecognizable with specifications changing rapidly as agencies search for ways to improve durability
Establishing true “cause and effect” is impossible
Agencies Are Searching for Solutions: Spec Changes
Survey Question: Which of the following specification changes has your DOT implemented in the last 5 years?
Survey Question: Which of the following specification changes has your DOT implemented in the last 5 years?
2017 APAM Paving Conference
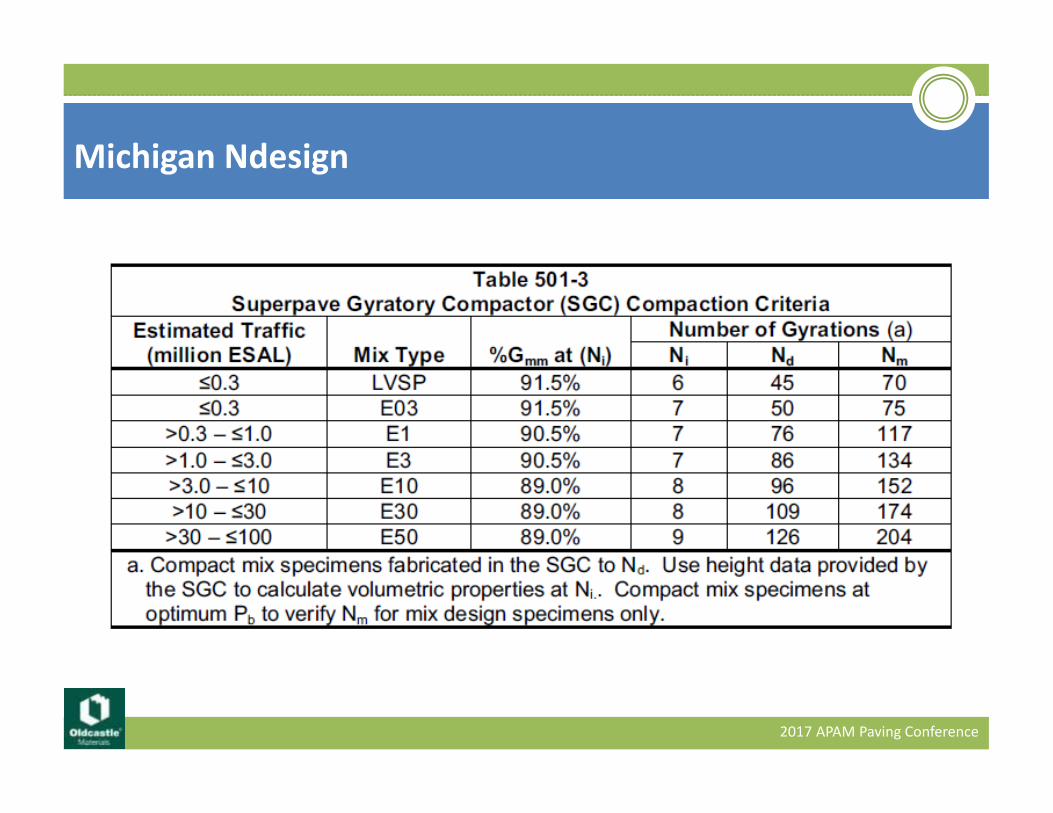
Michigan Ndesign
2017 APAM Paving Conference
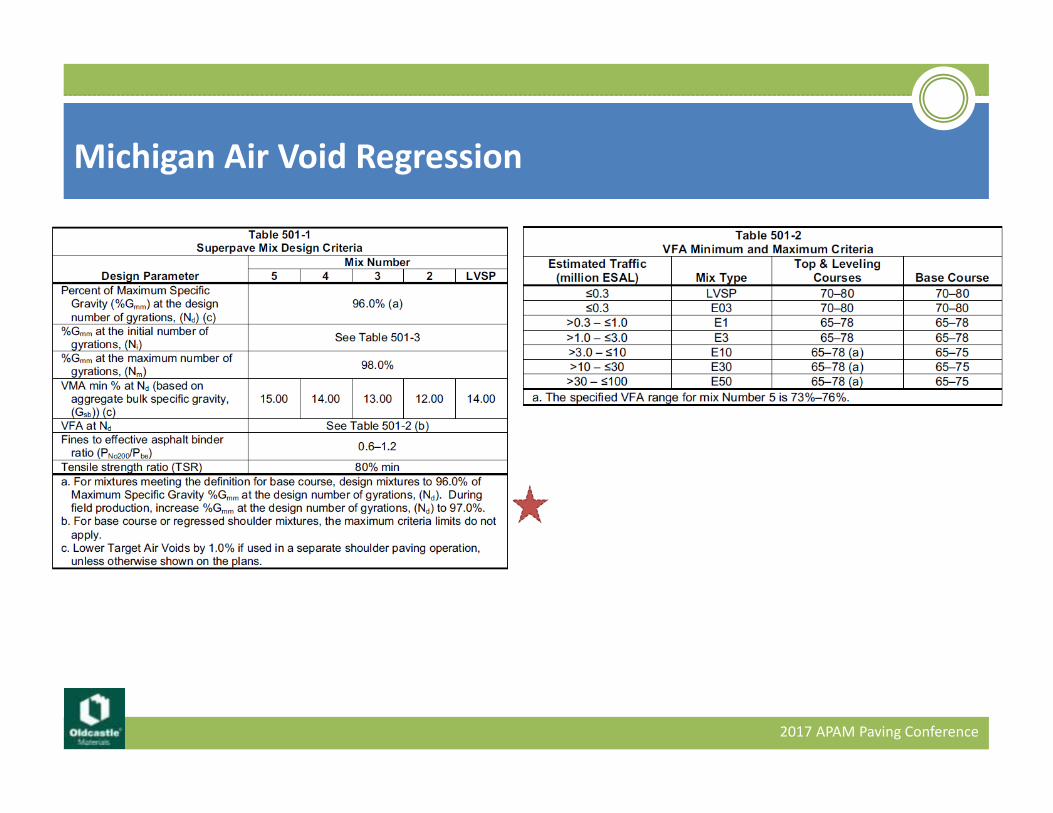
Michigan Air Void Regression
2017 APAM Paving Conference
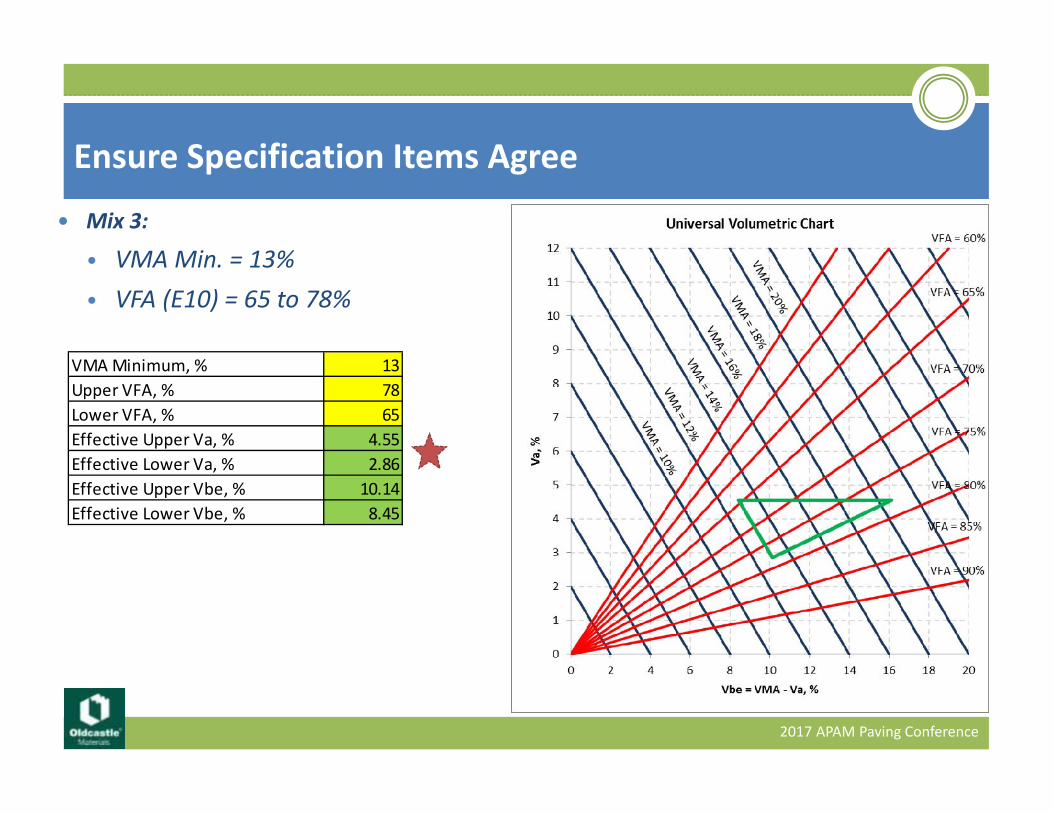
Mix 3:
• VMA Min. = 13%• VFA (E10) = 65 to 78%
Ensure Specification Items Agree
2017 APAM Paving Conference
VMA Minimum, % 13Upper VFA, % 78Lower VFA, % 65Effective Upper Va, % 4.55Effective Lower Va, % 2.86Effective Upper Vbe, % 10.14Effective Lower Vbe, % 8.45
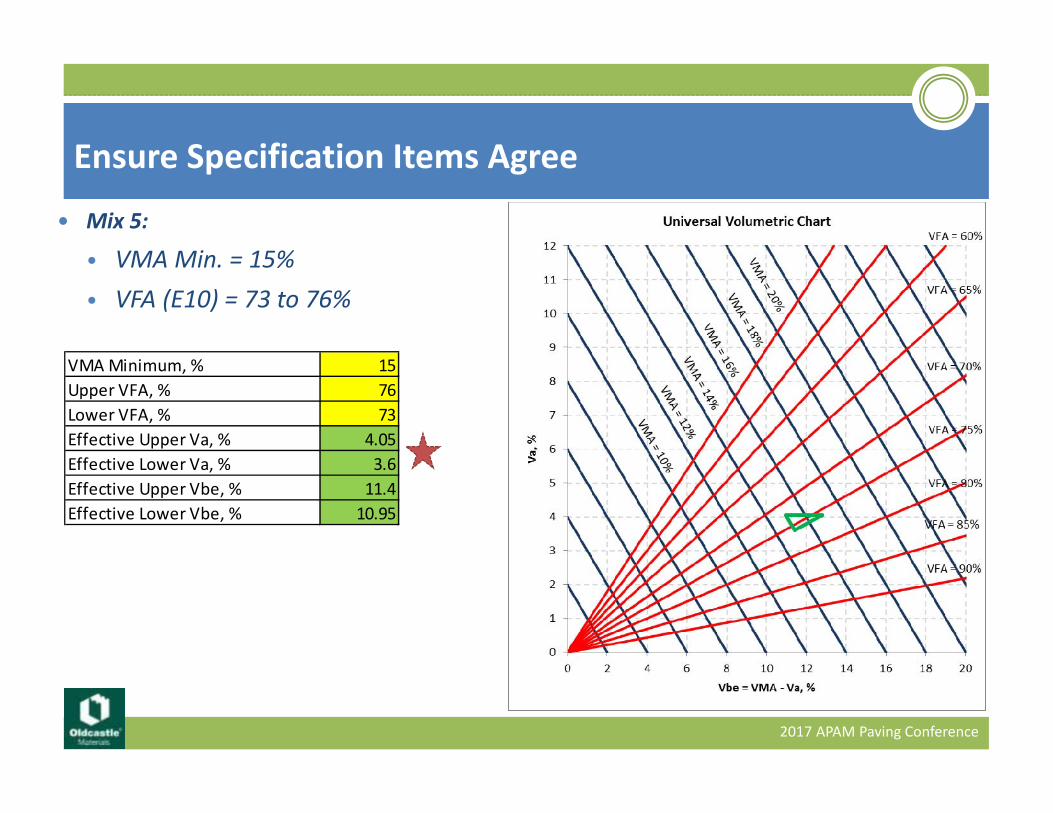
Mix 5:
• VMA Min. = 15%• VFA (E10) = 73 to 76%
Ensure Specification Items Agree
2017 APAM Paving Conference
VMA Minimum, % 15Upper VFA, % 76Lower VFA, % 73Effective Upper Va, % 4.05Effective Lower Va, % 3.6Effective Upper Vbe, % 11.4Effective Lower Vbe, % 10.95
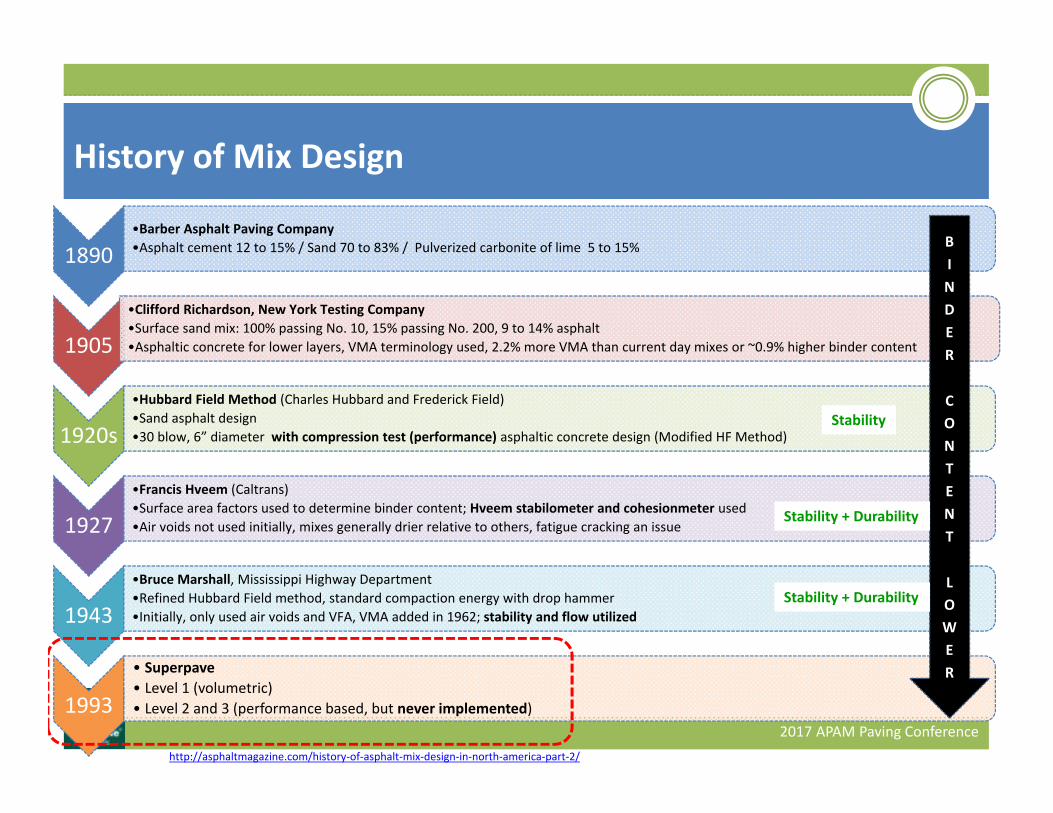
1890•Barber Asphalt Paving Company•Asphalt cement 12 to 15% / Sand 70 to 83% / Pulverized carbonite of lime 5 to 15%
1905
•Clifford Richardson, New York Testing Company•Surface sand mix: 100% passing No. 10, 15% passing No. 200, 9 to 14% asphalt•Asphaltic concrete for lower layers, VMA terminology used, 2.2% more VMA than current day mixes or ~0.9% higher binder content
1920s
•Hubbard Field Method (Charles Hubbard and Frederick Field)•Sand asphalt design•30 blow, 6” diameter with compression test (performance) asphaltic concrete design (Modified HF Method)
1927
•Francis Hveem (Caltrans)•Surface area factors used to determine binder content; Hveem stabilometer and cohesionmeter used•Air voids not used initially, mixes generally drier relative to others, fatigue cracking an issue
1943
•Bruce Marshall, Mississippi Highway Department•Refined Hubbard Field method, standard compaction energy with drop hammer•Initially, only used air voids and VFA, VMA added in 1962; stability and flow utilized
1993
• Superpave• Level 1 (volumetric)• Level 2 and 3 (performance based, but never implemented)
History of Mix Design
http://asphaltmagazine.com/history‐of‐asphalt‐mix‐design‐in‐north‐america‐part‐2/
BINDER
CONTENT
LOWER
Stability
Stability + Durability
Stability + Durability
2017 APAM Paving Conference
Design and optimum binder content are often used interchangeably However, they mean two different things
There can be many design binder contents for a mix, but only one truly optimum
Optimum indicates the best binder content based on intended application, performance requirements/needs, and ultimately economics
Goal is to get as close as possible to the true optimum for the mix
Binder Content – Design vs. Optimum (There is a difference!)
2017 APAM Paving Conference
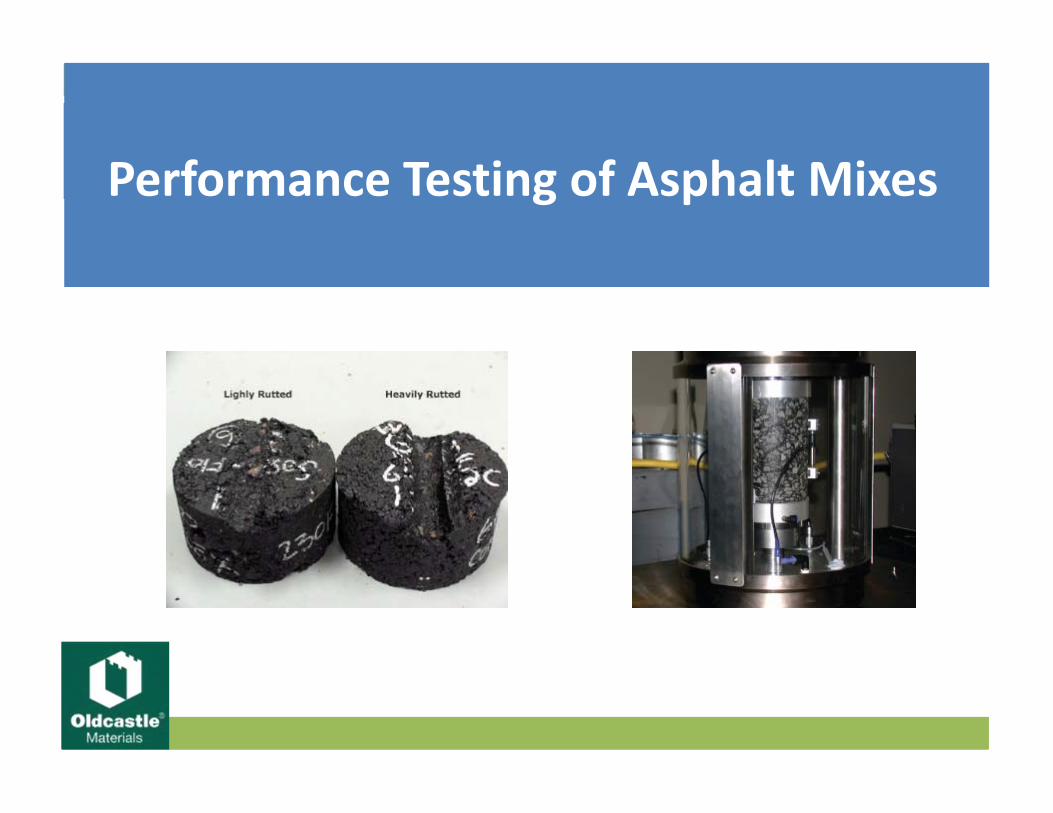
Performance Testing of Asphalt Mixes
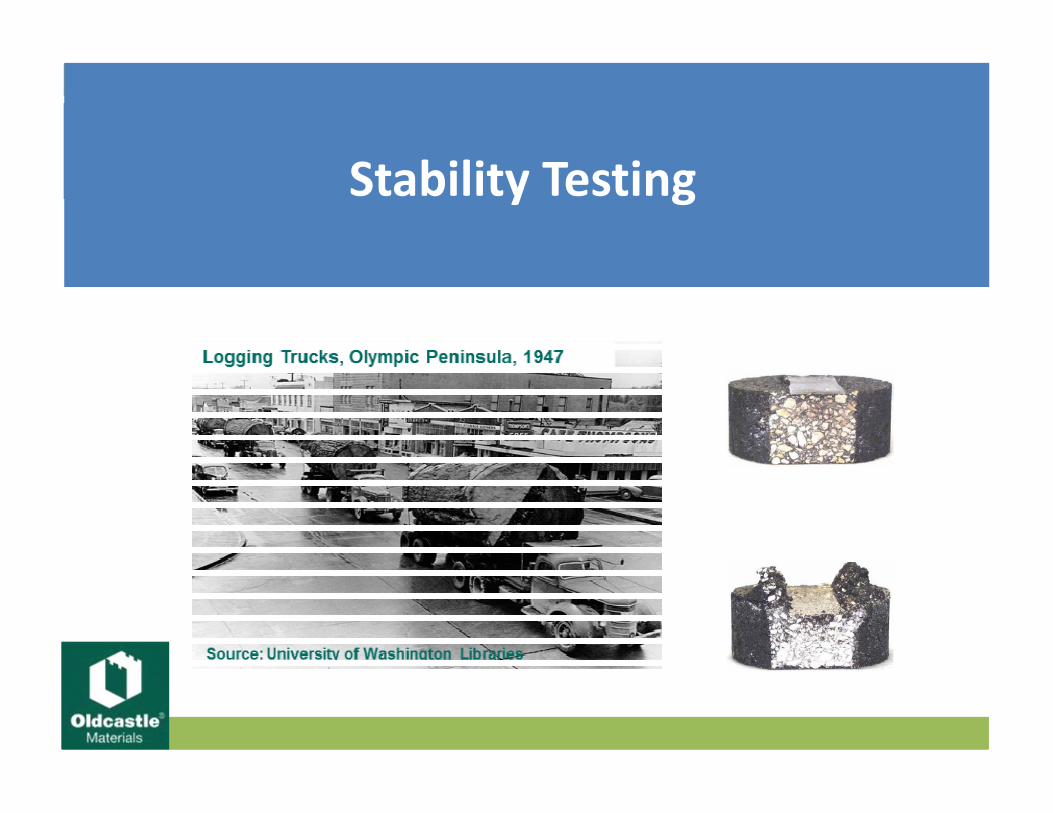
Stability Testing
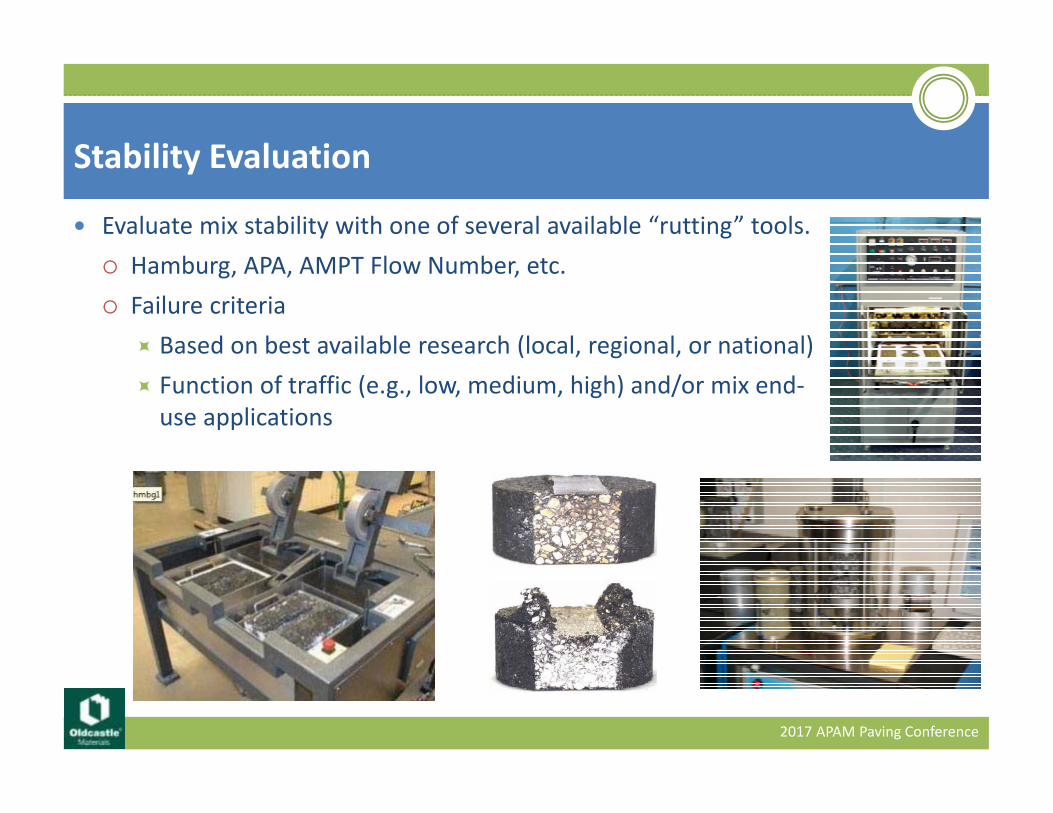
Evaluate mix stability with one of several available “rutting” tools. Hamburg, APA, AMPT Flow Number, etc. Failure criteria
Based on best available research (local, regional, or national) Function of traffic (e.g., low, medium, high) and/or mix end‐use applications
Stability Evaluation
2017 APAM Paving Conference
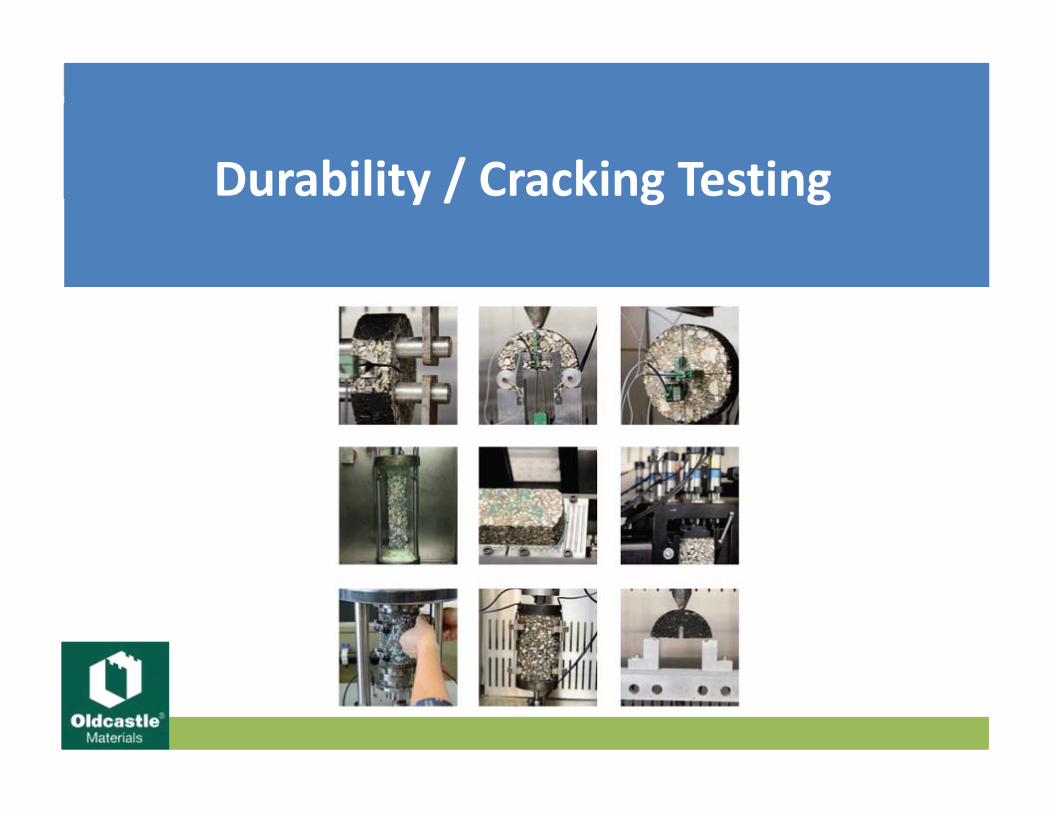
Durability / Cracking Testing
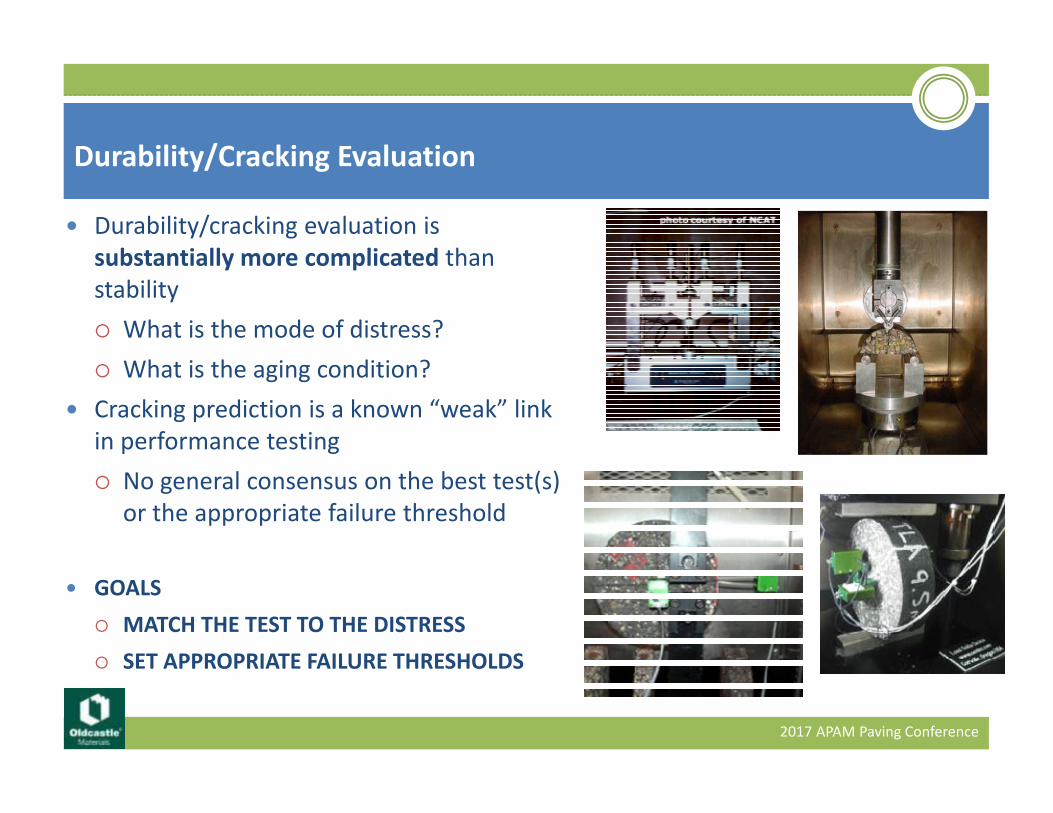
Durability/cracking evaluation is substantially more complicated than stability What is the mode of distress? What is the aging condition?
Cracking prediction is a known “weak” link in performance testing No general consensus on the best test(s)
or the appropriate failure threshold
GOALS MATCH THE TEST TO THE DISTRESS SET APPROPRIATE FAILURE THRESHOLDS
Durability/Cracking Evaluation
2017 APAM Paving Conference
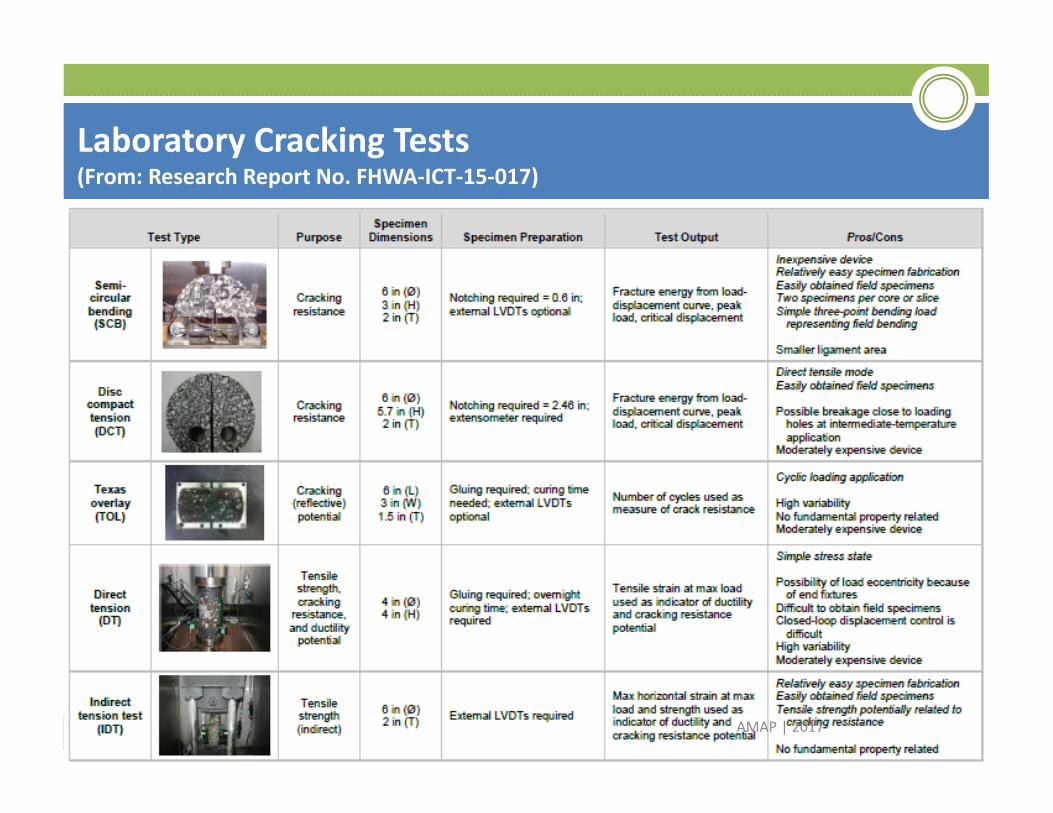
Laboratory Cracking Tests(From: Research Report No. FHWA‐ICT‐15‐017)
AMAP | 2017
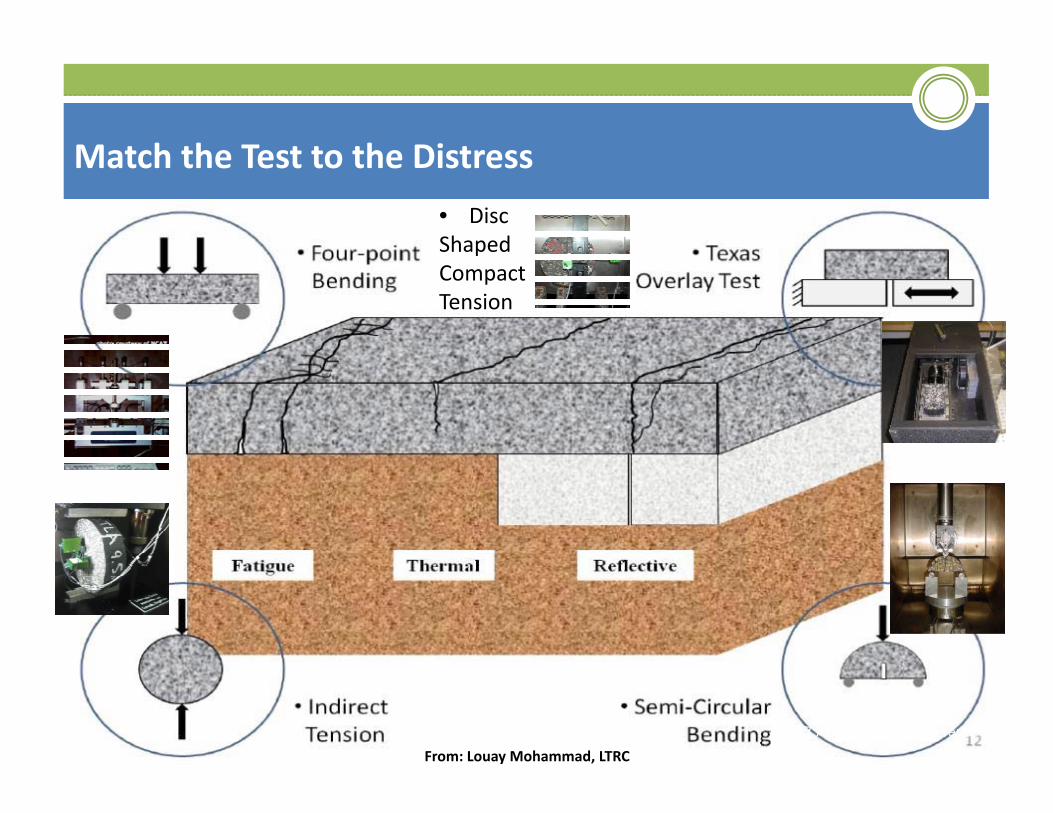
Match the Test to the Distress
From: Louay Mohammad, LTRC
• Disc Shaped Compact Tension
2017 APAM Paving Conference
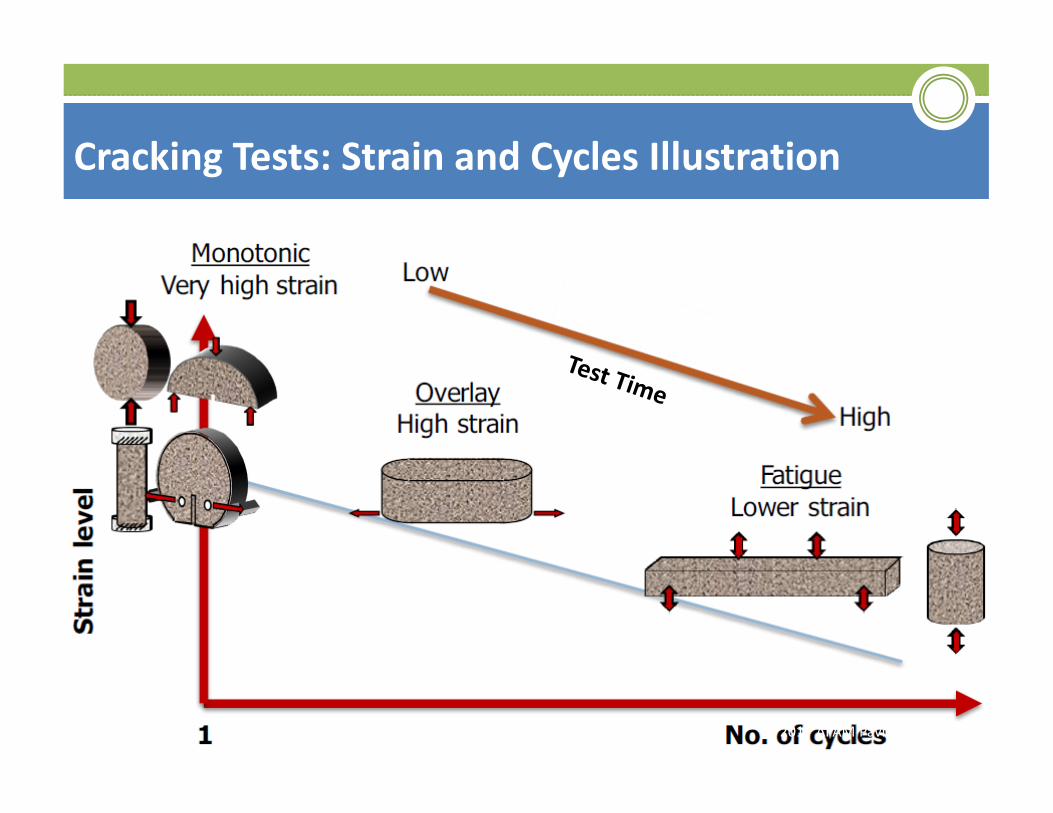
Cracking Tests: Strain and Cycles Illustration
2017 APAM Paving Conference
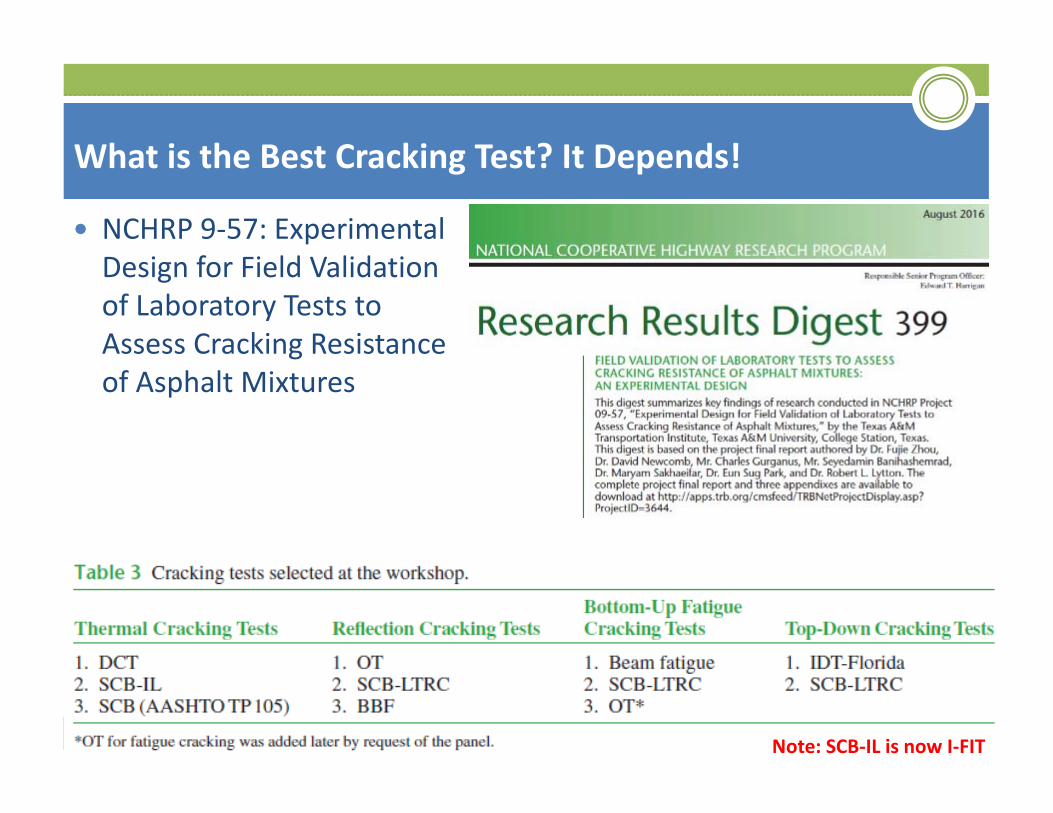
What is the Best Cracking Test? It Depends!
NCHRP 9‐57: Experimental Design for Field Validation of Laboratory Tests to Assess Cracking Resistance of Asphalt Mixtures
Note: SCB‐IL is now I‐FITAMAP | 2017
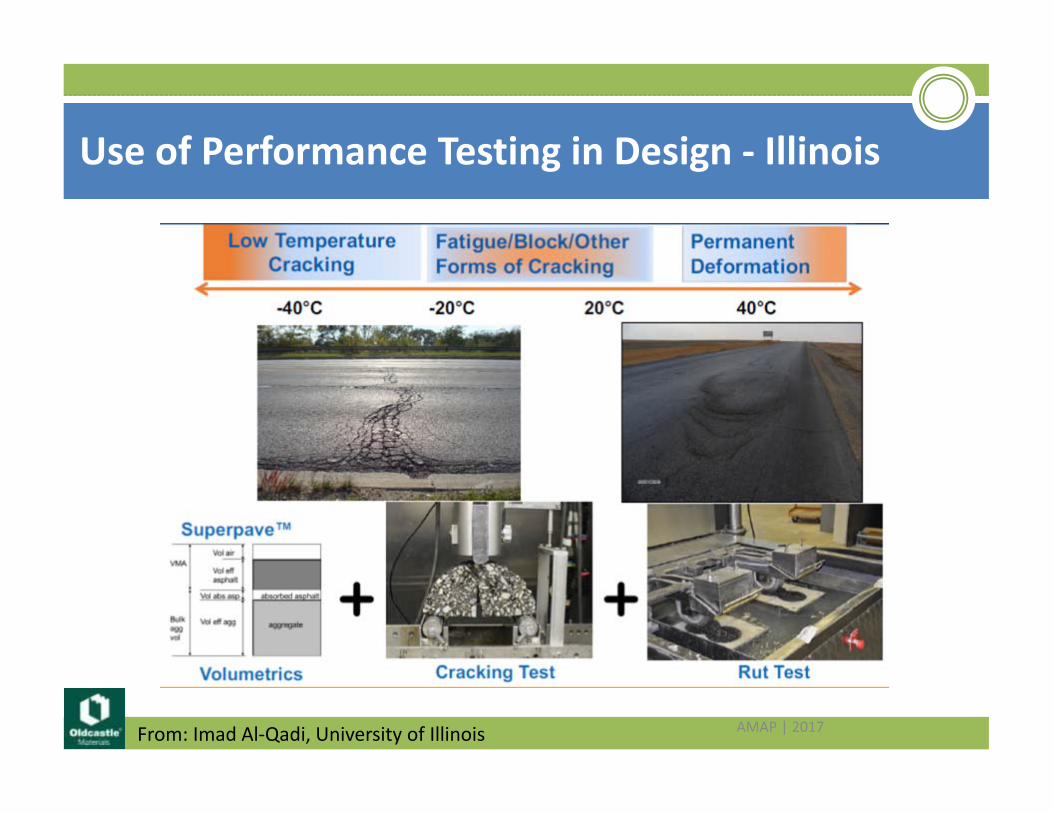
Use of Performance Testing in Design ‐ Illinois
From: Imad Al‐Qadi, University of Illinois AMAP | 2017
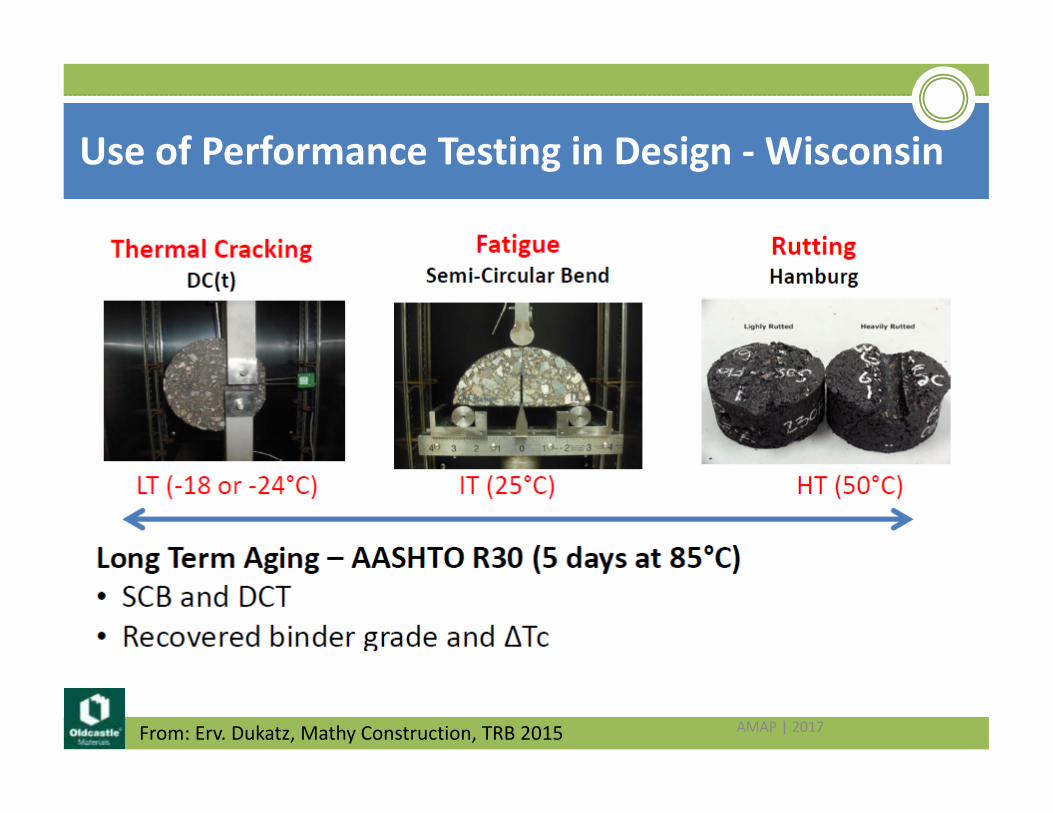
Use of Performance Testing in Design ‐Wisconsin
From: Erv. Dukatz, Mathy Construction, TRB 2015 AMAP | 2017
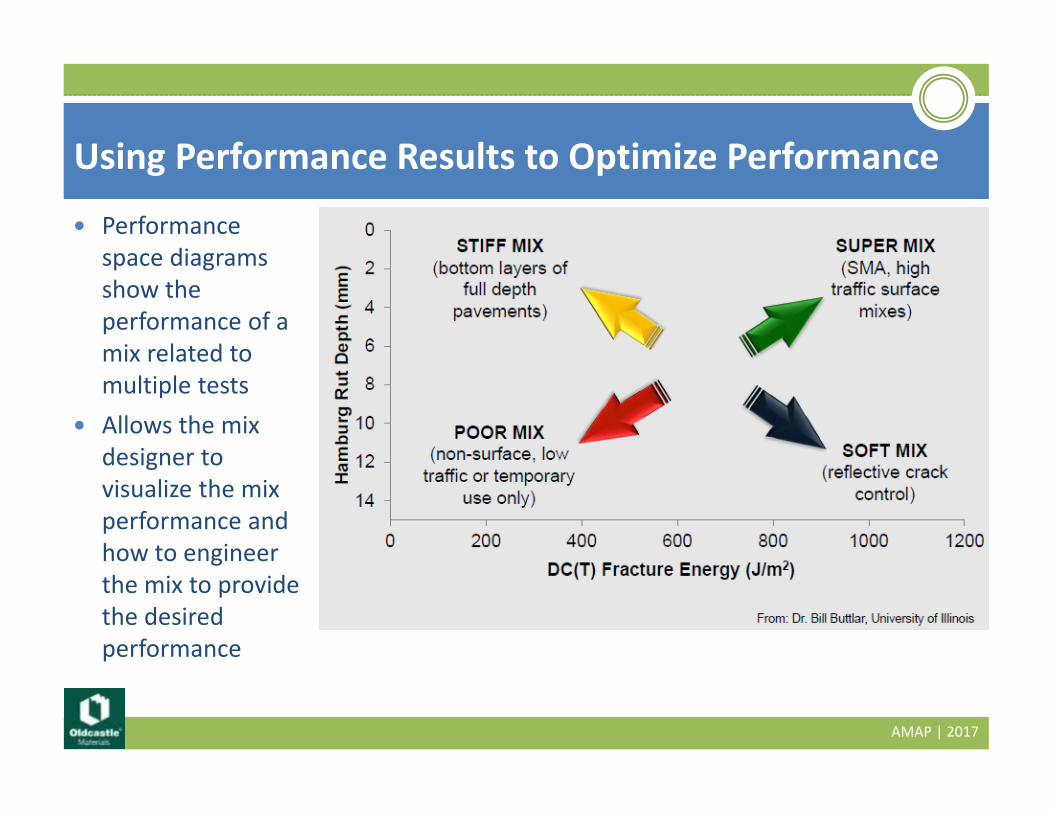
Performance space diagrams show the performance of a mix related to multiple tests
Allows the mix designer to visualize the mix performance and how to engineer the mix to provide the desired performance
Using Performance Results to Optimize Performance
AMAP | 2017

Balanced Mix Design Task Force ‐ Development and Work
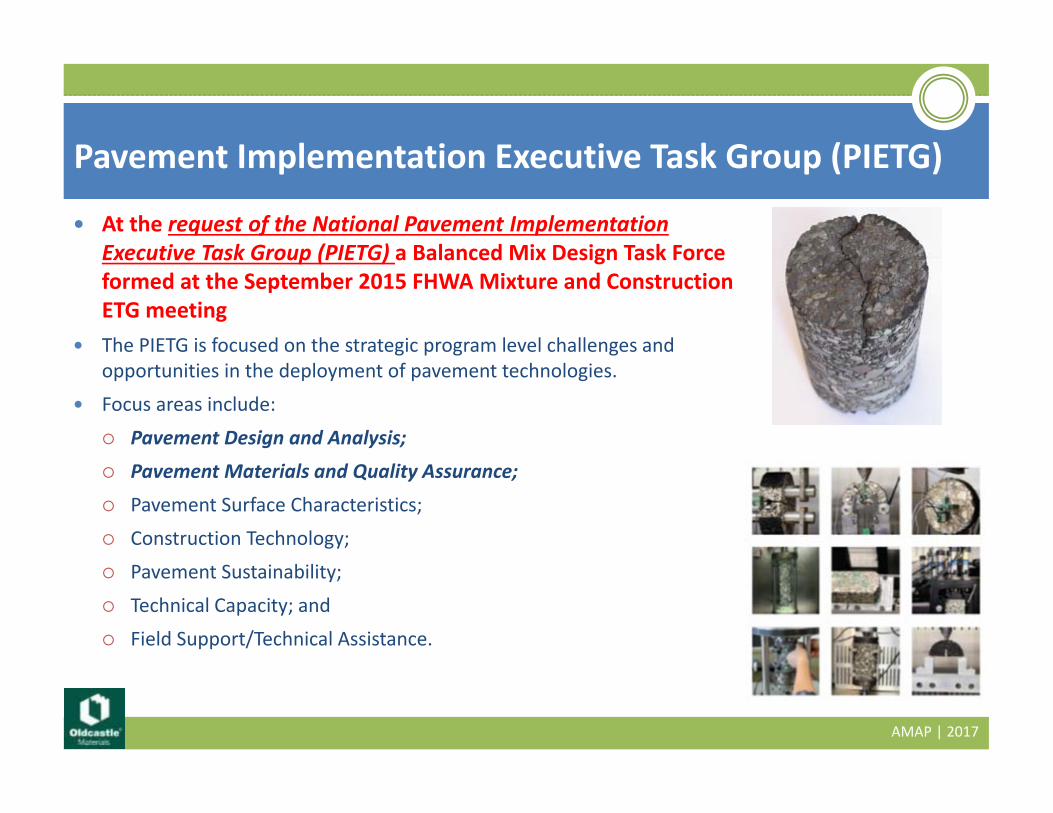
At the request of the National Pavement Implementation Executive Task Group (PIETG) a Balanced Mix Design Task Force formed at the September 2015 FHWA Mixture and Construction ETG meeting
The PIETG is focused on the strategic program level challenges and opportunities in the deployment of pavement technologies.
Focus areas include:
Pavement Design and Analysis;
Pavement Materials and Quality Assurance;
Pavement Surface Characteristics;
Construction Technology;
Pavement Sustainability;
Technical Capacity; and
Field Support/Technical Assistance.
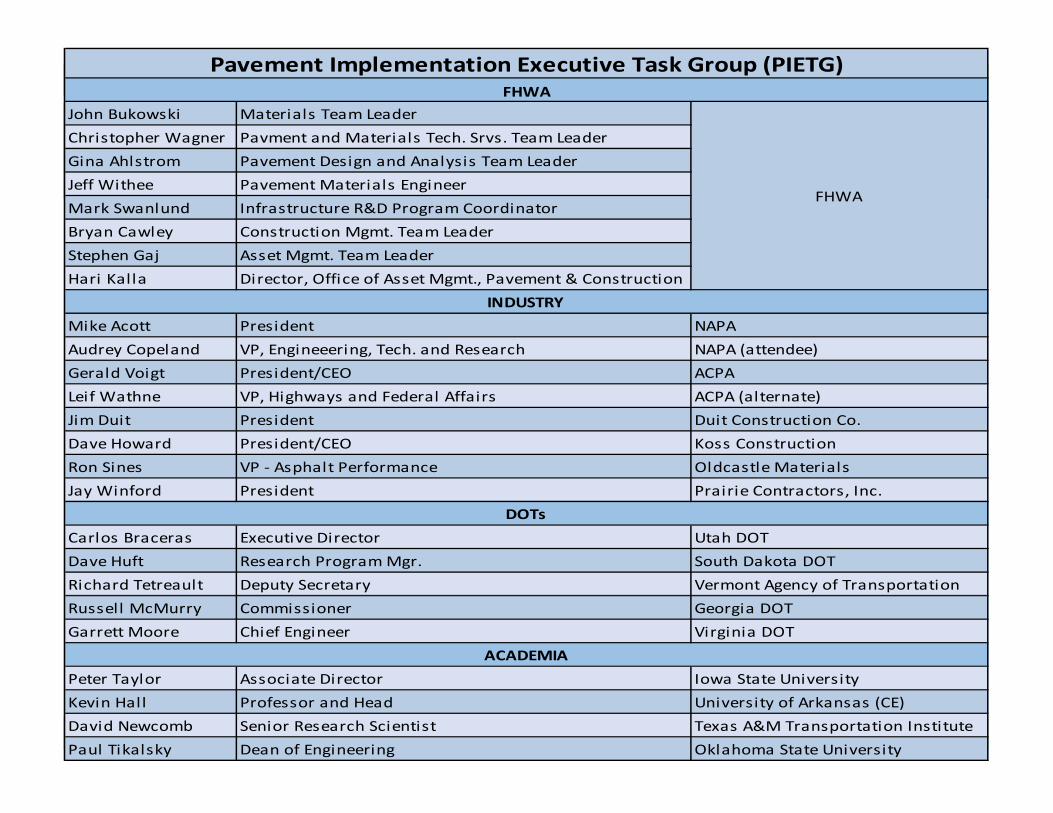
Pavement Implementation Executive Task Group (PIETG)
AMAP | 2017
AMAP | 2017
John Bukowski Materials Team LeaderChristopher Wagner Pavment and Materials Tech. Srvs. Team Leader Gina Ahlstrom Pavement Design and Analysis Team LeaderJeff Withee Pavement Materials EngineerMark Swanlund Infrastructure R&D Program CoordinatorBryan Cawley Construction Mgmt. Team LeaderStephen Gaj Asset Mgmt. Team LeaderHari Kalla Director, Office of Asset Mgmt., Pavement & Construction
Mike Acott President NAPAAudrey Copeland VP, Engineeering, Tech. and Research NAPA (attendee)Gerald Voigt President/CEO ACPALeif Wathne VP, Highways and Federal Affairs ACPA (alternate)Jim Duit President Duit Construction Co.Dave Howard President/CEO Koss ConstructionRon Sines VP ‐ Asphalt Performance Oldcastle MaterialsJay Winford President Prairie Contractors, Inc.
Carlos Braceras Executive Director Utah DOTDave Huft Research Program Mgr. South Dakota DOTRichard Tetreault Deputy Secretary Vermont Agency of TransportationRussell McMurry Commissioner Georgia DOTGarrett Moore Chief Engineer Virginia DOT
Peter Taylor Associate Director Iowa State UniversityKevin Hall Professor and Head University of Arkansas (CE)David Newcomb Senior Research Scientist Texas A&M Transportation InstitutePaul Tikalsky Dean of Engineering Oklahoma State University
FHWA
FHWA
Pavement Implementation Executive Task Group (PIETG)
INDUSTRY
DOTs
ACADEMIA
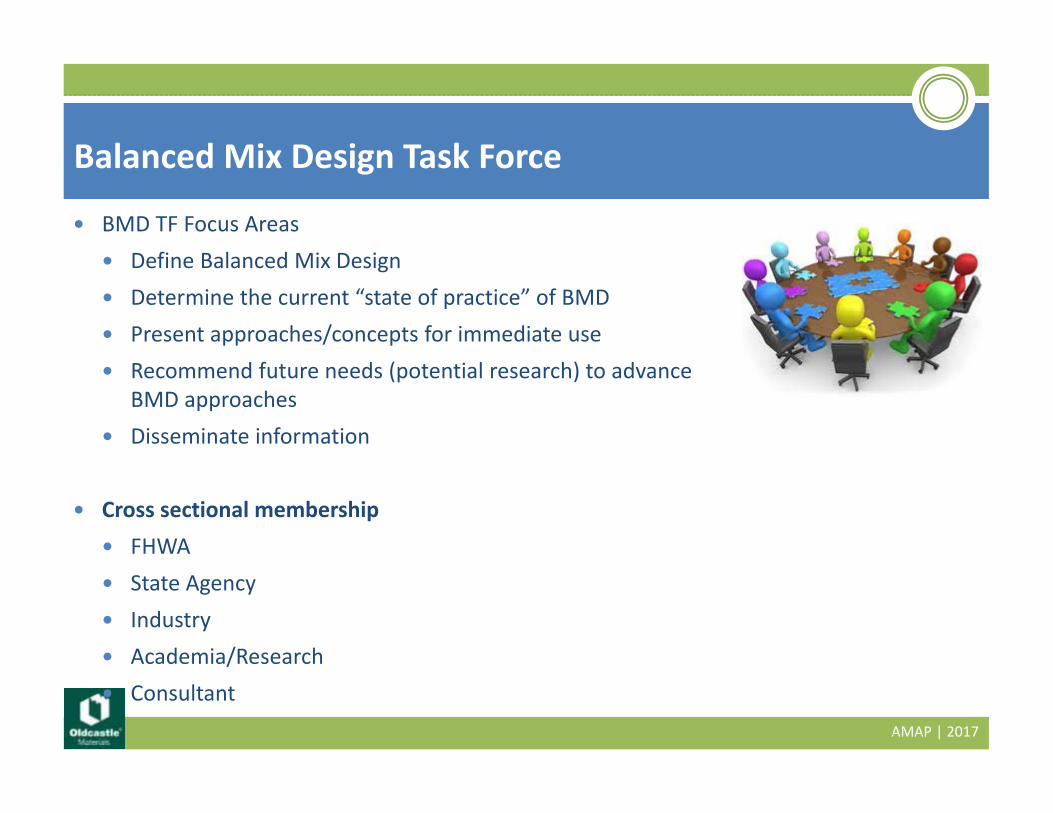
BMD TF Focus Areas Define Balanced Mix Design Determine the current “state of practice” of BMD Present approaches/concepts for immediate use Recommend future needs (potential research) to advance
BMD approaches Disseminate information
Cross sectional membership FHWA State Agency Industry Academia/Research Consultant
Balanced Mix Design Task Force
AMAP | 2017
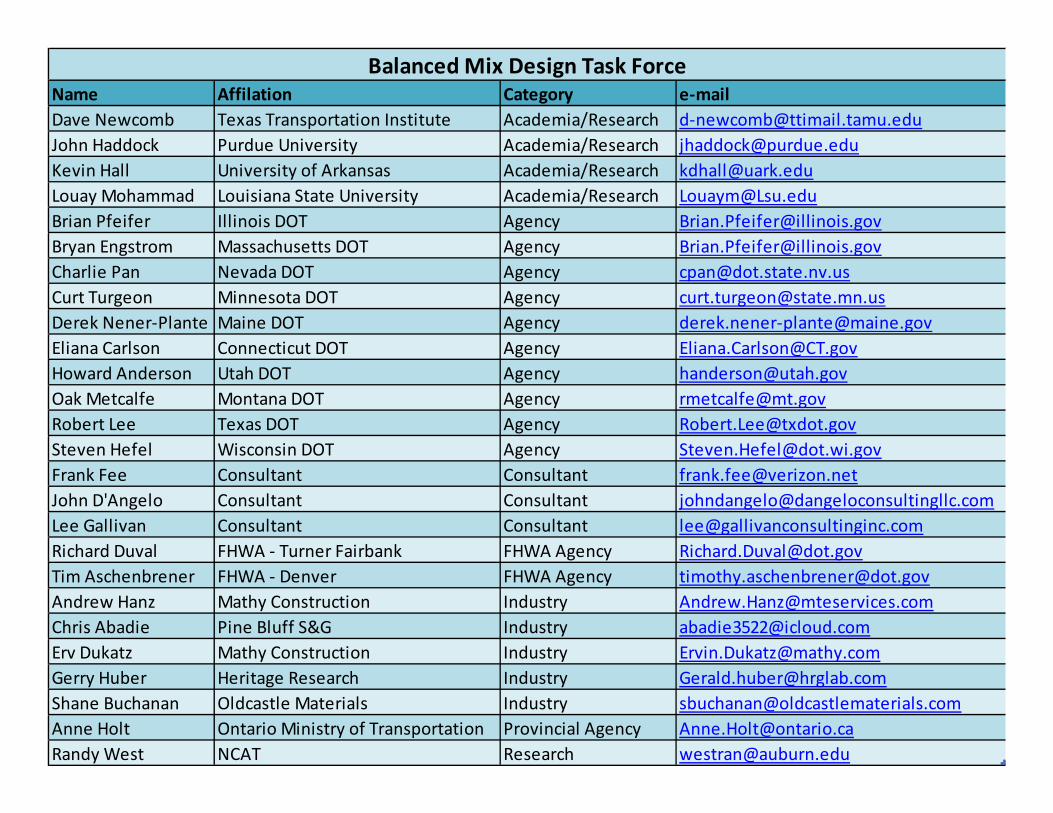
BMD Task Force Membership
AMAP | 2017
Name Affilation Category e‐mailDave Newcomb Texas Transportation Institute Academia/Research d‐[email protected] Haddock Purdue University Academia/Research [email protected] Hall University of Arkansas Academia/Research [email protected] Mohammad Louisiana State University Academia/Research [email protected] Pfeifer Illinois DOT Agency [email protected] Engstrom Massachusetts DOT Agency [email protected] Pan Nevada DOT Agency [email protected] Turgeon Minnesota DOT Agency [email protected] Nener‐Plante Maine DOT Agency derek.nener‐[email protected] Carlson Connecticut DOT Agency [email protected] Anderson Utah DOT Agency [email protected] Metcalfe Montana DOT Agency [email protected] Lee Texas DOT Agency [email protected] Hefel Wisconsin DOT Agency [email protected] Fee Consultant Consultant [email protected] D'Angelo Consultant Consultant [email protected] Gallivan Consultant Consultant [email protected] Duval FHWA ‐ Turner Fairbank FHWA Agency [email protected] Aschenbrener FHWA ‐ Denver FHWA Agency [email protected] Hanz Mathy Construction Industry [email protected] Abadie Pine Bluff S&G Industry [email protected] Dukatz Mathy Construction Industry [email protected] Huber Heritage Research Industry [email protected] Buchanan Oldcastle Materials Industry [email protected] Holt Ontario Ministry of Transportation Provincial Agency [email protected] West NCAT Research [email protected]
Balanced Mix Design Task Force
Agency Practices Related to BMD
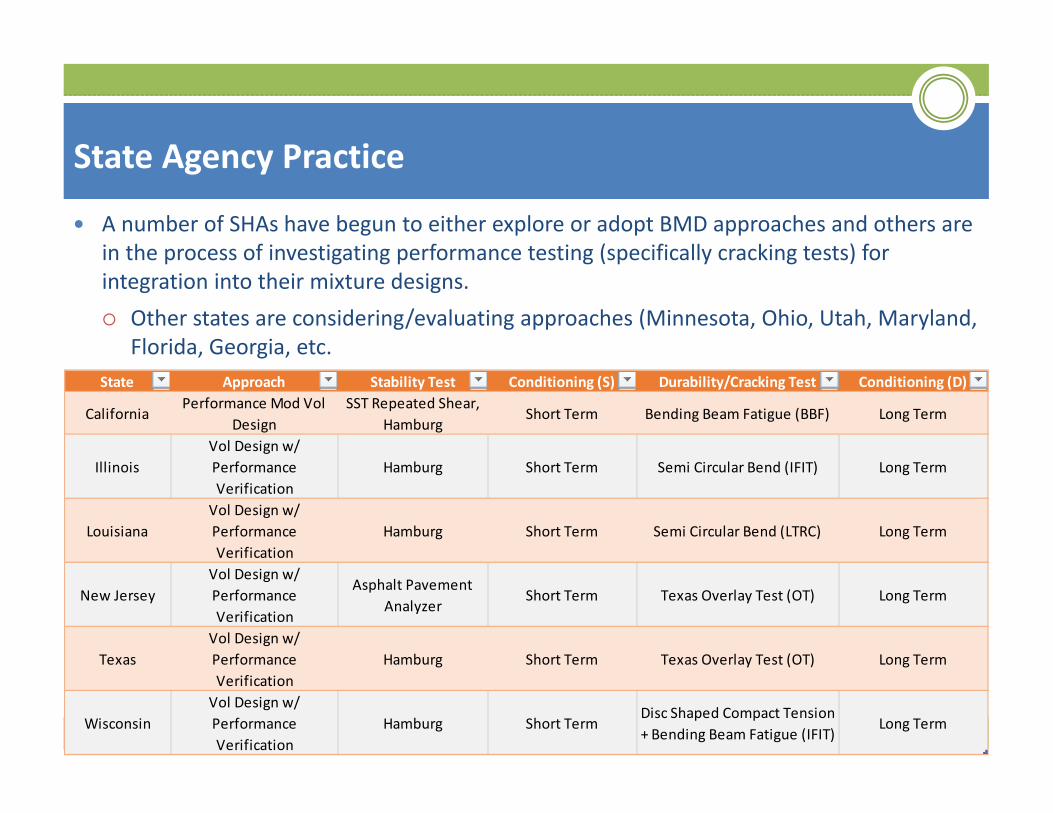
A number of SHAs have begun to either explore or adopt BMD approaches and others are in the process of investigating performance testing (specifically cracking tests) for integration into their mixture designs. Other states are considering/evaluating approaches (Minnesota, Ohio, Utah, Maryland,
Florida, Georgia, etc.
State Agency Practice
AMAP | 2017
State Approach Stability Test Conditioning (S) Durability/Cracking Test Conditioning (D)
CaliforniaPerformance Mod Vol
DesignSST Repeated Shear,
HamburgShort Term Bending Beam Fatigue (BBF) Long Term
IllinoisVol Design w/ Performance Verification
Hamburg Short Term Semi Circular Bend (IFIT) Long Term
Louisiana Vol Design w/ Performance Verification
Hamburg Short Term Semi Circular Bend (LTRC) Long Term
New JerseyVol Design w/ Performance Verification
Asphalt Pavement Analyzer
Short Term Texas Overlay Test (OT) Long Term
TexasVol Design w/ Performance Verification
Hamburg Short Term Texas Overlay Test (OT) Long Term
WisconsinVol Design w/ Performance Verification
Hamburg Short TermDisc Shaped Compact Tension + Bending Beam Fatigue (IFIT)
Long Term
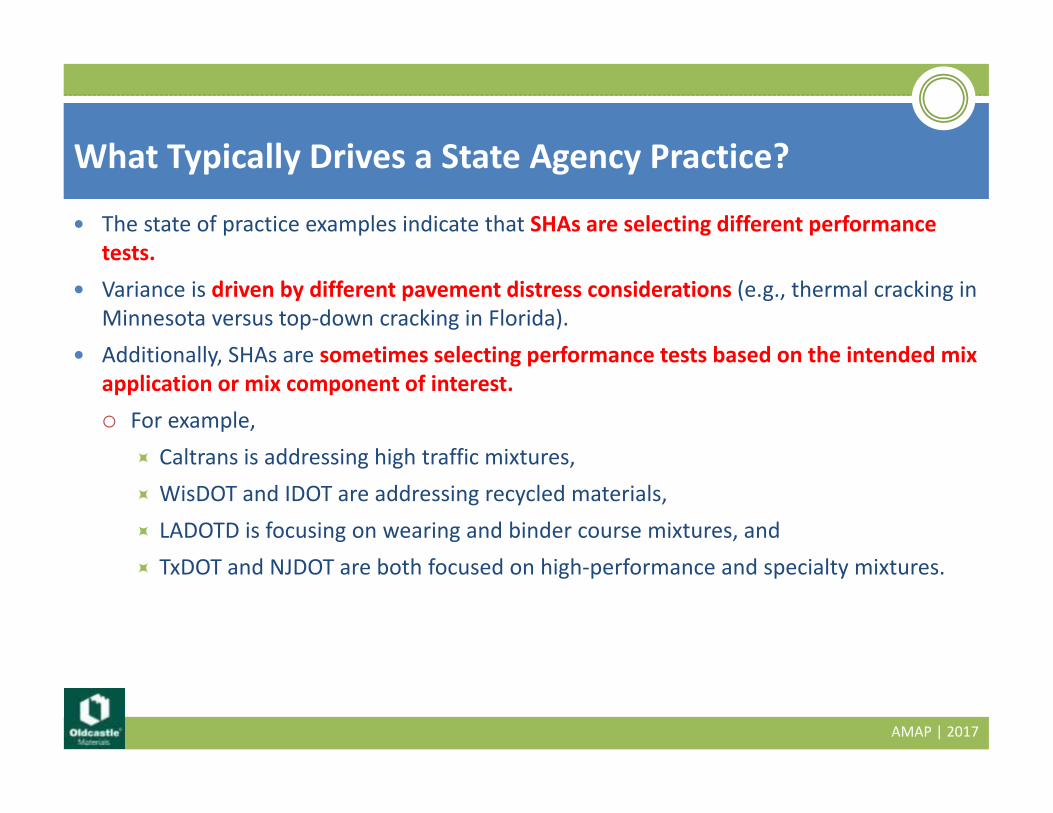
The state of practice examples indicate that SHAs are selecting different performance tests.
Variance is driven by different pavement distress considerations (e.g., thermal cracking in Minnesota versus top‐down cracking in Florida).
Additionally, SHAs are sometimes selecting performance tests based on the intended mix application or mix component of interest. For example,
Caltrans is addressing high traffic mixtures, WisDOT and IDOT are addressing recycled materials, LADOTD is focusing on wearing and binder course mixtures, and TxDOT and NJDOT are both focused on high‐performance and specialty mixtures.
What Typically Drives a State Agency Practice?
AMAP | 2017
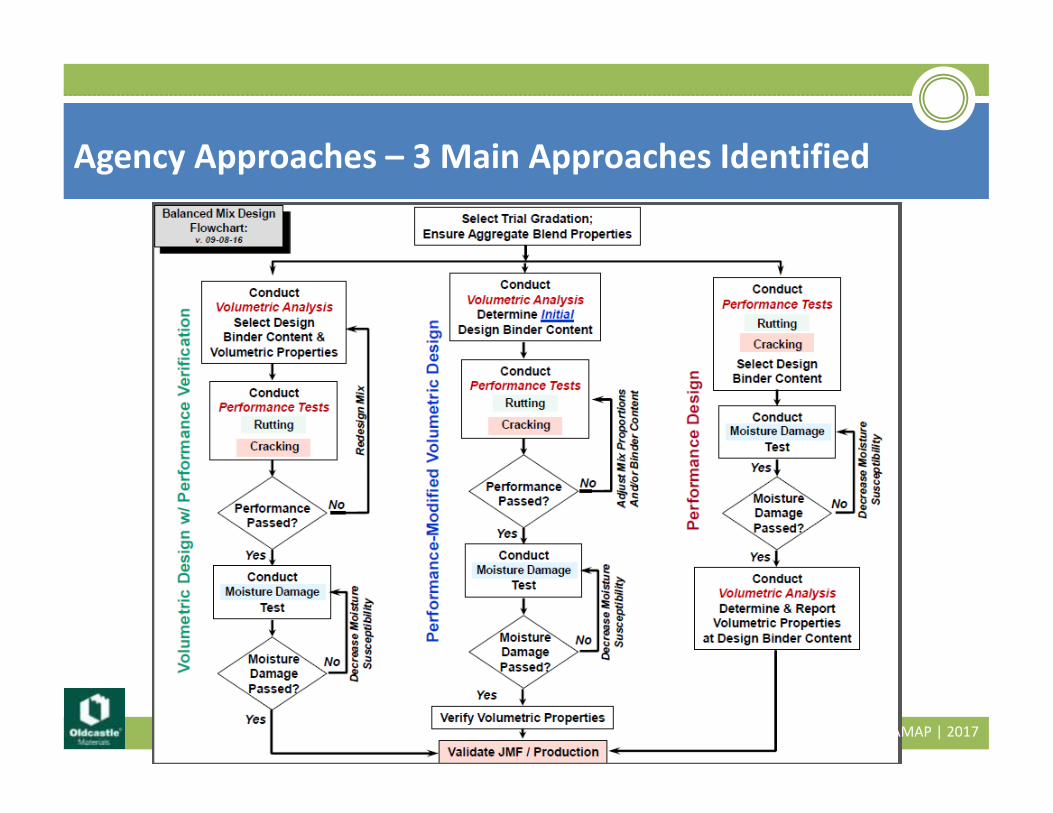
Agency Approaches – 3 Main Approaches Identified
AMAP | 2017
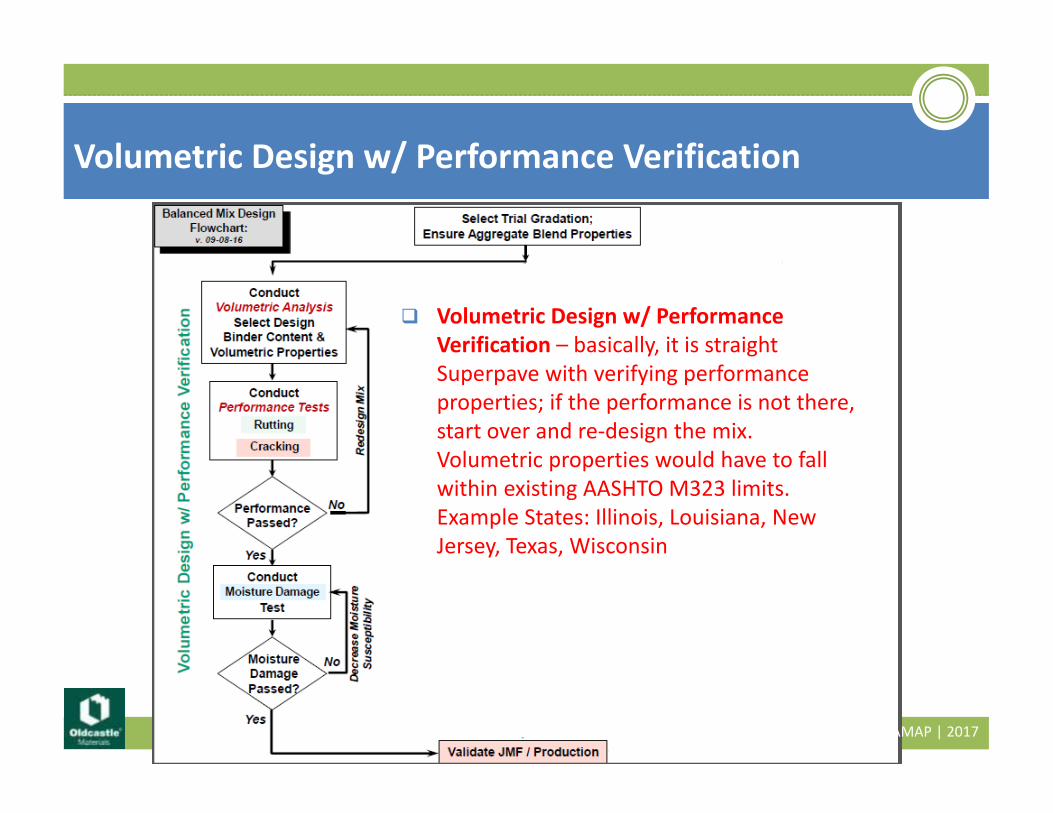
Volumetric Design w/ Performance Verification
Volumetric Design w/ Performance Verification – basically, it is straight Superpave with verifying performance properties; if the performance is not there, start over and re‐design the mix. Volumetric properties would have to fall within existing AASHTO M323 limits. Example States: Illinois, Louisiana, New Jersey, Texas, Wisconsin
AMAP | 2017
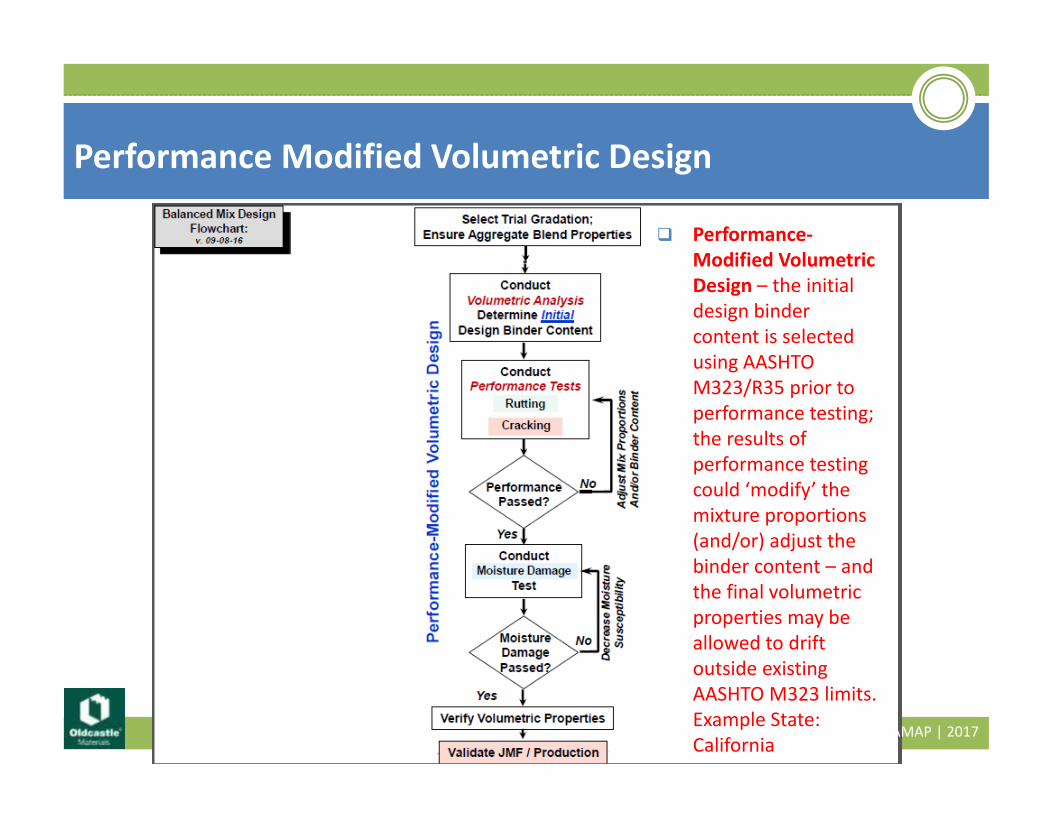
Performance Modified Volumetric Design
Performance‐Modified Volumetric Design – the initial design binder content is selected using AASHTO M323/R35 prior to performance testing; the results of performance testing could ‘modify’ the mixture proportions (and/or) adjust the binder content – and the final volumetric properties may be allowed to drift outside existing AASHTO M323 limits. Example State: California
AMAP | 2017
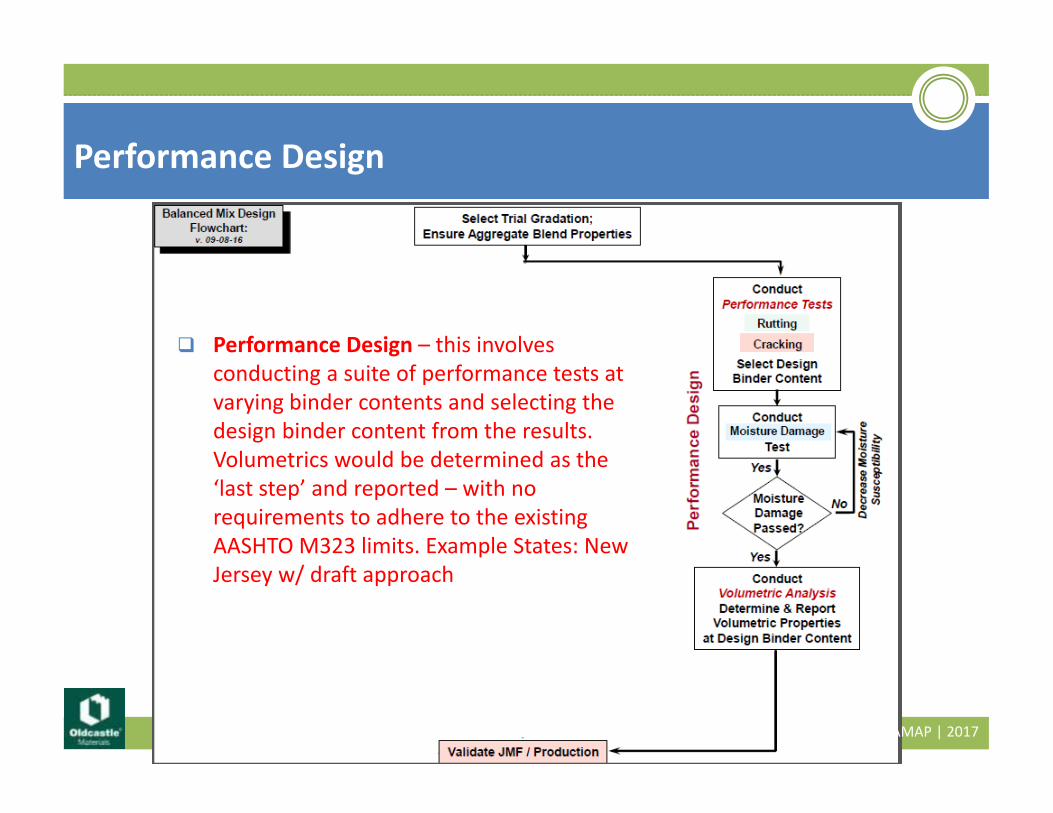
Performance Design
Performance Design – this involves conducting a suite of performance tests at varying binder contents and selecting the design binder content from the results. Volumetrics would be determined as the ‘last step’ and reported – with no requirements to adhere to the existing AASHTO M323 limits. Example States: New Jersey w/ draft approach
AMAP | 2017
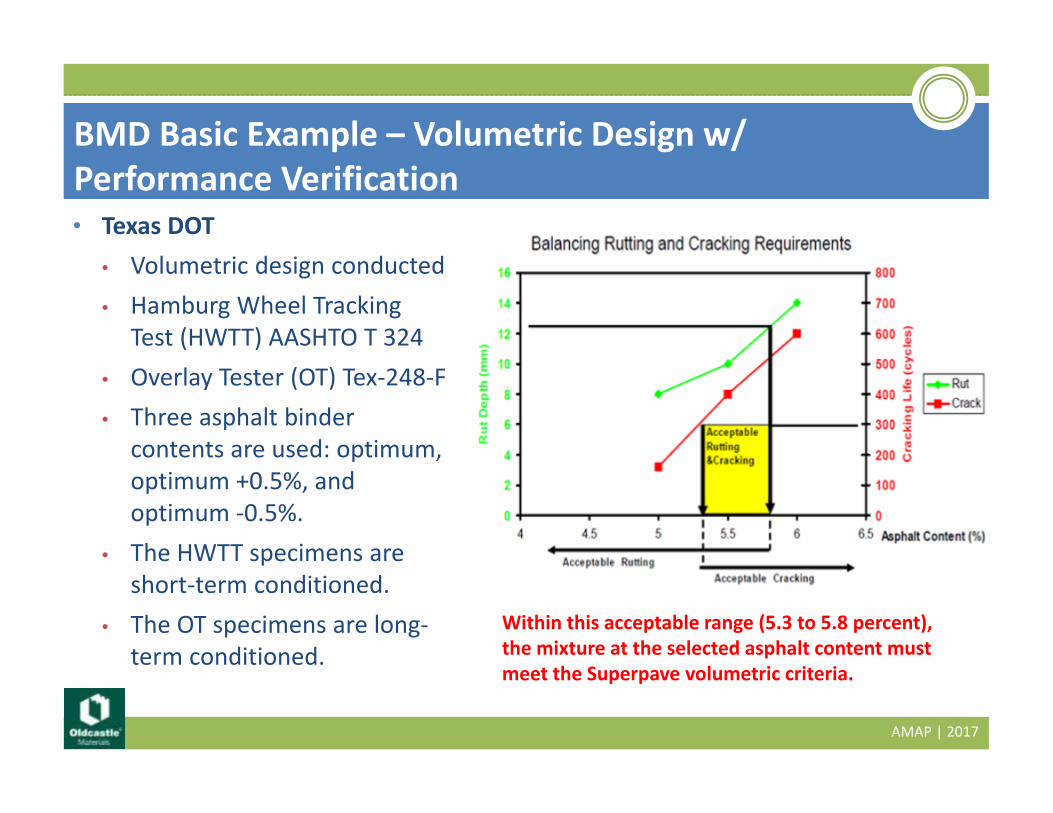
BMD Basic Example – Volumetric Design w/ Performance Verification• Texas DOT
• Volumetric design conducted• Hamburg Wheel Tracking
Test (HWTT) AASHTO T 324• Overlay Tester (OT) Tex‐248‐F• Three asphalt binder
contents are used: optimum, optimum +0.5%, and optimum ‐0.5%.
• The HWTT specimens are short‐term conditioned.
• The OT specimens are long‐term conditioned.
Within this acceptable range (5.3 to 5.8 percent), the mixture at the selected asphalt content must meet the Superpave volumetric criteria.
AMAP | 2017
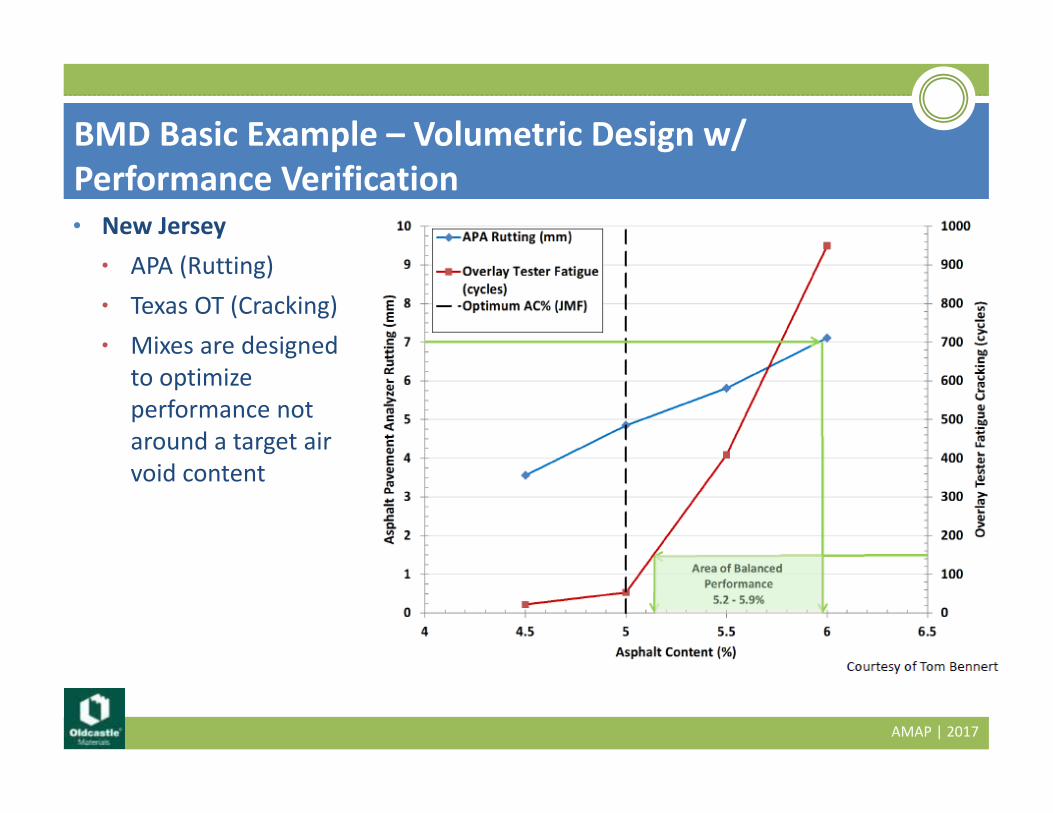
BMD Basic Example – Volumetric Design w/ Performance Verification• New Jersey
• APA (Rutting)• Texas OT (Cracking)• Mixes are designed
to optimize performance not around a target air void content
AMAP | 2017
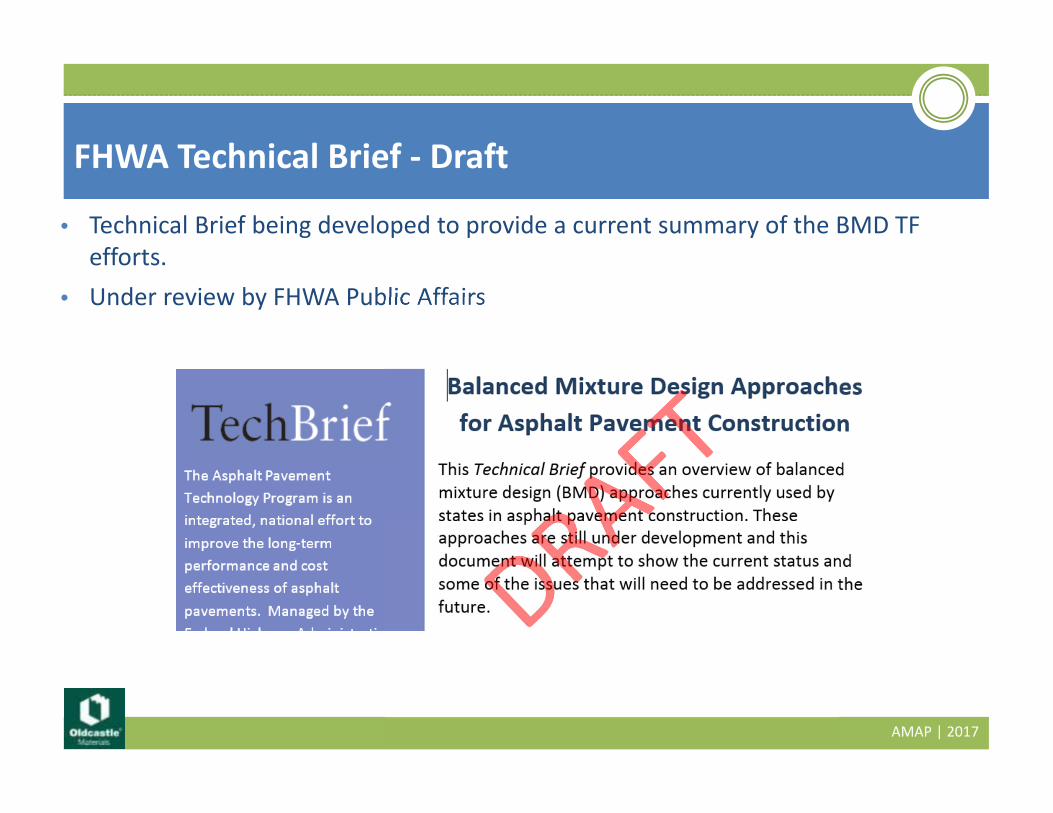
• Technical Brief being developed to provide a current summary of the BMD TF efforts.
• Under review by FHWA Public Affairs
FHWA Technical Brief ‐ Draft
AMAP | 2017
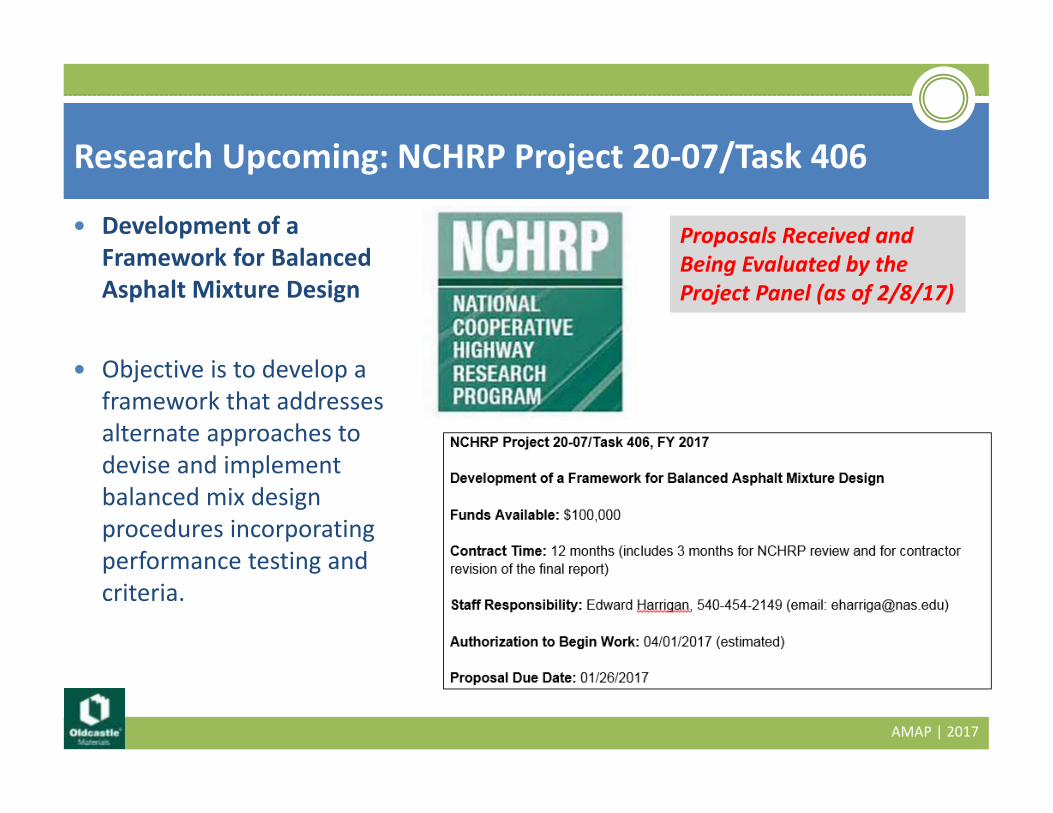
Research Upcoming: NCHRP Project 20‐07/Task 406
Development of a Framework for Balanced Asphalt Mixture Design
Objective is to develop a framework that addresses alternate approaches to devise and implement balanced mix design procedures incorporating performance testing and criteria.
Proposals Received and Being Evaluated by the Project Panel (as of 2/8/17)
AMAP | 2017
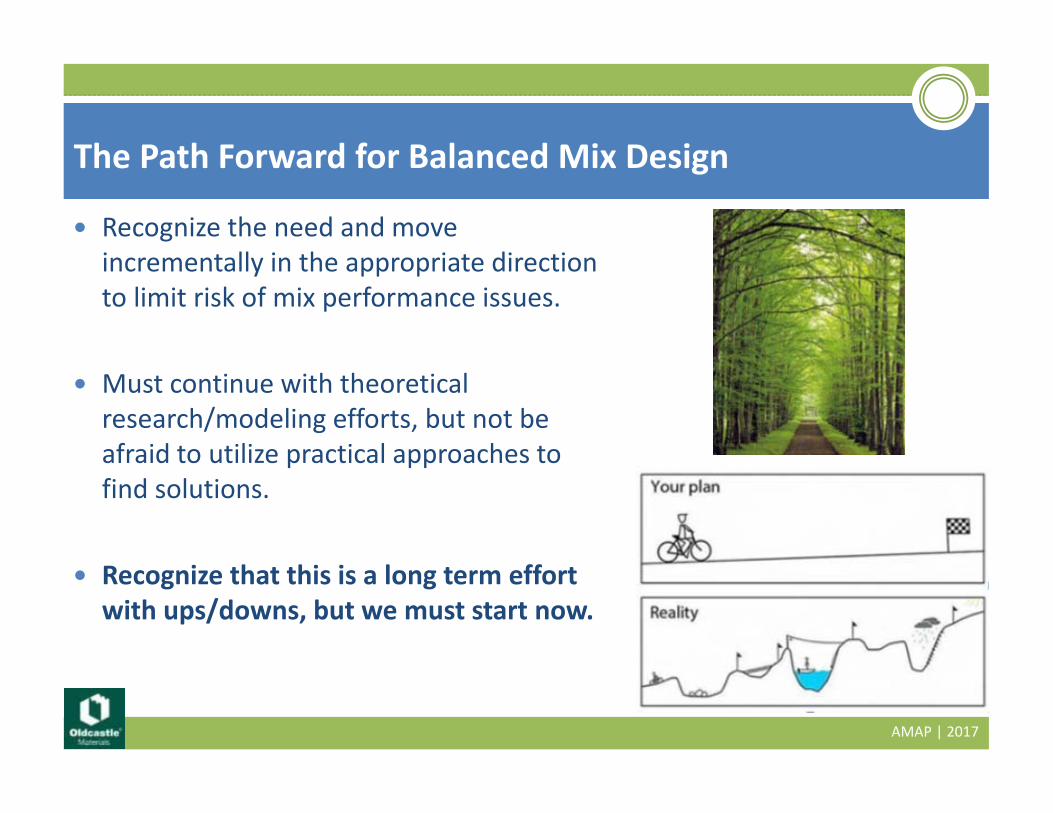
The Path Forward for Balanced Mix Design
Recognize the need and move incrementally in the appropriate direction to limit risk of mix performance issues.
Must continue with theoretical research/modeling efforts, but not be afraid to utilize practical approaches to find solutions.
Recognize that this is a long term effort with ups/downs, but we must start now.
AMAP | 2017
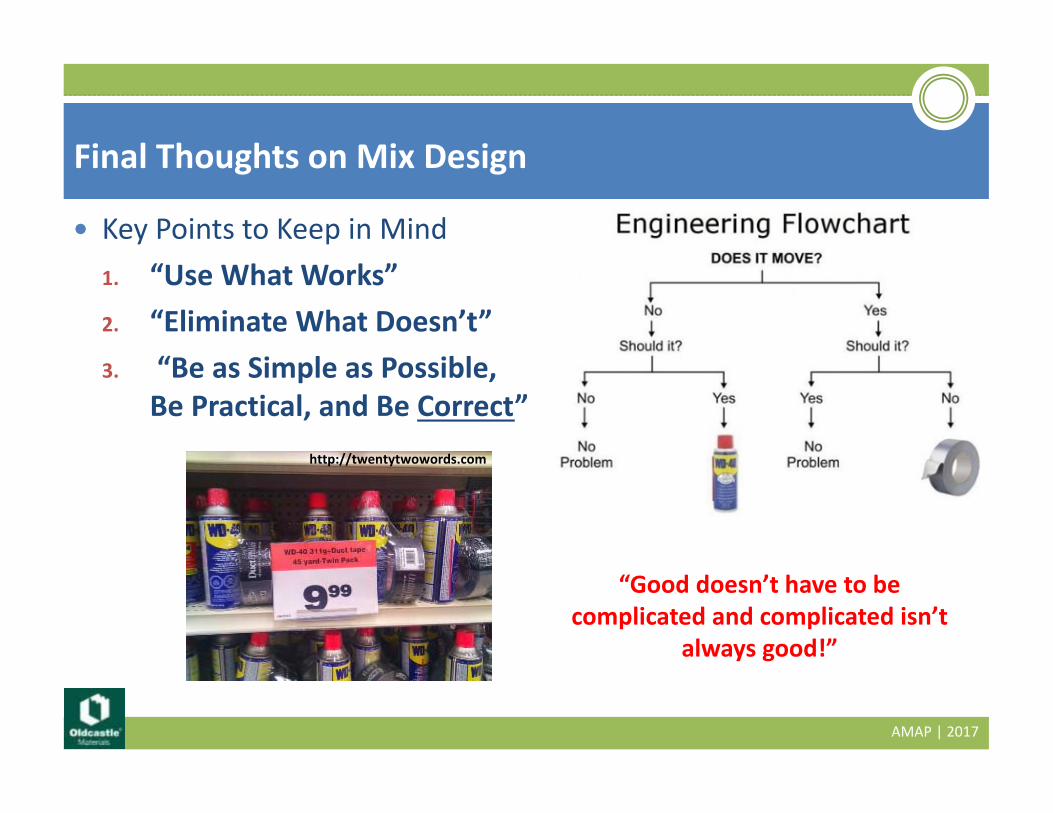
Key Points to Keep in Mind1. “Use What Works”2. “Eliminate What Doesn’t”3. “Be as Simple as Possible,
Be Practical, and Be Correct”
Final Thoughts on Mix Design
“Good doesn’t have to be complicated and complicated isn’t
always good!”
http://twentytwowords.com
AMAP | 2017
Thoughts and Questions?
http://www.pennyauctionwatch.com/
AMAP | 2017


