

BANGLADESH RICE JOURNAL (Bangladesh Rice J.)
ISSN 1025-7330
VOL. 22 No. 2 December 2018
CONTENTS
1 S Parveen, M A Ali and M A Ali. Screening Rice Germplasm against Sheath Blight Disease of Rice and its Integrated Management in Bangladesh
13 M S Ahmed, E S M H Rashid, N Akter and M Khalequzzaman. Morphological Characterization and Diversity of T. Aman Rice Germplasm of Bangladesh
23 K P Halder, M S Islam, M R Manir and M A Ali. Moisture Stress and Different Rates of Nutrients on The Growth and Yield of Rice
31 M J Hasan, M U Kulsum, A K Paul, P L Biswas, M H Rahman, A Ansari, A Akter, L F Lipi, S J Mohiuddin and M Zahid-Al-Rafiq. Assessment of Variability for Floral Characteristics and Out-Crossing Rate in CMS Lines of Hybrid Rice
41 M Z Islam, M Khalequzzaman, M K Bashar , N A Ivy, M M Haque, M A K Mian and M Tomita. Agro-morphological Characterization of Bangladeshi Aromatic Rice (Oryza sativa L.) Germplasm Based on Qualitative Traits
55 S Parveen, M R Bhuiwan, M A I Khan and M A Ali. Effect of Planting Time on Sheath Blight Disease of Rice in Bangladesh
63 A T M S Hossain, F Rahman and P K Saha. Performance of Prilled Urea and Urea Super Granule by Applicators on Yield and Nitrogen Use Efficiency in Boro Rice
71 F Rahman, A T M S Hossain and M R Islam. Integrated Effects of Poultry Manure and Chemical Fertilizer on Yield, Nutrient Balance and Economics of Wetland Rice Culture
79 L F Lipi, M J Hassan, A Akter, P L Biswas, M U Kulsum, A Ansari and M Z Islam. Variability Assessment of Different Maintainer Lines for Hybrid Rice Development Based on Qualitative Traits

Bangladesh Rice J. 22 (2) : 1-12, 2018, doi.org/10.3329/brj.v22i2.44047
1Senior Scientific Officer, Training Division, BRRI, Gazipur 1701, 2Professor, Department of Plant Pathology, Faculty of Agriculture, BAU, Mymensingh and 3Director (Administration and Common Service), BRRI, Gazipur 1701. *Corresponding author’s E-mail: [email protected].
Screening Rice Germplasm against Sheath Blight Disease of Rice and its Integrated Management in Bangladesh
S Parveen1*, M A Ali2 and M A Ali3
ABSTRACT
Fifty-seven rice germplasm collected from BRRI Genebank were screened against sheath blight (ShB) by artificial inoculation in field and laboratory conditions in T. Aman 2012. Significant differences on relation to lesion height (RLH) among the germplasm were observed, where the highest (83%) was recorded in susceptible check, BR11 and the lowest (8.33%) was in Orgoja. Severity score of ShB was recorded maximum (9) in Dudhsail, Basi, Chaula mari, Holdemota, Calendamota, Semmua, Kotijira, Halisail, Horakani, Kalisura, Ashfuli, Huglapata and BR11 as highly susceptible to ShB, whereas it was minimum (1) in Orgoja. Gopal ghosh was observed as moderately tolerant with 27.33% RLH and severity score 3, while Kala binni, Khazur chari, Binni, Kalagora, Patjait and Dorkumur found moderately tolerant with severity score 5. In detached sheath inoculation method in test tube, most of the germplasms found highly susceptible, except Orgoja as resistant and Gopal ghosh as moderately tolerant. However, Orgoja showed resistance in both field inoculation and detached sheath inoculation methods. But, Dorkumur was found moderately tolerant in field and highly susceptible in detached sheath inoculation in laboratory. The experiment of Integrated Disease Management (IDM) packages was conducted in the farmer’s field with BR11 at Fulpur, Mymensingh during T. Aman 2013. The IDM practices of rice ShB resulted profound effect. Relative lesion height, percent disease index, tiller infection and hill infection were maximum (68%, 69%, 86% and 79% respectively) in T6 (control) and minimum in T1 [FDR (removal of floating debris) + 30 July transplanting + Potash (K) fertilizer (202 g decimal-1) + Top dressing of urea (247 kg ha-1) in four equal splits at 15 days interval + single spray of fungicides of Azoxystrobin 10% (0.17 kg ha-1) + Tebuconazole 90% (500 ml ha-1)]. Moreover, the highest number of panicles per m2, filled grains per panicle and grains yield were recorded in T1 (160, 150 and 6.25 t ha-1 respectively) and the minimum in T6 (227, 120 and 3.6 t ha-1 respectively). Therefore, the best IDM package was T1 for its effective control of ShB disease as well as yield maximization of rice. Finally, Orgoja could be used in resistance breeding for varietal improvement and the IDM package of T1 need to be recommended to prescribe in the farmer’s field after simulation in different AEZs and seasons with different varieties of Bangladesh. Key words: Germplasm, resistance, integrated management, sheath blight, rice
INTRODUCTION Bangladesh agriculture involves food production for 163.65 million people (Salam et al., 2014), where rice is the principal food. This increasing population requires increasing crop yields for stable supply of grain to achieve food security of the country. Consequently, the national average production needs to be increased from 3 to 5 t ha-1 in next 20 years (Mahbub et al., 2001). In Bangladesh, rice production area is 11.01 million hectares of land during 2016-17 (BBS, 2018). However,
36.27 million metric tons of rice is produced in the country during 2017-18 (AIS, 2019). Sheath blight (ShB) of rice was first reported in Japan by Miyakie in 1910. It is caused by Rhizoctonia solani Kuhn. It is considered as the most damaging major epidemic disease of rice (Li et al., 2012). ShB is an important disease of rice, especially in intensive rice production systems. The average incidence of ShB in Bangladesh is about 20.3% (Ali et al., 2003). The yield loss caused by ShB in Bangladesh ranged from 14 to 31% under farmer's field (Shahjahan et al., 1986). The presence of one or many factors

2 Parveen et al
may enhance the severity of ShB beyond economic threshold levels, thereby incurring low to high yield losses.
Incidence and development of ShB of rice
depends on climate, host and soil factor
(Damicone et al., 1993). Short duration and
semi-dwarf cultivars are more susceptible to
ShB (Groth and Lee, 2002). During rice ShB
epidemics, severe lodging may occur (Wu et
al., 2012). Differences in yield loss between
very susceptible and moderately resistant
cultivars are substantial. On infection by
Rhizoctonia solani, semi-dwarf varieties show
more than twice the reduction in yield and
milling quality.
Breeding for resistance against ShB has
not been successful due to lack of sources of
resistant genes (Rao, 1995; Hashiba and
Kobayashi, 1996). Resistance source against
ShB disease of rice is not available in
Bangladesh and anywhere (Jalal Uddin et al.,
2000). Consequently, none of the high yielding
varieties is resistant to ShB disease neither in
Bangladesh nor elsewhere in the world.
Fortunately, rice land races have proven to be
highly adaptive to diverse environmental
conditions and are believed to harbour a
number of valuable genetic resources for crop
improvement (Karmakar et al., 2012;
Roychowdhury et al., 2013; Ganie et al., 2014).
Some of the landraces such as Buhjan,
Banshpata, Bhasamanik, Nagra Sail, Raghu
Sail are tolerant to rice ShB (Dey, 2014).
Therefore, local or land races of rice need to be
exploited for getting resistant or moderately
resistant or even better tolerant sources for ShB
disease.
The control of ShB in the field so far is
mainly relied on the use of fungicides, which is
not sustainable for its residual effect along
with the potential risk of resistant to
fungicides overtime. Disease management
programme against ShB can concentrate
different approaches such as incorporating
cultural practices, exploitation of host
resistance, biological control with Trichoderma
harzianum and Trichoderma viride and chemical
control. Ashrafuzzaman et al. (2005) also
reported that emphasis should be given on
different management options to control ShB
disease of rice. For clean cultivation, burning
the crop residues, destroy grasses and other
hosts from the field, collecting and burying
floating debris after final land preparation may
reduce infection foci. Instead of applying
excess dose of nitrogen, split application of K
fertilizer with last top dress of urea can reduce
its infestation. Application of 40 kg MP/ha as
top dress in two equal splits and transplanting
with 20 cm × 20 cm spacing have affect on ShB
(Hossain and Mia, 2001). Large amount of N
and phosphate (P) is favourable for ShB
disease (Dasgupta, 1992) and high potash (K)
or PK is useful for infection (CRRI, 1977).
Therefore, the present research programme
was planned and designed to develop
management technologies of the disease with
the aim of recommending suitable control
strategies in Bangladesh. The present study
was under taken to screen germplasm for their
reaction to ShB and to develop an integrated
management practice for controlling ShB of
rice in Bangladesh.
MATERIALS AND METHODS Screening of rice germplasm against ShB of rice Rice germplasm. A total of 57 rice germplasm collected from BRRI Genebank were screened against ShB disease of rice in the field through hill inoculation method and BR11 was used as susceptible check (Table 1).

Screening Rice Germplasm against Sheath Blight Disease of Rice 3
Table 1. Primary information of the germplasms used for screening resistance source against sheath blight.
Acc. no.* Variety Acc. no. Variety Acc. no. Variety
4111 Gopal ghosh 4794 Kalahati 5221 Kalisura 4112 Chata bazail 4795 Khajur chhori 5222 Akra 4113 Ram dash 4849 Rayeda 5223 Ushi har 4114 Paizra 5121 Jamni 5250 Ashfuli 4118 Kala binni 5122 Chaula maghi 5286 Ranisalut 4149 Beto 5190 Bushi hara (mota) 5289 Buripagli 4155 Chini kani 5192 Lohamugra 5298 Harisankar 4156 Minki 5193 Chaula mari 5300 Birinde 4162 Kasrail 5194 Kalagora 5310 Orgoja 4163 Khazur chari 5195 Patjait 5316 Nonamurchi 4239 Binni 5196 Holdemota 5319 Gandhakusturi 4267 Birpala 5197 Kanchachikon 5327 Huglapata 4271 Rayda 5198 Dholeshwar mota 5329 Gota 4272 Dhaki rayda 5199 Calendamota 5330 Dorkumur 4768 Kaijhuri 5212 Semmua 5337 Changi 4773 Dudhsail 5213 Kotijira 5345 Rasasail 4777 Kashra 5217 Ashkor 5347 Sackhorkhana 4778 Katarangi 5218 Baskor -- BR11
4792 Basi 5219 Halisail
4793 Sada pankaich 5220 Horakani
* BRRI Genebank accession number.
Field experiment. The experiment was conducted at the experiment field of Bangladesh Rice Research Institute (BRRI), Gazipur during T. Aman 2012. A levee was made surrounding plots to maintain standing water up to 5.0 cm inside. Land was prepared 15 days before transplanting/seedling. Ploughing and cross ploughing followed by laddering was done by power tiller. Weeds were cleaned manually. The seedlings of the tested germplasms were raised in plastic tray in the Plant Pathology net house. Thirty-day-old 2-3 seedlings per hill were transplanted with a spacing of 20 cm × 15 cm. Fertilizers were applied @ 405: 150: 202: 135: 10 g decimal-1 of urea, TSP, MOP, gypsum and zinc sulphate. All fertilizers were applied in basal, except urea (Anonymous, 2010). For agronomic, weed management, irrigation and drainage and insect management current standard recommendations were followed (Anonymous, 2007).
Preparation of inoculum. One hundred PDA plates in glass petridishes were prepared following the standard procedure. The fungus (Rhizoctonia solani) was grown in the petridishes containing PDA medium and
incubated for seven days at room temperature (25 to 30°C) for growth and development of the pathogen.
Inoculation of pathogen. Inoculations were done at maximum tillering stage (Bhaktavatsalam et al., 1978). Two methods of inoculation were employed for inoculation of germplasms by Rhizoctonia solani. After seven days of inoculation lesion length and leaf sheath length were measured and calculated. The methods were as follows:
a. Hill inoculation-Total hill were
inoculated with Rhizoctonia solani Kuhn culture
(7 days) grown on PDA medium. Prior to
inoculation, eight hills were tagged randomly
in the central area of each plot in the field for
inoculation. Inoculation was done by inserting
a piece of culture medium (cutting the culture
medium into eight pieces) at the middle of
each hill in the afternoon, colonized by the ShB
pathogen in a tagged rice hill and maintained
standing water onward of the crop growth to
maintained high moisture below canopy level
for disease development (Sharma and Teng,
1990).

4 Parveen et al
b. Detached sheath inoculation-Detached sheath was inoculated in moist test tube (Fig. 1). In detached sheath inoculation method, one tiller from each entry was taken i.e. three tillers for three replications. Tillers were cut in such a way that leaf sheath did not separate from stem or remain in contact with stem and uniform in size. Water soaked cotton was placed at the bottom of the test tube and then placed 6-9 mm mycelial block (growing pathogen) inside the sheath. The test tube was then plugged with soaked cotton.
Data recording. The disease severity was recorded from the data collected from 25 hills in each replication of each treatment. Severity was calculated by relative lesion height (RLH) (McKinney, 1923). Data were recorded for each treatment following standard evaluation system (SES) for rice in 0-9 scale (Anonymous, 1996). Data of the lesion height, plant height, 1000 grain weight and grain yield (g hill-1) were also recorded. In detached sheath inoculation method, ShB severity was measured by RLH using the following formula-
Lesion height (cm) RLH = ------------------------------ × 100
Leaf sheath height (cm)
Integrated management of ShB of rice
Field experiment. The experiment was conducted in the farmer’s field with BR11 at Fulpur, Mymensingh during T. Aman 2013. Plant to plant spacing was 15 cm and row to row distance was 16 cm. Randomized RCBD was used with four replications. Plot size was
Fig. 1. Detached sheath inoculation method of screening
against ShB of rice.
2.5 m × 4 m. Plot to plot distance was 0.5 m
and block to block distance was 1 m. The best
options obtained from the results of different
experiments (Parveen, 2016) were included
into integrated disease management (IDM)
packages and were simulated in the field. The
treatments used in this study were shown
below:
T1=FDR (removal of floating debris) + 30 July
planting + Potash (K) fertilizer (202 g decimal-
1) + Top dressing of urea (247 kg ha-1) in four
equal splits at 15 days interval + single spray
of fungicide [Azoxystrobin 10% (0.17 kg ha-1) +
Tebuconazole 90% (500 ml ha-1)]. T2= 30 July
planting + K-dose + top dressing of urea in
four equal splits at 15 days interval + single
spray of fungicide. T3= K-dose + top dressing
of urea in four equal splits at 15 days interval +
single spray of fungicide. T4= Top dressing of
urea in four equal splits at 15 days interval +
single spray of fungicide. T5= Single spray of
fungicide. T6= Control.
Inoculation of pathogen. Same as hill
inoculation method.
Data collection. Twenty-five hills were
selected at random from each experimental
unit. Number of infected tillers and hills were
counted. Incidence was recorded by tiller
infection and expressed in percentage, while
severity by relative lesion height (RLH) and
percent disease index (PDI) (McKinney, 1923).
Data were recorded for each treatment
following standard evaluation system (SES)
for rice in 0-9 scale (Anonymous, 1996). Data
on total tiller, infected tiller, plant height,
panicle per m2, filled grain, unfilled grain, 1000
grain weight (TGW) and grain yield were also
recorded. PDI was measured by using the
following formula-
Total rating
PDI = --------------------------------------------- × 100 No. of observation × Maximum grade

Screening Rice Germplasm against Sheath Blight Disease of Rice 5
Statistical analysis. The data were subjected to statistical analysis and ANOVA (analysis of variance) were constructed following RCBD by SPSS 2.05 programme for both the experiments. The treatment means were compared by LSD test at probability level P=0.05. RESULTS AND DISCUSSION Assessment of germplasm against ShB of rice Table 2 shows that there was a variation
among the germplasms on ShB disease
development and yield through hill
inoculation in the field. Significant differences
on RLH among the germplasms were
observed. The highest RLH was recorded in
BR11 (83%) and the lowest was in Orgoja
(8.33%). The maximum (9) severity (SES) score
of ShB was recorded in Dudhsail, Basi, Chaula
mari, Holdemota, Calendamota, Semmua,
Kotijira, Halisail, Horakani, Kalisura, Ashfuli,
Huglapata and BR11, which were highly
susceptible (HS) to ShB disease, whereas the
minimum severity score (1) was observed in
Orgoja. Gopal ghosh was observed as
moderately tolerant to ShB disease with
27.33% RLH and severity score 3. Moreover,
Kala binni, Khazur chari, Binni, Kalagora,
Patjait and Dorkumur found moderately
tolerant to ShB with severity score 5. On the
other hand, the highest yield was found in
Beto (18.23 g hill-1), Rayda (18.15), Ushi har
(18.23) and Buripagli (18.15) and the lowest in
Kashra, Calendamota, Orgoja and
Sackhorkhana (4.85 g hill-1) germplasms (Table
3).
Table 2. Reaction of screened germplasm against ShB due to artificial inoculation of Rhizoctonia solani through hill
inoculation method in the field.
Acc. no. Variety Growth duration Plant height (cm) RLH (%) SES score Reaction
4111 Gopal ghosh 150 131 27.33 3 MT
4112 Chata bazail 151 140 47.66 7 HS
4113 Ram dash 152 144 54.00 7 HS
4114 Paizra 149 127 63.00 7 HS
4118 Kala binni 151 129 38.00 5 MT
4149 Beto 155 154 53.00 7 HS
4155 Chini kani 147 141 61.66 7 HS
4156 Minki 156 141 61.33 7 HS
4162 Kasrail 154 141 53.66 7 HS
4163 Khazur chari 148 141 41.33 5 MT
4239 Binni 147 137 43.66 5 MT
4267 Birpala 141 136 54.33 7 HS
4271 Rayda 149 136 50.33 7 HS
4272 Dhaki rayda 146 150 60.00 7 HS
4768 Kaijhuri 142 119 56.33 7 HS
4773 Dudhsail 154 149 69.00 9 HS
4777 Kashra 145 147 51.66 7 HS
4778 Katarangi 145 151 64.66 7 HS
4792 Basi 140 115 75.33 9 HS
4793 Sada pankaich 138 149 53.66 7 HS
4794 Kalahati 143 149 62.33 7 HS
4795 Khajur chhori 142 150 56.66 7 HS
4849 Rayeda 145 152 56.33 7 HS
5121 Jamni 147 150 64.66 7 HS
5122 Chaula maghi 149 144 63.33 7 HS
5190 Bushi hara (mota) 150 153 57.00 7 HS
5192 Lohamugra 149 150 55.33 7 HS

6 Parveen et al
Acc. no. Variety Growth duration Plant height (cm) RLH (%) SES score Reaction
5193 Chaula mari 145 151 72.66 9 HS
5194 Kalagora 149 141 42.33 5 MT
5195 Patjait 149 152 45.00 5 MT
5196 Holdemota 150 146 68.66 9 HS
5197 Kanchachikon 153 156 64.66 7 HS
5198 Dholeshwar mota 154 165 60.33 7 HS
5199 Calendamota 155 161 66.33 9 HS
5212 Semmua 152 142 69.33 9 HS
5213 Kotijira 150 134 70.00 9 HS
5217 Ashkor 149 146 55.33 7 HS
5218 Baskor 150 158 49.33 7 HS
5219 Halisail 148 149 66.00 9 HS
5220 Horakani 148 166 67.33 9 HS
5221 Kalisura 149 144 74.33 9 HS
5222 Akra 148 174 54.00 7 HS
5223 Ushi har 152 144 52.66 7 HS
5250 Ashfuli 161 98 66.66 9 HS
5286 Ranisalut 165 147 59.00 7 HS
5289 Buripagli 163 165 58.33 7 HS
5298 Harisankar 153 164 51.33 7 HS
5300 Birinde 157 150 64.66 7 HS
5310 Orgoja 160 160 8.33 1 R
5316 Nonamurchi 155 152 55.00 7 HS
5319 Gandhakusturi 152 139 65.00 7 HS
5327 Huglapata 154 147 73.33 9 HS
5329 Gota 151 152 57.66 7 HS
5330 Dorkumur 159 153 41.66 5 MT
5337 Changi 151 151 55.66 7 HS
5345 Rasasail 159 113 62.33 7 HS
5347 Sackhorkhana 153 128 53.66 7 HS
-- BR11 145 115 83.00 9 HS
LSD (P=0.05)
MT=Moderately tolerant, HS=Highly susceptible, R=Resistant. Table 3. Yield and 1000 grain weight (TGW) of screened germplasms against ShB due to artificial inoculation of Rhizoctonia solani through hill inoculation in the field.
Acc. no. Variety TGW (g) Yield (g hill-1)
4111 Gopal ghosh 20.13 6.92 4112 Chata bazail 21.14 8.17 4113 Ram dash 24.63 9.05 4114 Paizra 25.05 9.60 4118 Kala binni 29.11 10.05 4149 Beto 20.38 18.23 4155 Chini kani 9.19 5.30 4156 Minki 29.27 6.32 4162 Kasrail 26.14 14.55 4163 Khazur chari 21.44 7.24 4239 Binni 10.22 8.22 4267 Birpala 20.33 10.92 4271 Rayda 24.37 18.15 4272 Dhaki rayda 12.40 10.36
4768 Kaijhuri 29.16 10.28
4773 Dudhsail 14.03 10.07 4777 Kashra 16.05 4.85
Table 2. Continued.
Screening Rice Germplasm against Sheath Blight Disease of Rice 7
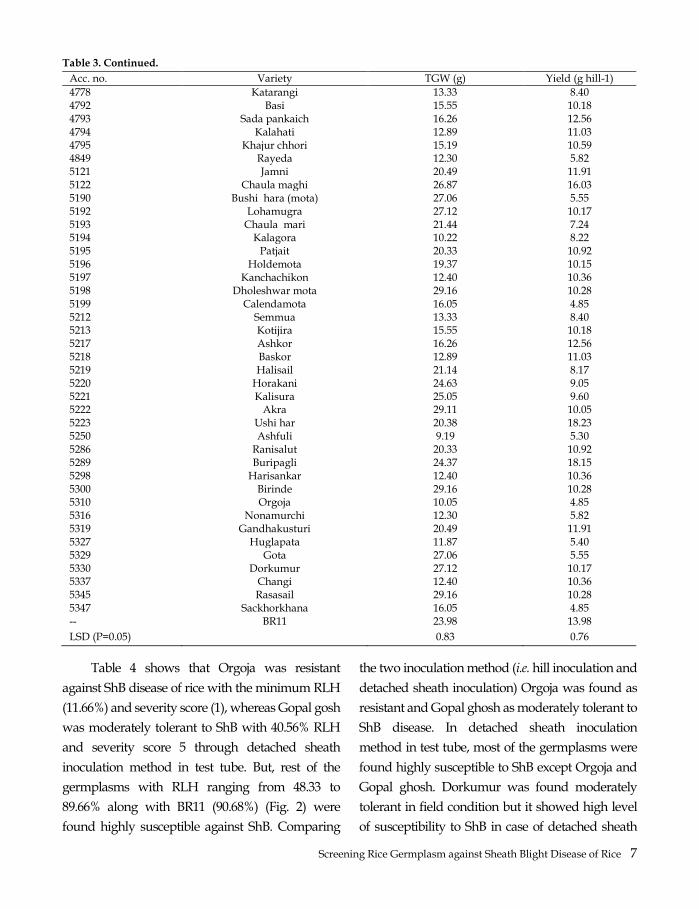
Table 3. Continued. Acc. no. Variety TGW (g) Yield (g hill-1)
4778 Katarangi 13.33 8.40 4792 Basi 15.55 10.18 4793 Sada pankaich 16.26 12.56 4794 Kalahati 12.89 11.03 4795 Khajur chhori 15.19 10.59 4849 Rayeda 12.30 5.82 5121 Jamni 20.49 11.91 5122 Chaula maghi 26.87 16.03 5190 Bushi hara (mota) 27.06 5.55 5192 Lohamugra 27.12 10.17 5193 Chaula mari 21.44 7.24 5194 Kalagora 10.22 8.22 5195 Patjait 20.33 10.92 5196 Holdemota 19.37 10.15 5197 Kanchachikon 12.40 10.36 5198 Dholeshwar mota 29.16 10.28 5199 Calendamota 16.05 4.85 5212 Semmua 13.33 8.40 5213 Kotijira 15.55 10.18 5217 Ashkor 16.26 12.56 5218 Baskor 12.89 11.03 5219 Halisail 21.14 8.17 5220 Horakani 24.63 9.05 5221 Kalisura 25.05 9.60 5222 Akra 29.11 10.05 5223 Ushi har 20.38 18.23 5250 Ashfuli 9.19 5.30 5286 Ranisalut 20.33 10.92 5289 Buripagli 24.37 18.15 5298 Harisankar 12.40 10.36 5300 Birinde 29.16 10.28 5310 Orgoja 10.05 4.85 5316 Nonamurchi 12.30 5.82 5319 Gandhakusturi 20.49 11.91 5327 Huglapata 11.87 5.40 5329 Gota 27.06 5.55 5330 Dorkumur 27.12 10.17 5337 Changi 12.40 10.36 5345 Rasasail 29.16 10.28 5347 Sackhorkhana 16.05 4.85 -- BR11 23.98 13.98
LSD (P=0.05) 0.83 0.76
Table 4 shows that Orgoja was resistant
against ShB disease of rice with the minimum RLH
(11.66%) and severity score (1), whereas Gopal gosh
was moderately tolerant to ShB with 40.56% RLH
and severity score 5 through detached sheath
inoculation method in test tube. But, rest of the
germplasms with RLH ranging from 48.33 to
89.66% along with BR11 (90.68%) (Fig. 2) were
found highly susceptible against ShB. Comparing
the two inoculation method (i.e. hill inoculation and
detached sheath inoculation) Orgoja was found as
resistant and Gopal ghosh as moderately tolerant to
ShB disease. In detached sheath inoculation
method in test tube, most of the germplasms were
found highly susceptible to ShB except Orgoja and
Gopal ghosh. Dorkumur was found moderately
tolerant in field condition but it showed high level
of susceptibility to ShB in case of detached sheath
8 Parveen et al
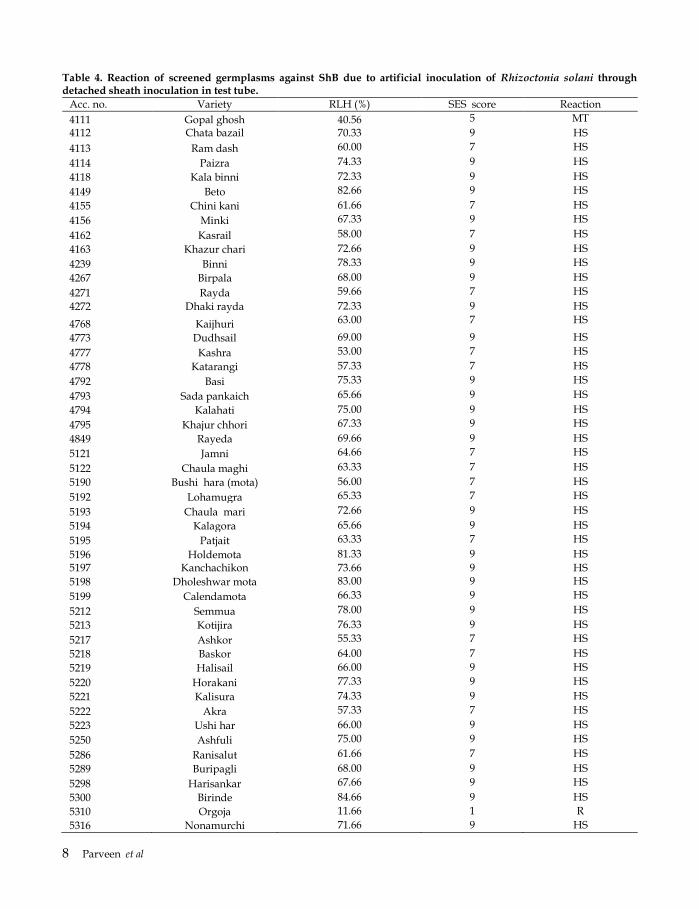
Table 4. Reaction of screened germplasms against ShB due to artificial inoculation of Rhizoctonia solani through detached sheath inoculation in test tube.
Acc. no. Variety RLH (%) SES score Reaction
4111 Gopal ghosh 40.56 5 MT
4112 Chata bazail 70.33 9 HS
4113 Ram dash 60.00 7 HS
4114 Paizra 74.33 9 HS
4118 Kala binni 72.33 9 HS
4149 Beto 82.66 9 HS
4155 Chini kani 61.66 7 HS
4156 Minki 67.33 9 HS
4162 Kasrail 58.00 7 HS
4163 Khazur chari 72.66 9 HS
4239 Binni 78.33 9 HS
4267 Birpala 68.00 9 HS
4271 Rayda 59.66 7 HS
4272 Dhaki rayda 72.33 9 HS
4768 Kaijhuri 63.00 7 HS
4773 Dudhsail 69.00 9 HS
4777 Kashra 53.00 7 HS
4778 Katarangi 57.33 7 HS
4792 Basi 75.33 9 HS
4793 Sada pankaich 65.66 9 HS
4794 Kalahati 75.00 9 HS
4795 Khajur chhori 67.33 9 HS
4849 Rayeda 69.66 9 HS
5121 Jamni 64.66 7 HS
5122 Chaula maghi 63.33 7 HS
5190 Bushi hara (mota) 56.00 7 HS
5192 Lohamugra 65.33 7 HS
5193 Chaula mari 72.66 9 HS
5194 Kalagora 65.66 9 HS
5195 Patjait 63.33 7 HS
5196 Holdemota 81.33 9 HS
5197 Kanchachikon 73.66 9 HS
5198 Dholeshwar mota 83.00 9 HS
5199 Calendamota 66.33 9 HS
5212 Semmua 78.00 9 HS
5213 Kotijira 76.33 9 HS
5217 Ashkor 55.33 7 HS
5218 Baskor 64.00 7 HS
5219 Halisail 66.00 9 HS
5220 Horakani 77.33 9 HS
5221 Kalisura 74.33 9 HS
5222 Akra 57.33 7 HS
5223 Ushi har 66.00 9 HS
5250 Ashfuli 75.00 9 HS
5286 Ranisalut 61.66 7 HS
5289 Buripagli 68.00 9 HS
5298 Harisankar 67.66 9 HS
5300 Birinde 84.66 9 HS
5310 Orgoja 11.66 1 R
5316 Nonamurchi 71.66 9 HS
Screening Rice Germplasm against Sheath Blight Disease of Rice 9
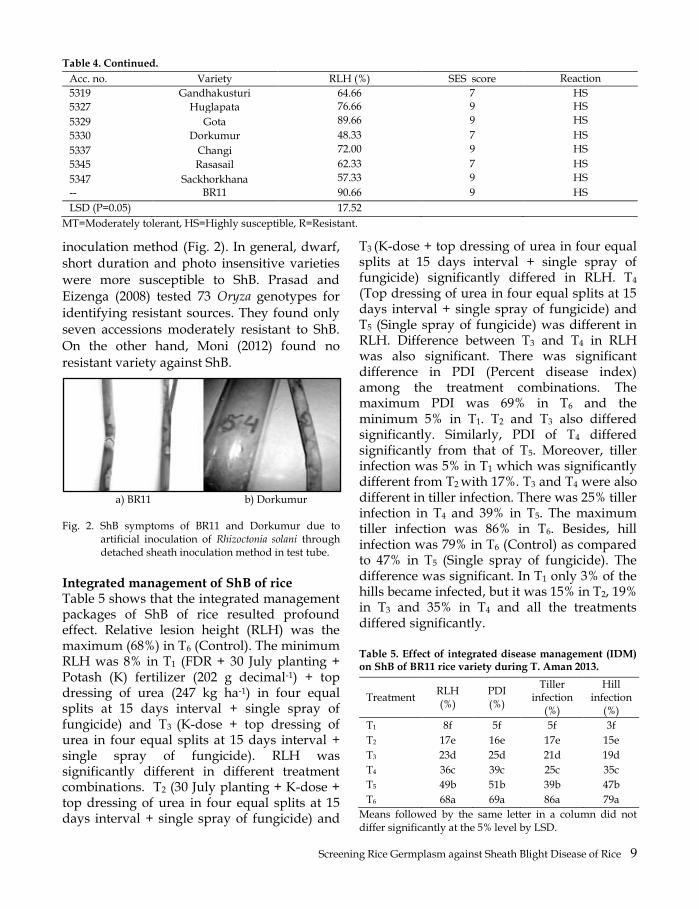
Acc. no. Variety RLH (%) SES score Reaction
5319 Gandhakusturi 64.66 7 HS
5327 Huglapata 76.66 9 HS
5329 Gota 89.66 9 HS
5330 Dorkumur 48.33 7 HS
5337 Changi 72.00 9 HS
5345 Rasasail 62.33 7 HS
5347 Sackhorkhana 57.33 9 HS
-- BR11 90.66 9 HS
LSD (P=0.05) 17.52
MT=Moderately tolerant, HS=Highly susceptible, R=Resistant.
inoculation method (Fig. 2). In general, dwarf, short duration and photo insensitive varieties were more susceptible to ShB. Prasad and Eizenga (2008) tested 73 Oryza genotypes for identifying resistant sources. They found only seven accessions moderately resistant to ShB. On the other hand, Moni (2012) found no resistant variety against ShB.
a) BR11 b) Dorkumur
Fig. 2. ShB symptoms of BR11 and Dorkumur due to
artificial inoculation of Rhizoctonia solani through detached sheath inoculation method in test tube.
Integrated management of ShB of rice Table 5 shows that the integrated management packages of ShB of rice resulted profound effect. Relative lesion height (RLH) was the maximum (68%) in T6 (Control). The minimum RLH was 8% in T1 (FDR + 30 July planting + Potash (K) fertilizer (202 g decimal-1) + top dressing of urea (247 kg ha-1) in four equal splits at 15 days interval + single spray of fungicide) and T3 (K-dose + top dressing of urea in four equal splits at 15 days interval + single spray of fungicide). RLH was significantly different in different treatment combinations. T2 (30 July planting + K-dose + top dressing of urea in four equal splits at 15 days interval + single spray of fungicide) and
T3 (K-dose + top dressing of urea in four equal splits at 15 days interval + single spray of fungicide) significantly differed in RLH. T4 (Top dressing of urea in four equal splits at 15 days interval + single spray of fungicide) and T5 (Single spray of fungicide) was different in RLH. Difference between T3 and T4 in RLH was also significant. There was significant difference in PDI (Percent disease index) among the treatment combinations. The maximum PDI was 69% in T6 and the minimum 5% in T1. T2 and T3 also differed significantly. Similarly, PDI of T4 differed significantly from that of T5. Moreover, tiller infection was 5% in T1 which was significantly different from T2 with 17%. T3 and T4 were also different in tiller infection. There was 25% tiller infection in T4 and 39% in T5. The maximum tiller infection was 86% in T6. Besides, hill infection was 79% in T6 (Control) as compared to 47% in T5 (Single spray of fungicide). The difference was significant. In T1 only 3% of the hills became infected, but it was 15% in T2, 19% in T3 and 35% in T4 and all the treatments differed significantly. Table 5. Effect of integrated disease management (IDM) on ShB of BR11 rice variety during T. Aman 2013.
Treatment RLH (%)
PDI (%)
Tiller infection
(%)
Hill infection
(%)
T1 8f 5f 5f 3f
T2 17e 16e 17e 15e
T3 23d 25d 21d 19d
T4 36c 39c 25c 35c
T5 49b 51b 39b 47b
T6 68a 69a 86a 79a
Means followed by the same letter in a column did not differ significantly at the 5% level by LSD.
Table 4. Continued.

10 Parveen et al
Table 6 shows that the effect of integrated management of ShB on yield and yield components. The maximum number of panicles per m2 was recorded in T1 (260) and the minimum in T6 (Control) (227). There was no difference between T5 (231) and T6. However, the number of panicles per m2 was 251 in T2, 245 in T3, 238 in T4 and 231 in T5 and all the treatments differed significantly. Number of filled grains per panicle was also significantly different in different treatments. It was 150 and 145 in T1 and T2. The minimum number of filled grains per panicle was recorded in T6 (120) which differed significantly for that in T5 (125). Significant difference was also observed between T3 (139) and T4 (131). Number of unfilled grains was the lowest in T1 and the maximum in T6. Significant difference was also observed between T3 and T4 as well as T5 and T6. Similarly, difference between T4 and T5 was also significant in number of unfilled grains per panicle. But there was no effect of integrated management of ShB on grain size. Weight of 1000 grain was 20 g in all treatments. Significant difference was observed between the treatments in grain yield of rice due to integrated management of ShB disease. The maximum yield was recorded in T1 (6.3 t ha-1) and the minimum in T6 (3.6 t ha-
1). Yield was 6.0 t ha-1 in T2 as compared to 5.5 t ha-1 in T3 and the difference was significant. Similarly, T4 produced 5.2 t ha-1 which was significantly lower than that of T5 (4.5).
Finally, the present study revealed that the best IDM package was T1 which included removal of floating debris, transplanting on 30 July, potash (K) fertilizer (202 g decimal-1), urea top dressing (247 kg ha-1) in four equal splits at 15 days interval and single spray of Azoxystrobin (10%) + Tebuconazole (90%) combination. Because, the maximum RLH, PDI, tiller infection and hill infection were found in control plot (T6), whereas it was lower in the IDM packages and minimum in T1 plot. Grain yield was also significantly higher
in the IDM plots due to minimum incidence of ShB. Because, ShB was very low and grain yield was maximum in the plots where IDM was applied against ShB of rice due to its trace infection. Therefore, it can be concluded that the IDM package (T1) though highly effective to control ShB of rice, but the result needs validation across the ecosystem. However, Rhizoctonia solani is an universal soil borne facultative and epidemic pathogen. The pathogen is difficult to control unless control measure is taken on time. Many scientists narrated that a single method of control is not effective in most cases to control ShB but IDM is recommended by the researchers (Mew et al., 2004). Host resistance is a sustainable and economic method but there is no such resistant cultivar (Groth et al., 1993). Antagonist such as Trichoderma may be a good option to include in IDM package (Dey et al., 2004). ShB infection at flowering stage reduce grain yield due to higher amount of unfilled grains (Cu et al., 1996) as because of damage of leaf sheath by the disease, affect water and nutrients supply to the growing spikelets (Lee and Rush, 1983). Table 6. Effect of IDM on yield and yield components of
BR11 during T. Aman 2013.
Treatment Panicle per m2
Filled grain
panicle-1
Sterile pikelet
panicle-1
TGW (g)
Yield (t ha-1)
T1 260a 150a 40f 20 6.25a
T2 251b 145b 47e 20 6.00b
T3 245c 139c 53d 20 5.52c
T4 238d 131c 61c 20 5.15d
T5 231e 125d 67b 20 4.49e
T6 227e 120e 61a 20 3.60f
Significance * * *
CV (%) 5.15 8.65 18.40 0.0 19.16
LSD 0.05 4.00 3.50 4.90 NS 0.22
Means followed by the same letter did not differ at the 5% level by LSD. NS=Not significant. TGW=1000 grain weight

Screening Rice Germplasm against Sheath Blight Disease of Rice 11
CONCLUSIONS ShB of rice is considered as one of the major constraints of rice production in Bangladesh. Almost all HYVs and hybrid varieties are susceptible to the disease. Method for controlling the disease is an urgent need. Among the 57 germplasms, the local cultivar Orgoja (acc. no. 5310) showed resistance to ShB in both hill inoculation in field and detached sheath inoculation in test tube, which could be used in resistance breeding for varietal improvement programme of rice. On the other hand, the best integrated disease management (IDM) package was T1 which included removal of floating debris, transplanting on 30 July, potash (K) fertilizer (202 g decimal-1), top dressing of urea (247 kg ha-1) in four equal splits at 15 days interval and single spray of Azoxystrobin (10%) + Tebuconazole (90%) combination. Because, ShB was very low and grain yield was high in the plots where T1
package was applied. Therefore, it can be concluded that the IDM package (T1) though highly effective to control ShB of rice, but the result needs validation in the farmer’s field in different seasons with different rice varieties across the different AEZs of Bangladesh.
ACKNOWLEDGEMENTS This study was the part of the corresponding author’s PhD dissertation. The author acknowledges the scholarship and financial support given by NATP, BARC, Dhaka and research facilities provided by Plant Pathology Division, BRRI, Gazipur.
REFERENCES AIS (Agricultural Information Service). 2019. Krishi Diary
2019, Agricultural Information Service, Khamarbari, Farmgate, Dhaka 1215, Bangladesh. www.ais.gov.bd.
Ali, M A, M M Rahman, M A Latif, M Hossain, N R Sharma, S Akter, T A Mia and M A Nahar. 2003. Survey of rice sheath disease caused by different Rhizoctonia sp. in Bangladesh. In: Paper presented in the stakeholder workshop on Rice sheath blight disease complex, 3 December 2003. BRRI, Gazipur.
Anonymous. 1996. Standard Evaluation System for Rice. The International Rice Research Institute, Los Banos, Laguna, Philippines. p. 64.
Anonymous. 2007. Modern Rice Cultivation (Adhunik Dhaner Chas-Bangla version). Publication no. 5, 13th Edition. Bangladesh Rice Research Institute, Gazipur 1701.
Anonymous. 2010. Modern Rice Cultivation (Adhunik Dhaner Chas-Bangla version). Publication no. 5, 15th Edition. Bangladesh Rice Research Institute, Gazipur 1701.
Ashrafuzzaman, M H, M Jalaluddin, M I Kha1il and I Hossain. 2005. Integrated management of sheath blight of Aman rice. Bangladesh J. Plant. Pathol. 21 (1 and 2): 53-58.
BBS. 2018. Statistical Pocket Book Bangladesh 2017. Bangladesh Bureau of Statistics, Statistics and Informatics Division, Ministry of Planning, Govt. of the People’s Republic of Bangladesh.
Bhaktavatsalam, G, K Satyanarayana, A P K Reddy and V T John. 1978. Evaluation for sheath blight resistance in rice. Int. Rice Res. Newsl. 3: 9-10.
CRRI. 1977. Annual report. Central Rice Research Institute, Cuttack, India.
Cu, R M, T W Mew, K G Cassman and P S Teng. 1996. Effect of sheath blight on yield in tropical, intensive rice production system (in Chinese). Plant Disease. 80: 1103-1108.
Damicone, J R, M V Patel and W F Moore. 1993. Density of sclerotia of Rhizoctonia solani and incidence of sheath blight in rice fields in Mississippi. Pl. Dis. 77(3): 257-260.
Dasgupta, M K. 1992. Rice sheath blight: the challenge continues. Plant diseases of International Importance. 1: 130-157.
Dey, N. 2014. Harnessing the potential of indigenous rice lines: an issue of food sovereignty. In: J A Francis (ed.). CTA 2014. Department of Biotechnology, Visva-Bharati, Santiniketan, India.
Dey, R, K K Pal, D M Bhatt and S M Chauhan. 2004. Growth promotion and yield enhancement of peanut (Arachis hypogaea L.) by application of plant growth-promoting rhizobacteria. Microbiological Research. 159: 371-394.
Ganie, S A, J Karmakar, R Roy Chowdhury, T K Mondal and N Dey. 2014. Assessment of genetic diversity in salt-tolerant rice and its wild relatives for ten SSR loci and one allele mining primer of saltol gene located on 1st chromosome. Plant Systematics and Evolution (DOI 10.1007/s00606-014-0999-7, Published online).
12 Parveen et al
Groth, D and F Lee. 2002. Rice disease. In: W E Smith and R H Dilday (eds.). Rice: Origin, history, technology, and production. John Wiley and Sons, Hoboken, NJ. pp. 413-436.
Groth, D E, M C Rush, G G Giesler and C A Hollier. 1993. Foliar fungicides for use in the management of rice diseases. La. Agric. Exp. Stn. Bull. No. 840.
Hashiba, T and T Kobayashi. 1996. Rice diseases incited by Rhizoctonia species. In: B Sneh, S Jabaji-Hare, S Neate and G Dijst (eds.). Klewer Rhizoctonia species: Taxonomy, Molecular Biology, Ecology, Pathology and Disease Control. Academic Publisher, The Netherlands. pp. 331-340.
Hossain, M and M A T Mia. 2001. Management of sheath blight disease of rice under farmer’s field condition. Bangladesh J. Plant. Pathol. 17 (1 and 2): 13-16.
Jalaluddin, M, M A Kashem, M K Hasna and M I Khalil. 2000. Screening of some somaclonal progenies of rice for resistance to sheath blight and bacterial leaf blight. Crop Sci. 11 (1 and 2): 39-42.
Karmakar, J, R Roychowdhury, R K Kar, D Deb, N Dey and H S Srivastava. 2012. Profiling of selected indigenous rice (Oryza sativa L.) landraces of Rarh Bengal in relation to osmotic stress tolerance. Physiology and Molecular Biology of Plants. 18(2): 125-132.
Lee, F N and M C Rush. 1983. Rice sheath blight: A major rice disease. Plant Disease. 67 (7): 829-32.
Li, Di-q, Q-y Tang, Y-b Zhang, J-q Qin, H Li, L-j Chen, S-h Yang, Y-b Zou and S-b Peng. 2012. Effect of nitrogen regimes on grain yield, nitrogen utilization, radiation use efficiency, and sheath blight disease intensity in super hybrid rice. Journal of Integrative Agriculture. 11: 134-143.
Mahbub, A M, M Hossain and A Janaich. 2001. Hybrid rice adoption in Bangladesh. A socioeconomic assessment of farmer’s experience: Research Monograph. Series no. 18. Social Science Division, International Rice Research Institute (IRRI), Los Banos, Laguna, Philippines. p. 38.
McKinney, H H. 1923. A new system of grading plant diseases. Journal of Agriculture Research 26: 195-218.
Mew, T W, H Leung, S Savary, C M V Cruz and J E Leach. 2004. Looking ahead in rice disease research and management. Critical Reviews in Plant Science. 23: 103-127.
Miyakie, I. 1910. Studies über die Pilze der Reispflanzen in Japan. J. Coll. Agric. 2: 237-276.
Moni, Z R. 2012. Biological characterization and management of Rhizoctonia solani causal organism of rice sheath blight disease. PhD thesis, Department of Botany, University of Rajshahi, Rajshahi, Bangladesh.
Parveen, S. 2016. Management of sheath blight disease of rice. PhD thesis, Department of Genetics and Plant Breeding, BAU, Mymensingh, Bangladesh. p. 58.
Prasad, B and G C Eizenga. 2008. Rice sheath blight disease resistance identified in Oryza spp. accessions. Plant Dis. 92: 1503-1509.
Rao, K M. 1995. Sheath blight disease of rice. Daya Publishing House, Delhi-110035.
Roychowdhury, R, J Karmakar, M K Adak, N Dey and A Mitra. 2013. Physio-biochemical and microsatellite based profiling of lowland rice (Oryza sativa L.) landraces for osmotic stress tolerance. American Journal of Plant Sciences. 4(12C): 52-63.
Salam, M U, S M A Hossain, J K Biswas and A J Mridha. 2014. Managing the unmanageable: rice variety technology for future challenging food security in Bangladesh. Extended abstract in the Agronomic visions in challenging future, the proceedings of the 13th conference of the Bangladesh Society of Agronomy, 20 September 2014, Bangladesh Rice Research Institute (BRRI), Gazipur, Bangladesh.
Shahjahan, A K M, N R Sharma, H U Ahmed and S A Miah. 1986. Yield loss in modern rice varieties of Bangladesh due to sheath blight. Bangladesh J. of Agricutural Research. 11(2): 82-90.
Sharma, N R and P S Teng. 1990. Effects of inoculum source on sheath blight development. Int. Rice Res. Newsl. 15: 18-19.
Wu, W, J Huang, K Cui, L Nie, Q Wang, F Yang, F Shah, F Yao and S Peng. 2012. Sheath blight reduces stem breaking resistance and increases lodging susceptibility of rice plants. Field Crops Research. 128: 101-10
Bangladesh Rice J. 22 (2) : 13-22, 2018, doi.org/10.3329/brj.v22i2.44038
Genetic Resources and Seed Division, Bangladesh Rice Research Institute, Gazipur 1701. * Corresponding author’s E-mail: [email protected].
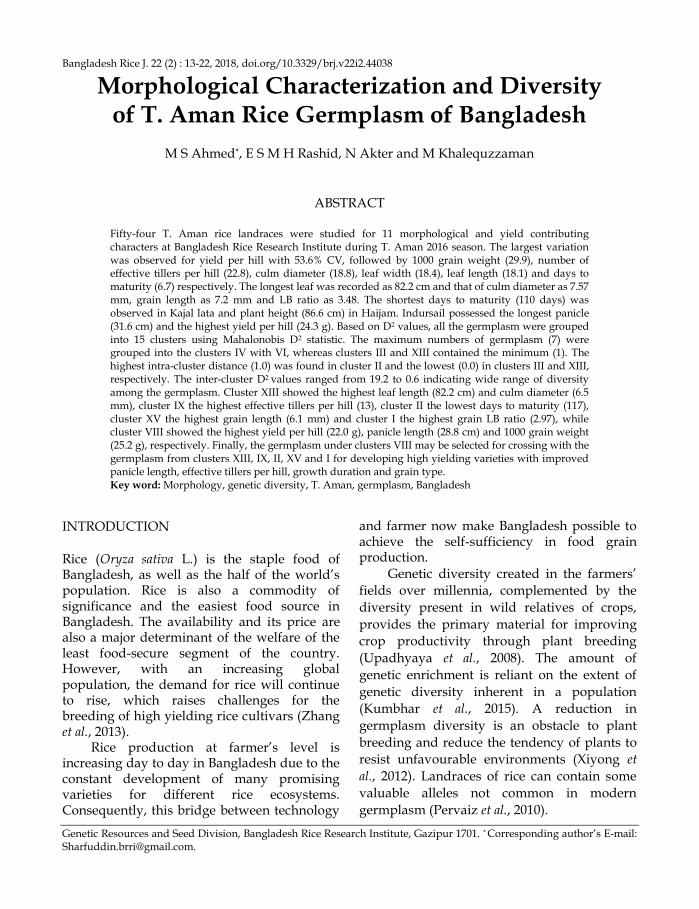
Morphological Characterization and Diversity of T. Aman Rice Germplasm of Bangladesh
M S Ahmed*, E S M H Rashid, N Akter and M Khalequzzaman
ABSTRACT
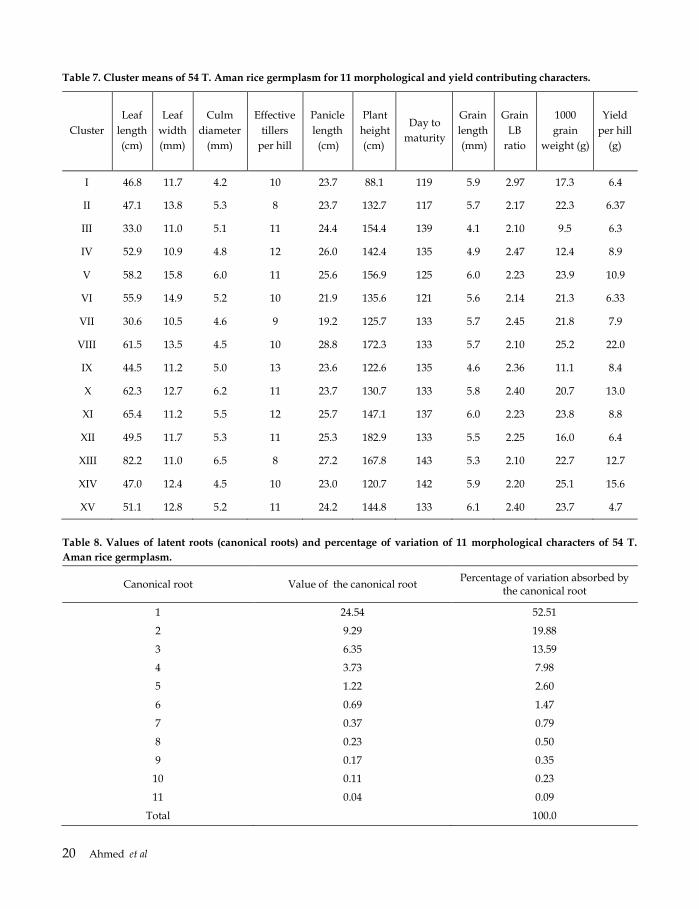
Fifty-four T. Aman rice landraces were studied for 11 morphological and yield contributing characters at Bangladesh Rice Research Institute during T. Aman 2016 season. The largest variation was observed for yield per hill with 53.6% CV, followed by 1000 grain weight (29.9), number of effective tillers per hill (22.8), culm diameter (18.8), leaf width (18.4), leaf length (18.1) and days to maturity (6.7) respectively. The longest leaf was recorded as 82.2 cm and that of culm diameter as 7.57 mm, grain length as 7.2 mm and LB ratio as 3.48. The shortest days to maturity (110 days) was observed in Kajal lata and plant height (86.6 cm) in Haijam. Indursail possessed the longest panicle (31.6 cm) and the highest yield per hill (24.3 g). Based on D2 values, all the germplasm were grouped into 15 clusters using Mahalonobis D2 statistic. The maximum numbers of germplasm (7) were grouped into the clusters IV with VI, whereas clusters III and XIII contained the minimum (1). The highest intra-cluster distance (1.0) was found in cluster II and the lowest (0.0) in clusters III and XIII, respectively. The inter-cluster D2 values ranged from 19.2 to 0.6 indicating wide range of diversity among the germplasm. Cluster XIII showed the highest leaf length (82.2 cm) and culm diameter (6.5 mm), cluster IX the highest effective tillers per hill (13), cluster II the lowest days to maturity (117), cluster XV the highest grain length (6.1 mm) and cluster I the highest grain LB ratio (2.97), while cluster VIII showed the highest yield per hill (22.0 g), panicle length (28.8 cm) and 1000 grain weight (25.2 g), respectively. Finally, the germplasm under clusters VIII may be selected for crossing with the germplasm from clusters XIII, IX, II, XV and I for developing high yielding varieties with improved panicle length, effective tillers per hill, growth duration and grain type. Key word: Morphology, genetic diversity, T. Aman, germplasm, Bangladesh
INTRODUCTION Rice (Oryza sativa L.) is the staple food of Bangladesh, as well as the half of the world’s population. Rice is also a commodity of significance and the easiest food source in Bangladesh. The availability and its price are also a major determinant of the welfare of the least food-secure segment of the country. However, with an increasing global population, the demand for rice will continue to rise, which raises challenges for the breeding of high yielding rice cultivars (Zhang et al., 2013).
Rice production at farmer’s level is increasing day to day in Bangladesh due to the constant development of many promising varieties for different rice ecosystems. Consequently, this bridge between technology
and farmer now make Bangladesh possible to achieve the self-sufficiency in food grain production.
Genetic diversity created in the farmers’
fields over millennia, complemented by the
diversity present in wild relatives of crops,
provides the primary material for improving
crop productivity through plant breeding
(Upadhyaya et al., 2008). The amount of
genetic enrichment is reliant on the extent of
genetic diversity inherent in a population
(Kumbhar et al., 2015). A reduction in
germplasm diversity is an obstacle to plant
breeding and reduce the tendency of plants to
resist unfavourable environments (Xiyong et
al., 2012). Landraces of rice can contain some
valuable alleles not common in modern
germplasm (Pervaiz et al., 2010).

14 Ahmed et al
Genetic variation in plant material is the
base for crop improvement (Iqbal et al., 2014).
Any crop improvement programme depends
on the utilization of germplasm. Evaluation
and characterization of existing landraces of
rice are important due to increasing needs of
varietal improvement. The pool of genetic
variation within a population is the basis for
selection as well as for plant improvement.
Before exploiting a population for trait
improvement, it is necessary to understand the
magnitude of variability in the population
which is fundamental for genetic improvement
in all crop species. Agro-morphological
characterization of germplasm accessions is
fundamental criteria in order to provide
information of plants (Lin, 1991) for plant
breeding programmes (Das and Ghosh, 2011).
Agro-morphological traits, both qualitative
and quantitative have been commonly and
traditionally used to estimate relationships
between genotypes (Goodman, 1972). Finally,
Lahkar and Tanti (2017) studied the
morphological variation of 22 aromatic rice
landraces of Assam using five qualitative and
seven quantitative traits and reported that in
rice improvement programme characterization
of landraces could help breeders to utilize
appropriate characters. Though a number of
transplanted Aman rice germplasm have
existed in different agro-climatic conditions of
Bangladesh but their characterization is not
sufficient. Therefore, the objectives of the
present study was to characterize using
morphological traits of the local transplanted
Aman rice germplasm of Bangladesh for
providing useful informations in rice breeding
programmes.
MATERIALS AND METHOD Fifty-four newly collected rice landraces from BRRI Genebank were studied for
genetic diversity through morphological characterization (Table 1). The experiment was conducted using a single row of 5.4 m long for each entry with a spacing of 25 × 20 cm between rows and plants respectively during T. Aman 2016 season at Genetic Resources and Seed Division, BRRI, Gazipur. The thirty-five-day-old single seedling was transplanted in randomized complete block design (RCBD) with three replications. All the fertilizers except N were applied @ 60:20:40:12 kg NPKS/ha at final land preparation. All fertilizers were applied in basal, except urea. Intercultural operations and pest control measures were taken as and when necessary.
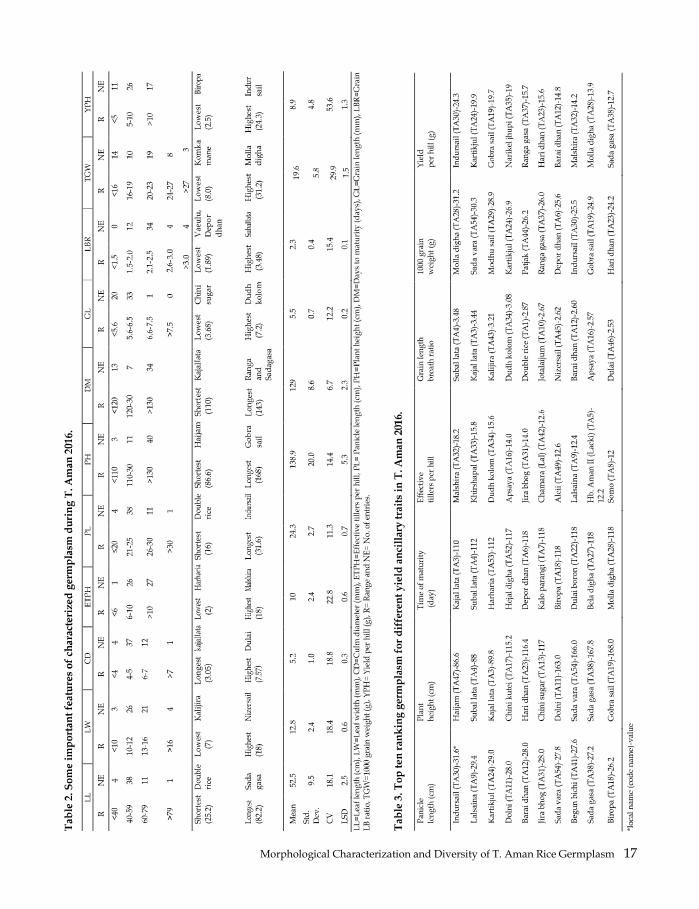
Data were collected on leaf length (cm), leaf width (mm), culm diameter (mm), effective tillers per hill, panicle length (cm), plant height (cm), days to maturity (days), grain length (mm), grain LB ratio, 1000 grain weight (TGW) and yield per hill (g). Simple statistics (means, ranges etc.) was calculated to have an idea of the level of variation. The genetic diversity was studied following Rao (1952), which was originally developed by the generalized distance (D2) as proposed by Mahalonobis (1936). The germplasm were grouped into clusters using canonical vector analysis. All the statistical analysis regarding diversity was carried out using the GENSTAT 5.5 software. RESULTS AND DISCUSSION Morphological characterization. Analysis of variance revealed that the 54 germplasm showed highly significant differences for all the 11 studied morphological characters. Table 2 presents the details of the characterization results. The largest variation was observed for yield per hill with 53.6% CV, followed by TGW (29.9), number of effective tillers per hill (22.8), culm diameter (18.8), leaf width (18.4), leaf length (18.1) and the smallest in days to maturity (6.7) respectively.

Morphological Characterization and Diversity of T. Aman Rice Germplasm 15
Table 1. List of rice germplasm characterized during T. Aman 2016.
Variety Code* Upazila District Variety Code* Upazila District
Double rice TA1 Kaliganj Jhenaidah Molla digha TA28 Shibalaya Manikganj
Tulshi mala TA2 Fulpur Mymensingh Modhu sail TA29 Shibalaya Manikganj
Kajal lata TA3 Jhikorgacha Jashore Indursail TA30 Ulipur Kurigram
Subal lata TA4 Jhikorgacha Jashore Jira bhog TA31 Vurangamari Kurigram
Hb. Aman II (Lacki)
TA5 BRRI Habiganj Malshira TA32 Vurangamari Kurigram
Depor dhan TA6 Nagarpur Tangail Khirshapal TA33 Ulipur Kurigram
Kalo parangi TA7 Nagarpur Tangail Dudh kolom TA34 Ulipur Kurigram
Swarna TA8 Nagarpur Tangail Narikel jhupi TA35 Ulipur Kurigram
Lalsaina TA9 Nagarpur Tangail Urichadra TA36 Ovainagar Jashore
Jotalaijum TA10 Nagarpur Tangail Ranga gasa TA37 Ovainagar Jashore
Dolni TA11 Ghatail Tangail Sada gosa TA38 Ovainagar Jashore
Barai dhan TA12 Ghatail Tangail Haringa digha TA39 Mirzapur Tangail
Chini sugar TA13 Ghatail Tangail Bagraj TA40 Kalihati Tangail
Kalijira TA14 Ghatail Tangail Begun bichi TA41 Sadar Tangail
Kiron mala TA15 Ghatail Tangail Chamara (Lal) TA42 Sadar Tangail
Apsaya TA16 Ghatail Tangail Kalijira TA43 Sadar Tangail
Chini kutei TA17 Ghatail Tangail Patjak TA44 Sadar Tangail
Biropa TA18 Sakhipur Tangail Nizersail TA45 Sadar Tangail
Gobra sail TA19 Sakhipur Tangail Dulai TA46 Sadar Tangail
Gonokrai TA20 Basail Tangail Haijam TA47 Sadar Tangail
Soma baila TA21 Basail Tangail Digha TA48 Sadar Tangail
Dulai boron TA22 Basail Tangail Aloi TA49 Sadar Tangail
Hari dhan TA23 Basail Tangail Vaeulu TA50 Nagarpur Tangail
Kartikjul TA24 Basail Tangail Heringa digha TA51 Nagarpur Tangail
Komkamane TA25 Sakhipur Tangail Hejal digha TA52 Nagarpur Tangail
Ganokairot TA26 Sakhipur Tangail Harharia TA53 Nagarpur Tangail
Bela digha TA27 Shibalaya Manikganj Sada vara TA54 Nagarpur Tangail
*New collection.
On the other hand, 26 germplasm
possessed intermediate (6-10), 27 possessed
many (>10) and one had few (<6) number of
effective tillers (Table 2). One germplasm was
found with very long (>30 cm), 11 with long
(26-30), 38 with medium (21-25) and four had
short (≤20) panicle length. Three germplasm
were found with short (<110 cm), 11 with
moderate (110-130) and 40 with long (>130)
plant height. Thirteen germplasm had short
(<120 days), seven had medium (120-130) and
34 had long (>130) days to maturity. Besides,
20 germplasm were found with short (<5.6
mm), 33 with medium (5.6-6.5) and one with
long (6.6-7.5) types of grain. Rice grain can also
be classified as extra-long, long, medium and
short (Bisne et al., 2006). Considering length-
breadth ratio, 12 germplasm were found with
bold (1.5-2.0), 34 with medium (2.1-2.5) and
four each with medium slender (2.6-3.0) and
slender (>3.0) grain. TGW of 14 germplasm
was found very low (<16 g), 10 with low (16-
19), 19 with medium (20-23), eight with high
(24-27) and three had very high (>27). Eleven
germplasm possessed low (<5 g), 26 had
moderate (5-10) and 17 had higher (>10) yields
per hill. Maji and Shaibu (2012) reported a
wider range (70-184 cm) of variation with a
mean value of 151.15 cm in plant height. Plant
height in rice is a complex character and is the

16 Ahmed et al
end product of several genetically controlled
factors called internodes (Sarawgi and Rastogi,
2000). Reduction in plant height may improve
their resistance to lodging and reduce
substantial yield losses associated with this
trait (Pachauri et al., 2017a). Pachauri et al.
(2017b) studied 124 rice germplasm accessions
on the basis of 19 morphological characters
and reported that a great variability with high
range (5-26) and mean of 8.20 was exhibited
for number of productive tillers per plant,
while high range (86-130 days) with mean of
111.33 days for days to maturity.
However, the shortest growth duration
(110 days) was observed in Kajal lata and the
longest (143) in Ranga and Sada gasa in the
present study. The shortest plant height (86.6
cm) was observed in Haijam and the longest
(168) in Gobra sail. Indursail possessed the
longest panicle (31.6 cm). Malshira was found
with the highest number of effective tillers (18)
and Harharia with the lowest (2). The highest
grain length-breadth ratio (3.48) was observed
in Subal lata and the lowest (1.89) in Vaeulu
and Depor dhan. Komkamane had the lowest
(8 g) and the Molla digha had the highest
(31.2) TGW. The highest yield per hill (24.26 g)
was observed in Indursail and the lowest (2.48)
in Biropa. Table 3 presents the top ranking
accessions for yield ancillary traits in T. Aman
2016. Abarshahr et al. (2011) also found
valuable and highly significant and positive
variability among their studied rice genotypes.
Besides, Sajid et al. (2015) also reported that
characterization of rice germplasm through
different morphological traits is an important
step for assessment of its genetic potential.
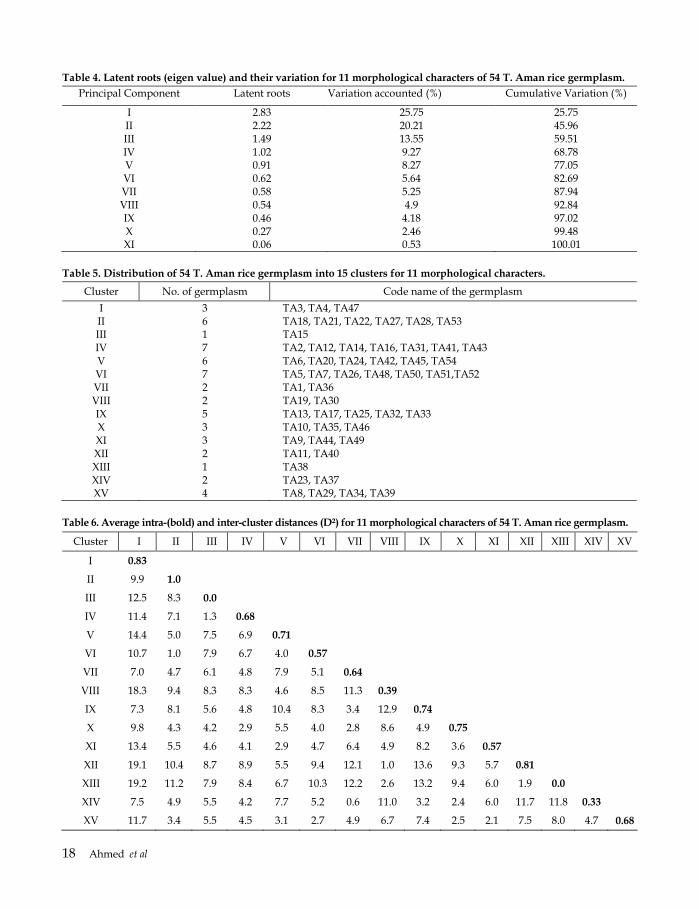
Principal component analysis. The first
four components in principal component
analysis with eigen values >1, contributed
68.78% of the total variation among the 54
germplasm for 11 morphological characters
(Table 4). Chakravorty et al. (2013) also
observed the contribution of 75.9% of the first
four components to the total variation in rice.
Cluster analysis. Based on D2 values, the
germplasm were grouped into 15 clusters
using Mahalonobis D2 statistic (Table 5).
Mahalingam et al. (2012) also observed 13
clusters in 31 Indian and exotics germplasm
lines. Maximum numbers of germplasm (7)
were grouped into the clusters IV and VII,
followed by 6 in clusters V and II, 5 in cluster
IX. However, clusters III and XIII contained
the lowest (1) number of germplasm. The
result revealed that all the germplasm
collected from Tangail or Kurigram district
were not clubbed into the same cluster. This
pattern of clustering indicated that there was
no association between the geographical
distribution of genotypes and genetic
divergence. The similar result was also
reported earlier by Chandra et al. (2007).
Considering this, Hasan et al. (2000) suggested
that parents should be selected on the basis of
genetic diversity rather than geographic
diversity.
Table 6 indicates the variations among the
intra and inter cluster distances. All the inter-
cluster distances were larger than the intra-
cluster distance indicating the homogeneous
nature of the germplasm within the cluster.
The highest intra-cluster distance was
recorded for cluster II (1.00), followed by
cluster I (0.83) and cluster XII (0.81) indicated
the high genetic diversity among the
germplasm belonging to the respective cluster.
The germplasm belonging to the highest intra-
cluster distance (cluster II) were the most
heterogeneous and might develop the highest
segregants by crossing between them. Again,
there were marked variations in intra-cluster
Morphological Characterization and Diversity of T. Aman Rice Germplasm 17
18 Ahmed et al
Table 4. Latent roots (eigen value) and their variation for 11 morphological characters of 54 T. Aman rice germplasm.
Principal Component Latent roots Variation accounted (%) Cumulative Variation (%)
I 2.83 25.75 25.75 II 2.22 20.21 45.96 III 1.49 13.55 59.51 IV 1.02 9.27 68.78 V 0.91 8.27 77.05 VI 0.62 5.64 82.69 VII 0.58 5.25 87.94 VIII 0.54 4.9 92.84 IX 0.46 4.18 97.02 X 0.27 2.46 99.48 XI 0.06 0.53 100.01
Table 5. Distribution of 54 T. Aman rice germplasm into 15 clusters for 11 morphological characters.
Cluster No. of germplasm Code name of the germplasm
I 3 TA3, TA4, TA47 II 6 TA18, TA21, TA22, TA27, TA28, TA53 III 1 TA15 IV 7 TA2, TA12, TA14, TA16, TA31, TA41, TA43 V 6 TA6, TA20, TA24, TA42, TA45, TA54 VI 7 TA5, TA7, TA26, TA48, TA50, TA51,TA52 VII 2 TA1, TA36 VIII 2 TA19, TA30 IX 5 TA13, TA17, TA25, TA32, TA33 X 3 TA10, TA35, TA46 XI 3 TA9, TA44, TA49 XII 2 TA11, TA40 XIII 1 TA38 XIV 2 TA23, TA37 XV 4 TA8, TA29, TA34, TA39
Table 6. Average intra-(bold) and inter-cluster distances (D²) for 11 morphological characters of 54 T. Aman rice germplasm.
Cluster I II III IV V VI VII VIII IX X XI XII XIII XIV XV
I 0.83
II 9.9 1.0
III 12.5 8.3 0.0
IV 11.4 7.1 1.3 0.68
V 14.4 5.0 7.5 6.9 0.71
VI 10.7 1.0 7.9 6.7 4.0 0.57
VII 7.0 4.7 6.1 4.8 7.9 5.1 0.64
VIII 18.3 9.4 8.3 8.3 4.6 8.5 11.3 0.39
IX 7.3 8.1 5.6 4.8 10.4 8.3 3.4 12.9 0.74
X 9.8 4.3 4.2 2.9 5.5 4.0 2.8 8.6 4.9 0.75
XI 13.4 5.5 4.6 4.1 2.9 4.7 6.4 4.9 8.2 3.6 0.57
XII 19.1 10.4 8.7 8.9 5.5 9.4 12.1 1.0 13.6 9.3 5.7 0.81
XIII 19.2 11.2 7.9 8.4 6.7 10.3 12.2 2.6 13.2 9.4 6.0 1.9 0.0
XIV 7.5 4.9 5.5 4.2 7.7 5.2 0.6 11.0 3.2 2.4 6.0 11.7 11.8 0.33
XV 11.7 3.4 5.5 4.5 3.1 2.7 4.9 6.7 7.4 2.5 2.1 7.5 8.0 4.7 0.68

Morphological Characterization and Diversity of T. Aman Rice Germplasm 19
distances indicating the presence of wider
diversity among the germplasm of different
clusters. However, the lowest intra-cluster
distance were observed in clusters III and XIII
as zero due to the presence of single genotype
in both the clusters (TA15 and TA38
respectively), followed by cluster XIV (0.33)
and cluster VIII (0.39) indicating the
comparatively more homogenous in nature of
the germplasm. The inter-cluster D2 values
ranged from 19.2 to 0.6 indicating wide range
of diversity. The highest inter-cluster distance
was observed between clusters I and XIII (19.2)
suggested wide diversity between these
clusters, followed by between clusters I and
XII (19.1), clusters I and VIII (18.3), clusters I
and V (14.4) and clusters IX and XII (13.6). The
lowest inter-cluster distance was observed
between clusters VII and XIV (0.60), followed
by clusters VI and X (2.55) and clusters II and
VI (1.0) indicating the close relationship
between the germplasm of these clusters and
hence, may not be emphasized upon to be
crossed each other in hybridization
programmes. Hossain (2008) also reported
intra- and inter-cluster distances ranged from
0.0 to 1.02 and 2.21 to 21.59, respectively on
aromatic and fine grain landraces of rice.
However, germplasm belonging to these
clusters may be further used in hybridization
programme for the improvement of rice.
Crosses involving parents belonging to the
most divergent clusters would be expected to
manifest maximum heterosis and wide
variability of genetic architecture (Souroush et
al., 2004).
Cluster means for the characters. Cluster
XIII showed the highest leaf length (82.2 cm)
and culm diameter (6.5 mm), cluster IX the
highest number of effective tillers per hill (13),
cluster II the lowest days to maturity (117),
cluster XV the highest grain length (6.1 mm)
and cluster I the highest grain LB ratio (2.97)
respectively, while cluster VIII showed the
highest yield per hill (22.0 g), panicle length
(28.8 cm) and 1000 grain weight (25.2 g) (Table
7). As a result, the germplasm under cluster
VIII may be selected for crossing with the
germplasm from clusters XIII, IX, II, XV and I
for developing high yielding T. Aman variety
along with long panicle, high effective tiller
numbers per hill, short growth duration and
long-slender type grain. Islam et. al. (2017) earlier
also reported the similar trend of conclusion
using Mahalanobis’ D2 statistic on rice.
Canonical variate analysis. In the present
study, it also appeared from the canonical
analysis that 52.51% of the total variation was
accounted for canonical root 1 and 19.88% by
canonical root 2 (Table 8).
Contribution of characters towards
divergence. Table 9 presents the coefficients
pertaining to the different characters in the
first two canonical roots. The canonical variate
analysis revealed that the grain LB ratio, culm
diameter, effective tillers per hill, panicle
length and days to maturity were positive for
both the vectors (I and II) and were the most
responsible for both the primary and
secondary differentiations and contributed
maximum to the genetic divergence. Such
results indicated that these characters will
offer a scope for selection of parents. Similarly,
Islam et al. (2017) also found positive
contribution of both canonical vectors for culm
diameter, days to flowering, days to maturity
and length-breadth ratio on Jhum rice
landraces collected from Rangamati district in
Bangladesh.
20 Ahmed et al
Table 7. Cluster means of 54 T. Aman rice germplasm for 11 morphological and yield contributing characters.
Cluster
Leaf
length
(cm)
Leaf
width
(mm)
Culm
diameter
(mm)
Effective
tillers
per hill
Panicle
length
(cm)
Plant
height
(cm)
Day to
maturity
Grain
length
(mm)
Grain
LB
ratio
1000
grain
weight (g)
Yield
per hill
(g)
I 46.8 11.7 4.2 10 23.7 88.1 119 5.9 2.97 17.3 6.4
II 47.1 13.8 5.3 8 23.7 132.7 117 5.7 2.17 22.3 6.37
III 33.0 11.0 5.1 11 24.4 154.4 139 4.1 2.10 9.5 6.3
IV 52.9 10.9 4.8 12 26.0 142.4 135 4.9 2.47 12.4 8.9
V 58.2 15.8 6.0 11 25.6 156.9 125 6.0 2.23 23.9 10.9
VI 55.9 14.9 5.2 10 21.9 135.6 121 5.6 2.14 21.3 6.33
VII 30.6 10.5 4.6 9 19.2 125.7 133 5.7 2.45 21.8 7.9
VIII 61.5 13.5 4.5 10 28.8 172.3 133 5.7 2.10 25.2 22.0
IX 44.5 11.2 5.0 13 23.6 122.6 135 4.6 2.36 11.1 8.4
X 62.3 12.7 6.2 11 23.7 130.7 133 5.8 2.40 20.7 13.0
XI 65.4 11.2 5.5 12 25.7 147.1 137 6.0 2.23 23.8 8.8
XII 49.5 11.7 5.3 11 25.3 182.9 133 5.5 2.25 16.0 6.4
XIII 82.2 11.0 6.5 8 27.2 167.8 143 5.3 2.10 22.7 12.7
XIV 47.0 12.4 4.5 10 23.0 120.7 142 5.9 2.20 25.1 15.6
XV 51.1 12.8 5.2 11 24.2 144.8 133 6.1 2.40 23.7 4.7
Table 8. Values of latent roots (canonical roots) and percentage of variation of 11 morphological characters of 54 T.
Aman rice germplasm.
Canonical root Value of the canonical root Percentage of variation absorbed by
the canonical root
1 24.54 52.51
2 9.29 19.88
3 6.35 13.59
4 3.73 7.98
5 1.22 2.60
6 0.69 1.47
7 0.37 0.79
8 0.23 0.50
9 0.17 0.35
10 0.11 0.23
11 0.04 0.09
Total 100.0

Morphological Characterization and Diversity of T. Aman Rice Germplasm 21
Table 9. Latent vectors for 11 morphological characters of 54 T. Aman rice germplasm.
Character Vector I Vector II Combined ranking*
Leaf length (cm) -0.0851 -0.0104 8
Leaf width (mm) 0.0851 -0.2458 9
Culm diameter (mm) 0.2782 0.4546 2
Effective tillers per hill 0.183 0.0856 3
Panicle length (cm) 0.0884 0.1272 4
Plant height (cm) -0.1961 0.0167 10
Days to maturity 0.0138 0.1515 5
Grain length (mm) -1.2476 -2.1051 11
Grain LB ratio 1.8633 2.9192 1
1000 grain weight (g) 0.0413 -0.0153 7
Yield per hill (g) -0.0121 0.0787 6
*Combined ranking is estimated by summing the values of vector I and II, then higher (1) is the rank with higher positive value.
CONCLUSIONS
Since the modern variety with the narrow genetic base are vulnerable to diseases and adverse climatic changes, the genetically diverse genotypes for variety development become more important. Moreover, characterization of landraces could help to utilize appropriate characters in rice improvement programme. Indursail (TA30), Kartikjul (TA24), Kajal lata (TA3) and Subal lata (TA4) are the elite germplasm promising for one or more characters. Finally, the germplasm under clusters VIII may be selected for crossing with the germplasm from clusters XIII, IX, II, XV and I for developing high yielding variety along with long panicle, high effective tiller numbers per hill, short growth duration and long-slender type grain. REFERENCES Abarshahr, M, B Rabiei and H S Lahigi. 2011. Assessing
genetic diversity of rice varieties under drought stress conditions. Notulae Scientia Biologicae 3(1): 114-123.
Bisne, R, N K Motiramani and A K Sarawgi. 2006. Association analysis and variability analysis in rice. Mysore J. Agric. Sci. 40 (3): 375-380.
Chakravorty, A, P D Ghosh and P K Sahu. 2013. Multivariate analysis of phenotypic diversity of
landraces of rice of West Bengal. American J. Exp. Agric. 3(1): 110-23.
Chandra, R, S K Pradhan, S Singh, L K Bose and O N Singh. 2007. Maltivariate analysis in upland rice genotypes. World Journal of Agricultural Sciences 3(3): 295-300.
Das, S and A Ghosh. 2011. Characterization of rice germplasm of West Bengal. Oryza 47 (3): 201-205.
Goodman, M M. 1972. Distance analysis in biology. Syst Zool 21: 174-186.
Hasan, M J, M G Rasul, M A K Mian, M Hasanuzzaman and M M H Chowdhury. 2000. Genetic divergence of yam. Bangladesh Journal of Plant Breeding and Genetics 13(1): 07-11.
Hossain, M Z. 2008. Genetic diversity study in fine grain and aromatic landraces of rice (Oryza sativa L.) by morpho-physico-chemical characters and micro-satellite DNA markers. PhD thesis, Department of Genetics and Plant Breeding, BSMRU, Gazipur, Bangladesh.
Iqbal, J, Z K Shinwari and M A Rabbani. 2014. Investigation of total seed storage proteins of Pakistani and Japanese maize (Zea mays L.) through SDS-PAGE markers. Pak. J. Bot. 46: 817-822.
Islam, M Z, M Khalequzzaman, M A Siddique, N Akter, M S Ahmed and M A Z Chowdhury. 2017. Phenotypic characterization of Jhum rice (Oryza sativa L.) landraces collected from Rangamati district in Bangladesh. Bangladesh Rice J. 21 (1): 47-57.
Kumbhar, S D, P L Kulwal, J V Patil, C D Sarawate, A P Gaikwad and A S Jadhav. 2015. Genetic diversity and population structure in landraces and improved rice varieties from India. Rice Sci. 22: 99-107.
Lahkar, L and B Tanti. 2017. Study of morphological diversity of traditional aromatic rice landraces (Oryza sativa L.) collected from Assam, India. Annals of Plant Sciences 6 (12): 1855-1861.

22 Ahmed et al
Lin, M S. 1991. Genetic base of japonica rice varieties released in Taiwan. Euphytica 56: 43-46.
Mahalanobis, P C. 1936. On the generalized distance in statistics. Proc. Nat. Inst. Sci. India. 2: 49-55.
Mahalingam, A, R Saraswathi, J Ramalingam and T Jayaraj. 2012. Genetic studies on divergence and phenotypic characterization of indigenous and exotic indica germplasm lines in rice (Oryza sativa L.). African J. Agric. Res. 7 (20): 3120-28.
Maji, A T and A A Shaibu. 2012. Application of principal component analysis for rice germplasm characterization and evaluation. Journal of Plant Breeding and Crop Science 4 (6):87-93.
Pachauri, A K, A K Sarawgi, S Bhandarkar and G C Ojha. 2017a. Genetic variability and association study for yield contributing traits of promising core Rice germplasm accessions (Oryza sativa L.). Res. on Crops 18(1): 133-138.
Pachauri, A K, A K Sarawgi, S Bhandarkar and G C Ojha. 2017b. Agro-morphological characterization and morphological based genetic diversity analysis of Rice (Oryza sativa L.) germplasm. Journal of Pharmacognosy and Phytochemistry 6(6): 75-80.
Pervaiz, Z H, M A Rabbani, I Khaliq, S R Pearce and S A Malik. 2010. Genetic diversity associated with agronomic traits using microsatellite markers in Pakistani rice landraces. Electronic Journal of Biotechnology 13(3): 4-5.
Rao, C R. 1952. Advanced Statistical Methods in Biometric Research. John. Willey and Sons. New York.
Sajid, M, S A Khan, H Khurshid, J Iqbal, A Muhammad, N Saleem and S M A Shah. 2015. Characterization of Rice (Oryza sativa L.) germplasm through various Agro-morphological traits. Scientia Agriculturae 9(2): 83-88.
Sarawgi, A K and N K Rastogi. 2000. Genetic diversity in traditional aromatic rice accessions from Madhya Pradesh. Indian J. Plant Genet. Resour 13: 138-146.
Souroush, H R, M Mesbah, A Hossainzadeh and R Bozorgipour. 2004. Genetic and phenotypic variability and cluster analysis for quantitative and qualitative traits of rice. Seed and Plant Karaj 20: 167-182
Upadhyaya, H D, C L L Gowda and D V S S R Sastry. 2008. Plant genetic resources management: collection, characterization, conservation and utilization. Journal of SAT Agricultural Research 6: 1-16.
Xiyong, C, X Haixia, D Zhongdong, C Feng, Z Kehui and C Dangqun. 2012. Genetic evolution and utilization of wheat germplasm resources in Huanghuai winter wheat region of China. Pak. J. Bot. 44: 281-288.
Zhang, L N, G L Cao and L Z Han. 2013. Genetic diversity of rice landraces from lowland and upland accessions of China. Rice Sci. 20: 259-266.
Bangladesh Rice J. 22 (2) : 23-30, 2018, doi.org/10.3329/brj.v22i2.44039
1Director (Administration and Common Service), 2Principal Scientific Officer, 3Senior Scientific Officer, Farm Management Division, 4Former Director (Administration and Common Service), BRRI. *Corresponding author's E-mail: [email protected]
Moisture Stress and Different Rates of Nutrients on Growth and Yield of Rice
K P Halder1, M S Islam2, M R Manir3 and M A Ali4
ABSTRACT
The experiment was conducted at the Bangladesh Rice Research Institute (BRRI) Gazipur farm during Boro 2003-04 seasons to observe the moisture stress effects in relation to nutrient rates on growth and yield of rice. The treatments were three moisture stresses (NS= Always saturated condition i.e. 1-2 cm standing water; VPS= Withholding water at the vegetative phase i.e. 15 days after transplanting (DAT) to maximum tillering stage; RPS=Withholding water at the reproductive phase i.e. PI to flowering stage) and three fertilizer doses (F0= No fertilizer; HD= Half of the optimum dose and OD= Optimum dose i.e. 120-60-40-10-2 kg ha-1 of N, P2O5, K2O, S and Zn respectively). The treatments were applied in high yielding variety BRRI dhan29. The result showed that irrespective of nutrient rates, drought stress decreased plant height, tiller number and shoot dry weight. Unstressed plants (NS) produced the highest grain yield (3.14 to 6.51 tha-1) followed by vegetative phase stressed (VPS) plants (2.73 to 4.50 tha-1). The reproductive phase stressed (RPS) plants produced the lowest grain yield (2.54 to 4.20 t ha-1). Regardless of water stress, application of optimum dose (OD) of nutrients produced the highest grain yield followed by half dose (HD) of nutrients. No fertilizer treatment (F0) produced the lowest grain yield. Due to water stress, the highest grain yield reduction occurred in OD (22-32%) followed by HD (12-19%) and the lowest in F0 (4-15%). Key words: Rice (Oryza sativa L.), moisture stress, nutrients rates, plant growth, yield and yield components
INTRODUCTION
Rice is the most important food crop for more
than half of the world population, especially in
developing countries such as Asia, where water
scarcity and drought are imminent threats to
food security. Rice supplies more than 50% of
calorie and 75% of protein consumed by the
people of the developing countries (Khush,
2005). Its flexibility and adaptation to natural
conditions, rice is planted in about 113 countries
of the world (Rice is life, 2005). Drought is the
most important limiting factor for crop
production and it has been increasing day by
day and becoming a severe problem in many
regions of the world. Most of the crops are
sensitive to drought stress particularly during
flowering to grain filling stage (Sabetfar et al.,
2013). Rice uses two to five times more water
than other cereal food crops such as wheat or
maize and uses about 30% of the freshwater used
for agricultural crops worldwide. Water stress is
the most important limiting factor for growing
rice. About 1,100 to 1,200 litres of water is
required to produce 1.0 kg rough rice (Rice is life,
2005). Sometimes it may increase up to 4,000
litres. Exploring the ways to reduce water use for
rice production is therefore of great strategic
value for sustainable crop production for the
world facing water scarcity (Molden et al., 2010).
The plants anatomy, morphology, physiology
and biochemistry as well as their growth and
development also affected by drought stress
(Heidary et al., 2007). Under a water stress
situation, root growth is less inhibited than shoot
growth and the dry matter partitioning between
24 Halder et al
root and shoot was altered depending on
moisture availability (Blum et al., 1983; Penning
de Vries et al., 1989).
Keller (2005) reported that water and nutrients exist together in close association because plant available nutrient ions are dissolved in the soil solution and nutrient uptake by plant roots depends on water flow through the soil-root-shoot pathway. Leaf transpiration generates the tension necessary for the roots to absorb this essential solution, but in a dry soil, uptake of water and nutrients becomes progressively more difficult for any crop. Viets (1972) observed that nutrient and water absorption are independent processes in root, the necessity for available water in both the plant and soil for growth and nutrient transport makes them closely related. This close relationship makes it complex to clearly define the effects of water stress on mineral nutrition. Slatyer (1969) stated that the effect of water stress on mineral nutrition is difficult to resolve clearly. The key point is whether or not reduced nutrient uptake retards growth and development in a plant under stress. It results in an increase of solute concentration outside the roots compared to the internal environment of the root and causes reverse osmosis. As a result, the cell membrane shrinks from the cell wall and may eventually lead to death of the cell. Moisture stress inhibits photosynthesis in plants by closing stomata and damaging the chlorophyll contents and photosynthetic apparatus (Waraich et al., 2011).
Drought stress at vegetative phase of rice had minor effect on subsequent growth and grain yield. The reduction of grain yield was upto 30% due to decrease in panicle number in one trial and reduced spikelet number in another trial (Boonjung and Fukai,1996). They also reported that water stress at panicle development stage decreased grain yield due to delayed anthesis and the number of spikelets per panicle reduced upto 60% compared to control and the percentage of
filled grains decreased upto to zero. The decrease in grain yield is associated with low dry matter production during the drought period as well as during the recovery period following the drought (Halder and Burrage, 2003). Drought stress at an early seedling stage may cause wilting, rolling, and drying of leaves (Murty and Ramakrishnayya, 1982). Water stress at the tillering stage reduces plant height, tiller number and leaf area. It induces leaf rolling, drying and premature leaf death and prolongs the vegetative stage (IRRI, 1976; Lee et al., 1994). The effects may occur even after stress has been eliminated (Jana and Ghildyal, 1972; O’ Toole and Cruz, 1979). Cruz et al., (1986) found that mild water stress during vegetative growth decreased tiller and panicle number, leaf area, shoot and total dry matter mass. Castillo et al. (1987); BRRI (1991) reported that when water stress occurs during the vegetative phase, total dry matter production is decreased at harvest due to slow growth and the production of a smaller number of tillers.
Drought stress during the reproductive
growth affects essentially all aspects of rice growth and development (Sharma et al., 1987;
Okada, et al., 2002; Tuong et al., 2002). Depending on the severity and duration, early water deficit induces leaf rolling, drying,
reduced photosynthetic activity, leaf water potential, plant height, leaf area, leaf number,
dry matter yield, spikelet fertility, grain yield and delayed the onset of the reproductive
growth period as well as delayed flowering and maturity (Yang et al., 1994; Tuong et al., 2002). When drought occurred during grain
filling, the percentage of filled grains decreased to 40% and individual grain mass
decreased by 20% (Boonjung and Fukai, 1996). Water stress in rice plant decreases the rate of photosynthesis that affects the number of tiller,
leaf area, dry matter accumulation, filled grain per panicle, 1000 grain weight and grain yield
(Halder and Burrage 2004; Zumber et al., 2007; Sabetfar et. al., 2013).
Moisture Stress and Different Rates of Nutrients on Growth and Yield of Rice 25
Information regarding the effect of moisture stress and different rates of nutrients on the growth, yield and yield components of rice is scanty. Therefore, this experiment was undertaken to investigate the effect of moisture stress and different doses of nutrients on the growth, yield and yield components of rice.
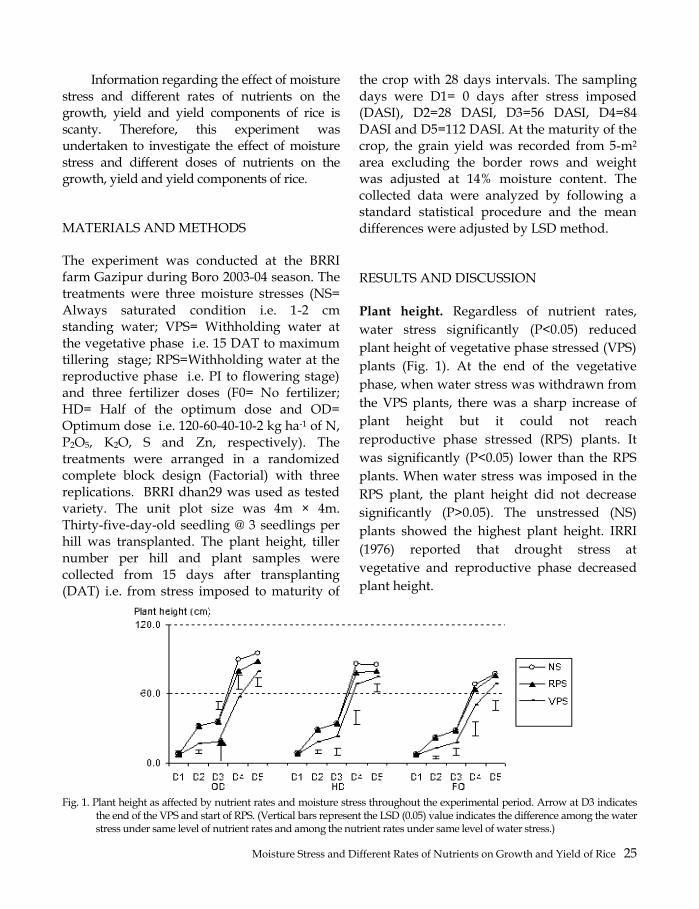
MATERIALS AND METHODS
The experiment was conducted at the BRRI farm Gazipur during Boro 2003-04 season. The treatments were three moisture stresses (NS= Always saturated condition i.e. 1-2 cm standing water; VPS= Withholding water at the vegetative phase i.e. 15 DAT to maximum tillering stage; RPS=Withholding water at the reproductive phase i.e. PI to flowering stage) and three fertilizer doses (F0= No fertilizer; HD= Half of the optimum dose and OD= Optimum dose i.e. 120-60-40-10-2 kg ha-1 of N, P2O5, K2O, S and Zn, respectively). The treatments were arranged in a randomized complete block design (Factorial) with three replications. BRRI dhan29 was used as tested variety. The unit plot size was 4m × 4m. Thirty-five-day-old seedling @ 3 seedlings per hill was transplanted. The plant height, tiller number per hill and plant samples were collected from 15 days after transplanting (DAT) i.e. from stress imposed to maturity of
the crop with 28 days intervals. The sampling days were D1= 0 days after stress imposed (DASI), D2=28 DASI, D3=56 DASI, D4=84 DASI and D5=112 DASI. At the maturity of the crop, the grain yield was recorded from 5-m2 area excluding the border rows and weight was adjusted at 14% moisture content. The collected data were analyzed by following a standard statistical procedure and the mean differences were adjusted by LSD method. RESULTS AND DISCUSSION Plant height. Regardless of nutrient rates,
water stress significantly (P<0.05) reduced
plant height of vegetative phase stressed (VPS)
plants (Fig. 1). At the end of the vegetative
phase, when water stress was withdrawn from
the VPS plants, there was a sharp increase of
plant height but it could not reach
reproductive phase stressed (RPS) plants. It
was significantly (P<0.05) lower than the RPS
plants. When water stress was imposed in the
RPS plant, the plant height did not decrease
significantly (P>0.05). The unstressed (NS)
plants showed the highest plant height. IRRI
(1976) reported that drought stress at
vegetative and reproductive phase decreased
plant height.
Fig. 1. Plant height as affected by nutrient rates and moisture stress throughout the experimental period. Arrow at D3 indicates
the end of the VPS and start of RPS. (Vertical bars represent the LSD (0.05) value indicates the difference among the water stress under same level of nutrient rates and among the nutrient rates under same level of water stress.)

26 Halder et al
Tiller number. Regardless of nutrient rates, water stress significantly (P<0.05) reduced tiller number of vegetative phase stressed (VPS) plants (Fig. 2). Yoshida (1981) stated that in the vegetative phase, rice plants produced tillers from the leaf axils at each un-elongated node. Due to some environmental limitations such as water and nutrient supply, light etc. tiller production may be inhibited and all the tiller buds do not develop into tillers. At the end of the vegetative phase, there was a sharp increase of tiller number of VPS, plants however, it was significantly (P<0.05) lower than the RPS plants of OD. In HD and F0 it was not significantly lower (P>0.05) than OD. Yoshida (1981); Smith and Hamel (1991) observed that the tillering of rice depends on the nutritional status of the plant and tillering is highly impaired by a lack of N or P. The experiment here confirmed these findings; a larger number of tillers being produced by the plants grown in the higher nutrient i.e. OD. When water stress was imposed in the RPS plants, the tiller number did not decrease significantly (P>0.05). The unstressed (NS) plants had the highest tiller number. The tiller produced after vegetative phase was unproductive.
Shoot dry weight. Water stress significantly decreased the shoot dry weight under both vegetative phase and reproductive phases (Fig. 3). Dry weight increased after removal of water stress from vegetative phase stressed (VPS). However, it was lower than unstressed (NS) plants. Researchers reported that dry matter production decreased in water stressed plant also due to a reduction of cell turgidity, which affects cell expansion (Mengel and Kirkby, 1987; Hsiao, 1973) or alternatively might be due to both chemical and hydraulic signaling of the effects of soil drying (Davies et al., 2000).
Table 1 shows that the interaction effect of drought stress and nutrient rates was significant (P>0.05) in yield and yield components except 1000-grains weight.
Panicle number. Irrespective of moisture stress, the highest number of panicles was observed in OD followed by HD but there was no significant difference between HD and OD. The lowest number of panicles was found in F0. Regardless of nutrient rates the NS plants produced the highest number of panicles. The lowest number of panicles was found in RPS plant under F0 and in VPS plants under HD and OD but there was no significant difference between VPS and RPS. Hsiao (1982) stated that water stress enhance the poor flowering and incomplete panicle exertion.
Fig. 2. Tiller number as affected by nutrient rates and
drought stress throughout the experimental period. Arrow at D3 indicates the end of the VPS and start of RPS. (Vertical bars represent the LSD (0.05) value indicates the difference among the water stress under same level of nutrient rates and among the nutrient rates under same level of water stress.)
Fig. 3. Shoot dry weight as affected by nutrient rates and
drought stress throughout the experimental period. Arrow at D3 indicates the end of the VPS and start of RPS. (Vertical bars represent the LSD (0.05) value indicates the difference among the water stress under same level of nutrient rates and among the nutrient rates under same level of water stress.)
0.0
7.0
14.0
D1 D2 D3 D4 D5 D1 D2 D3 D4 D5 D1 D2 D3 D4 D5
NS
RPS
VPS
OD HD FO
Tiller no. (hill-1)
0.0
25.0
50.0
D1 D2 D3 D4 D5 D1 D2 D3 D4 D5 D1 D2 D3 D4 D5
NS
RPS
VPS
Shoot DW(g plant-1)
HD FOOD

Moisture Stress and Different Rates of Nutrients on Growth and Yield of Rice 27
Grains number and sterility percentage. Regardless of nutrient rates, RPS plants significantly (P<0.05) produced the lowest number of grains panicle-1 followed by VPS plants. The NS plants produced the highest number of grains panicle-1. There was no significant difference between NS and VPS plants except OD. The RPS plants were in stressed condition in reproductive phase. As a result it produced the lowest number of grain panicle-1. This result also supported the findings of Anonymous (1990), BRRI (1991), they reported that water stress decreased filled spikelet number, increased empty spikelet number and decreased grain yield.
Despite moisture stress, the highest number of grains panicle-1 was observed in OD followed by HD. The lowest number of grains panicle-1 was observed in F0. However, in RPS plants, there was no significant difference
between OD and HD indicated that OD plants could not produced significantly more grain under moisture stress perhaps concentration of nutrients in the root zone increased so sharply that affected the distribution of nutrients as well as photosynthates from source to sink. As a result grains panicle-1 were not increased even after application of optimum doses (OD) of nutrients reflected in the higher percentage of sterility in OD of RPS plants.
Thousand grains weight. The 1000 grains
weight (TGW) was not significantly (P>0.05)
affected by drought stress, nutrient rates and
their interaction, as it is a varietal character
normally may not be affected by cultural
practices (Yoshida, 1981). Moreover, water
stress was not applied during grain filling
period, hence 1000 grain weight was not
affected. Table 1. Yield and yield components of rice as affected by the interaction effect of drought stress and nutrient rates.
Panicle no. (m-2) Grains panicle-1
Treatment NS VPS RPS NS VPS RPS
F0 197 bA 189 bAB 183 bB
83 cA 79 cA 65 bB
HD 292 aA 223 aB 236 aB
90 bA 92 bA 78 aB
OD 301 aA 234 aB 241 aB
106 aA 99 aB 81 aC
LSD at 5% 12.4 4.3
% sterility 1000-grain weight (g)
Treatment NS VPS RPS NS VPS RPS
F0 18 aC 23 aA 24 bA 22.19 22.02 21.76
HD 16 abC 21 abB 26 abA 22.38 22.23 22.34
OD 14 bC 19 bB 29 aA 22.26 22.13 21.85
LSD at 5% 3.1 ns
Grain yield (t ha-1) Straw yield (t ha-1)
Treatment NS VPS RPS NS VPS RPS
FO 3.14 cA 2.73 bA 2.54 bA 5.30 bA 4.92 aA 5.14 bA
HD 5.62 bA 4.61 aB 4.30 aB 6.71 aA 5.20 aA 5.32 bA
OD 6.51 aA 4.50 aB 4.20 aB 7.23 aA 5.10 aC 6.70 aB
LSD at 5% 0.60 0.93
In a column, numbers followed by different small letters (a, b, c) differ significantly at the 5% level by LSD test. In a row, numbers followed by different capital letters (A, B, C) differ significantly at the 5% level by LSD test.

28 Halder et al
Grain yield. Grain yield is a function of many factors like panicles m-2, grains panicle-1 and (TGW) was also significantly (P<0.05) affected by the interaction effect of drought stress and nutrient rates. Regardless of nutrient rates, unstressed plants (NS) produced the highest grain yield (3.14 to 6.51 t ha-1) followed by VPS (2.73 to 4.50 tha-1) plants. The RPS plants produced the lowest grain yield (2.54 to 4.20 t ha-1). This result supported the findings of Boonjung and Fukai (1996); Mostajeran and Rahimi-Eichi, (2009). They found that drought stress at vegetative phase of rice had a minor effect on subsequent growth and grain yield. But they observed that water stress at panicle development stage decrease grain yield due to delayed anthesis and the number of spikelets per panicle reduced upto 60% compared to control and the percentage of filled grains.
There was no significant difference among NS, VPS and RPS plants under F0. In HD and OD, there was no significant difference between VPS and RPS plant. Irrespective of water stress, OD produced the highest grain yield (4.20 to 6.51 t ha-1) followed by HD (4.30 to 5.62 t ha-1) and F0 (2.54 to 3.14 t ha-1). There was no significant difference between HD and OD under VPS and RPS plants. Though OD produced the highest grain yield but due to water stress the highest grain yield reduction was observed in OD (22 –32%) followed by HD (12-19%) and the lowest in FO (4-15%) (Fig. 4).
Due to water stress the grain yield decreased more in plants grown in higher dose nutrient i.e. OD than HD and F0. This result confirms the findings of Power, 1990; Christianson and Vlek, 1991). They reported that with adequate amounts of soil moisture (humid=350 mm mid-season rainfall), grain yield of cereal response to nutrients is significant, but during severe drought (dry=100 mm mid-season rainfall) mineral application actually reduced yields. This result also supported the findings of Halder and Burrage (2007).
Straw yield. Irrespective of nutrient rates, unstressed plants (NS) produced the highest straw yield (5.30 to 7.23 t ha-1) followed by RPS (5.14 to 6.70 t ha-1) plants. The VPS plants produced the lowest straw yield (4.92 to 5.20 t ha-1). There was no significant difference among NS, VPS and RPS except OD. Irrespective of water stress, the OD gave the highest straw yield (5.21 to 7.23 t ha-1) followed by HD (5.20 to 6.71 t ha-1) and F0 (4.92 to 5.30 t ha-1) but there was no significant (P>0.05) difference between F0 and HD of RPS plants, between HD and OD treatments of NS plants and among F0, HD, OD of VPS plants. In this experiment water stress decreased tiller number and plant height hence decreased straw yield. This is an agreement with the findings of Hossain et al. 2002.
Fig. 4. Percent grain yield reduction in VPS and RPS
plants over unstressed (NS) plants. CONCLUSION
Water stress decreased growth of the plant due
to reduction of plant height and tiller number.
When a higher dose of fertilizer was applied in
stressed plant, there was a greater percentage
of reduction of grain yield than the lower dose
of fertilizer applied stressed plant. Therefore, if
fertilizer is applied, proper water supply must
be ensured, otherwise yield will be reduced
drastically.

Moisture Stress and Different Rates of Nutrients on Growth and Yield of Rice 29
REFERENCES Anomymous. 1990. Effect of different levels of light and
drought stress on individual spikelet filling in rice. PhD thesis. UPLB, College, Laguna, Philippines.
Blum, A, J Mayer, and G Gozlan. 1983. Associations between plant production and some physiological components of drought resistance in wheat. Plant, Cell and Environment. 6: 219-225.
Boonjung, H and S Fukai. 1996. Effects of soil water deficit at different growth stages on rice growth and yield under upland conditions. 2. Phenology, biomass production and yield. Field Crops Research 48 (1):47-55.
BRRI. 1991. Annual report for 1988. Gazipur, Bangladesh. pp. 1-104.
Castilo, E, J Siopongco, R J, Buresh, K T Ingram and S K De Datta. 1987. Effect of nitrogen timing and water deficit on nitrogen dynamics and growth of lowland rice. IRRI Saturday, 7 November 1987. Los Banos, Laguna, Phillippines.
Christianson, C B and, P L G Vlek. 1991. Alleviating soil fertility constraints to food production in West Africa: Efficiency of nitrogen fertilizers applied to food crops. Fertiliser Research. 29:21-33.
Cruz, R. T, J C O’Toole, M Dingkuhn, E M Yambao and M Thangaraj. 1986. Shoot and root response to water dficits in rainfed low land rice. Aust. J. Plant Physiol. 13: 567-575.
Davies, W J, M A, D S Thompson, W Sobeih, L G Rodriguez. 2000. Regulation of leaf and fruit growth in plants growing in drying soil: exploitation of the plants' chemical signalling system and hydraulic architecture to increase the efficiency of water use in agriculture. J of Experimental Botany. 51: 1617-1626.
Halder, K P and S W Burrage. 2003. Drought stress effects on water relations of rice grown in nutrient film technique. Pakistan Journal of Biological Sciences. 6 (5): 441-444.
Halder, K P and S W Burrage. 2004. Effect of drought stress on photosynthesis and leaf gas exchange of rice grown in nutrient film technique. Pakistan Journal of Biological Sciences. 7 (4): 563-565.
Halder, K P and S W Burrage. 2007. Water stress and nutrient solution electrical conductivity (EC) on rice plant III. Yield and yield component. Bangladesh Rice Journal. 12 (1&2):31-35.
Rikan, H, M Heidary and R Jameiy. 2007. Study on tolerance to salinity and drought of 4 barley cultivar in germination phase. Research and Reconstruction Magazine, 4 (74): 34-142.
Hossain, S T, M S U Bhuiya, M A Islam, M A Kashem and M A Mannan. 2002. Effect of water stress on the performance of yield of fine rice. Bangladesh Journal of Environmental Sciences. 6: 251-257.
Hsiao, T C. 1973. Plant responses to water stress. Annual Review, Plant Physiology. 24: 519-570.
Hsiao, T C. 1982. The soil plant atmosphere continuum in relation to drought resistance in crop with emphasis on rice. International Rice Research Institute, Los Banos, Laguna, Philippines.
IRRI (International Rice Research Institute). 1976. Soil water relations in rice. Annual report for 1975. IRRI research Papers Series, 14. IRRI, Los Banos, Laguna, Philippines. pp 152-154.
Jana, R K and B P Ghildyal. 1972. Effect of varying soil water regimes during the different growth phases on the yield of winter rice. Riso. 21: (1) 93-95.
Keller, M. 2005. Deficit irrigation and vine mineral nutrition. American Journal Enol Vitic. 56: 267-283.
Khush, G. 2005. What it will take to feed 5.0 billion rice consumers in 2030, Plant Molecular Biology, 59, 1-6.
Lee, Jiann Feng, Chen Shih Shiung, J F Lee and S S Chen. 1994. Effects of irrigation level on growth of rice during the vegetative growth stage: grain yields and yield components. Bulletin of Taichung District Agricultural Improvement Station. No. 42, 29-40.
Mengel, K and E A Kirkby. 1987. Principles of plant nutrition. International Potash Institute, Worblanfen Bern, Switzerland. 687p.
Molden, D, T Oweis, P Steduto, P Bindraban, M A Hanjra, J Kijne. 2010. Improving agricultural water productivity: Between optimism and caution. Agricultural Water Management, 97: 528– 535.
Mostajeran, A and V Rahimi-Eichi. 2009. Effects of drought stress on growth and yield of rice (Oryza sativa L.) cultivars and accumulation of proline and soluble sugars in sheath and blades of their different ages leaves. American Eurasian J. Agric. & Environ. Sci., 5 (2): 264-272.
Murty, K S and G Ramakrishnaya. 1982. Shoot characteristics of rice for drought resistance. In: Drought resistance in crops with emphasis on rice. International Rice Research Institute. Los Banos. Laguna. Philippines. pp 145-152.
Toole, O J C and R T Cruz. 1979. Leaf rooling and transpiration. In: proc. Crop Sci. Soc. Jap. (Special issue), Plant Sci. Lett. Tokyo, Japan. 16: 111-114.
Okada, K, M Kondo, H, Ando and K Kakuda. 2002. Water uptake under water stress at panicle imitation stage in upland rice as affected by previous soil water regimes. Soil Sci Plant Nutr. 48: 151-158.
Penning de Vries, F WT, D M Jansen, H F M Ten Berge and A Bakema. 1989. Simulation of ecophysiological process of growth in several annual crops. Intl. Rice Res. Instt., Philippines, Los Banos/ Pudoc, Wageningen, Philippines., 28-30, April 1987. Univ. Philipp. Los Banos, College, Laguna Philippines. 271p.
Power. 1990. Fertility management and nutrient cycling. In: Singh R.P. et al. (eds.) Advances in Soil Sciences. Dryland agriculture strategies for sustainability. New York. 13:131-147.
Rice is Life. International Year of Rice. 2004 and its Implementation 2005. FAO, Rome; ISBN 92-5-105364-2.

30 Halder et al
Sabetfar, S, M Ashouri, E Amiri and S Babazadeh. 2013. Effect of drought stress at different growth stages on yield and yield component of rice. Plant Persian Gulf Crop Protection, 2 (2): 14-18
Sharma, P K, S K De Datta and C A Redulla. 1987. Root growth and yield response of rainfed lowland rice to planting method. Expl. Agric. 23: 305-313.
Slatyer, R O. 1969. Physiological significance of internal water relations in crop yield. In: J. D. Eastin, J. D. (eds) Physiological Aspects of Crop Yield Amer. Soc. Agron., Madison , Wisconsin. pp 53-79
Smith, D L and C Hamel. 1999. Crop yield physiology and processes. Springer, Berlin. pp. 504.
Tuong, T P, E G Castillo, R C Cabangon, A Boling and U Singh. 2002. The drought response of lowland rice to crop establishment practices and N-fertilizer sources. Field Crops Res. 74, 243–257.
Viets, F G, Jr. 1972. Water deficits and nutrient availability. In: Kozlowski, T T (ed.) Water deficits and plant growth. Academic Press, New York. pp. 217-236.
Waraich, E A, R Ahmad, Saifullah, M Y Ashraf and Eh Saifullah. 2011. Role of mineral nutrition in alleviation of drought stress in plants. Australian Journal of Crop Science, 5 : 764-777.
Yang, C M, H W Min, C W Yang and W M Hsiang. 1994. Growth and yield of rice as affected by soil water deficits. Chinese Journal of Agrometeorology. 1: (4) 143-150.
Yoshida, S. 1981. Fundamentals of rice crop science. International Rice Research Institute, Los Banos, Laguna, and Philippines. 267p.
Zumber, M A, A K M M B Chowdhury, M Z Islam, T Ahmad and M A Hasan. 2007. Effects of water stress on growth and yield attribute Aman rice genotype. International Journal of Sustainable Plant Production, 2(6): 25-30.

Bangladesh Rice J. 22 (2) : 31-39, 2018, doi.org/10.3329/brj.v22i2.44040
1Hybrid Rice Division, Bangladesh Rice Research Institute, Gazipur 1701, 2Assistant Seed Technologist, Seed Processing and Preservation Center, Supreme Seed Company Limited, Trishal, Mymensingh, Bangladesh, 3Senior Scientific Officer, BJRI, Regional Station, Rangpur. *Corresponding author’s E-mail: [email protected]
Assessment of Variability for Floral Characteristics and Out-Crossing Rate in CMS Lines
of Hybrid Rice
M J Hasan1*, M U Kulsum1, A K Paul1, P L Biswas1, M H Rahman1, A Ansari1, A Akter1, L F Lipi1, S J Mohiuddin2 and M Zahid-Al-Rafiq3
ABSTRACT
The present investigation was aimed to clarify the interrelationship among various floral traits and out crossing rates. High mean value, range of variability and genotypic variance were observed for all the traits except anther length and breadth, stigma length and breadth. Close differences between genotypic and phenotypic variances and genotypic and phenotypic coefficient of variations were observed for all the traits. Considering all genetic parameters, selection based on panicle exertion rate, angle of florate opening, duration of florate opening, anther length, stigma exertion rate and out crossing rate seemed to be effective for the improvement of CMS lines. Out crossing rate had significant positive correlation with panicle exertion rate, angle of florate opening, duration of florate opening, filament length, stigma length, breadth and exertion rate exhibited interesting results, indicating selection with these traits might be possible without compromising seed yield loss. On the basis of direct selection through panicle exertion rate, angle and duration of florate opening, filament length and stigma exertion rate would significantly improve seed yield of CMS lines. Based on mean, range, genetic parameters, correlation coefficient and path coefficient values, direct selection of eight CMS lines IR79156A, BRRI7A, IR75608A, BRRI13A, BRRI35A, BRRI48A, BRRI50A and BRRI53A might be fruitful as good floral characteristics with high out crossing rate of CMS lines. Key words: Variability, heritability, correlation coefficient, stigma exertion rate
INTRODUCTION
Rice is a major source of livelihood in terms of
providing food, income and employment in
Bangladesh. It covers about 77 percent of the
total cropped area in the country. Rice
production in Bangladesh remains almost
stagnant in the 2016 at around 34.18 MMT
(rough rice or paddy) from 11.6 million
hectares of land (Wallace, 2017). But the
population growth rate accelerated, so this
burgeoning population needs more food. Rice
breeder have therefore, been trying to evolve
input-efficient high yielding varieties (HYV) to
increase the yield through limited land, labour,
water etc. One innovation has been the
development of hybrid rice varieties for the
tropics, which is expected to shift the yield
potential of rice plant by 15-20 percent or
more. The technology has attracted the
attention of research leaders and policy-
makers in many Asian countries who see it as
an opportunity to overcome the yield ceilings.
The discovery of CMS in rice suggested that
breeding could develop a commercially viable
F1 hybrid (Athwal and Virmani, 1972). The
most promising hybrids yielded 20-30% (Lin
and Yuan, 1980) and l5-20% (Yuan, 1998)
higher than the best conventional rice
varieties. Therefore, to break through the
present yield ceiling of semi dwarf modern
varieties, hybrid rice seems to be an attractive
viable alternative. It is urgently needed to
develop parental lines viz. A lines, B lines and
R lines for developing hybrid rice varieties,
with resistance to disease or environmental
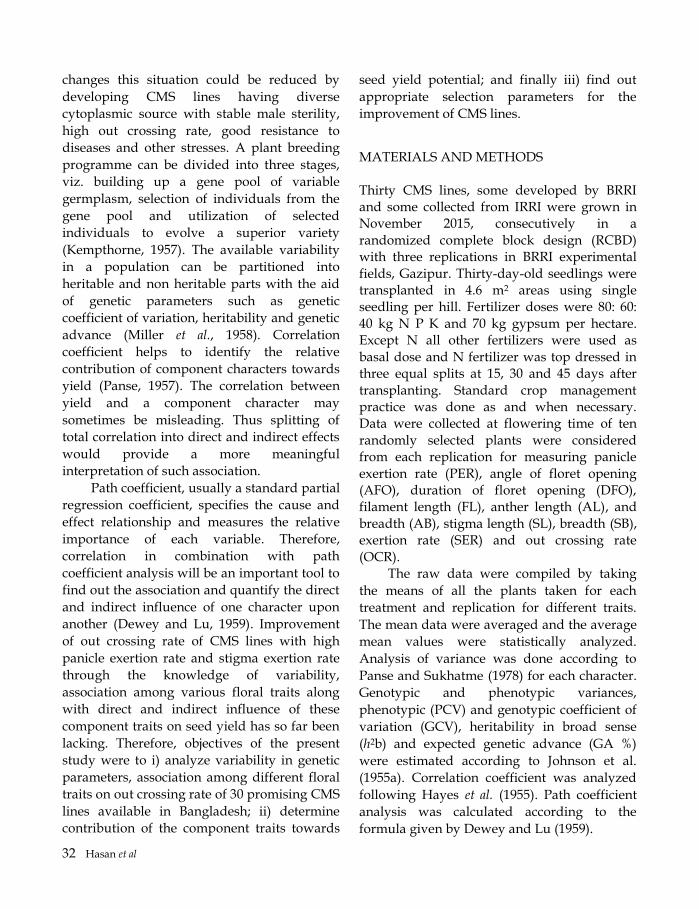
32 Hasan et al
changes this situation could be reduced by
developing CMS lines having diverse
cytoplasmic source with stable male sterility,
high out crossing rate, good resistance to
diseases and other stresses. A plant breeding
programme can be divided into three stages,
viz. building up a gene pool of variable
germplasm, selection of individuals from the
gene pool and utilization of selected
individuals to evolve a superior variety
(Kempthorne, 1957). The available variability
in a population can be partitioned into
heritable and non heritable parts with the aid
of genetic parameters such as genetic
coefficient of variation, heritability and genetic
advance (Miller et al., 1958). Correlation
coefficient helps to identify the relative
contribution of component characters towards
yield (Panse, 1957). The correlation between
yield and a component character may
sometimes be misleading. Thus splitting of
total correlation into direct and indirect effects
would provide a more meaningful
interpretation of such association.
Path coefficient, usually a standard partial
regression coefficient, specifies the cause and
effect relationship and measures the relative
importance of each variable. Therefore,
correlation in combination with path
coefficient analysis will be an important tool to
find out the association and quantify the direct
and indirect influence of one character upon
another (Dewey and Lu, 1959). Improvement
of out crossing rate of CMS lines with high
panicle exertion rate and stigma exertion rate
through the knowledge of variability,
association among various floral traits along
with direct and indirect influence of these
component traits on seed yield has so far been
lacking. Therefore, objectives of the present
study were to i) analyze variability in genetic
parameters, association among different floral
traits on out crossing rate of 30 promising CMS
lines available in Bangladesh; ii) determine
contribution of the component traits towards
seed yield potential; and finally iii) find out
appropriate selection parameters for the
improvement of CMS lines.
MATERIALS AND METHODS Thirty CMS lines, some developed by BRRI and some collected from IRRI were grown in November 2015, consecutively in a
randomized complete block design (RCBD) with three replications in BRRI experimental
fields, Gazipur. Thirty-day-old seedlings were transplanted in 4.6 m2 areas using single seedling per hill. Fertilizer doses were 80: 60:
40 kg N P K and 70 kg gypsum per hectare. Except N all other fertilizers were used as
basal dose and N fertilizer was top dressed in three equal splits at 15, 30 and 45 days after
transplanting. Standard crop management practice was done as and when necessary. Data were collected at flowering time of ten
randomly selected plants were considered from each replication for measuring panicle
exertion rate (PER), angle of floret opening (AFO), duration of floret opening (DFO), filament length (FL), anther length (AL), and
breadth (AB), stigma length (SL), breadth (SB), exertion rate (SER) and out crossing rate
(OCR). The raw data were compiled by taking
the means of all the plants taken for each
treatment and replication for different traits.
The mean data were averaged and the average
mean values were statistically analyzed.
Analysis of variance was done according to
Panse and Sukhatme (1978) for each character.
Genotypic and phenotypic variances,
phenotypic (PCV) and genotypic coefficient of
variation (GCV), heritability in broad sense
(h2b) and expected genetic advance (GA %)
were estimated according to Johnson et al.
(1955a). Correlation coefficient was analyzed
following Hayes et al. (1955). Path coefficient
analysis was calculated according to the
formula given by Dewey and Lu (1959).
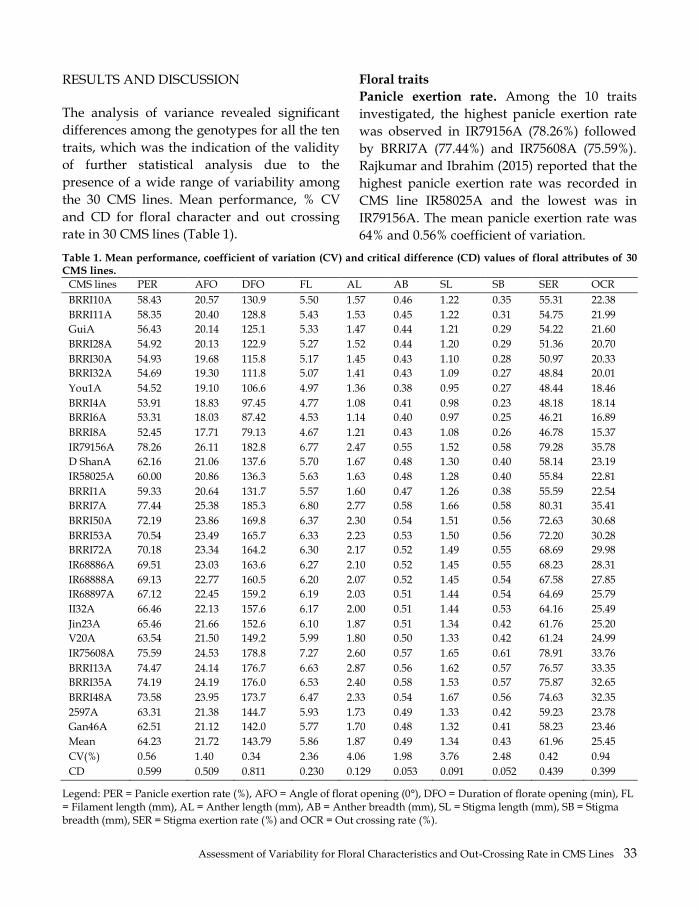
Assessment of Variability for Floral Characteristics and Out-Crossing Rate in CMS Lines 33
RESULTS AND DISCUSSION The analysis of variance revealed significant
differences among the genotypes for all the ten
traits, which was the indication of the validity
of further statistical analysis due to the
presence of a wide range of variability among
the 30 CMS lines. Mean performance, % CV
and CD for floral character and out crossing
rate in 30 CMS lines (Table 1).
Floral traits
Panicle exertion rate. Among the 10 traits
investigated, the highest panicle exertion rate
was observed in IR79156A (78.26%) followed
by BRRI7A (77.44%) and IR75608A (75.59%).
Rajkumar and Ibrahim (2015) reported that the
highest panicle exertion rate was recorded in
CMS line IR58025A and the lowest was in
IR79156A. The mean panicle exertion rate was
64% and 0.56% coefficient of variation.
Table 1. Mean performance, coefficient of variation (CV) and critical difference (CD) values of floral attributes of 30 CMS lines.
CMS lines PER AFO DFO FL AL AB SL SB SER OCR
BRRI10A 58.43 20.57 130.9 5.50 1.57 0.46 1.22 0.35 55.31 22.38
BRRI11A 58.35 20.40 128.8 5.43 1.53 0.45 1.22 0.31 54.75 21.99
GuiA 56.43 20.14 125.1 5.33 1.47 0.44 1.21 0.29 54.22 21.60
BRRI28A 54.92 20.13 122.9 5.27 1.52 0.44 1.20 0.29 51.36 20.70
BRRI30A 54.93 19.68 115.8 5.17 1.45 0.43 1.10 0.28 50.97 20.33
BRRI32A 54.69 19.30 111.8 5.07 1.41 0.43 1.09 0.27 48.84 20.01
You1A 54.52 19.10 106.6 4.97 1.36 0.38 0.95 0.27 48.44 18.46
BRRI4A 53.91 18.83 97.45 4.77 1.08 0.41 0.98 0.23 48.18 18.14
BRRI6A 53.31 18.03 87.42 4.53 1.14 0.40 0.97 0.25 46.21 16.89
BRRI8A 52.45 17.71 79.13 4.67 1.21 0.43 1.08 0.26 46.78 15.37
IR79156A 78.26 26.11 182.8 6.77 2.47 0.55 1.52 0.58 79.28 35.78
D ShanA 62.16 21.06 137.6 5.70 1.67 0.48 1.30 0.40 58.14 23.19
IR58025A 60.00 20.86 136.3 5.63 1.63 0.48 1.28 0.40 55.84 22.81
BRRI1A 59.33 20.64 131.7 5.57 1.60 0.47 1.26 0.38 55.59 22.54
BRRI7A 77.44 25.38 185.3 6.80 2.77 0.58 1.66 0.58 80.31 35.41
BRRI50A 72.19 23.86 169.8 6.37 2.30 0.54 1.51 0.56 72.63 30.68
BRRI53A 70.54 23.49 165.7 6.33 2.23 0.53 1.50 0.56 72.20 30.28
BRRI72A 70.18 23.34 164.2 6.30 2.17 0.52 1.49 0.55 68.69 29.98
IR68886A 69.51 23.03 163.6 6.27 2.10 0.52 1.45 0.55 68.23 28.31
IR68888A 69.13 22.77 160.5 6.20 2.07 0.52 1.45 0.54 67.58 27.85
IR68897A 67.12 22.45 159.2 6.19 2.03 0.51 1.44 0.54 64.69 25.79
II32A 66.46 22.13 157.6 6.17 2.00 0.51 1.44 0.53 64.16 25.49
Jin23A 65.46 21.66 152.6 6.10 1.87 0.51 1.34 0.42 61.76 25.20
V20A 63.54 21.50 149.2 5.99 1.80 0.50 1.33 0.42 61.24 24.99
IR75608A 75.59 24.53 178.8 7.27 2.60 0.57 1.65 0.61 78.91 33.76
BRRI13A 74.47 24.14 176.7 6.63 2.87 0.56 1.62 0.57 76.57 33.35
BRRI35A 74.19 24.19 176.0 6.53 2.40 0.58 1.53 0.57 75.87 32.65
BRRI48A 73.58 23.95 173.7 6.47 2.33 0.54 1.67 0.56 74.63 32.35
2597A 63.31 21.38 144.7 5.93 1.73 0.49 1.33 0.42 59.23 23.78
Gan46A 62.51 21.12 142.0 5.77 1.70 0.48 1.32 0.41 58.23 23.46
Mean 64.23 21.72 143.79 5.86 1.87 0.49 1.34 0.43 61.96 25.45
CV(%) 0.56 1.40 0.34 2.36 4.06 1.98 3.76 2.48 0.42 0.94
CD 0.599 0.509 0.811 0.230 0.129 0.053 0.091 0.052 0.439 0.399
Legend: PER = Panicle exertion rate (%), AFO = Angle of florat opening (0°), DFO = Duration of florate opening (min), FL = Filament length (mm), AL = Anther length (mm), AB = Anther breadth (mm), SL = Stigma length (mm), SB = Stigma breadth (mm), SER = Stigma exertion rate (%) and OCR = Out crossing rate (%).
34 Hasan et al
Angle of floret opening. This trait varied from 17.71° (BRRI8A) to 26.11° (IR79156A) with a mean value 21.72°. Vagolu (2010) also observed mean value of CMS line was 22.90°. The coefficient of variation for this trait was 1.40%.
Duration of floret opening. The variation for this character ranged from 79.13 to 185.3 minute with a mean value 143.79 minute. BRRI7A and IR79156A also recorded higher duration of floret opening.
Filament length. The trait filament length was varied from 4.53 mm (BRRI6A) to 7.27 mm (IR75608A) with an overall mean value of 5.86mm. The highest filament length was observed in the CMS line IR75608A followed by CMS line BRRI7A (6.80 mm) and IR79156A (6.77 mm). Among 30 CMS lines studied 16 CMS lines had higher filament length than the mean value. The coefficient of variability was 2.36% for filament length.
Anther length. The variations of the anther length were highly pronounced among the CMS lines which ranged from 1.08 mm in the CMS line BRRI4A to 2.87 mm in the CMS line BRRI13A. The average mean of the anther length was 1.87 mm, 13 CMS line showed above average performance for anther length. The coefficient of variation for this trait was 4.06%.
Anther breadth. The anther breadth among the CMS lines studied ranged from 0.38 mm (You1A) to 0.58 mm (BRRI35A) with a mean value of 0.49 mm. The CMS lines BRRI35A and BRRI7A also recorded higher anther breadth. The coefficient of variation was 1.98.
Stigma length. The trait varied from o.95 mm (You1A) to 1.67 mm (BRRI48A) with mean value of 1.34 mm. Among the 30 CMS lines BRRI48A and BRRI7A recorded higher stigma length. Vagolu (2010) also assessed the similar result in CMS lines. The coefficient of variation was 1.34.
Stigma breath. Although the stigma breadth had significant variations among the
CMS lines, the range of variations of the lines weren’t pronounced (0.23 mm to 0.61 mm). The highest stigma breadth was found in IR75608A followed by BRRI7A (0.58 mm) and IR79156A (0.58 mm). The coefficient of variation for this trait was 2.48.
Stigma exsertion rate. The variations of the stigma exertion rate were highly pronounced among the genotypes which ranged from 46.21% in the CMS lines BRRI6A to 80.31% in the CMS lines BRRI7A. The average mean of the stigma exertion rate was 61.96%. Thirteen CMS lines showed above average performance for stigma exertion rate, of which 6 CMS lines viz BRRI7A, IR79156A, IR75608A, BRRI13A, BRRI35A and BRRI48A showed outstanding stigma exertion rate 80.31%, 79.28%, 78.91%, 76.57%, 75.87% and 74.63% respectively. The CV for this trait was 0.42%.
Out crossing rate. Enormous out crossing rate was obtained from 30 CMS lines investigated that ranged from 15.37% (BRRI8A) to 35.78% (IR79156A) with an average value of 25.45%. The highest OCR was obtaining from the CMS line IR79156A, followed by CMS lines BRRI7A (35.41%), IR75608A (33.76%), BRRI13A (33.35%), BRRI35A (32.65%) and BRRI48A (32.35%). Out of 30 CMS lines studied eight had OCR>30% while four CMS lines (BRRI8A, BRRI6A, BRRI4A and You1A) had lower OCR. From this investigation it was revealed that when out crossing rates high it is associated with high rates in other floral traits. The investigation also showed that eight CMS lines IR79156A, BRRI7A, IR75608A, BRRI13A, BRRI35A, BRRI48A, BRRI50A and BRRI53A were out yielded over their corresponding means. Variability studies Variability plays a vital role in the selection of superior genotypes in crop improvement programme. Pronounced variation in the breeding materials is a prerequisite for

Assessment of Variability for Floral Characteristics and Out-Crossing Rate in CMS Lines 35
development of varieties to fulfill the existing demand. Economically important traits are generally quantitative in nature that interacts with the environment where it is grown. This is why breeder should calculate the variability by partitioning into genotypic, phenotypic, and environmental effects. Creation of variability is prerequisite for crop breeders. Floral traits are quantitative in nature, and interact with the environment under study, so partitioning the traits into genotypic, phenotypic, and environmental effects is essential to find out the additive or heritable portion of variability. Table 2 presents the mean, range, genotypic and phenotypic variance (Vg, Vp) and coefficient of variation (GCV, PCV), h2b, GA and GA in percent of mean. In the present investigation, the range of variation was much prominent for all the traits except anther breadth and stigma breadth indicating a wide range of variability among the CMS lines studied. High genotypic and phenotypic variances were observed for panicle exertion rate, angle of floret opening, duration of florate opening, filament length, stigma exertion rate and out crossing rate showing the presence of the wide range of variability among the traits in CMS lines. In contrast anther length, anther breadth, stigma length and breadth had showed low genotypic and phenotypic variances that indicate no scope of selection on the basis of these traits for improvement of CMS lines. Panicle exertion rate, angle of florate opening, duration of florate opening, filament length, stigma exertion rate and out crossing rate had close differences in genotypic and phenotypic variances along with genotypic coefficient of variability (GCV) and phenotypic coefficient of variability (PCV) values, indicating preponderance of additive gene effects for these traits. Less environmental influence in the expression of these traits or the major portion of the phenotypic variance was genetic in nature and greater scope of improvement of CMS line through selection. Hossain et al.
(2016) reported similar findings. Variability alone is not of much help in determining the heritable portion of variation. The amount of gain expected from a selection depends on heritability and genetic advance in a trait.
Heritability has been widely used to
assess the degree to which a character may be
transmitted from parent to offspring.
Knowledge of heritability of a character is
important as it indicates the possibility and
extent to which improvement is possible
through selection. However, high heritability
alone is not enough to make sufficient
improvement through selection generally in
advance generations unless accompanied by a
substantial amount of genetic advance
(Johnson et al., 1955b). The expected genetic
advance is a function of selection intensity,
phenotypic variance, and heritability and
measures the differences between the mean
genotypic values of the original population
from which the progeny is selected. It has been
emphasized that genetic gain should be
considered along with heritability in coherent
selection breeding programme (Sarker et al.,
2015). It is considered that if a trait is governed
by non-additive gene action it may give high
heritability but low genetic advance, which
limits the scope for improvement through
selection, whereas if it is governed by additive
gene action, heritability and genetic advance
would be high, consequently substantial gain
can be achieved through selection. The
heritability was high for all the traits indicated
the preponderance of additive gene action for
these traits. High heritability coupled with
high GA in percent of mean was observed for
all the traits indicated that were governed to a
great extent by additive gene. So selection
based on these traits would be effective for the
improvement of CMS lines. High heritability
(84.9) and high genetic advance as percent of
mean (23.54) were recorded for stigma exertion
rate by Vagolu (2010).

36 Hasan et al
Table 2. Genetic parameter for floral attributes of 30 CMS lines.
Character Range MS σ2g σ2e σ2p GCV PCV h2b GA GAPM
PER 52.45-78.26 196.53** 65.47 0.13 65.60 12.60 12.67 99.80 12.77 19.88 AFO 17.71-26.11 14.19** 4.70 0.09 4.79 9.98 10.08 98.06 3.39 15.62 DFO 79.13-185.3 2522.59** 840.79 0.23 841.02 20.16 20.17 99.97 45.81 31.86 FL 4.53-7.27 1.42** 0.47 0.02 0.49 11.68 11.91 96.10 1.06 18.09 AL 1.08-2.87 0.69** 0.23 0.01 0.24 25.57 25.90 97.44 0.75 39.87 AB 0.38-0.58 0.009** 0.01 0.01 0.02 10.52 12.33 72.73 0.07 14.17 SL 0.95-1.67 0.13** 0.04 0.01 0.05 15.44 15.97 93.43 0.32 23.58 SB 0.23-0.61 0.05** 0.02 0.01 0.03 29.21 30.11 94.12 0.19 44.78 SER 46.21-80.31 348.22** 116.05 0.07 116.12 17.39 17.39 99.94 17.02 27.46 OCR 15.37-35.78 97.41** 32.45 0.06 32.51 22.38 22.40 99.82 8.99 35.33
** = Significant at the 1% level, σ2g = Genotypic variance, σ2e = Environmental variance, σ2p = Phenotypic variance, GCV = Genotypic coefficients of variations, PCV = Phenotypic coefficients of variations, h2b = Heritability in broad sense, GA = Genetic advance, GAPM = Genetic advance percent of mean. PER = Panicle exertion rate(%), AFO = Angle of florat opening (0°), DFO = Duration of florate opening (min), FL = Filament length (mm), AL = Anther length (mm), AB = Anther breadth (mm), SL = Stigma length (mm), SB = Stigma breadth (mm), SER = Stigma exertion rate (%) and OCR = Out crossing rate (%).
Correlation studies
Table 3 presents the phenotypic and genotypic correlations between the various characters. In the present investigation, the genotypic correlation coefficients were very much close to the corresponding phenotypic values for all the traits indicating additive type of gene action i.e., less environmental influence on the expression of the traits.
From Table 3 it was revealed that out
crossing rate had a significant positive
correlation with panicle exertion rate
(0.986**), angle of florate opening (0.895**),
duration of florate opening (0.865**),
filament length (0.777**), stigma length
(0.884**), stigma breadth (0.746**) and
stigma exertion rate (o.993**) indicating
selection for high panicle exertion rate, angle
of florate opening, duration of florate
opening, filament length, stigma length,
breadth and exertion rate were closely
Table 3. Genotypic (rg) and phenotypic (rp) correlation coefficient for floral attributes of 30 CMS lines.
Character AFO DFO FL AL AB SL SB SER OCR
PER rg 0.989** 0.964** 0.883** 0.392 0.567 0.785** 0.777** 0.995** 0.986** rp 0.981** 0.963** 0.768** 0.331 0.429 0.765** 0.674* 0.894** 0.884** AFO rg 0.881** 0.898** 0.473 0.596 0.791** 0.863** 0.791** 0.895** rp 0.875** 0.817** 0.442 0.379 0.779** 0.756** 0.684* 0.788** DFO rg 0.628 0.565 0.494 0.698* 0.763** 0.963** 0.865** rp 0.553 0.491 0.435 0.478 0.660* 0.862** 0.764** FL rg 0.629* 0.684* 0.564 0.473 0.778** 0.777** rp 0.587 0.632* 0.504 0.351 0.664* 0.665* AL rg 0.592 0.434 0.454 0.593 0.696 rp 0.521 0.364 0.444 0.484 0.646 AB rg 0.255 0.372 0.685 0.685 rp 0.198 0.259 0.475 0.574 SL rg 0.774** 0.784** 0.884** rp 0.650* 0.767** 0.823** SB rg 0.764** 0.746* rp 0.662* 0.643* SER rg 0.993** rp 0.892**
** = Significant at the 1% level and * = Significant at the 5% level, PER = Panicle exsertion rate (%), AFO = Angle of florat opening (0o), DFO = Duration of florate opening (min), FL = Filament length (mm), AL = Anther length (mm), AB = Anther breadth (mm), SL = Stigma length (mm), SB = Stigma breadth (mm), SER = Stigma exsertion rate (%) and OCR = Out crossing rate(%).

Assessment of Variability for Floral Characteristics and Out-Crossing Rate in CMS Lines 37
associated with high out crossing rate i.e. increase in panicle exertion rate, angle of florate opening, duration of florate opening, filament length, stigma length, breadth and exertion rate could lead to increase the out crossing rate of CMS line. Rajkumar and Ibrahim (2015) revealed that panicle exertion rate had positive association with out-crossing rate. Similarly Roy et al. (2015) observed significant positive association between yield and its contributing traits in rice. Stigma exertion rate had the significant positive association with panicle exertion rate (0.995**), angle of florate opening (0.791**), duration of florate opening (0.963**), filament length (0.778**), stigma length (0.784**) and stigma breadth (0.764**) indicating high stigma exertion rate with high out crossing rate. A similar trend was observed by earlier work in CMS line (Hossain et al., 2016). Genotypic correlation was found insignificant between stigma breadth with anther length and breadth. It was also found insignificant between stigma length with anther length and breadth indicated that selection for high anther length and breadth might be possible without compromising seed yield loss. Similarly, no significant association was found between anther breadth and length with panicle exertion rate, angle of florate opening, duration of florate opening. Filament length and duration of florate opening showed significant positive association with panicle exertion rate and angle of florate opening that exhibited a significant positive correlation with panicle exertion rate. Path coefficient studies Path coefficient analysis was carried out using genotypic correlation coefficient among ten floral traits to estimate the direct and indirect effect on out crossing rate in CMS line (Table 4). The angle of florate opening (0.821) and stigma exertion rate (0.771) exhibited high positive direct effect on out crossing rate. On the other hand, high negative direct effect was
observed in stigma length (-0.407) and moderate negative direct effect was found in anther length (-0.244) and stigma breadth (-0.247). Anther breadth (=0.002) had negligible negative direct effect on out crossing rate. Similarly, Hasan et al., (2015) observed that yield contributing traits had direct positive effect on grain yield in hybrid rice. Hossain et al., (2016) also observed percent stigma exertion had remarkable positive direct effect on out crossing rate. The panicle exertion rate (0.123) showed little positive direct effect on out crossing rate. The duration of florate opening (0.103) and filament length (0.198) exhibited considerable positive direct effect on out crossing rate. It was interesting that path coefficient analysis results confirmed the similarity of the correlation coefficient analysis result. Anther length had considerable negative direct effect and insignificant positive correlation and anther breadth exhibited negligible negative direct effect and insignificant positive correlation. Direct selection based on these two traits (anther length and breadth) would not be effective for the improvement of out crossing rate i.e. seed yield of CMS lines. Concomitant selection based on high panicle exertion rate and high out crossing rate would be effective for the improvement of CMS lines. Panicle exertion rate showed considerable positive direct effect with high positive genotypic correlation on out crossing rate. Vagolu (2010) revealed that panicle exertion rate had positive direct effect and positive correlation with out-crossing percentage. Direct selection on the basis of panicle exertion rate would be effective for improving out crossing rate as well as seed yield of CMS lines.
Large amount of variability in respect of panicle exertion rate, floral characteristics and stigma exertion rate were observed among the CMS lines while analyzing genetic parameters, correlation and path coefficient values and interpretation of these results. Breeder may utilize the present findings for developing

38 Hasan et al
Table 4. Partitioning of genotypic correlation into direct (bold) and indirect effect for floral attributes of 30 CMS lines.
Character Effect through OCR
PER AFO DFO FL AL AB SL SB SER
PER 0.123 0.812 0.099 0.194 -0.241 -0.003 -0.400 -0.240 0.766 0.986** AFO 0.002 0.821 0.101 0.197 -0.244 -0.002 -0.403 -0.237 0.763 0.895** DFO 0.002 0.806 0.103 0.196 -0.235 -0.001 -0.406 -0.237 0.741 0.865** FL 0.002 0.820 0.103 0.198 -0.241 -0.001 -0.412 -0.239 0.754 0.777** AL 0.002 0.821 0.099 0.196 -0.244 -0.002 -0.403 -0.235 0.764 0.696 AB 0.003 0.817 0.102 0.200 -0.242 -0.002 -0.408 -0.239 0.759 0.685 SL 0.002 0.813 0.103 0.200 0.241 -0.001 -0.407 -0.240 0.759 0.884** SB 0.002 0.790 0.099 0.192 -0.232 -0.001 -0.396 -0.247 0.743 0.746* SER 0.002 0.813 0.099 0.193 -0242 -0.002 -0.400 -0.238 0.771 0.993**
Residual effect – 0.067. ** = Significant at the 1% level and * = Significant at the 5% level. PER = Panicle exertion rate(%), AFO = Angle of florate opening (0°), DFO = Duration of florate opening (min), FL = Filament length (mm), AL = Anther length (mm), AB = Anther breadth (mm), SL = Stigma length (mm), SB = Stigma breadth (mm), SER = Stigma exsertion rate (%) and OCR = Out crossing rate (%).
high seed producing CMS line with good floral
characteristics in future. Further investigation
may be carried out to confirm the study in
different locations of Bangladesh for their
stability analysis.
CONCLUSION Considering high genotypic and phenotypic variance along with genotypic coefficient of variability and phenotypic coefficient of variability values, high heritability coupled with high genetic advance and genetic advance in percent of mean of six traits i.e. panicle exertion rate, angle of florate opening, duration of florate opening, anther length, stigma exertion rate and out crossing rate would be selected for the improvement of 30 CMS lines under study. However, correlation study revealed that strong positive association of panicle exertion rate, angle of florate opening, duration of florate opening, filament length, stigma length, breadth and exertion rate with out-crossing rate. Selection based on panicle exertion rate, angle of florate opening, duration of florate opening, filament length, stigma length, breadth and exertion rate could lead to increase the seed yield of CMS line. Based on direct selection through panicle exertion rate, angle of florate opening,
duration of florate opening, filament length and stigma exertion rate would significantly improve seed yield of CMS lines. On the basis of mean, genetic parameters, correlation coefficient value and direct selection of eight CMS lines IR79156A, BRRI7A, IR75608A, BRRI13A, BRRI35A, BRRI48A, BRRI50A and BRRI53A might be selected as good floral characteristics with high out-crossing rate of CMS lines. REFERENCES AthwaI, D S and S S Virmani. 1972. Cytoplasmic male
sterility and hybrid breeding in rice. In: Rice Breeding. IRRI, Manila, Philippines, pp. 615-620.
Dewey, D R and K H Lu. 1959. A correlation and path coefficient analysis of components of crested wheat grass seed production. Agron. J. 51:515-518.
Hayes, H K, F R Immer and D C Smith. 1955. Methods of Plant Breeding. 2nd edn. McGraw Hill Book Co. Inc., New York, USA, 551 p.
Hasan, M J, M U Kulsum, M H Rahman, M H Ali and M E Mahmud. 2015. Genetic variability, correlation and path analysis for yield related traits in hybrid rice. Bangladesh J. Agri. 40: 91-96.
Hossain, M A, M A K Mian, M G Rasul, M J Hasan, M U Kulsum and M A Karim. 2016. Genetic variability in floral traits of CMS lines and their relationship with out-crossing in rice. Trop. Agr. Develop. 60 (4): 236-241.
Johnson, H W, H F Robinson and R E Comstock. 1955b. Estimates of genetic and environmental variability in soybean. Agron. J., 47: 314–318.
Johnson, H W, H F Robinson and R E Comstock. 1955a. Genotypic and phenotypic correlation in soybean

Assessment of Variability for Floral Characteristics and Out-Crossing Rate in CMS Lines 39
and their implication in selection. Agron. J. 47:477-485.
Kempthorne, O. 1957. An Introduction to Genetical Statistics. John Wiley and Sons. Inc., New York, 545 p.
Lin, S C and L P Yuan. 1980. Hybrid rice breeding in China. In: Innovative Approaches to Rice Breeding. Int. Rice Res. Inst. Manila, Philippines. pp. 35-51.
Miller, P J, J C Williams, H F Robinson and R E Comstock. 1958. Estimates of genotypic and environmental variances and covariances in upland cotton and their implications in selection. Agron. J. 50:126-131.
Panse, V G and P V Sukhatme. 1978. Statistical Methods for Agricultural Workers. ICAR, New Delhi, 347 p.
Panse, V G. 1957. Genetics of quantitative characters in relation to plant breeding. Indian J. Gent. 17:318-328.
Rajkumar, S and S M Ibrahim. 2015. Genetic variability in CMS lines of rice (Oryza sativa L.) genotypes that influence out crossing rate percentage. Indian Journal Agricultural Research. 49 (2): 165-169.
Roy, R K, R R Majumder, S Sultana, M E Hoque and M S Ali. 2015. Genetic variability, correlation and path
coefficient analysis for yield and yield components in transplant aman rice (Oryza sativa L.). Bangladesh J. Bot. 44: 529-535.
Sarker, U, T Islam, G Rabbani and S Oba. 2015. Genotype variability in composition of antioxidant vitamins and minerals in vegetable amaranth. Genetika. 47 (1): 85-96.
Vagolu, B. 2010. Evaluation of CMS lines for their floral, morphological and agronomical traits in rice (Oryza sativa L.). MS Thesis Deptt. of Genetics and Plant Breeding, Acharya N.G. Ranga Agricultural University. Rajendranagar, Hyderabad-500 030. 100p.
Wallace, M R. 2017. Bangladesh grain and feed update. Global Agricultural Information Network. pp 1-9.
Yuan, L P. 1998. Hybrid rice breeding in China. In: Virmani S S, Siddiq E A, Muralidharan K. (editors). Advances in hybrid rice technology. Proceedings of the 3rd International Symposium on Hybrid Rice, 14-16 November 1996. Hyderabad, India. Manila (Philippines): International Rice Research Institute. p 27-33.

Bangladesh Rice J. 22 (2) : 41-54, 2018, doi.org/10.3329/brj.v22i2.44041
1Genetic Resources and Seed Division, Bangladesh Rice Research Institute (BRRI), Gazipur. 2Country Manager, CIAT, Harvest plus, Bangladesh. 3Professor, Bangabandhu Sheikh Mujibur Rahman Agricultural University (BSMRAU), Gazipur. 4Laboratory Genetics and Genomics, Department of Bioscience, Graduate School of Science and Technology, Shizuoka University, 836 Oya, Suruga-ku, Shizuoka, Shizuoka 422-8529. *Corresponding author‟s E-mail: [email protected]
Agro-morphological Characterization of Bangladeshi Aromatic Rice (Oryza sativa L.)
Germplasm Based on Qualitative Traits
M Z Islam1*, M Khalequzzaman1, M K Bashar2 , N A Ivy3, M M Haque3, M A K Mian3 and M Tomita4
ABSTRACT
The agro-morphological characterization of germplasm is of utmost importance to generate information to be utilized in plant breeding programmes. The aim of this study was to characterize the agro-morphological traits of 113 accessions of aromatic germplasm (Oryza sativa L.) based on qualitative agro-morphological descriptors. No duplicates were identified among the studied accessions for qualitative traits in the cluster analysis, which means there is a high diversity among the accessions for these traits. Following UPGMA cluster analysis, 113 accessions of aromatic germplasm formed ten distinct clusters. The highest numbers of germplasm (96) were found in cluster IXd, 2 were found in cluster III, IV and VI, 3 were found in IXc and the lowest number of germplasm (1) in cluster I, II,V, VII, VIII, IXa, IXb and X, respectively. Aroma evaluation revealed that 67 germplasm were scented, 34 were lightly scented, while the rest 12 germplasm were non-scented. Germplasm namely Begun bichi, Elai, Chinigura, Basmati 370, Ranisalut, Sakkorkhora, Jirakatari, Raduni Pagal, Kalijira (long grain), Black TAPL-554, Kalgochi, BRRI dhan34, BRRI dhan50, Badshabhog-2, Tulsimala-2, Kataribhog, BU dhan2R , Sakkorkhana, Maloti, Bashful could be used for further improvement for incorporating aroma to the high yielding varieties. Keywords: Agro-morphological characterization, aromatic rice germplasm, qualitative traits
INTRODUCTION Bangladesh is mainly a country of rice based cropping system, where thousands of local rice varieties are being cultivated from the time immemorial. Still now, farmers are cultivating local landraces in most of the unfavourable ecosystems. Traditional varieties have some special characteristics such as aroma, taste and better cooking quality, which also provide additional value in socio-economic aspects. Moreover, aromatic rice germplasm constitutes a special group of rice genotypes well known in many countries of the world for their aroma and or super fine grain quality (Singh et al., 2000, Islam et al., 2013). The Himalayan foothills including parts of Bangladesh are considered to be the secondary centre of
diversity of the genus oryza (Morishima, 1984). Bangladesh has a stock of above 8,500 rice germplasm of which around 100 are aromatic genotypes (Islam et al., 2018a). The Bangladeshi aromatic and fine rice germplasm is comprised of short and medium bold types with mild to strong aroma (Shahidullah et al., 2009; Islam et al., 2016). Since the time of civilization, thousands of locally adapted aromatic rice genotypes have evolved as a consequence of natural and human selection. These landraces are the genetic reservoirs of useful genes. The large scale spread of modern, high yielding varieties have replaced the traditional varieties especially in the irrigated rice ecosystem leading to reduced genetic base and thus increased genetic vulnerability. Therefore, rice germplasm need

42 Islam et al
to be utilized for maintaining its diversity in the field.
Agro-morphological characterization of germplasm accessions is essential in order to offer information for plant breeding programmes (Nascimento et al., 2011). Several researchers reported the use of agro-morphological markers in the characterization and study of rice (Oryza sativa L.) germplasm diversity (Islam et al., 2017; Mau et al., 2017; Akter et al., 2018). Aromatic rice varieties in general are tall statured, possess fewer number of panicles, high stem weight, lower yields and susceptible in lodging (Islam et al., 2016). Glaszmann (1987) reported that aromatic rice germplasm fall into a separate group from that of the typical indicas and declared that these two groups are incompatible causing inter-group hybrid sterility. Recently it is revealed that 2-acetyl-1-pyrroline based fragrance in rice is due to the presence of a non-functional betaine aldehyde dehydrogenase 2 (BADH2) (Bradbury et al., 2005, 2008). The non-functional BADH2 interferes in pollen tube development and this could be the cause for the low grain yield in aromatic germplasm (Bradbury et al., 2008). Morphological characterization is the first step in the classification and assessment of the germplasm. Although large number of germplasm collections is known to exist in BRRI Genebank in Bangladesh, not all of them have been fully and properly characterized and documented. Therefore, systematic attempts have to be taken to make a total inventory of this valuable gene pool for quantifying the availability of new useful genes of this source. Besides, it is very important to protect bio-piracy and geographical indications and issues related Intellectual Property Rights (IPR). On the other hand, researches on qualitative traits evaluation on aromatic rice germplasm are almost nil. Considering the above fact, the present study was initiated to characterize the qualitative agro-morphological characters of aromatic germplasm of Bangladesh.
MATERIALS AND METHODS Experimental site and plant materials
The experiment was conducted at the farm of Bangladesh Rice Research Institute (BRRI), Gazipur in T. Aman season, 2011. A total of 113 aromatic germplasm were evaluated using “Germplasm Descriptors and Evaluation Form” approved by BRRI (Table 1). Names for the 113 aromatic rice germplasm along with methods have been previously described by Islam et al. (2016). Agro-morphological traits observation
We observed variables of 28 qualitative agro-morphological characters namely: 1. Blade pubescence, 2. Blade colour, 3. Leaf sheath: anthocyanin colour (early to late vegetative stage), 4. Basal leaf sheath colour (early to late vegetative stage), 5. Leaf angle (prior to heading), 6. Flag leaf angle (after heading), 7. Ligule colour (late vegetative stage), 8. Ligule shape (late vegetative stage), 9. Coller colour (late vegetative stage), 10. Auricle colour (late vegetative stage), 11. Culm: anthocyanin colouration of nodes (after flowerting), 12. Culm angle (after flowerting), 13. Internode colour (after flowering), 14. Culm strength (after flowerting to maturity), 15. Panicle type (near maturity), 16. Secondery branching (near maturity), 17. Panicle exsertion (near maturity), 18. Spikelet: awns in the spiklet, 19. Spikelet: length of the longest awn (flowering to maturity), 20. Distribution of awning (flowering to maturity), 21. Awn colour (at maturity), 22. Apiculus colour (at maturity), 23. Stigma colour (at flowering), 24. Lemma and palea colour (at maturity), 25. Lemma and palea pubescence (at maturity), 26. Seed coat colour (at maturity), 27. Leaf senescence (at maturity), 28. Decorticated grain: scent (aroma), at maturity stage. The observed qualitative traits were scored based on “Germplasm Descriptors and Evaluation Form” issued by BRRI prior to data analysis (Table 2).
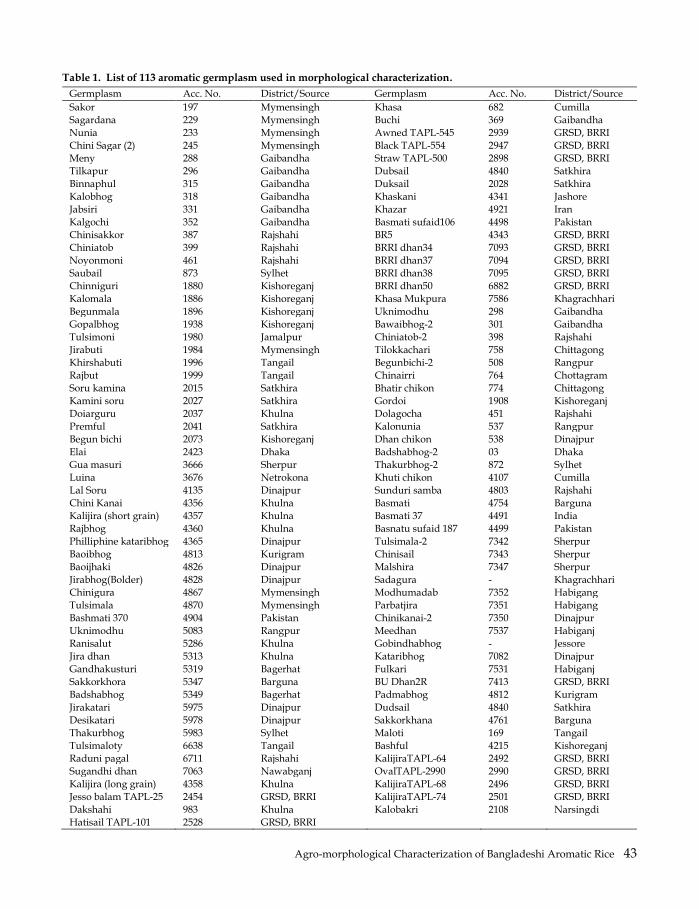
Agro-morphological Characterization of Bangladeshi Aromatic Rice 43
Table 1. List of 113 aromatic germplasm used in morphological characterization.
Germplasm Acc. No. District/Source Germplasm Acc. No. District/Source
Sakor 197 Mymensingh Khasa 682 Cumilla
Sagardana 229 Mymensingh Buchi 369 Gaibandha
Nunia 233 Mymensingh Awned TAPL-545 2939 GRSD, BRRI
Chini Sagar (2) 245 Mymensingh Black TAPL-554 2947 GRSD, BRRI
Meny 288 Gaibandha Straw TAPL-500 2898 GRSD, BRRI
Tilkapur 296 Gaibandha Dubsail 4840 Satkhira
Binnaphul 315 Gaibandha Duksail 2028 Satkhira
Kalobhog 318 Gaibandha Khaskani 4341 Jashore
Jabsiri 331 Gaibandha Khazar 4921 Iran
Kalgochi 352 Gaibandha Basmati sufaid106 4498 Pakistan
Chinisakkor 387 Rajshahi BR5 4343 GRSD, BRRI
Chiniatob 399 Rajshahi BRRI dhan34 7093 GRSD, BRRI
Noyonmoni 461 Rajshahi BRRI dhan37 7094 GRSD, BRRI
Saubail 873 Sylhet BRRI dhan38 7095 GRSD, BRRI
Chinniguri 1880 Kishoreganj BRRI dhan50 6882 GRSD, BRRI
Kalomala 1886 Kishoreganj Khasa Mukpura 7586 Khagrachhari
Begunmala 1896 Kishoreganj Uknimodhu 298 Gaibandha
Gopalbhog 1938 Kishoreganj Bawaibhog-2 301 Gaibandha
Tulsimoni 1980 Jamalpur Chiniatob-2 398 Rajshahi
Jirabuti 1984 Mymensingh Tilokkachari 758 Chittagong
Khirshabuti 1996 Tangail Begunbichi-2 508 Rangpur
Rajbut 1999 Tangail Chinairri 764 Chottagram
Soru kamina 2015 Satkhira Bhatir chikon 774 Chittagong
Kamini soru 2027 Satkhira Gordoi 1908 Kishoreganj
Doiarguru 2037 Khulna Dolagocha 451 Rajshahi
Premful 2041 Satkhira Kalonunia 537 Rangpur
Begun bichi 2073 Kishoreganj Dhan chikon 538 Dinajpur
Elai 2423 Dhaka Badshabhog-2 03 Dhaka
Gua masuri 3666 Sherpur Thakurbhog-2 872 Sylhet
Luina 3676 Netrokona Khuti chikon 4107 Cumilla
Lal Soru 4135 Dinajpur Sunduri samba 4803 Rajshahi
Chini Kanai 4356 Khulna Basmati 4754 Barguna
Kalijira (short grain) 4357 Khulna Basmati 37 4491 India
Rajbhog 4360 Khulna Basnatu sufaid 187 4499 Pakistan
Philliphine kataribhog 4365 Dinajpur Tulsimala-2 7342 Sherpur
Baoibhog 4813 Kurigram Chinisail 7343 Sherpur
Baoijhaki 4826 Dinajpur Malshira 7347 Sherpur
Jirabhog(Bolder) 4828 Dinajpur Sadagura - Khagrachhari
Chinigura 4867 Mymensingh Modhumadab 7352 Habigang
Tulsimala 4870 Mymensingh Parbatjira 7351 Habigang
Bashmati 370 4904 Pakistan Chinikanai-2 7350 Dinajpur
Uknimodhu 5083 Rangpur Meedhan 7537 Habiganj
Ranisalut 5286 Khulna Gobindhabhog - Jessore
Jira dhan 5313 Khulna Kataribhog 7082 Dinajpur
Gandhakusturi 5319 Bagerhat Fulkari 7531 Habiganj
Sakkorkhora 5347 Barguna BU Dhan2R 7413 GRSD, BRRI
Badshabhog 5349 Bagerhat Padmabhog 4812 Kurigram
Jirakatari 5975 Dinajpur Dudsail 4840 Satkhira
Desikatari 5978 Dinajpur Sakkorkhana 4761 Barguna
Thakurbhog 5983 Sylhet Maloti 169 Tangail
Tulsimaloty 6638 Tangail Bashful 4215 Kishoreganj
Raduni pagal 6711 Rajshahi KalijiraTAPL-64 2492 GRSD, BRRI
Sugandhi dhan 7063 Nawabganj OvalTAPL-2990 2990 GRSD, BRRI
Kalijira (long grain) 4358 Khulna KalijiraTAPL-68 2496 GRSD, BRRI
Jesso balam TAPL-25 2454 GRSD, BRRI KalijiraTAPL-74 2501 GRSD, BRRI
Dakshahi 983 Khulna Kalobakri 2108 Narsingdi
Hatisail TAPL-101 2528 GRSD, BRRI

44 Islam et al
Aroma test Aroma was detected by sniffing and was scored as non-scented, lightly scented, and scented following 1.7% KOH based method (Sood and Siddiq, 1978). Statistical analysis
Twenty-eight qualitative data were transformed to binary form described by Sneath and Sokal (1973). For qualitative traits, the presence and absence of the different variants were scored as 1 and 0 respectively. The data analysis was done using the NTSYS-pc version 2.2 (Rohlf, 2002 ). RESULTS AND DISCUSSION Qualitative traits characterization
Agro-morphological characterization is an important activity to evaluate the utilization of the germplasm collection in a genebank (Islam et al., 2018a). The diversity in crop varieties is essential for agricultural development for increasing food production; poverty alleviation and promoting economic growth. The present study was aimed at identifying distinct qualitative traits for aromatic rice germplasm. Polymorphism was found in 25 of the 28 qualitative traits studied; the non-polymorphic traits were of ligule colour, ligule shape and auricle colour (Table 2). Figure 1 presents variation in grain morphology of some aromatic rice germplasm. Among the 113 aromatic germplasm, 87.61% showed blade pubescence, 97.35% green blade colour, 95.58% green basal leaf sheath colour, 96.46% horizontal leaf angle, 95.58% pale green of collar colour, 94.69% has well exerted panicle and 88.49% has white colour of stigma. The present study results reveal that all aromatic rice germplasm have the same ligule colour, shape and auricle. Also the variability in most of the observed qualitative traits of aromatic rice germplasm was exhibited in our study. Similar studies were also reported by other researchers (Ahmed et al., 2016; Mau et al.,
2017; Akter et al., 2017 and Islam et al., 2017). However, Islam et al. (2018a) found that variation for leaf blade colour, lemma-palea colour, apiculus colour, lemma-palea pubescence and seed coat colour in similar named of aromatic rice landraces. Similarly, genetic variability in Kartiksail rice accessions of Bangladesh using qualitative agro-morphological character was also reported by Ahmed et al. (2015).
Fig. 1. Variation in grain morphology of some aromatic
rice germplasm.
Cluster analysis based on 28 qualitative traits The dendrogram were constructed on the basis of data generated from the 28 qualitative traits. Genetic distance ranged from 0.00 to 2.17 which revealed significant differences among test germplasm. The 113 aromatic germplasm were grouped into 10 clusters. As evident from Figure 2 and Table 3, the highest numbers of germplasm (96) were found in cluster IXd, 2 was found in cluster III, IV and VI, 3 were in IXc and the lowest number of genotypes (1) in cluster I, II,V, VII, VIII, IXa, IXb and X, respectively. Cluster IX consisted of four sub- clusters (IXa, IXb, IXc and IXd). Cluster IX sub-clusters IXa, IXb, IXc and IXd consisted of 1, 1, 3 and 96 aromatic germplasm, respectively. Similarly, Hossain (2008) observed 10 clusters by using UPGMA clustering method in 78 aromatic and fine grain landraces of rice genotypes. Two germplasm namely Kalgochi and Buchi in cluster IV were found similarity in 26 of the 28 qualitative traits studied and had very long awn (>20 mm). Bashful, Khazar,
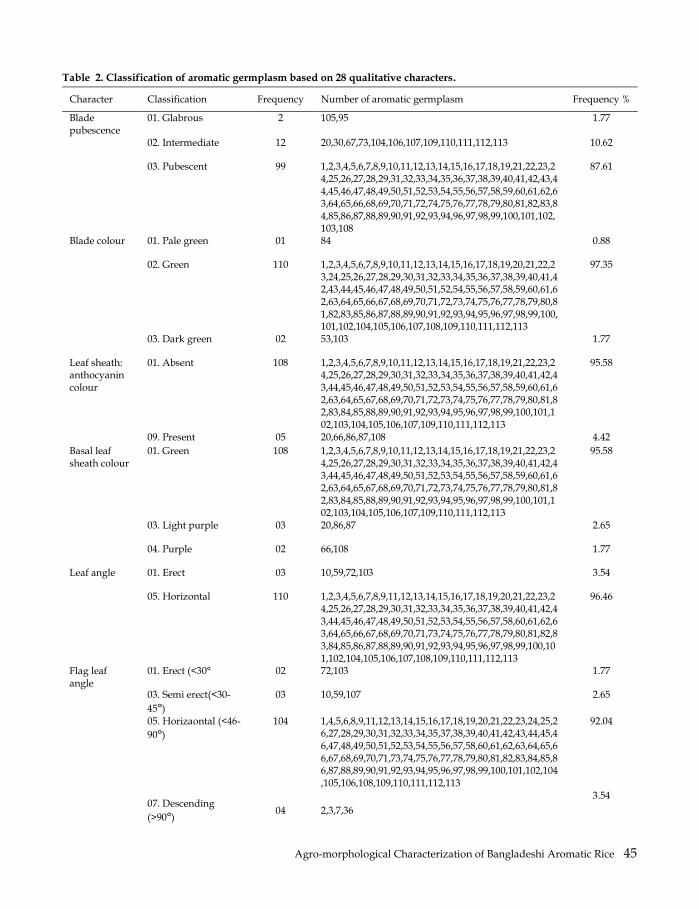
Agro-morphological Characterization of Bangladeshi Aromatic Rice 45
Table 2. Classification of aromatic germplasm based on 28 qualitative characters.
Character Classification Frequency Number of aromatic germplasm Frequency %
Blade pubescence
01. Glabrous 2 105,95
1.77
02. Intermediate 12 20,30,67,73,104,106,107,109,110,111,112,113 10.62
03. Pubescent 99 1,2,3,4,5,6,7,8,9,10,11,12,13,14,15,16,17,18,19,21,22,23,24,25,26,27,28,29,31,32,33,34,35,36,37,38,39,40,41,42,43,44,45,46,47,48,49,50,51,52,53,54,55,56,57,58,59,60,61,62,63,64,65,66,68,69,70,71,72,74,75,76,77,78,79,80,81,82,83,84,85,86,87,88,89,90,91,92,93,94,96,97,98,99,100,101,102,103,108
87.61
Blade colour 01. Pale green 01 84 0.88
02. Green 110 1,2,3,4,5,6,7,8,9,10,11,12,13,14,15,16,17,18,19,20,21,22,23,24,25,26,27,28,29,30,31,32,33,34,35,36,37,38,39,40,41,42,43,44,45,46,47,48,49,50,51,52,54,55,56,57,58,59,60,61,62,63,64,65,66,67,68,69,70,71,72,73,74,75,76,77,78,79,80,81,82,83,85,86,87,88,89,90,91,92,93,94,95,96,97,98,99,100,101,102,104,105,106,107,108,109,110,111,112,113
97.35
03. Dark green 02 53,103 1.77
Leaf sheath: anthocyanin colour
01. Absent 108 1,2,3,4,5,6,7,8,9,10,11,12,13,14,15,16,17,18,19,21,22,23,24,25,26,27,28,29,30,31,32,33,34,35,36,37,38,39,40,41,42,43,44,45,46,47,48,49,50,51,52,53,54,55,56,57,58,59,60,61,62,63,64,65,67,68,69,70,71,72,73,74,75,76,77,78,79,80,81,82,83,84,85,88,89,90,91,92,93,94,95,96,97,98,99,100,101,102,103,104,105,106,107,109,110,111,112,113
95.58
09. Present 05 20,66,86,87,108 4.42
Basal leaf sheath colour
01. Green 108 1,2,3,4,5,6,7,8,9,10,11,12,13,14,15,16,17,18,19,21,22,23,24,25,26,27,28,29,30,31,32,33,34,35,36,37,38,39,40,41,42,43,44,45,46,47,48,49,50,51,52,53,54,55,56,57,58,59,60,61,62,63,64,65,67,68,69,70,71,72,73,74,75,76,77,78,79,80,81,82,83,84,85,88,89,90,91,92,93,94,95,96,97,98,99,100,101,102,103,104,105,106,107,109,110,111,112,113
95.58
03. Light purple 03 20,86,87 2.65
04. Purple 02 66,108 1.77
Leaf angle 01. Erect 03 10,59,72,103 3.54
05. Horizontal 110 1,2,3,4,5,6,7,8,9,11,12,13,14,15,16,17,18,19,20,21,22,23,24,25,26,27,28,29,30,31,32,33,34,35,36,37,38,39,40,41,42,43,44,45,46,47,48,49,50,51,52,53,54,55,56,57,58,60,61,62,63,64,65,66,67,68,69,70,71,73,74,75,76,77,78,79,80,81,82,83,84,85,86,87,88,89,90,91,92,93,94,95,96,97,98,99,100,101,102,104,105,106,107,108,109,110,111,112,113
96.46
Flag leaf angle
01. Erect (<30° 02 72,103 1.77
03. Semi erect(<30-
45°)
03 10,59,107 2.65
05. Horizaontal (<46-
90°)
104 1,4,5,6,8,9,11,12,13,14,15,16,17,18,19,20,21,22,23,24,25,26,27,28,29,30,31,32,33,34,35,37,38,39,40,41,42,43,44,45,46,47,48,49,50,51,52,53,54,55,56,57,58,60,61,62,63,64,65,66,67,68,69,70,71,73,74,75,76,77,78,79,80,81,82,83,84,85,86,87,88,89,90,91,92,93,94,95,96,97,98,99,100,101,102,104,105,106,108,109,110,111,112,113
92.04
07. Descending
(>90°) 04 2,3,7,36
3.54

46 Islam et al
Table 2. Continued.
Character Classification Frequency Number of aromatic germplasm Frequency %
Ligule colour 01. White 113 1,2,3,4,5,6,7,8,9,10,11,12,13,14,15,16,17,18,19,20,21,22,23,24,25,26,27,28,29,30,31,32,33,34,35,36,37,38,39,40,41,42,43,44,45,46,47,48,49,50,51,52,53,54,55,56,57,58,59,60,61,62,63,64,65,66,67,68,69,70,71,72,73,74,75,76,77,78,79,80,81,82,83,84,85,86,87,88,89,90,91,92,93,94,95,96,97,98,99,100,101,102,103,104,105,106,107,108,109,110,111,112,113
Nil
Ligule shape 02. 2- cleft 113 1,2,3,4,5,6,7,8,9,10,11,12,13,14,15,16,17,18,19,20,21,22,23,24,25,26,27,28,29,30,31,32,33,34,35,36,37,38,39,10,41,42,43,44,45,46,47,48,49,50,51,52,53,54,55,56,57,58,59,60,61,62,63,64,65,66,67,68,69,70,71,72,73,74,75,76,77,78,79,80,81,82,83,84,85,86,87,88,89,90,91,92,93,94,95,96,97,98,99,100,101,102,103,104,105,106,107,108,109,110,111,112,113
Nil
Collar colour
01. Pale green 108 2,3,4,5,6,7,8,9,11,12,13,14,15,16,17,18,19,20,21,22,23,24,25,26,27,28,29,30,31,32,33,34,35,36,37,38,39,40,41,42,43,44,45,46,47,48,49,50,51,52,53,54,55,56,57,58,59,60,61,62,63,64,65,67,68,69,70,71,72,73,74,75,76,77,78,79,80,81,82,83,84,85,86,87,88,89,90,91,92,93,95,96,97,98,99,100,101,102,103,104,105,106,107,109,110,111,112,113
95.58
03. Purple 05 1,10,66,94,108 4.42
Auricle colour 01. Pale green 113 1,2,3,4,5,6,7,8,9,10,11,12,13,14,15,16,17,18,19,20,21,22,23,24,25,26,27,28,29,30,31,32,33,34,35,36,37,38,39,40,41,42,43,44,45,46,47,48,49,50,51,52,53,54,55,56,57,58,59,60,61,62,63,64,65,66,67,68,69,70,71,72,73,74,75,76,77,78,79,80,81,82,83,84,85,86,87,88,89,90,91,92,93,94,95,96,97,98,99,100,101,102,103,104,105,106,107,108,109,110,111,112,113
Nil
Culm anthocyanin colour
01. Absent 110 1,2,3,4,5,6,7,8,9,10,11,12,13,14,15,16,17,18,19,21,22,23,24,25,26,27,28,29,30,31,32,33,34,35,36,37,38,39,40,41,42,43,44,45,46,47,48,49,51,52,53,54,55,56,57,58,59,60,61,62,63,64,65,67,68,69,70,71,72,73,74,75,76,77,78,79,80,81,82,83,84,85,87,88,89,90,91,92,93,94,95,96,97,98,99,100,101,102,103,104,105,106,107,109,110,111,112,113
96.46
09. Present 04 20,66,86,108 3.54
Culm Angle
01. Erect (<300) 33 2,3,5,7,12,21,22,27,35,36,40,41,43,44,46,47,48,52,53,57,60,61,62,63,64,65,66,72,92,99,102,103,105
29.21
03. Intermediate 68 4,6,8,9,10,11,13,14,15,16,17,19,20,23,24,25,26,29,30,31,32,33,34,37,38,39,42,45,49,51,54,55,56,58,59,68,69,70,71,73,74,77,78,79,80,81,82,84,85,86,87,88,89,90,91,93,94,95,96,97,98,100,101,104,106,108,110,112
60.18
05. Open 12 1,18,28,50,67,75,76,83,107,109,111,113 10.62
Internode colour
01. Green 89 4,5,6,7,8,9,10,11,12,13,14,15,16,17,18,19,21,22,23,24,25,26,27,28,29,30,31,32,33,34,35,36,37,38,39,40,41,42,43,44,45,46,47,48,49,50,51,52,53,54,55,56,57,58,59,60,61,62,63,64,65,68,69,70,71,72,73,74,79,80,81,83,84,86,87,90,92,93,94,95,96,98,99,100,101,102,103,106,113
78.76
02. Light gold 20 2,3,67,75,76,77,78,82,85,88,89,91,97,104,105,107,109,110,111,112
17.71
03. Purple lines 03 1,20,108 2.65
04. Purple 01 66 0.88
Culm 01. Strong 03 53,72,103 2.65

Agro-morphological Characterization of Bangladeshi Aromatic Rice 47
Table 2. Continued.
Character Classification Frequency Number of aromatic germplasm Frequency %
strength 03. Moderately strong
01 104 0.88
05. Intermediate 18 2,25,43,45,46,60,77,78,79,80,84,95,96,97,102,105,106,110 15.93
07. Weak 68 1,,3,4,5,6,7,8,9,10,11,13,14,15,16,17,19,20,24,26,27,28,29,30,41,47,52,54,56,58,59,61,63,64,65,66,67,68,69,71,73,74,75,76,81,82,83,85,86,87,88,89,90,91,92,93,94,98,99,100,101,107,108,109,111,112,113
60.18
09. Very weak 25 12,18,21,22,23,31,32,33,34,35,36,37,38,39,40,42,44,48,49,50,51,55,57,62,70
22.12
Panicle type
01. Compact 09 10,19,20,25,47,59,72,103,110 7.96
05. Intermediate 97 1,4,5,6,7,8,9,11,12,13,14,15,16,17,18,21,22,23,24,26,27,28,29,30,31,32,33,34,35,36,37,38,39,40,41,42,43,44,45,46,48,49,50,51,52,53,54,55,56,57,58,60,61,62,63,64,65,66,67,68,69,70,71,73,74,77,78,79,80,81,82,83,84,85,86,87,88,89,90,91,92,93,94,95,96,97,98,99,100,101,102,104,105,106,107,112,113
85.84
09. Open 07 2,3,75,76,108,109,111 6.19
Secondary branching
01. Light 68 1,2,3,6,7,8,9,10,12,13,14,15,17,18,21,22,23,25,26,28,29,37,38,39,40,41,43,44,45,48,49,50,51,52,53,54,55,57,59,60,61,62,63,64,66,67,70,71,72,76,77,79,81,86,89,90,91,101,103,104,106,108,109,110,111,112,113,114
59.29
02. Heavy 46 4,5,11,16,19,20,24,27,30,31,32,33,34,35,36,42, 46,47,56,58,65,68,69,73,74,75,78,80,82,83,84,85,87,88,92,93,94,95,96,97,98,99,100,102, 105,107
40.70
Panicle exsertion
01. Well exserted 107 1,2,3,4,5,7,8,9,10,11,12,13,14,15,16,17,18,19,20,21,22,23,24,25,26,27,29,30,31,32,33,34,35,36,37,38,39,40,41,42,43,44,45,46,47,48,49,50,51,52,54,55,56,57,58,59,60,61,64,65,67,68,69,70,71,72,73,74,75,76,77,78,79,80,81,82,83,84,85,86,87,88,89,90,91,92,93,94,95,96,97,98,99,100,101,102,103,104,105,106,107,108,109,110,111,112,113
94.69
03. Moderately well exserted
05 6,28,53,62,63 4.42
05. Just exserted 01 66 0.88
Spikelet: awns in the spikelet
01. Absent 78 1,2,4,5,6,7,11,12,14,15,16,17,19,20,21,23,25,26,27,28,32,33,36,37,39,40,42,43,45,46,50,51,53,55,56,57,58,62,63,64,65,68,69,72,73,74,75,76,77,78,79,80,82,84,85,86,87,92,93,94,95,96,97,98,99,100,101,102,103,104,105,106,107,108,109,110,111,112
69.03
09. Present 35 3,8,9,10,13,18,22,24,29,30,31,34,35,38,41,44,48,49,52,54,59,60,61,62,66,67,70,71,81,83,88,89,90,91,113
30.97
Spikelet: awn length
01. Very short (<2mm)
11 8,29,34,38,48,49,62,88,89,90,91 9.73
03. Short (2-5 mm) 02 41,43 1.77
05. Medium (5-10 mm)
07 3,30,35,44,54,70,81 6.19
07. Long (11-20 mm) 02 31,67 1.77
09. Very long (>20mm)
14 9,10,13,18,22,24,52,59,60,61,66,71,113 11.50
Distribution of awning
01. Tip only 17 3,8,29,30,34,35,38,41,44,48,49,62,70,81,88,89,90,91 15.04
03. Upper half only 06 13,24,31,54,67,83 5.30
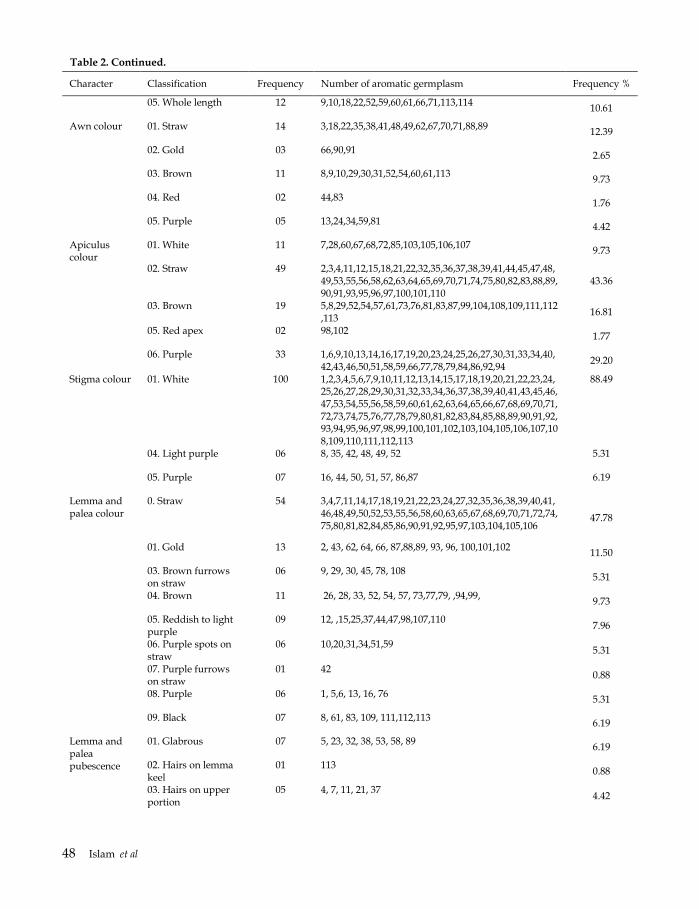
48 Islam et al
Table 2. Continued.
Character Classification Frequency Number of aromatic germplasm Frequency %
05. Whole length 12 9,10,18,22,52,59,60,61,66,71,113,114 10.61
Awn colour 01. Straw 14 3,18,22,35,38,41,48,49,62,67,70,71,88,89 12.39
02. Gold 03 66,90,91 2.65
03. Brown 11 8,9,10,29,30,31,52,54,60,61,113 9.73
04. Red 02 44,83 1.76
05. Purple 05 13,24,34,59,81 4.42
Apiculus colour
01. White 11 7,28,60,67,68,72,85,103,105,106,107 9.73
02. Straw 49 2,3,4,11,12,15,18,21,22,32,35,36,37,38,39,41,44,45,47,48,49,53,55,56,58,62,63,64,65,69,70,71,74,75,80,82,83,88,89,90,91,93,95,96,97,100,101,110
43.36
03. Brown 19 5,8,29,52,54,57,61,73,76,81,83,87,99,104,108,109,111,112,113
16.81
05. Red apex 02 98,102 1.77
06. Purple 33 1,6,9,10,13,14,16,17,19,20,23,24,25,26,27,30,31,33,34,40,42,43,46,50,51,58,59,66,77,78,79,84,86,92,94
29.20
Stigma colour 01. White 100 1,2,3,4,5,6,7,9,10,11,12,13,14,15,17,18,19,20,21,22,23,24,25,26,27,28,29,30,31,32,33,34,36,37,38,39,40,41,43,45,46,47,53,54,55,56,58,59,60,61,62,63,64,65,66,67,68,69,70,71,72,73,74,75,76,77,78,79,80,81,82,83,84,85,88,89,90,91,92,93,94,95,96,97,98,99,100,101,102,103,104,105,106,107,108,109,110,111,112,113
88.49
04. Light purple 06 8, 35, 42, 48, 49, 52 5.31
05. Purple 07 16, 44, 50, 51, 57, 86,87 6.19
Lemma and palea colour
0. Straw 54 3,4,7,11,14,17,18,19,21,22,23,24,27,32,35,36,38,39,40,41,46,48,49,50,52,53,55,56,58,60,63,65,67,68,69,70,71,72,74,75,80,81,82,84,85,86,90,91,92,95,97,103,104,105,106
47.78
01. Gold 13 2, 43, 62, 64, 66, 87,88,89, 93, 96, 100,101,102 11.50
03. Brown furrows on straw
06 9, 29, 30, 45, 78, 108 5.31
04. Brown 11 26, 28, 33, 52, 54, 57, 73,77,79, ,94,99, 9.73
05. Reddish to light purple
09 12, ,15,25,37,44,47,98,107,110 7.96
06. Purple spots on straw
06 10,20,31,34,51,59 5.31
07. Purple furrows on straw
01 42 0.88
08. Purple 06 1, 5,6, 13, 16, 76 5.31
09. Black 07 8, 61, 83, 109, 111,112,113 6.19
Lemma and palea pubescence
01. Glabrous 07 5, 23, 32, 38, 53, 58, 89 6.19
02. Hairs on lemma keel
01 113 0.88
03. Hairs on upper portion
05 4, 7, 11, 21, 37 4.42

Agro-morphological Characterization of Bangladeshi Aromatic Rice 49
Table 2. Continued.
Character Classification Frequency Number of aromatic germplasm Frequency %
04. Short hairs 75 1,2,3,6,8,9,13,14,15,16,17,18,19,20,22,24,25,26,27,28,29,30,31,33,34,35,36,39,10,41,42,44,46,47,48,49,50,51,52,54,55,56,65,66,68,69,70,72,74,75,77,78,79,80,81,82,83,84,85,86,87,88,92,93,95,97,100,101,102,103,104,105,106,107, 110
66.37
05. Long hairs 25 10,12, 43, 45, 57, 59, 60,61,62,63,64, 67, 71,73,76,90,91, 94, 96, 98,99, 108,109, 111,112
22.12
Seed coat (bran) colour
01. White 79 2,3,7,9,10,11,14,17,18,19,20,21,22,23,24,25,26,30,31,32,33,34,35,36,37,38,39,40,41,42,43,44,46,47,48,49,50,53,55,56,57,58,59,60,61,62,63,64,65,66,67,68,69,70,71,72,75,80,82,84,85,86,87,88,89,91,92,93,94,96,97,98,101,103,105,106,107, 110, 113
69.91
02. Light brown 32 1, 4,5,6, 8, 12,13, 15,16, 27, 29, 45, 51,52, 54, 73,74, 76,77,78,79, 81, 83, 90, 95, 99,100, 102, 104, 109, 111,112 28.31
05. Red 02 28,108 1.76
Leaf senescence
01. Late and slow 03 45, 50, 61 2.65
05. Intermediate 13 9,10, 14, 43, 55, 58, 60, 62,63, 72, 80, 103, 113 11.50
09. Early and fast 97 1,2,3,4,5,6,7,8,11,12,13,15,16,17,18,19,20,21,22,23,24,25,26,27,28,29,30,31,32,33,34,35,36,37,38,39,40,41,42,44,46,47,48,49,51,52,53,54,56,57,59,64,65,66,67,68,69,70,71,73,74,75,76,77,78,79,81,82,83,84,85,86,87,88,89,90,91,92,93,94,95,96,97,98,99,100,101,102,104,105,106,107,108,109,110,111,112
85.84
Decorticated grain: Scent (aroma)
0. Non scented 12 28,29, 45, 50, 53, 56, 64, 66, 81, 82, 86, 88 10.62
01. Lighty scented 35 1,2,3,6,7,23,24,25,27,37,38,43,67,72,83,84,87,89,90,91,92,93,94,95,96,97,98,99,100,102,103,104,105, 107, 110 30.97
02. Scented 66 4,5,8,9,10,11,12,13,14,15,16,17,18,19,20,21,22,26,30,31,32,33,34,35,36,39,40,41,42,44,46,47,48,49,51,52,54,55,57,58,59,60,61,62,63,65,68,69,70,71,73,74,75,76,77,78,79,80, 85, 101, 106, 108,109, 111,112,113
58.41
Sugandhi dhan, Jirabuti, Elai, Dhan chikon,
Malshira and Sakor were clustered in indivisul
group I, II, V,VII, VIII and sub-cluster IXa, IXb
and X respectively. The germplasm like as
Jirabuti, Khazar, Thakurbhog, Khuti Chikon
and Bashful had special qualitative traits such
as anthocyanin colour of leaf sheath. On the
other hand, Jirabuti, Khazar, Thakurbhog and
Bashful had anthocyanin colour of culm nodes
except Khuti chikon. Cluster IX, sub-clusters
IXa, IXb, IXc and IXd were sub-grouped
according to their special distinctive
qualitative traits and germplasm in the
different sub-clusters were closely distant to
each other. In general, most of the germplasm
fall in fourth major sub-cluster IXd contained
96 aromatic rice germplasm. Basal leaf sheath
colour, leaf angle, flag leaf angle, clum angle,
culm strength, panicle type and leaf
senescence of these 96 germplasm were very
close. Therefore, all closely related germplasm
were found in same sub-cluster IXd. Parikh et

50 Islam et al
al. (2012) also found that majority of the
germplasm to possess green basal leaf sheath
colour (84.5%), green leaf blade colour (86.8%),
green collar colour (97.3%), white ligule colour
(94.7%), light green auricle colour (97.3%),
white apiculus colour (53.9%), white stigma
colour (94.7%) and awnless (72.3%) in 71
aromatic rice germplasm. Moreover, most of
the cultivated aromatic rice genotypes are
photosensitive and taller types having yield
potentiality of 2-3 t ha-1 and grown during T.
Aman season in the rainfed low land
ecosystem in Bangladesh (Islam et al., 2016).
The two germplasm namely Dhan chikon and
Malshira were found in sub-cluster IXa and
IXb respectively. Ranisalut, Gandhakusturi,
Thakurbhog were found in sub-cluster IXc.
Interestingly, BRRI dhan50 and BU dhan2R,
which have similiar plant type, yield and grain
characters, placed in the same cluster III.
Among the other cluster, Sakor, a slight
aromatic rice germplasm grown mainly in
Mymensingh region and with no relation to
the other germplasm, formed a single cluster.
A study conducted by Bisne and Sarawgi
(2008) to characterize 32 aromatic rice
accessions of Badshahbhog group from Indira
Gandhi Krishi Vishwavidyalaya (IGKV),
Raipur, Chhattisgarh, germplasm, found the
highest variation among accessions for the
traits leaf blade colour, lemma and palea
colour, apiculus colour, and lemma and palea
pubescence.
Moreover, aroma evaluation revealed
that 67 germplasm were scented, 34 were
lightly scented, while the rest 12 germplasm
were non-scented (Table 4). For example, local
variety including aromatic rice germplasm
occupied about 12.16% of the rice growing
area in Bangladesh (Islam et al., 2016). Among
the aromatic rice germplasm, Chinigura is the
predominant one that covers more than 70%
farms in the northern districts of Naogaon and
Dinajpur. In these districts, 30% of rice lands
were covered by aromatic rice varieties during
Aman season. The other important aromatic
rice varieties are Kalijira (predominant in
Mymensingh) and Kataribhog (predominant
in Dinajpur) (Baqui et al., 1997).
Principal co-ordinate analysis (PCoA)
The three dimensional (3D) graphical views of
principal co-ordinate analysis (PCA) showed
the spatial distribution of the germplasm. The
germplasm namely Bashful, Khazar, Jirabuti,
Sakor, Kutichikon, Thakurbhog-2, Black TAPL-
554, Kalgochi and Buchi were found to be
distance from the centroid (Fig. 3) while the
rest were close to the centroid. The results
indicated that the germplasm that were placed
far away from the centroid were more
genetically diverse, while the genotypes that
were placed near the centroid possessed more
or less similar genetic background. Similar
findings were also reported by other authors
(Siddique et al., 2016a, 2016b). However,
centroid may be defined as the vector
representing the middle point of the cluster
which contained at least one number for each
variable. The connecting lines between each
germplasm and the centroid represented
eigenvectors for the respective germplasm.

Agro-morphological Characterization of Bangladeshi Aromatic Rice 51

52 Islam et al
Table 3. Cluster distribution of 113 aromatic germplasm based on 28 qualitative traits.
Cluster No. of germplasm Name of germplasm
I 1 Bashful II 1 Khazar
III 2 BRRI Dhan50, BU dhan2R
IV 2 Kalgochi ,Buchi
V 1 Sugandhi dhan
VI 2 Thakurbhog-2, Khuti chikon
VII 1 Jirabuti
VIII 1 Elai
IXa 1 Dhan chikon
IXb 1 Malshira
IXc 3 Ranisalut, Gandhakusturi, Thakurbhog
IXd 96 Sagardana, Nunia, Chini Sagar (2), Meny, Tilkapur, Binnaphul, Kalobhog, Jabsiri, Chinisakkor, Chiniatob, Noyonmoni, Saubail, Chinniguri, Kalomala, Begunmala, Gopalbhog, Tulsimoni, Khirshabuti, Rajbut, Soru kamina, Kamini soru, Doiarguru, Premful, Begun bitchi, Gua masuri, Luina, Lal Soru, Chini Kanai, Kalijira (short grain), Rajbhog, Philliphine kataribhog, Baoibhog, Baoijhaki, Jirabhog (Bolder),
Chinigura, Tulsimala, Bashmati 370, Uknimodhu, Jira dhan, Sakkorkhora, Badshabhog, Jirakatari, Desikatari, Tulsimaloty, Raduni pagal, Kalijira (long grain), Jesso balam TAPL-25, Dakshahi, Hatisail TAPL-101, Khasa, Awned TAPL-545, Black TAPL-554, Straw TAPL-554, Dubsail, Duksail, Khaskani, Basmati sufaid 106, BR5, BRRI dhan34, BRRI dhan37, BRRI dhan38, Khasa Mukpura, Uknimodhu, Bawaibhog-2, Chiniatob-2, Tilokkachari, Begunbitchi-2, Chinairri, Bhatir cikon, Gordoi, Dolagocha, Kalonunia, Badshabhog-2, Sunduri samba, Basmati, Basmati 37, Basnatu sufaid 187, Tulsimala-2, Chinisail, Sadagura, Modhumadab, Parbatjira, Chinikanai-2, Meedhan, Gobindhabhog, Kataribhog, Fulkari, Padmabhog, Dudsail, Sakkorkhana, Maloti, KalijiraTAPL-64, OvalTAPL-2990, KalijiraTAPL-68, KalijiraTAPL-74, Kalobakri
X 1 Sakor
Table 4. Classification of aromatic germplasm based on sensory test.
Decorticated grain: scent aroma
Number of germplasm
Name of germplasm
Non scented 12 Elai, Gua masuri, Gandha kusturi, Thakurbhog, Sugandhi dhan, Dakshahi, Duksail, Khazar, Gordoi, Dolagocha, Thakurbhog-2, Sunduri samba
Light scented 34 Sakor, Sagardana, Nunia, Tilkapur, Binaphul, Soru Kamina, Kamini soru, Doiarguru, Begun bichi, Baoi jhaki, Jirabhog (Bolder), Ranisaluit, Basmati sufaid- 106, BRRI dhan50, Kalonunia, Dhan chikon, Khuti chikon, Basmati- 37, Basnatu sufaid-187, Tulsimala-2, Chinisail, Malshira, Sadagura, Modhumadab, Parbatjira, Chinikanai-2, Meedhan, Gobindhabhog, Fulkari, BU Dhan2R, Padmabhog, Dudsail, Maloti, OvalTAPL-2990
Scented 67
Chini Sagar (2), Meny, Kalobhog, Jabsiri, Kalgochi, Chinisakkor, Chini atob, Noyonmoni, Saubail, Kolomala, Chinniguri, Begunmala, Gopalbhog, Tulsimoni, Jirabuti, Khirshaboti, Rajbut, Premful, Luina, Lal Soru, Chini kanai, Kalijira (short grain), Rajbhog, Phillipine kataribhog, Baoibhog, Chinigura, Tulsimala, Bashmati 370, Uknimodhu, Jira dhan, Sakkor khora, Badshabhog, Jirakatari, Desi katari, Tulsimaloty, Radhuni pagal, Kalijira (long grain), Jesso balam, Hatisail, Khasa, Buchi, AwnedTAPL-545, BlackTAPL-554, StrawTAPL-500, Dubsail, Khaskani, BR5, BRRI dhan34, BRRI dhan37, BRRI dhan38, Khasa Mukpura, Uknimodhu, Bawaibhog-2, Chiniatob-2, Tilokkachari, Begunbichi-2, Chinairri, Bhatir cikon, Badshabhog-2, Basmati, Kataribhog, Sakkorkhana, Bashful, KalijiraTAPL-64, Oval TAPL-2990, Kalijira TAPL68, Kalijira TAPL74, Kalobakri

Agro-morphological Characterization of Bangladeshi Aromatic Rice 53
Fig. 3. There-dimensional view of principal co-ordinate analysis (PCoA) of 113 aromatic germplasm with 28 qualitative traits.
CONCLUSIONS Traditional aromatic rice germplasm, which is
highly chosen by consumers needs to be
characterized that can help in varietal
development purpose and their conservation
(Islam et al., 2018b). No duplicates were
identified among the studied germplasm for
qualitative traits in the cluster analysis. Aroma
is an important trait, has high demand in the
global market. The evaluation of aroma
showed that 67 germplasm were scented, 34
were lightly scented and 12 were non-scented
type. The principal co-ordinate analysis
(PCoA) showed the germplasm namely
Bashful, Khazar, Jirabuti, Sakor, Kutichikon,
Thakurbhog-2, Black TAPL-554 and Kalgochi
were found to be the distance from the
centroid and they were more genetically
diverse. For lemma-palea colour, nine different
types were detected while for apiculus colour
of grain, six different types were recorded and
colour of awn, six different types were
observed, suggesting the presence of exclusive
variability and unique feature of the
traditional short grain aromatic rice
germplasm in Bangladesh. Finally, it can be
concluded that molecular characterizations of
the studied germplasm are required for QTL
mapping and validating the presence of
candidate genes responsible for valuable
characters.
ACKNOWLEDGEMENTS The authors are highly grateful to the
collaborative research project between the
Bangladesh Rice Research Institute (BRRI) and
the Bangabandhu Sheikh Mujibur Rahman
Agricultural University (BSMRAU) entitled
„„Genetic enhancement of local rice germplasm
towards aromatic hybrid rice variety
development in Bangladesh‟‟ (2010–2014)
funded by the NATP: Phase I of PIU,
Bangladesh Agricultural Research Council
(BARC) for providing all necessary supports.
We also acknowledge Dr Khandakar Md
Iftekharuddaula, PSO, Plant Breeding
Division, BRRI for assisting in statistical
analysis.
113
112
111
110
109
108
107106
105104
103
102
1011009998
979695949392
919089
88
87
86
85
84
83
82
81
80
797877
7675
7473
72
71
70
6968
67
6665
6463
62
61
60
5958
57
56
55
54
53
52
51
50
4948
4746
45
44
43
4241
4039
38
37
3635
34
3332
31
30
29
2827
26
25
24
23
22
21
20
19
18
17
1615
14
13
12
11
10
98
7
654
3
2
1
1.291.29
0.870.87
0.460.46Dim-2Dim-2
0.040.04
-0.37-0.37-2.01-2.01
-0.43-0.43
-1.39-1.39
0.250.25
Dim-3Dim-3-0.77-0.77
Dim-1Dim-1
0.930.93
-0.15-0.15
1.611.61
0.470.47
2.292.29
54 Islam et al
REFERENCES
Ahmed, M S, M K Bashar and A K M Shamsuddin. 2016. Study of qualitative characters of balam rice (Oryza sativa L.) landraces of Bangladesh. Rice Genom. and Genet. 7(1): 1-8.
Ahmed, M S, M Khalequzzaman, M K Bashar. A K M Shamsuddin. 2015. Qualitative agro-morphological character diversity of similar or duplicate named rice (Oryza sativa L.) germplasm of Bangladesh. J. Bio. and Env. Sci. 7 (4): p. 51-61.
Akter, N, H Begum, M Z Islam, M A Siddique and M Khalequzzaman. 2018. Genetic diversity in Aus rice (Oryza Sativa L.) genotypes of Bangladesh. Bangladesh J. Agril. Res. 43(2): 253-266.
Akter, N, M Z Islam, A Bhuiya, M A Siddique and M Khalequzzaman. 2017. Distinctness of 45 irrigated rice (Oryza sativa L.) landraces of Bangladesh through agro-morphological traits. Eco-friendly Agril. J. 10 (10): 100-107.
Bisne, R and A K Sarawgi. 2008. Agro-morphological and quality characterization of Badshahbhog group from aromatic rice germplasm of Chhattisgarh. Bangladesh J. Agril. Res. 33: 479-492.
Bradbury, L M T, S A Gillies, D J Brushett, D L E Waters and R J Henry. 2008. Inactivation of an aminoaldehyde dehydrogenase is responsible for fragrance in rice. Plant Mol. Biol. 68: 439–449.
Bradbury, L M T, T L Fitzgerald, R J Henry, Q Jin and D L E Waters. 2005. The gene for fragrance in rice. Plant Biotech. J. 3:363–370.
Baqui, M A, M E Ham, D Jones, and R Straingfellow. 1997. The export potential of traditional varieties of rice from Bangladesh. Bangladesh Rice Research Institute, Gazipur, Bangladesh.
Glaszmann, J C. 1987. Isozymes and classification of Asian rice varieties. Ther. App. Sci. 74:21–30.
Hossain, M Z. 2008. Genetic diversity for morpho-physicochemical characters and microsatellite DNA markers in fine grain and aromatic landraces of rice (Oryza sativa L.). PhD Thesis. Department o f Genetics and Plant Breeding. Bangabandhu Sheikh Mujibur Rahman Agricultural University, Gazipur 1706, Bangladesh. pp.110.
Islam, M Z, M Khalequzzaman, M A Siddique, N Akter, M S Ahmed and M A Z Chowdhury. 2017. Phenotypic characterization of Jhum rice (Oryza sativa L.) landraces collected from Rangamati district in Bangladesh. Bangladesh Rice J. 21 (1): 47-57.
Islam, M Z, M Khalequzzaman, M K Bashar, N A Ivy, M M Haque and M A K Mian. 2016. Variability assessment of aromatic and fine rice germplasm in Bangladesh based on quantitative traits. The Sci. World J. Vol. 2016, Article ID 2796720, http://dx.doi.org/10.1155/2016/2796720.
Islam, M Z, N Akter, T Chakrabarty, A Bhuiya, M A Siddique and M Khalequzzaman. 2018a. Agro-morphological characterization and genetic diversity of similar named aromatic rice (Oryza sativa L.)
landraces of Bangladesh. Bangladesh Rice J. 22 (1): 45-56.
Islam, M Z , M Khalequzzaman, M K Bashar, N A Ivy, M A K Mian, B R Pittendrigh, M M Haque and M P Ali. 2018b. Variability assessment of aromatic rice germplasm by pheno-genomic traits and population structure analysis. Sci. Reports. 8: 9911, DOI:10.1038/s41598-018-28001-z
Islam, M Z, S Banik, M A Haque, M A Siddiquee, M Khalequzzaman and M A K Mian. 2013. Physico-chemical and cooking properties of local aromatic rice germplasm in Bangladesh. Eco-Friendly Agril. J. 6 (10): 243–248.
Mau, Y S, J E R Markus, S S Oematan, A S S Ndiwa, D D Handoko, A Nasution and K Makbul. 2017. Genetic diversity of red and black upland rice accessions from East Nusa Tenggara, Indonesia as revealed by agro morphological characters. Bio-diversitas. 18 (1):197-211.
Morishima, H. 1984. Wild plant and demonstration. In: Biology of Rice (S. Tsunoda and N. Takahashi, Eds.). Japan Sci. Soc. Press, Tokyo. pp. 3-30.
Nascimento, W F, E F Silva and E A Veasey. 2011. Agro-morphological characterization of upland rice accessions. Sci. Agric. 68(6): 652-60.
Parikh M., Motiramani N.K., Rastogi N.K., and Sharma B., 2012, Agro-morphological characterization and assessment of variability in aromatic rice germplasm, Bangladesh J. Agril. Res., 37(1): 1-8, http://dx.doi.org/10.3329/bjar.v37i1.11168
Rohlf, F. 2002. NTSYS-pc: Numerical taxonomy and multivariate analysis system. 2.2 edn. Department of Ecology and Evaluation, State university of NY, Stony Brook.
Shahidullah, S M, M M Hanafi, M Ashrafuzzaman, M R Ismail and A Khair. 2009. Genetic diversity in grain quality and nutrition of aromatic rices. African J. Biotech. 8 (7): 1238-1246.
Siddique, M A, M Khalequzzaman M M Islam, Kaniz Fatema and M A Latif. 2016a. Molecular characterization and genetic diversity in geographical indication (GI) rice (Oryza sativa L.) cultivars of Bangladesh. Braz. J. Bot. DOI 10.1007/s40415-016-0271-1
Siddique, M A, M Khalequzzaman, K Fatema, M Z Islam, M M Islam and M A Z Chowdhury. 2016b. Molecular characterization and genetic diversity of Aman rice (Oryza sativa L.) landraces in Bangladesh. Bangladesh Rice J. 20 (2): 1-1.
Singh, R K, U S Singh and G. S. Khush. 2000. Aromatic rices. Oxford and IBH Publishing Co, New Delhi, India. p. 292.
Sneath, P H and Sokal. 1973. Numerical taxonomy: The principles and practice of numerical classification. Freeman WH and Company, Sanfrancisco. USA
Sood, B C and E A Siddiq. 1978. A rapid technique for scent determination in rice. Indian J. Genet. and Plant Breed. 38: 268-271.

Bangladesh Rice J. 22 (2) : 55-62, 2018, doi.org/10.3329/brj.v22i2.44042
1Senior Scientific Officer and 3Principal Scientific Officer, Training Division, BRRI, 2Senior Scientific Officer, Plant Pathology Division, BRRI, Gazipur 1701 and 4Professor, Department of Plant Pathology, Faculty of Agriculture, BAU, Mymensingh. * Corresponding author’s E-mail: [email protected]
Effect of Planting Time on Sheath Blight Disease of Rice in Bangladesh
S Parveen1*, M R Bhuiwan2, M A I Khan3 and M A Ali4
ABSTRACT
Sheath blight (ShB) caused by Rhizoctonia solani is one of the major disease of rice (Oryza sativa L.) in Bangladesh. Effect of planting time on ShB disease of BRRI dhan49 was observed at the experimental plots of Bangladesh Rice Research Institute, Gazipur. Two field experiments were conducted to develop management strategy for controlling ShB during T. Aman 2010-11 seasons. Four planting dates viz. 15 July, 30 July, 15 August and 30 August were imposed to record the effect of planting time on incidence and severity of ShB disease on BRRI dhan49. Significant differences on the Relative Lesion Height (RLH) among the treatments were observed during both 2010 and 2011 seasons. For both the seasons, the highest RLH was recorded in plots transplanted on 15 August (62.1% in 2010 and 61.2% in 2011) because of the remaining high temperature, rainfall and humidity and the lowest in plots transplanted on 30 July (19.4% for both). Similarly, the maximum severity score was recorded in 15 August transplanting (7) and the minimum in 30 July (1) respectively. Percent disease index (PDI) was also varied significantly among the treatments for both the seasons. During both the years, the maximum PDI was recorded in 15 August (76.5 and 75.2% respectively) and the minimum in 30 July transplanting (20.4 and 20.1 respectively). However, the highest number of filled grains panicle-1 was counted in 30 July (151), followed by15 July transplanting (145) during 2010. But, it was the highest in 30 July (141), followed by 15 August transplanting (136) during 2011. Again for both the seasons, the lowest filled grains panicle-1 was recorded in 30 August transplanting (116 and 127). Similarly for both the years, the maximum grain yield was observed in 30 July (6.29 and 5.82 t ha-1 respectively), followed by 15 July (5.67 and 5.17 t ha-1) and the lowest in 30 August transplanting (3.80 and 4.27 t ha-1 respectively). However, 1000 grain weight was 20 g in each date of transplanting during both the seasons. Finally, Integrated Disease Management (IDM) packages need to be developed by using appropriate planting time, cultural practices and fungicides to control ShB disease of rice. Key words: Planting time, sheath blight incidence, rice
INTRODUCTION Sheath blight (ShB) disease of rice, caused by Rhizoctonia solani Kuhn is a destructive disease worldwide (Nagarajkumar et al., 2004). The pathogen has a wide host range and can infect plants belonging to more than 32 families and 188 genera (Gangopadyay and Chakrabarti, 1982). In Bangladesh, ten rice diseases are considering as major (Miah and Shahjahan, 1987) and ShB is one of them. ShB infected 20.8% of the plant populations with an estimated yield loss even up to 50% (Anonymous, 2006). It is prevalent in almost all rice growing areas and seasons of
Bangladesh, but the highest intensity was found in transplanted Aus, followed by T. Aman and Boro seasons (Anonymous, 2018). Therefore, for sustainable rice production, minimizing both the ShB epidemics and its yearly crop losses are essential in Bangladesh. Development of ShB disease depends on climatic factors, host and soil components (Damicone et al., 1993). Temperature and relative humidity (Leano, 1993), soil, inoculum of Rhizoctonia solani (Lakpale et al., 1994), plant density (Dilla, 1993) and physiologic condition of rice plants (Hashiba et al., 1977) are important for the development of ShB disease of rice.

56 Parveen et al
The peak stage of ShB disease is during
flowering when the rice canopy is most dense,
forming a microclimate favourable to
pathogen growth and spread (Brooks, 2007).
ShB infection during flowering or heading
stage causes a reduction of total seed weight
due to lower number of filled grains and
consequently lower yield (Nagarajkumar et al.,
2004). Other factors for ShB disease severity
are the growth stage at infection, cultivar
resistance and cultural practices (Groth et al.,
1992). Both seedling and adult plants are
equally affected by ShB, but losses are
significantly higher in seedling stage.
However, the disease severity and yield loss is
higher during booting stage as compared to
tillering, maximum tillering or panicle
initiation stage. Besides, Wu et al., (2012)
reported that lodging alters the normal rice
canopy design, affecting photosynthetic ability
and total biomass production and causes
epidemics.
Temperature and humidity are the two
main factors for ShB disease development. Due
to global warming, air temperature is
increasing day by day, which is also
favourable for rapid ShB disease development.
Depending on plant age, time of infection and
severity, it causes yield loss of 5.9 to 69%
(Naidu, 1992). Under favourable conditions,
yield losses due to ShB disease range from 4 to
50% (Groth et al., 1991; Marchetti and Bollich,
1991). But, the average incidence of ShB in
Bangladesh is about 20.3% (Ali et al., 2003) and
may ranges from 14 to 31% under farmer's
field condition (Shahjahan et al., 1986).
The control of ShB disease is depended
mainly on fungicides by the farmers. But, it is
not considered sustainable due to its toxic
residual effects, potential risk of emergence of
races of the pathogen overtime and different
environmental hazards. Ashrafuzzaman et al.
(2005) also emphasized on different
management options to control ShB disease.
Therefore, there is an ample scope to use
different cultural practices for managing ShB.
The optimum planting time is one of the
important options, because, ShB disease
development can be avoided in optimum
planting time, as comparing to the late
transplanting, particularly in Boro season
(Hossain and Mia, 2001). Therefore,
considering the above facts, the present study
was designed to determine the optimum
planting time of rice for managing the ShB
disease of rice with the aim of recommending
IDM strategy for rice field in Bangladesh.
MATERIALS AND METHODS
Field experiment, design and treatment. Two
experiments were conducted at BRRI
experiment field in Gazipur under artificial
inoculation condition during T. Aman 2010-11
seasons. A levee was made surrounding the
plots to maintain standing water up to 5.0 cm
inside. Land was prepared 15 days before
transplanting. Ploughing and cross ploughing
followed by laddering was done by power
tiller. Weeds were cleaned manually. Thirty-
day-old and 2-3 seedlings per hill of BRRI
dhan49 were transplanted with 20 cm × 15 cm
spacing. The experiment was laid in RCBD
with four replications. The individual plot size
was 2.0 × 2.0 m2. Each plot was separated from
the other by a two-hill-wide border. The blocks
were separated by a 0.5 m path including a
levee. Fertilizers were applied @ 405: 150: 202:
135: 10 g decimal-1 of urea, TSP, MOP, gypsum
and zinc sulphate respectively. All fertilizers
were applied in basal, except urea. For
agronomic practices such as weed, irrigation,
drainage and insect management current
standard recommendations were followed
(Anonymous, 2010). Four transplanting dates
were evaluated as treatments: T1= 15 July, T2=
30 July, T3= 15 August and T4= 30 August.

Effect of Planting Time on Sheath Blight Disease of Rice 57
Preparation of inoculum. One hundred
PDA plates in glass petridishes were prepared
following the standard procedure. The fungus
(Rhizoctonia solani) was grown in the
petridishes containing PDA medium and
incubated for seven days at room temperature
(25 to 30°C) for growth and development of
the pathogen.
Inoculation of pathogen. Inoculations
were done at maximum tillering stage
(Bhaktavatsalam et al., 1978). The plants were
inoculated with Rhizoctonia solani culture (7
days) grown on PDA medium. Prior to
inoculation, eight hills were tagged randomly
in the central area of each plot. Inoculation was
done by inserting a piece of culture medium
(cutting the culture medium into eight pieces)
at the middle of each hill in the afternoon,
colonized by the ShB pathogen in a tagged rice
hill and maintained standing water onward of
the crop growth to maintain high moisture
below canopy level for disease development
(Sharma and Teng, 1990).
Data collection. Disease data were
collected at the hard dough stage. Twenty-five
hills were selected at random from each
experimental unit. Number of infected tillers
and hills were counted. Incidence was
recorded by tiller infection and expressed in
percentage, while severity by relative lesion
height (RLH) and percent disease index (PDI)
(McKinney, 1923). Standard Evaluation System
(SES) for rice (IRRI, 2002) was used for
calculation of PDI. Data were recorded for
each treatment following SES for rice in 0-9
scale (Table 1).
Data on total tiller, infected tiller, plant
height, panicles m-2, filled grain, unfilled grain,
1000 grain weight and grain yield were
recorded. Grain yield was expressed in t ha-1.
Table 1. Standard Evaluation System for ShB disease of rice.
SCALE (based on relative lesion height)
0 No infection observed
1 Lesions limited to lower 20% of the plant height
3 20-30%
5 31-45%
7 46-65%
9 More than 65%
Note: The relative lesion height is the average vertical height of the uppermost lesion on leaf or sheath expressed as a percentage of the average plant height.
Lesion height (cm)
RLH = -------------------------- × 100 Plant height (cm)
Total rating
PDI = -------------------------------------------- × 100 No. of observation × Maximum grade
Statistical analysis. The data were subjected to statistical analysis and ANOVA (analysis of variance) was constructed by SPSS 2.05 programme. Microsoft Excel 2010 was used for data management. The treatment means were compared by LSD test at probability level P=0.05.
Weather data. The maximum and minimum air temperature, relative humidity and rainfall data from 2010 to 2011 were collected from meteorological station at BRRI, Gazipur. RESULT AND DISCUSSION Effect of planting time on ShB disease
incidence and severity. Table 2 shows the effect of planting time on the development of ShB disease of rice during T. Aman 2010. Significant differences on the RLH among the transplanting dates were observed. The highest RLH was recorded in plots transplanted on 15 August (62.1%) and the lowest was in plots transplanted on 30 July (19.4). However, the RLH was 22.80% in 15 July and 44.9% in 30 August transplanting. The difference in RLH between 15 July and 30 July
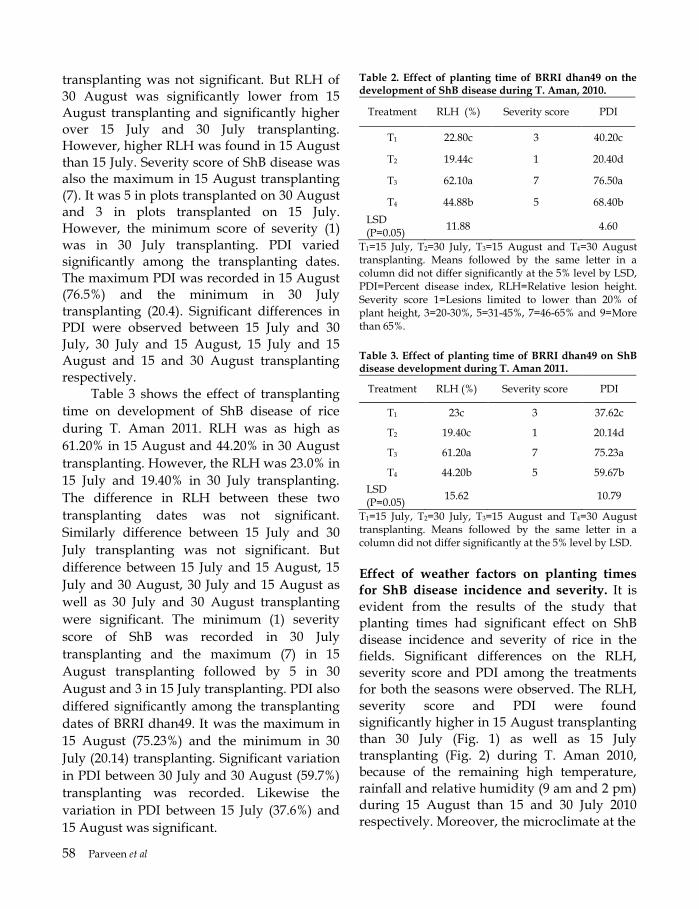
58 Parveen et al
transplanting was not significant. But RLH of 30 August was significantly lower from 15 August transplanting and significantly higher over 15 July and 30 July transplanting. However, higher RLH was found in 15 August than 15 July. Severity score of ShB disease was also the maximum in 15 August transplanting (7). It was 5 in plots transplanted on 30 August and 3 in plots transplanted on 15 July. However, the minimum score of severity (1) was in 30 July transplanting. PDI varied significantly among the transplanting dates. The maximum PDI was recorded in 15 August (76.5%) and the minimum in 30 July transplanting (20.4). Significant differences in PDI were observed between 15 July and 30 July, 30 July and 15 August, 15 July and 15 August and 15 and 30 August transplanting respectively.
Table 3 shows the effect of transplanting
time on development of ShB disease of rice
during T. Aman 2011. RLH was as high as
61.20% in 15 August and 44.20% in 30 August
transplanting. However, the RLH was 23.0% in
15 July and 19.40% in 30 July transplanting.
The difference in RLH between these two
transplanting dates was not significant.
Similarly difference between 15 July and 30
July transplanting was not significant. But
difference between 15 July and 15 August, 15
July and 30 August, 30 July and 15 August as
well as 30 July and 30 August transplanting
were significant. The minimum (1) severity
score of ShB was recorded in 30 July
transplanting and the maximum (7) in 15
August transplanting followed by 5 in 30
August and 3 in 15 July transplanting. PDI also
differed significantly among the transplanting
dates of BRRI dhan49. It was the maximum in
15 August (75.23%) and the minimum in 30
July (20.14) transplanting. Significant variation
in PDI between 30 July and 30 August (59.7%)
transplanting was recorded. Likewise the
variation in PDI between 15 July (37.6%) and
15 August was significant.
Table 2. Effect of planting time of BRRI dhan49 on the development of ShB disease during T. Aman, 2010.
Treatment RLH (%) Severity score PDI
T1 22.80c 3 40.20c
T2 19.44c 1 20.40d
T3 62.10a 7 76.50a
T4 44.88b 5 68.40b
LSD (P=0.05)
11.88 4.60
T1=15 July, T2=30 July, T3=15 August and T4=30 August transplanting. Means followed by the same letter in a column did not differ significantly at the 5% level by LSD, PDI=Percent disease index, RLH=Relative lesion height. Severity score 1=Lesions limited to lower than 20% of plant height, 3=20-30%, 5=31-45%, 7=46-65% and 9=More than 65%.
Table 3. Effect of planting time of BRRI dhan49 on ShB disease development during T. Aman 2011.
Treatment RLH (%) Severity score PDI
T1 23c 3 37.62c
T2 19.40c 1 20.14d
T3 61.20a 7 75.23a
T4 44.20b 5 59.67b
LSD (P=0.05)
15.62 10.79
T1=15 July, T2=30 July, T3=15 August and T4=30 August transplanting. Means followed by the same letter in a column did not differ significantly at the 5% level by LSD.
Effect of weather factors on planting times for ShB disease incidence and severity. It is evident from the results of the study that planting times had significant effect on ShB disease incidence and severity of rice in the fields. Significant differences on the RLH, severity score and PDI among the treatments for both the seasons were observed. The RLH, severity score and PDI were found significantly higher in 15 August transplanting than 30 July (Fig. 1) as well as 15 July transplanting (Fig. 2) during T. Aman 2010, because of the remaining high temperature, rainfall and relative humidity (9 am and 2 pm) during 15 August than 15 and 30 July 2010 respectively. Moreover, the microclimate at the

Effect of Planting Time on Sheath Blight Disease of Rice 59
Fig. 1. Temperature, rainfall and relative humidity during
30 July and 15 August 2010.
Fig. 2. Temperature, rainfall and relative humidity during
15 July and 15 August 2010.
maximum tillering stage of BRRI dhan49 became more favourable in the season due to 15 August transplanting in Bangladesh. Kozaka (1975) narrated similar observations in Japan for epidemic development of ShB. Similarly, Ui et al. (1976) observed that the RLH became higher under the favourable microclimate within the canopy of the rice hills.
Similarly, the RLH, severity score and
PDI were also found significantly higher in 15
August transplanting than 30 July (Fig. 3) as
well as 15 July transplanting (Fig. 4) during T.
Aman 2011, due to higher temperature, rainfall
and relative humidity (9 am and 2 pm) during
15 August than 15 and 30 July 2011
respectively.
Effect of planting time on yield components.
Table 4 shows that planting time had
significant effect on the yield and yield
components of BRRI dhan49. Number of
panicles m-2 was the highest (268) in 30 August
transplanting and was statistically similar to 30
July (263) and 15 July (257) transplanting.
However, panicles m-2 was significantly lower
(244) in 15 August transplanting. Number of
panicles m-2 in 15 July transplanting was
statistically similar to 30 July transplanting.
The highest number of filled grains panicle-1
(151) was counted in 30 July, followed by 15
July transplanting (145) grains panicle-1. The
lowest number of filled grains panicle-1 (116)
was recorded in 30 August transplanting.
However, it was 127 in 15 August and was
significantly differed from that of 30 August
transplanting (116). The maximum number of
unfilled grains (74) was counted from a panicle
in 30 August transplanting and the minimum
in 30 July transplanting (39). However, it was
63 in 15 August and 45 in 15 July
transplanting. The number of unfilled grains in
plots transplanted on 15 July did not differ
from that of 30 July, but the number of unfilled
grains in 30 July and 15 August transplanting
varied significantly between 15 August and 30
August transplanting. Grain yield was the
maximum (6.29 t ha-1) in 30 July and it was
5.67 t ha-1 in 15 July transplanting. The
difference in grain yield between 15 July and
30 July transplanting was significant.
However, the difference in grain yield between
15 August (4.17 t ha-1) and 30 August (3.80)
was insignificant. But, grain yield of 15 August
transplanting was significantly lower than that
of 15 July transplanting. Shahjahan et al. (1986)
also reported that the losses caused by ShB
disease in Bangladesh may ranges from 14 to
31% under farmer's field condition. Finally, the
transplanting dates did not affect grain weight
of BRRI dhan49. The weight of 1000 grains was
20 g in each transplanting date during T.
Aman 2010.
0
20
40
60
80
100
Max tem Rainfall RH at 9 am RH at 2 pm
Per
cen
tage
(%
)
30-Jul15-Aug
0
20
40
60
80
100
Max tem Rainfall RH at 9 am RH at 2 pm
Per
cen
tage
(%
)
15-Jul
15-Aug
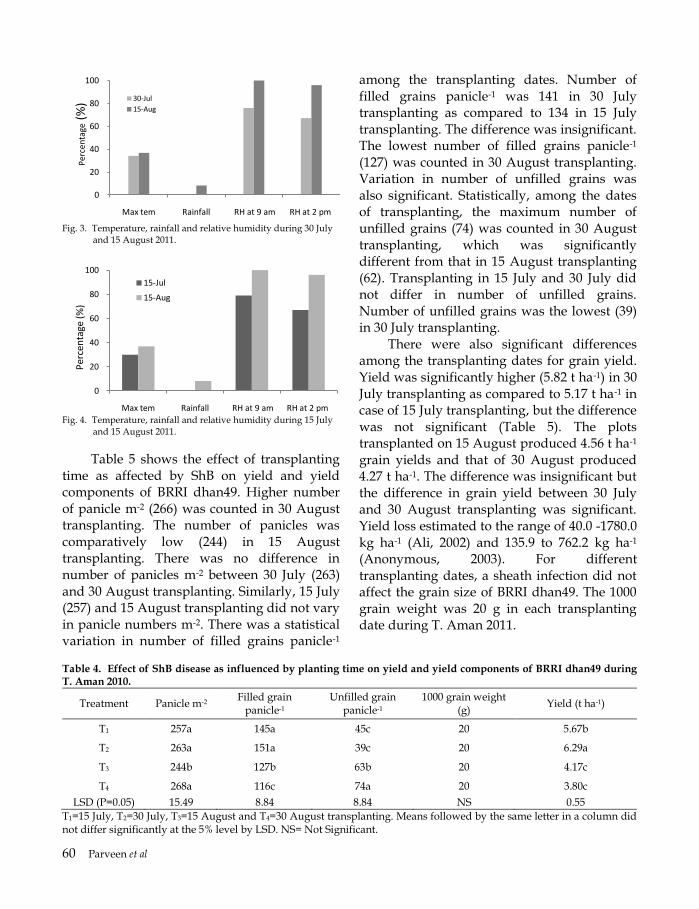
60 Parveen et al
Fig. 3. Temperature, rainfall and relative humidity during 30 July
and 15 August 2011.
Fig. 4. Temperature, rainfall and relative humidity during 15 July
and 15 August 2011.
Table 5 shows the effect of transplanting time as affected by ShB on yield and yield components of BRRI dhan49. Higher number of panicle m-2 (266) was counted in 30 August transplanting. The number of panicles was comparatively low (244) in 15 August transplanting. There was no difference in number of panicles m-2 between 30 July (263) and 30 August transplanting. Similarly, 15 July (257) and 15 August transplanting did not vary
in panicle numbers m-2. There was a statistical variation in number of filled grains panicle-1
among the transplanting dates. Number of filled grains panicle-1 was 141 in 30 July transplanting as compared to 134 in 15 July transplanting. The difference was insignificant. The lowest number of filled grains panicle-1 (127) was counted in 30 August transplanting. Variation in number of unfilled grains was also significant. Statistically, among the dates of transplanting, the maximum number of unfilled grains (74) was counted in 30 August transplanting, which was significantly different from that in 15 August transplanting (62). Transplanting in 15 July and 30 July did not differ in number of unfilled grains. Number of unfilled grains was the lowest (39) in 30 July transplanting.
There were also significant differences among the transplanting dates for grain yield. Yield was significantly higher (5.82 t ha-1) in 30 July transplanting as compared to 5.17 t ha-1 in case of 15 July transplanting, but the difference was not significant (Table 5). The plots transplanted on 15 August produced 4.56 t ha-1 grain yields and that of 30 August produced 4.27 t ha-1. The difference was insignificant but the difference in grain yield between 30 July and 30 August transplanting was significant. Yield loss estimated to the range of 40.0 -1780.0 kg ha-1 (Ali, 2002) and 135.9 to 762.2 kg ha-1 (Anonymous, 2003). For different transplanting dates, a sheath infection did not affect the grain size of BRRI dhan49. The 1000 grain weight was 20 g in each transplanting date during T. Aman 2011.
Table 4. Effect of ShB disease as influenced by planting time on yield and yield components of BRRI dhan49 during T. Aman 2010.
Treatment Panicle m-2 Filled grain
panicle-1 Unfilled grain
panicle-1 1000 grain weight
(g) Yield (t ha-1)
T1 257a 145a 45c 20 5.67b
T2 263a 151a 39c 20 6.29a
T3 244b 127b 63b 20 4.17c
T4 268a 116c 74a 20 3.80c
LSD (P=0.05) 15.49 8.84 8.84 NS 0.55
T1=15 July, T2=30 July, T3=15 August and T4=30 August transplanting. Means followed by the same letter in a column did not differ significantly at the 5% level by LSD. NS= Not Significant.
0
20
40
60
80
100
Max tem Rainfall RH at 9 am RH at 2 pm
Per
cen
tage
(%) 30-Jul
15-Aug
0
20
40
60
80
100
Max tem Rainfall RH at 9 am RH at 2 pm
Per
cen
tage
(%
)
15-Jul
15-Aug

Effect of Planting Time on Sheath Blight Disease of Rice 61
Table 5. Effect of ShB as influenced by planting time on yield and yield components of BRRI dhan49 during T. Aman 2011.
Treatment Panicle m-2 Filled grain panicle-1 Unfilled grain
panicle-1 1000 grain weight (g)
Yield (t ha-1)
T1 257ab 134ab 45c 20 5.17a
T2 263a 141a 39c 20 5.82a
T3 244b 136a 62b 20 4.56b
T4 266a 127b 74a 20 4.27b
LSD (P=0.05) 15 8.40 8.84 NS 0.80
T1=15 July, T2=30 July, T3=15 August and T4=30 August transplanting. Means followed by the same letter in a column did not differ significantly at the 5% level by LSD. NS=Not Significant.
CONCLUSIONS
In Bangladesh, ShB is a very notorious fungal disease for almost every season. Method for controlling the disease is an urgent need. The minimum RLH was observed in 30 July followed by 15 July transplanting and the maximum PDI in 30 August followed by 15 August transplanting for both the years. Moreover, the highest yield was recorded in 30 July and the lowest in 30 August transplanting during both the seasons. Finally, integrated disease management (IDM) packages need to be developed by using appropriate planting time, cultural practices and fungicides to control ShB disease of rice. ACKNOWLEDGEMENT
This study was the part of the corresponding author’s PhD dissertation. The author acknowledges the scholarship and financial support given by NATP, BARC, Dhaka and research facilities provided by Plant Pathology Division, BRRI, Gazipur. REFERENCES Ali, M A, M M Rahman, M A Latif, M Hossain, N R
Sharma, S Akter, T A Mia and M A Nahar. 2003. Survey of rice sheath blight disease caused by different Rhizoctonia sp. in Bangladesh. In. Paper presented in the stakeholder workshop on rice
sheath blight disease complex, Bangladesh Rice Research Institute (BRRI), Gazipur, Bangladesh, 3 December 2003.
Ali, M A. 2002. Biological variation and chemical control of Rhizoctnia solani causing rice sheath blight in Bangladesh, PhD thesis, Department of Biological Sciences, Imperial College for Science, Technology and Medicine, Silwod Park, Ascot, Berkshire, United Kingdom.
Anonymous. 2003. Survey report on rice sheath blight disease complex. In. Paper presented in the workshop under DFID-BRRI collaborative project, 3-4th December 2003, Plant Pathology Division, BRRI, Gazipur 1701, Bangladesh.
Anonymous. 2006. World Rice Statistics. International Rice Research Institute, Los Banos, Laguna, Metro Manila, Philippines.
Anonymous. 2010. Modern Rice Cultivation (Adhunik Dhaner Chas-Bangla version). Publication no. 5, 15th Edition. Bangladesh Rice Research Institute, Gazipur 1701, Bangladesh.
Anonymous. 2018. Modern Rice Cultivation (Adhunik Dhaner Chas-Bangla version). Publication no. 5, 21th Edition. Bangladesh Rice Research Institute, Gazipur 1701, Bangladesh.
Ashrafuzzaman, M H, M Jalaluddin, M I Kha1il and I Hossain. 2005. Integrated management of sheath blight of Aman rice. Bangladesh J. Plant. Pathol. 21 (1 and 2): 53-58.
Bhaktavatsalam, G, K Satyanarayana, A P K Reddy and V T John. 1978. Evaluation for sheath blight resistance in rice. Int. Rice Res. Newsl. 3: 9-10.
Brooks, S A. 2007. Sensitivity to a Phytotoxin from Rhizoctonia solani correlates with sheath blight susceptibility in Rice. Phytopathology 97: 1207-1212.
Damicone, J R, M V Patel and W F Moore. 1993. Density of sclerotia of Rhizoctonia solani and incidence of sheath blight in rice fields in Mississippi. Pl. Dis. 77(3): 257-260.
Dilla, E M. 1993. Yield loss due to sheath blight in direct-seeded rice as affected by plant density, nitrogen level and amount of inoculum. College, Los Banos, Laguna, Metro Manila, Philippines. p. 175.

62 Parveen et al
Gangopadyay, S and N K Chakrabarti. 1982. Sheath blight on rice. Review of Plant Pathololgy 61: 451-460.
Groth, D E, M C Rush and C A Hollier. 1991. Rice diseases and disorders in Louisiana. La. Agric. Exp. Stn. Bull. No. 828.
Groth, D E, M C Rush and C A Hollier. 1992. Prediction of rice sheath blight severity and yield loss based on early season infection. La. Agric. 35: 20-23.
Hashiba, T, T Yammaguchi and S Mogi. 1977. Quantitative changes in nitrogen and starch content in rice sheaths during vital disease development of sheath blight caused by Rhizoctonia solani Kuhn. Ann. Phytopath. Soc. Japan 43: 1-8.
IRRI. 2002. Standard evaluation system for rice. Rice Knowledge Bank, International Rice Research Institute, Los Banos, Laguna, Metro Manila, Philippines. p.19.
Kozaka, T. 1975. Sheath blight in rice plants and its control. Rev. Plant Prot. Res. 8: 69-79.
Lakpale, N, K C Agrawal, V S Thrimurty and A S Kotasthana. 1994. Influence of submergence on sclerotial viability of Rhizoctonia solani causing sheath blight of rice. Adv. Pl. Sci. 7(1): 143-146.
Leano, R M. 1993. Ecological factor associated with sheath blight epidemiology and yield loss in rice (Oryza sativa L.). College, Los Banos, Laguna, Metro Manila, Philippines. pp. 82.
Marchetti, M A and CN Bollich. 1991. Quantification of the relationship between sheath blight severity and yield loss in rice. Plant Dis. 75: 773-775.
McKinney, H H. 1923. A new system of grading plant diseases. Journal of Agriculture Research 26: 195-218.
Miah, S A and A K M Shahjahan. 1987. Mathe Dhaner Rog Nirnoy O Tar Protikar (Bangla Version). Bangladesh Rice Research Institute, Gazipur, Bangladesh. pp. 60.
Nagarajkumar, M, R Bhaskaran and R Velazhahan. 2004. Involvement of secondary metabolites and extracellular lytic enzymes produced by Pseudomonas fluorescens in inhibition of Rhizoctonia solani, the rice sheath blight pathogen. Microbiological Research 159: 73-81.
Naidu, V D. 1992. Influence of sheath blight of rice on grain straw yield in some popular local varieties. J. Res. Publ. 10: 78-80.
Shahjahan, A K M, N R Sharma, H U Ahmed and S A Miah. 1986. Yield loss in modern rice varieties of Bangladesh due to sheath blight. Bangladesh J. of Agricultural Research 11(2): 82-90.
Sharma, N R and P S Teng. 1990. Effects of inoculum source on sheath blight development. Int. Rice Res. Newsl. 15: 18-19.
Ui, T, T Naiki and M Akimoto. 1976. A saving-floatation technique using hydrogen peroxide solution for determination of sclerotial population of Rhizoctonia solani Kuhn in soil. Ann. Phytopath. Soc. Japan 42: 46-48.
Wu, W, J Huang, K Cui, L Nie, Q Wang, F Yang, F Shah, F Yao and S Peng. 2012. Sheath blight reduces stem breaking resistance and increases lodging susceptibility of rice plants. Field Crops Research 128: 101-108.
Bangladesh Rice J. 22 (2) : 63-69, 2018, doi.org/10.3329/brj.v22i2.44043
1Principal Scientific Officer, 2Senior Scientific Officer, 3Former Chief Scientific Officer, Soil Science Division, BRRI, Gazipur 1701. *Corresponding author’s E-mail: [email protected]
Performance of Prilled Urea and Urea Super Granule by Applicators on Yield and Nitrogen Use Efficiency in Boro Rice
A T M S Hossain1, F Rahman2 and P K Saha3
ABSTRACT
A field experiment was conducted on validation of prilled urea (PU) and urea super granule (USG) applied by applicators on yield and nitrogen use efficiency during Boro 2014 season at Bangladesh Rice Research Institute (BRRI) farm, Gazipur (AEZ 28). Six treatment combinations of different N doses and methods of N application were tested to compare urea-N application by PU and USG applicator for rice yield, N uptake and N use efficiency over urea broadcasting. Application of N as PU or USG through applicator has same effect on grain yield, N uptake and N use efficiency compared with urea broadcasting. Statistically similar grain yield were observed with N application as PU or USG @ 78 kg N ha-1 by applicator which was comparable with urea broadcasting @ 135 kg N ha-1. The N concentration and uptake in both panicle initiation (PI) and maturity stage were higher in USG deep placement than PU deep placement by applicators but the difference was not significant. Although agronomic use efficiency (AUE) of N was slightly higher in PU than USG applied by applicators but the recovery efficiency (RE) of N was higher in USG than PU. Key words: PU, USG, deep placement, applicator, grain yield, AUE, RE.
INTRODUCTION Nitrogen (N) fertilizer is a major essential plant nutrient and the most yield-limiting nutrient in rice (Oryza sativa L.) cropping systems worldwide (Yoseftabar, 2013, Ladha and Reddy 2003, Fageria et al., 2008). Especially in tropical Asian soils and almost every farmer has to apply the N fertilizer to get a desirable rice yield (Saleque et al., 2004). Judicious and proper use of N fertilizer can markedly increase the yield and improve the quality of rice (Chaturvedi, 2005). Both excess and insufficient supply of nitrogen is harmful to the rice crop and may decrease the grain yield. An adequate nitrogen supply can increase as much as 60% rice production over control (Mikkelsen et al., 1995).
Worldwide, N recovery efficiency for cereal production (rice, wheat, sorghum, millet, barley, corn, oat and rye) is approximately 33%. The unaccounted 67%
represent a US$ 15.9 billion annual loss of N fertilizer (assuming fertilizer soil equilibrium) (Raun and Johnson, 1999). For lowland rice in the tropics recovery efficiency is 30-50% of applied N depending on season, yield level, the rate and timing of N application (Yoshida, 1981; De Datta, 1986). Low recovery of N fertilizer not only increases cost of production but also may contribute to ground water pollution (Fageria and Barbosa Filho, 2001). So, improved N fertilizer practices are needed to reduce environmental impacts and increase economic benefits of N fertilization.
The efficient use of N fertilizer is recognized as an important factor for rice cultivation, but it has always been a problem to raise the N utilization rate of the rice plants and to increase the efficiency of absorbed N for grain production irrespective of N amount being applied. Low N fertilizer use or recovery efficiency remains a problem in rice production in Asia (Hussain et al., 2000). The low efficiency of N fertilizers is

64 Hossain et al
mainly caused by losses of N from the soil-plant system. Low agronomic efficiency was caused by poor internal efficiency, rather than low supply of soil N or loss of fertilizer N. Thus often the application of large amount of N fertilizer by farmers to increase yield of HYV were not justified agronomically and ecologically (Hussain et al., 2005).
In Bangladesh, farmers use N fertilizer for rice cultivation as prilled urea broadcast or urea super granule (USG) deep placement. Broadcast applied nitrogen fertilizer being washed out of the paddies resulting in reduced nitrogen uptake and river pollution. One solution to this problem is to deep place urea fertilizers as urea granules (Alam et al., 2014). Tarfa and Kiger (2013) reported that USG application with best practices increased N use efficiency by 40% and irrigated paddy yield increased up to 20-30% in Niger State, Nigeria. Likewise, Kuku et al. (2013) and Liverpool-Tasie and Kuku-Shittu (2015) maintained that UDP technology appreciably increased the yield of paddy in Niger State, Nigeria. In the same vein, Vargas (2012) established his study that utilization of UDP led to an increment in rice farmer in Lucia, Ecuador. Rahman and Barmon (2015) clearly established that the utilization of UDP technology significantly increased paddy grain yield in Bangladesh. It is proved that deep placement of USG reduces the N losses and increases the N use efficiency. But deep placement of prilled urea is a new concept to us. It may also reduce the N losses like USG or not. Recently BRRI has developed prilled urea and USG applicator. Therefore, in depth research will be needed to make a comparison study with prilled urea and USG applicators in terms of rice yield and economic benefit.
Considering the above circumstances, a field experiment was conducted to compare urea-N application by PU and USG applicator for rice yield and N uptake and to estimate the N use efficiency of PU and USG application by applicators.
MATERIALS AND METHODS A field experiment was conducted in Boro 2014 season at the Bangladesh Rice Research Institute (BRRI) farm, Gazipur under the supervision of Soil Science Division in collaboration with Farm Machinery and Post Harvest Technology (FMPHT) Division. The soil of the experimental field was clay loam in texture having pH 6.5. The other nutrients status was as follows: organic carbon 1.18%, total N 0.16%, exchangeable K 0.17 meq/100g soil, available S 19 mg kg-1 and available Zn (DTPA extraction) 4 mg kg-1. The experiment was laid out in a randomized complete block design with three replications. The individual plot size was 3.2 m × 12.8 m.
The treatment combinations were as follows: T1 = Control (no N fertilizer) T2 = Hand broadcasting of prilled urea (PU) @ 135 kg N ha-1 (Recommended dose) T3 = Hand broadcasting of prilled urea (PU) @ 78 kg N ha-1 T4 = PU application by applicator @ 78 kg N ha-1 T5 = USG application by applicator @ 78 kg Nha-1 (2.7 g/4 hills) (Recommended dose) T6 = Hand broadcasting PU @ 95 kg N ha-1 (70% of recommended dose of urea broadcasting)
Fertilizer was applied as basal @ 20-60-20-4 kg ha-1 of P, K, S and Zn from TSP, MP, gypsum and zinc sulphate respectively. For treatment T2, T3 and T6 urea was applied in three equal splits; one third as basal, one third at active tillering stage and the rest one third at seven days before panicle initiation (PI) stage. In T4 and T5, the full dose of prilled urea and USG were applied at three days after transplanting by prilled urea and USG applicators.
Forty-five-day-old seedlings of BRRI dhan29 was transplanted on the last week of January. Irrigation, weeding and other cultural management practices were done equally as per needed. At PI stage, four hills from each plot was collected for counting tiller number, dry weight and nitrogen uptake. At maturity

Performance of Prilled Urea and Urea Super Granule Applicators 65
the crop was harvested manually in the 2nd week of May in the area of 5 m2 at 15 cm above ground level for grain yield. However, 16 hills from each plot were harvested at the ground level for yield components and straw yield data. The grain yield was recorded at 14% moisture content and straw yield as oven dry basis. The tiller and panicle number per meter square were also recorded. Nitrogen concentration and nitrogen uptake by grain and straw were determined by micro-Kjeldahl distillation method.
Nitrogen use efficiency was calculated using the following formulas (Fageria et al., 1997): Agronomic efficiency (AE) = (Gf – Gu)/ Na = kg kg –1
Where, Gf is the grain yield of the fertilized plot (kg), Gu is the grain yield of the unfertilized plot (kg), and Na is the quantity of N applied (kg). Recovery efficiency was calculated using the following formulas (FRG, 2012) Recovery efficiency (RE) = (NU NA – NU NO) / N RN Where, NU NA = Nutrient uptake (kg/ha) due to nutrient addition NU NO = Nutrient uptake (kg ha-1) due to nutrient omission N RN = Rate of nutrient addition (kg ha-1)
All the obtained data were analyzed statistically with the software CropStat 7.2 version.
RESULTS AND DISCUSSION Dry matter yield and nitrogen uptake at panicle initiation stage The tiller number and dry weight at panicle initiation (PI) stage were influenced significantly with application of N from different forms and methods in Boro season (Table 1). The highest tiller number per meter square was observed in T2 treatment where PU was applied @ 135 kg N ha-1 as hand broadcasting followed by T3 treatment where PU was applied @ 78 kg N ha-1 on hand broadcasting and the lowest in N control treatment. In comparison with N application by PU and USG applicator, no significant
difference was observed for tiller production per meter square.
The highest dry weight production at PI stage was observed in T2 treatment followed by T6 and the lowest in N control. The T3, T4 and T5 treatment produced statistically similar dry yield as they received same dose of N (78 kg ha-1).
The N concentration was statistically similar in plant tissue at PI stage with application of N from different forms and different methods (Table 1). The highest N concentration in plant tissue was observed in T2 treatment followed by T6 treatment and the lowest was in N control treatment. The N application as USG by applicator gave better N concentration in plant tissue than N application as PU by applicator though the difference was statistically identical. A similar trend was observed for N uptake by all the N treatments at PI stage of Boro rice. Grain and straw yield The tiller and panicle number per meter square, grain and straw yield were significantly influenced by applying N from different forms and application methods in Boro rice of BRRI dhan29 (Table 2). The tiller number per m2 in the control plot was only 189. With application of N from different forms and methods the tiller number per m2
increased significantly over control. The highest tiller number was observed in T2 treatment where PU was applied by hand broadcasting as recommended dose followed by T6 and T5. Significantly lower tiller number was obtained with N control. The other N treatment showed statistically similar result for tiller production. A similar trend observed for panicle production per m2 in all N treatment in Boro season. The 1000 grain weight (TGW) was statistically similar for all N treatments including N control. But comparatively higher TGW was observed in USG deep placement (22.48 g) than PU deep placement (21.99 g) method (Table 2). Islam et al., (2015) also found similar results where insignificant effect of urea applicator was on panicle intensity, panicle length and 1000-grain mass.

66 Hossain et al
Table 1. Effect of PU and USG on growth, nitrogen concentration and uptake at PI stage of Boro rice, BRRI, Gazipur, 2014.
Treatment Tiller no. m-2 Dry wt. (t ha-1) N (%) N uptake (kg ha-1)
T1 = N – control 182 1.26 1.38 17.59 T2 = 135 kg N ha-1 (as PU by hand broadcasting) 419 3.54 1.75 63.63
T3 = 78 kg N ha-1 (as PU by hand broadcasting) 371 2.88 1.51 43.37
T4 = 78 kg N ha-1 (as PU by applicator) 318 2.52 1.45 36.41
T5 = 78 kg N ha-1 (as USG by applicator) 338 2.76 1.65 45.81
T6 = 95 kg N ha-1 (as PU by hand broadcasting) 345 3.19 1.70 55.10
CV (%) 10.5 19.7 11.9 26.0 LSD (0.05) 63 0.97 0.34 20.52
The grain yield of the N-control plot was only 3.05 t ha-1 and with receiving N from different sources and methods the grain yield increased significantly in all treatments over N-control (Table 2). The highest grain yield was observed in T2 (5.56 t ha-1) treatment where N was used @135 kg ha-1 as PU hand broadcasting followed by T4 (5.35 t ha-1) where N was used @78 kg ha-1 as PU by applicator. Similar grain yield was obtained with T6 (5.35 t ha-1) where N was used @ 95 kg ha-1 as PU hand broadcasting. Slightly lower grain yield was observed in T5 treatment (5.21 t ha-1) where N was applied @ 78 kg ha-1 as USG by applicator than T4 (PU by applicator). But the difference was not statistically significant. Actually, all the N treatments produced statistically similar grain yield in Boro season. Islam et al., (2015) found that PU and USG applicators saved 29-32% of prilled urea without sacrificing grain yield in view of the nitrogen management options. Field trials conducted in farmers’ fields across different agro-ecological zones (AEZ) showed that UDP
with 25–35% less urea produced up to 20% higher yield compared to broadcast PU (Miah et al., 2015; Gregory et al. 2010; IFDC 2013) which was dissimilar to this finding.
IFDC (2007) also reported that deep
placement of N fertilizers had increased rice
yield by 22% over broadcasting and decreased
urea use by 47%. Kapoor et al. (2008) reported
that significantly higher grain yield was
observed with deep placement of NPK
briquette compared to broadcast application.
A similar trend was observed for straw yield
although T2 treatment gave significantly
higher straw yield over some treatments may
be due to higher N dose.
In this study, no significant yield
differences were observed under N rates and
application methods during the Boro season.
Contrary to this study, Huda et al. (2016) who
conducted an experiment and reported
increased yield with increasing N rates from 78
to 156 kg N ha-1 during the Boro season,
particularly in broadcast PU. Table 2. Effect of PU and USG on yield and yield components of Boro rice, BRRI, Gazipur, 2014.
Treatment Tiller no. m-2
Panicle no. m-2
1000 grain weight (g)
Grain yield
(t ha-1)
Straw yield
(t ha-1)
T1 = N – control 189 183 21.91 3.05 2.97
T2 = 135 kg N ha-1 (as PU by hand broadcasting) 330 312 21.83 5.56 5.76
T3 = 78 kg N ha-1 (as PU by hand broadcasting) 280 273 22.35 5.17 5.11 T4 = 78 kg N ha-1 (as PU by applicator) 277 271 21.99 5.35 5.55 T5 = 78 kg N ha-1 (as USG by applicator) 289 276 22.48 5.21 5.03
T6 = 95 kg N ha-1 (as PU by hand broadcasting) 290 282 22.37 5.35 5.25
CV (%) 9.4 9.0 2.1 5.2 6.2 LSD (0.05) 46.92 43.36 NS 0.47 0.56

Performance of Prilled Urea and Urea Super Granule Applicators 67
Nitrogen uptake
The grain and straw N concentrations and N
uptake were significantly influenced by
different doses and methods of N application
(Table 3). The highest N concentration was
observed in T2 treatment followed by T6
treatment. The N concentration in grain of
USG treatment was higher than PU deep
placement. A similar trend was observed for
straw N concentration in all treatments.
The N uptake by grain and straw varied
significantly with application of N in Boro
season. The N uptake by grain in T2 treatment
was significantly higher than N-control, T3, T4
and T5 treatment but T6 treatment produced
statistically similar N uptake like T2. Mostly
similar trend was observed for straw N uptake
by rice at maturity stage.
The total nitrogen uptake (TNU) by rice
at maturity stage showed significant variation
with receiving different forms and method of
N in Boro rice (Table 3). The highest Nitrogen
uptake was obtained in T2 treatment where
recommended dose of N was applied and the
lowest was found in control. The deep
placement of PU and USG had no significant
difference for N uptake in Boro rice of BRRI
dhan29. Actually the crop slightly suffered in
nitrogen deficiency at the PI stage particularly
in the treatments of urea deep placement by
applicators and the lower dose of N was
applied.
Nitrogen use efficiency
Table 4 describes the agronomic use efficiency
(AUE) and recovery efficiency (RE) of N. The
AUE in the recommended dose of PU (135 kg
N ha-1) was 18.56 kg-1 and in 70% of
recommended dose of PU (95 kg N ha-1) it was
24.24 kg-1. The deep placement of PU and USG
increased the AUE of N. Significantly higher
AUE were observed using 78 kg N/ha than
135 kg N ha-1. The highest N use efficiency was
observed in T4 treatment (29.46 kg kg-1) where
PU was applied by applicator followed by T5
treatment (27.68 kg kg-1) where USG was
applied by applicator but the difference was
not significant.
Among the treatments, recovery
efficiency (RE) of applied N varied from
40.21% to 50.40%. The highest RE of 50.40%
was obtained in T5 (78 kg N ha-1 by USG
applicator) and the lowest in T2 (135 kg N ha-1
by PU hand broadcasting) though the
difference was statistically identical.
Deep placement of USG increased
nitrogen use efficiency by keeping most of the
urea nitrogen in the soil, close to plant roots
and out of the irrigation water (IFDC, 2007).
Kapoor et al., (2008) also observed that
significantly higher N uptake and N use
efficiency with deep placement of N compared
to broadcast application.
Table 3. Effect of PU and USG on N concentration and N uptake by Boro rice, BRRI, Gazipur, 2014.
Treatment GN (%) SN (%) GNU (kg ha-1) SNU (kg ha-1) TNU (kg ha-1)
T1 = N – control 0.87 0.49 26.66 14.43 41
T2 = 135 kg N ha-1 (as PU by hand broadcasting) 1.08 0.61 60.24 35.13 95 T3 = 78 kg N ha-1 (as PU by hand broadcasting) 0.95 0.54 49.23 27.62 77 T4 = 78 kg N ha-1 (as PU by applicator) 0.89 0.51 47.88 27.99 76
T5 = 78 kg N ha-1 (as USG by applicator) 1.00 0.56 52.25 28.16 80
T6 = 95 kg N ha-1 (as PU by hand broadcasting) 1.05 0.59 56.08 30.58 87 CV (%) 5.2 9.5 6.9 10.4 6.0
LSD (0.05) 0.09 0.09 6.13 5.17 8.32

68 Hossain et al
Table 4. Effect of PU and USG on agronomic use efficiency and recovery efficiency of N applied in Boro rice, BRRI, Gazipur, 2014.
Treatment Agronomic use efficiency of N applied (kg-1)
Recovery efficiency of N applied (%)
T1 = N – Control - - T2 = 135 kg N ha-1 (as PU by hand broadcasting) 18.56 40.21
T3 = 78 kg N ha-1 (as PU by hand broadcasting) 27.17 45.84 T4 = 78 kg N ha-1 (as PU by applicator) 29.46 44.59 T5 = 78 kg N ha-1 (as USG by applicator) 27.68 50.40 T6 = 95 kg N ha-1 (as PU by hand broadcasting) 24.24 47.97 CV (%) 13.6 13.10 LSD (0.05) 6.49 11.33
CONCLUSIONS The recommended dose of urea by hand broadcasting @135 kg N ha-1 produced the highest yield but the yield was statistically similar to the application of N as PU or USG @ 78 kg ha-1 by applicators. However, it would save around 57 kg N ha-1 as well as protect the soil from environmental pollution. Moreover, AUE and RE of N were found highest with the application of N as PU or USG by applicators than that of recommended dose of urea.
REFERENCES Adjornon, S G and L S O Liverpool-Tasie. 2014. Spatial
dependence in the utilization of the urea deep placement for rice production in Niger State, Nigeria: A Bayesian Spatial Autoregressive Profit Estimation Approach. Selected Paper prepared for presentation at the Agricultural and Applied Economics Association’s 2014 AAEA Annual Meeting, Minneapolis, MN, July 27-29, 2014.
Alam, M S, D K Nath and F Amin. 2014. The effect of nitrogen management practices on yield and yield attributes of T. Aus rice under a tidal ecosystem. Proceedings of the 4th International Rice Congress, October 28-31, 2014, Bangkok, Thailand.
Bandaogo, A, F Bidjokazo, S Youl, E Safo, R Abaidoo and P Andrews. 2015. Effect of fertilizer deep placement with urea super granule on nitrogen use efficiency of irrigated rice in Sourou Valley (Burkina Faso). Nutrient Cycling Agroecosyst, 102:79.
Chaturvedi, I. 2005. Effect of nitrogen fertilizers on growth, yield and quality of hybrid rice. J. Central European Agric. 6: 611-618.
De Datta, S K. 1986. Improving nitrogen fertilizer efficiency in lowland rice in tropical Asia. Fert. Res. 9: 171-186.
Fageria, N K and M P Barbosa Filho. 2001. Nitrogen use efficiency in lowland rice genotypes. Communications in soil science and plant analysis. 32(13&14): 2079-2089.
Fageria, N K, A B Santos and V A Cutrim. 2008. Dry matter and yield of lowland rice genotypes as influence by nitrogen fertilization. J. Plant Nutr. 31: 788-795.
Fageria, N K, V C Baligar and C A Jones. 1997. Growth and mineral nutrition of field crops. 2nd Ed., Marcel Dekker, Inc., New York.
FRG (Fertilizer Recommendation Guide). 2012. BARC (Bangladesh Agricultural Research Council), Farmgate, Dhaka. Pp. 50-51.
Gregory, D I, S M Haefele, R J Buresh and U Singh. 2010. Fertilizer use, markets, and management. In: Pandey, S. et al. (Eds.), Rice in the Global Economy: Strategic research and policy issues for food security. International Rice Research Institute, pp 231-263.
Huda, A, Y K Gaihre, M R Islam, U Singh, Md R Islam, J Sanabria, M A Satter, H Afroz, A Halder and M Jahiruddin. 2016. Floodwater ammonium, nitrogen use efficiency and rice yields with fertilizer deep placement and alternate wetting and drying under tipple rice cropping systems. Nutr Cycl Agroecosyst. DOI: 10.1007/s10705-015-9758-6.
Hussain, F, K F Bronson, Y Sing, B Sing and S Peng. 2000. Use of Chlorophyll meter sufficiency indices for nitrogen management of irrigated rice in Asia. Agron. J., 92: 775-779.
Hussain, M F, S K White, J L Elahi, N Sultana, M H K Choudhury, Q K Alam, J A Roller and J L Gaunt. 2005. The efficiency of nitrogen fertilizer for rice in Bangladeshi farmers’ field. Field Crop Res. 93: 94-107.
IFDC. 2007. Mitigating poverty and environmental degradation through nutrient management in South Asia. IFDC Report, March 2007. International Fertilizer Development Centre.
IFDC. 2013. Fertilizer deep placement. IFDC solutions. International Fertilizer Development Center (IFDC), Muscle Shoals, AL 35662 USA, p 6 http://www.ifdc.org/get attachment/1c7e9b2e-37b3-4ea4-93c1-318013dc3ce9/ FDP.pdf.

Performance of Prilled Urea and Urea Super Granule Applicators 69
Islam, A K M S, M A Rahman, A K M Lutfor Rahman, M T Islam and M I Rahman. 2015. Performance evaluation of push type prilled urea applicator in rice cultivation. Bangladesh Rice J. 19(2): 71-81.
Kapoor, V, U Singh, S K Patil, H Magre, L K Shrivastava, V N Mishra, R O Das, V K Samadhiya, J Sanabria and R Diamond. 2008. Rice growth, grain yield and floodwater nutrient dynamics as affected by nutrient placement method and rate. Agronomy Journal. 100(3):526-536.
Ladha, J K and P M Reddy. 2003. Nitrogen fixation in rice system: state of knowledge and future prospects. Plant Soil 252:151–167.
Miah, Md A M, Y K Gaihre, G Hunter, U Singh and S A Hossain. 2015. Fertilizer deep placement increases rice production and economic returns in southern Bangladesh. Agron J. DOI:10.2134/agronj2015.0170.
Mikkelsen, D S, G R Jayaweera and D E Rolston. 1995. Nitrogen fertilizer practices of lowland rice culture. In: Nitrogen fertilization and the environment. pp. 171-223.
Rahman, S and Barmon, B K 2015. Productivity and efficiency impacts of urea deep placement
technology in modern rice production: An empirical analysis from Bangladesh. The Journal of Developing Areas.
Raun, W R and G V Johnson. 1999. Improving nitrogen use efficiency for central production. Agron. J. 91: 357-363.
Saleque, M A, U A Naher, N N Choudhury and A T M S Hossain. 2004. Variety-specific nitrogen fertilizer recommendation for lowland rice. Communication in Soil Sci. 35: 1891-1903.
Vargas, S A M. 2012. Cost-benefit analysis for the utilization of the urea deep placement technology by the rice farmers of Daule and Santa Lucia, Ecuador. A thesis presented to the graduate school of the University of Florida for the degree of Master of Science. .http://ufdc.ufl.edu/UFE0044808/00001
Yoseftabar, S. 2013. Effect of nitrogen management on panicle structure and yield in rice (Oryza sativa L.). Int J Agri Crop Sci 5(11):1224–1227.
Yoshida, S. 1981. Fundamentals of rice crop science. IRRI, Los Banos. Philippines. pp. 235-237.
Bangladesh Rice J. 22 (2) : 71-77, 2018, doi.org/10.3329/brj.v22i2.44044
1Senior Scientific Officer, 2Principal Scientific Officer, 3Chief Scientific Officer, Soil Science Division, BRRI, Gazipur 1701. * Corresponding author’s E-mail: [email protected]
Integrated Effects of Poultry Manure and Chemical Fertilizer on Yield, Nutrient Balance and
Economics of Wetland Rice Culture
F Rahman1, A T M S Hossain2 and M R Islam3
ABSTRACT
Field trials were conducted for two years to evaluate the integrated effect of poultry manure (PM) and chemical fertilizers on yield, nutrient balance and economics of rice at BRRI, Gazipur (AEZ-28 and land type- High Land) during Boro 2009 to T. Aman 2010. Eight treatment combinations, where PM @ 1, 2, 3 t ha-1 with IPNS (Integrated plant nutrient system) based dose and PM @ 1, 2, 3 t ha-1 with 50% STB (soil test based) dose along with a control and 100% STB chemical fertilizer were tested. Immediate effects of manure and fertilizer were evaluated in Boro season and residual effects were observed in the following T. Aman season. Application of PM @ 2 t ha-1 with IPNS based chemical fertilizer or PM @ 3 t ha-1 with 50% STB dose gave higher grain yield in Boro season. Some residual effects in the succeeding T. Aman rice were observed where PM was used @ 3 t ha-1. The highest net return was obtained with 3 t PM ha-1 with 50% STB dose. A positive nutrient balance of phosphorus and sulfur were observed in PM and chemical fertilizer treated plots. Key words: Poultry manure, IPNS, grain yield, nutrient balance, economics
INTRODUCTION Poultry manure is an excellent, low cost fertilizer and is a valuable organic source of essential plant nutrients and soil amendments to improve soil quality. It contains both organic and inorganic forms of nutrients. Poultry manure (fresh or semi-decomposed) is a good source of macro and micronutrients for plants as well as a potential source of organic matter in soil (Saha et al., 2004). At present about 2 million ton poultry manure per year is produced in Bangladesh which can supply about 3 kg P/ha/yr (Rijpma and Jahiruddin, 2004) and application of 2 ton poultry manure ha-1 may replace the full dose of P and S and 60% N and K fertilizer requirement for target yield of 5-6 t ha-1 rice (Miah et al., 2006). When organic manure was applied in conjunction with inorganic fertilizers for efficient growth for crop, declination of organic carbon was arrested (Singh et al., 2001).
Around 30 days decomposed poultry manure with 50% STB chemical fertilizer is
good in terms of nutrients and grain yield of rice as well as soil health (Hossain et al., 2010). Long term fertilizer experiments involving intensive cereal based cropping systems reveal a declining trend in productivity even with the application of recommended levels of N, P and K fertilizer (Mahajan et al., 2002; Mahajan and Sharma, 2005). Without adequate and balanced use of chemical fertilizers and with little or no manure have caused severe fertility deterioration.
Combined use of chemical and organic fertilizer increases retentions and improves nutrient availability. High analysis fertilizers have low contents of micronutrients, but combined use with organic manure makes these nutrients available to plants. Fixation of P could be reduced and effectiveness of K can be increased when chemical fertilizer is combined with organic manures. All crops can be benefited from poultry litter but it should not be applied to soil beyond the limits of the growing crops nutrient needs. This will ensure efficient use of manure nutrients and minimize

72 Rahman et al
nutrient leaching or run off into the surface and ground water system. Fertilizer recommendations based on soil test results are the only reliable way to determine the crop requirement. Soil testing, manure analysis and proper estimation of yield goal are necessary to calculate proper agronomic application rates of manure.
Now it is the demand of the time to develop an integrated organic and inorganic source of nutrients for sustainable agriculture that can ensure food production with high quality and maintain soil fertility. Integrated Nutrient Management (INM) is a concept of addition of organic manure with chemical fertilizer. Integrated Plant Nutrient Systems (IPNS) is a process where total nutrient adjusted from organic and inorganic fertilizer sources to obtained maximum yield with a view to total improvement of soil health. Combined use of organic manure and chemical fertilizer results in higher return to investment and better cost-benefit ratio (Rahman et al., 2009). The integrated use of poultry manure and chemical fertilizer may increase the productivity and reduce the chemical fertilizer dose in Rice-Rice cropping pattern. So, this study was undertaken to determine the doses of poultry manure with chemical fertilizers on the basis of IPNS concept and also determine the level of poultry manure addition with 50% soil test based chemical fertilizer dose. MATERIALS AND METHODS Field experiments were conducted for two years at BRRI experimental farm, Gazipur during Boro 2009 to T. Aman 2010 seasons. The soil of the experimental field was clay loam in texture having pH 6.84, organic matter 2.42%, total N 0.14%, available P 5.77 mg kg-1, exchangeable K 0.14 meq 100 g-1 soil, available S 6.6 mg kg-1 and available Zn 2.8 mg kg-1. Eight following treatments viz T1 = Absolute
control (native nutrients), T2 = PM @ 1 t ha-1 + IPNS based STB dose, T3 = PM @ 2 t ha-1 + IPNS based STB dose, T4 = PM @ 3 t ha-1 + IPNS based STB dose, T5 = PM @ 1 t ha-1 + 50% STB dose, T6 = PM @ 2 t ha-1 + 50% STB dose, T7 = PM @ 3 t ha-1 + 50% STB dose and T8= 100% STB dose were tested in the experiment. Thirty days semi-decomposed PM (oven dry based), one-third of N and the whole amount of PKS were applied at final land preparation as per treatment requirement in Boro season. The remaining two-third N was applied in two equal installments at 25-30 days after transplanting and at seven days before panicle initiation stage. In T. Aman, the residual effect of PM was observed and the treatment combinations were; T1 = Absolute control, T2 = Residual effect of PM @ 1 t ha-1 + 100% STB dose, T3 = Residual effect of PM @ 2 t ha-1
+100% STB dose, T4 = Residual effect of PM @ 3 t ha-1 + 100% STB dose, T5 = Residual effect of PM @ 1 t ha-1 + 50% STB dose, T6 = Residual effect of PM @ 2 t ha-1 + 50% STB dose, T7 = Residual effect of PM @ 3 t ha-1 + 50% STB dose and T8= 100% STB dose. The time and method of chemical fertilizer application was same as Boro rice. In Boro season 40-day-old seedlings of BRRI dhan29 and in T. Aman 30- day-old seedlings of BRRI dhan31 were transplanted. The design of the experiment was RCBD with three replications. The individual plot size was 4 m × 4 m. The crops were harvested at maturity from 5 m2 areas at the centre of each plot and then grain yields were recorded at 14% moisture and straw yields at oven dry basis.
Poultry manures samples as well as rice grain and straw samples of Boro and T. Aman rice were analyzed for the determination of N, P, K and S in the Soil Science Division laboratory, BRRI, Gazipur. For analyzing the P, K and S content, samples were digested with di-acid mixture of nitric and perchlororic acid at the ratio 5:2 following the method described by Yoshida et al. (1976) and N by Micro-Kjeldahl distillation method (Yoshida, et

Integrated Effects of Poultry Manure and Chemical Fertilizer on Yield 73
al., 1976). After two years, surface (0-15 cm depth) soil samples were collected and analyzed for chemical properties like organic carbon, total nitrogen, available phosphorus, exchangeable potassium, available sulfur and zinc following standard procedure. All the data were analyzed statistically with the software of Crop Stat 7.2 version. RESULTS AND DISCUSSION Grain and straw yield
Poultry manure application either with IPNS or STB base chemical fertilizer had positive influence on the grain yield of Boro rice (Table 1). In Boro 2009 significantly higher grain yield was obtained when poultry manure was applied @ 2 t ha-1 with adjusted IPNS based chemical fertilizer (T3) and PM @ 3 t ha-1 + 50% STB dose (T7) compared to 100% STB (T8) chemical fertilizer but in 2010, the result was insignificant. The mean grain yield ( average of two years) was 6.20 t ha-1 when poultry litter @ 2 t ha-1 with adjusted IPNS based fertilizer and PM @ 3 t ha-1 + 50% STB dose while 100% STB treatment produced the yield 5.87 t ha-1. About 0.3 t ha-1 higher average grain yield was
obtained from poultry litter treated plot compared to 100% STB dose.
Both the treatments produced statistically
similar yield to each other may be due to
addition of similar amount of nutrients in the
soil. The lowest yield was obtained from
control treatment. Lidong et al. (2009) also
reported significant positive effects of organic
amendments on rice yield.
In T. Aman 2009, some residual effect of
PM for grain yield (which was applied in Boro
season) was observed (Table 1). A significant
amount of residual effect of PM was observed
in T5, T6 and T7 treatments where 1, 2 and 3 t
ha-1 PM with 50% chemical fertilizer was
applied respectively, in the previous Boro crop
but in T. Aman 2010, the residual effect was
insignificant. The two years average yield from
100% NPKS was lower than those treatments
where PM was applied more than 1 t ha-1. This
result confirmed the data obtained by other
experiments conducted by Soil Science
Division, BRRI (Miah, 2006) and Hossain et al.
(2010). Similar trend was also observed in case
of straw yield production in both the years and
seasons (Table 2).
Table 1. Immediate and residual effects of poultry manure and chemical fertilizer on the grain yield (t ha -1) of rice in Boro-Fallow-T. Aman cropping pattern at BRRI, Gazipur, 2009-10.
Treatment Immediate effect (Boro grain yield) Residual effect (T. Aman grain yield)
2009 2010 Mean 2009 2010 Mean
T1 2.53 2.86 2.70 2.71 2.54 2.63
T2 5.75 5.84 5.80 3.02 3.49 3.26
T3 6.24 6.15 6.20 3.17 3.56 3.37
T4 5.86 5.98 5.92 3.33 3.73 3.53
T5 5.36 5.72 5.54 3.34 3.36 3.35
T6 5.84 5.94 5.89 3.43 3.38 3.41
T7 6.14 6.25 6.20 3.46 3.48 3.47
T8 5.68 6.05 5.87 3.06 3.51 3.29
LSD (0.05) 0.19 0.23 0.27 0.21
CV (%) 1.62 1.55 2.31 2.16

74 Rahman et al
Table 2. Immediate and residual effects of poultry manure and chemical fertilizer on the straw yield (t ha-1) of rice in Boro-Fallow-T. Aman cropping pattern at BRRI, Gazipur, 2009-10.
Treatment Immediate effect (Boro grain yield) Residual effect (T. Aman grain yield)
2009 2010 Mean 2009 2010 Mean
T1 2.77 3.19 2.98 3.17 3.33 3.25
T2 6.17 6.34 6.26 3.65 6.10 4.88 T3 6.54 6.60 6.57 4.47 6.18 5.33 T4 6.65 6.34 6.50 4.62 6.24 5.43 T5 5.68 6.22 5.95 3.78 5.33 4.56 T6 6.23 6.37 6.30 3.99 5.64 4.82 T7 6.67 6.70 6.69 4.01 5.83 4.92 T8 5.93 6.52 6.23 4.03 6.27 5.15
LSD (0.05) 0.16 0.18 0.62 0.38
CV (%) 2.54 2.35 2.75 2.62
Nutrient uptake of rice There is wide variation in nutrient uptake influenced by different rates of poultry manure with chemical fertilizer (Table 3). The highest N and P uptake was observed in T4 treatment where PM was applied @ 3 t ha-1 with IPNS based inorganic fertilizers followed by treatment T7 where PM was applied @ 3 t ha-1 with 50% STB dose. The present observation was similar with the earlier findings (Rahman et al., 2009). The reasons may be the higher nutrient concentration in poultry manure (Saha et al., 2004) and literatures suggest that poultry manure is a good source of P (Griffin et al., 2003). Similar trend was also observed in case of other nutrients (K and S) uptake by rice in both years. Apparent nutrient balance Apparent nutrient balance as influenced by different rates of poultry litter with chemical
fertilizer was studied. In calculating apparent nutrient balance it is assumed that 30 kg N from irrigation water and 20 kg N from BNF (Biological nitrogen fixation) was considered. Assuming that Boro rice crop requires 100 cm water ha-1, thus the amount of P and K through irrigation water was 0.6 kg and 14 kg ha-1 respectively.
It was observed that the apparent nutrient balance in the control plot was always negative for all the treatments since no fertilizer or PM was added to the plots. Nitrogen replenishment through different rates of poultry manure with chemical fertilizer was not enough to balance N removal by crops since much of the applied N was lost from the soil (Fig. 1). Phosphorous balance was positive in all poultry manure treated plots irrespective of chemical source. These results were similar with the findings of some earlier works (Hossain et al., 2010 ; Ali et al., 2009).
Table 3. Nitrogen, phosphorous, potassium and sulphur uptake by rice as influenced by poultry manure, T. Aman.
Treat. N uptake (kg ha-1) P uptake (kg ha-1) K uptake (kg ha-1) S uptake (kg/ha)
2009 2010 Total 2009 2010 Total 2009 2010 Total 2009 2010 Total
T1 50 49 99 9 12 21 49 44 93 7 44 51
T2 70 84 154 12 18 30 60 78 84 9 80 89
T3 87 90 177 14 18 32 72 82 154 10 82 92
T4 93 96 189 15 18 33 75 91 166 11 92 103
T5 67 76 143 12 15 27 61 81 142 8 82 90
T6 81 85 166 12 16 28 66 83 149 9 84 93
T7 84 93 177 13 17 30 69 79 148 9 77 86
T8 81 89 170 12 14 26 66 77 143 8 77 85
LSD (0.05) 11.29 10.28 1.35 1.87 10.07 12.33 1.0 11.82

Integrated Effects of Poultry Manure and Chemical Fertilizer on Yield 75
Phosphorous balance was higher where
poultry litter was applied at 3 t ha-1 basis either
with STB or IPNS based compared to sole
applied chemical fertilizer. But in case of K, it
was evident that K uptake by the crop is far
exceeded than that was replenished from
fertilization. Sulphur also showed a positive
nutrient balance in all poultry manure applied
treatments which are in agreement with the
findings of Haque et al. (2001).
Economic analysis
The application of poultry manure either with
IPNS or 50% STB based chemical fertilizer
increased gross and net return than sole
application of STB chemical fertilizer (Table 4).
The highest gross and net return was obtained
in the treatment T7 where PM was applied @ 3
t ha-1 with 50% STB chemical fertilizer
followed by the treatment T3 and T4 where PM
was applied @ 2 and 3 t ha-1 with IPNS based
chemical fertilizer respectively (Table 4).
Among the PM treatment the lowest net return
was obtained from PM 1 t ha-1 with IPNS
based chemical fertilizer. But the MBCR was
highest (4.82) in the treatment T4 where 3 t ha-1
PM plus IPNS based chemical fertilizer were
applied followed by T3 i.e. PM 2 t ha-1 with
IPNS based chemical fertilizer (4.71). Almost
similar result was found by Rahman et al.,
(2009).
Fig. 1. Integrated use of poultry manure and chemical fertilizers on the apparent nutrient balance of rice. BRRI, Gazipur,
2009-10 (Average of two years).
76 Rahman et al
Table 4. Integrated use of poultry manure and chemical fertilizers on marginal benefit-cost ratio of rice. BRRI, Gazipur 2009-10 (Average of two years).
Treatment
Yield (t ha-1) TVC (Tk ha-1)
Return (Tk ha-1) MBCR
GY SY Gross Added Net
T1 5.33 6.23 0 92410 - 92410 -
T2 9.06 11.14 18003 158180 65770 140177 3.65
T3 9.57 11.90 15919 167350 74940 151431 4.71
T4 9.45 11.93 15193 165610 73200 150417 4.82
T5 8.89 10.51 14132 154370 61960 140238 4.38
T6 9.30 11.12 15405 161740 69330 146335 4.50
T7 9.67 11.61 16666 168270 75860 151604 4.55
T8 9.16 11.38 24711 160160 67750 135449 2.74
Note: Price: Rice grain= Tk 15 kg-1 and Rice straw= Tk 1.5 kg-1, Cost of poultry litter 1000 Tk t-1. Chemical fertilizer applied as Urea, TSP, MP and Gypsum. Fertilizer cost: Urea= Tk 10.00 kg-1, TSP= Tk 40.00 kg-1, MP= Tk 35.00 kg-1, Gypsum= Tk 7.00 kg-1. Labour wage= Tk 150 day-1, 3 man days ha-1 for fertilizer and manure application and 2 man days ha-1 for per ton additional products including by products.
Nutrient status of the post-harvest soil
Different nutrients in the post-harvest soil
increased slightly with the application of PM
in the experimental plots. Irrespective of rate
of poultry manure, the percent organic carbon
and nitrogen were increased insignificantly in
the plots compared to control plot (Table 5).
Zaman et al., (2002) reported that the organic
matter and residual N remaining in the soil
was greater with poultry manure than with
chemical fertilizer. The soil available P was
increased significantly after application of 3 t
ha-1 PM in the soil over control. Hossain et al.,
(2010) found that nitrogen based manure or
compost application resulted in available soil P
levels that were significantly greater than
those for the P-based manure or compost
application. Similar trend was also obtained in
case of other available nutrients in the post
harvest soil. Table 5. Nutrient status of the post-harvest soil influenced by poultry manure with chemical fertilizer.
Treatment OC (%) Total N (%) Available P (ppm) Exch. K (meq/100g soil)
T1 1.49 0.14 5.91 0.24
T2 1.63 0.16 7.67 0.25
T3 1.64 0.16 10.08 0.25
T4 1.69 0.17 11.33 0.25
T5 1.57 0.15 6.68 0.25
T6 1.62 0.16 7.67 0.26
T7 1.68 0.16 10.67 0.25
T8 1.52 0.15 6.18 0.25
LSD (0.05) 0.039 0.010 1.23 0.029
Initial soil nutrients 1.40 0.14 5.77 0.14

Integrated Effects of Poultry Manure and Chemical Fertilizer on Yield 77
CONCLUSION From the above findings it appears that PM @ 2 t ha-1 with IPNS based chemical fertilizer dose or PM @ 3 t ha-1 with 50% chemical fertilizer dose may be the suitable combination for obtaining higher grain yield of BRRI dhan29 in wetland Boro rice culture. Some residual effect of PM was also observed in the succeeding T. Aman rice. A positive nutrient balance of P and S was observed in the combined use of poultry manure and chemical fertilizer treated plots but other nutrients like N and K remained in negative balance.
REFERENCES Ali, M E, M R Islam and M Jahiruddin. 2009. Effect of
integrated use of organic manures with chemical
fertilizers in the Rice-Rice cropping pattern and its
impact on soil health. Bangladesh J. Agril. Res. 34(1):
81-90.
Griffin, T S, C W Honecutt and Z He. 2003. Changes in soil
phosphorous from manure application. Soil Science
Soc. Am. J. 67:645-653.
Haque, M Q, M H Rahman, F Islam, J Rijpma and M M
Kadir. 2001. Integrated nutrient management in
relation to soil fertility and yield sustainability
under wheat-mung-T. Aman cropping pattern.
Online J. Biol. Sci. 1(8): 731-734.
Hossain, A T M S, F Rahman, P K Saha and A R M
Solaiman. 2010. Effect of different aged poultry litter
on the yield and nutrient balance in Boro rice
cultivation Bangladesh J. Agril. Res. 35(3): 497-505.
Mahajan, A and R Sharma. 2005. Integrated nutrient
management (INM) system- Concept, need and
future strategy. Agrobios Newsletter, 4 (3), 29-32.
Mahajan, A, A K Choudhary and R M Bhagat. 2002.
Integrated plant nutrient management (IPNM)
system for sustainability in cereal based cropping
system. Indian Farmer's Digest, 35 (7), 29-32.
Miah, M A M, M Ishaque and P K Saha. 2006. Integrated
nutrient management for improving soil health and
rice production. Proc. Twenty first BRRI- DAE Joint
Workshop on Bridging the Rice Yield Gap for Food
Security. BRRI, Gazipur, Bangladesh, 19-21
September 2006. 11, pp. 1-15.
Miah, M A M. 2006. Completion report on integrated soil
fertility and fertilizer management for rice based
cropping systems 1999-2000 to 2004-2005. Soil
Science Division, BRRI, Gazipur, June 2006. p. 128.
Rahman, F, A T M S Hossain, M Akter and R Khanam.
2009. Effect of different aged poultry litter on
growth yield and economics of wetland Boro rice.
Eco-friendly Agril. J. 2(11): 920-925.
Rijpma, J and M Jahiruddin. 2004. Final report on national
strategy and plan for use of soil nutrient balance in
Bangladesh.
Saha, P K, A T M S Hossain, U A Naher and M A Saleque.
2004. Nutrient composition of some manure and crop
residues. Bangladesh J. Agril. Res. 29(1): 165-168.
Singh, M, V P Sammi and K Reddy. 2001. Effect of
integrated use of fertilizer nitrogen and farmyard
manure on transformation of N, K and S and
productivity of rice-wheat system on a Vertisol. J.
Indian Soc. Soil Sci. 49: 430-435.
Zaman, S K, G M Panaullah, M Jahiruddin, M H Mian and
M R Islam. 2002. Integrated nutrient management
for sustainable yield in Rice-Rice cropping systems.
Paper was presented in 17th WCSS symposium at
Thailand on 14-21 August 2002.
Bangladesh Rice J. 22 (2) : 79-87, 2018, doi.org/10.3329/brj.v22i2.44045
1Hybrid Rice Division, 2Genetic Resources and Seed Division, BRRI, Gazipur, Bangladesh. *Corresponding author’s E-mail: [email protected]
Variability Assessment of Different Maintainer Lines for Hybrid Rice Development Based on
Qualitative Traits
L F Lipi1*, M J Hassan1, AAkter1, P L Biswas1, M U Kulsum1, A Ansari1 and M Z Islam2
ABSTRACT
The assessment of genetic diversity among nineteen maintainer lines was studied based on thirteen qualitative traits. The single linkage clustering, morphological dendogram were performed to assess the traits. Most of the traits showed variation in different maintainer lines except auricle colour. On the basis of flag leaf attitude, a maximum four groups were formed with erect, semi-erect, horizontal and descending type leaf angle. The maintainer line BRRI20B has awn tip, which is unique from the rest of the studied maintainer lines. Nineteen maintainer lines were grouped into four different clusters and a considerable level of variability was displayed for most of the traits examined. The clustering pattern revealed, cluster I was the largest and consisted seven maintainer lines. Among them maintainer lines BRRI52B and BRRI60B were the most closely associated. Cluster II represent diverse sources materials and its revealed non-correspondence of geographic diversity with genetic divergence. Thus the cluster analysis has revealed the genetic variation and the traits contributing for the variation. Hence, this maintainer lines can be utilized for trait improvement in breeding programmes for the traits contributing for major variation. Key words: Maintainer line, genetic variability, qualitative traits
INTRODUCTION
Rice (Oryza sativa L.) is considered as one of
the most important cereal crops and the staple
food for more than half of the world’s
population (Jiang et al., 2013).Rice production
area of Bangladesh is about 10 million hectares
of land in which the area planted to hybrid rice
was around 0.7 Mha, which contributed 3-4
MT of additional rice to the total rice
production in the country (AIS, 2018).
Although Bangladesh is self-sufficient in cereal
production, there is a great challenge of rapid
growth of the population, decreasing arable
land, reducing productivity and global climate
change. We need to increase the production
vertically to meet up the food demand of
growing population and need to produce more
rice per unit area. Hence hybrid rice
technology has proved to be one of the most
feasible and readily adoptable approaches as
they yield about 15-20 percent more than the
best of the improved or high yielding varieties
(Virmani, 1994). The performance and
heterosis of hybrids are associated with genetic
divergence between their parental lines.
Selection of suitable parental lines like
cytoplasmic male sterile line (CMS),
maintainer line and restorer lines to develop
heterotic combinations can be facilitated by
determining genetic divergence among them.
Due to the importance of rice as one of the
major world food crops, its genetic diversity
has created great interest of researchers.
Genetic diversity in the available gene pool is
the foundation or the raw material of all plant
improvement programmes. Several genetic
diversity studies have been successfully

80 Lipi et al
utilized in different crop species based on
quantitative and qualitative traits in order to
select genetically distant parents for
hybridization (Islam et al., 2018; Bedoya et al.,
2017; Ahmed et al., 2016; Islam et al., 2016). The
precise assessment of variability within the
parental lines is necessary not only for better
understanding of the differentiation pattern
but also to assist in selecting appropriate
materials to broaden the genetic base and the
genetic improvement of cultivars. Careful
selection of parental lines on the basis of their
genetic diversity may lead to the development
of hybrids with higher yield potential than
parents and standard check varieties (Julfiquar
et al., 1985).
The majority of programmes involved in
the improvement of rice productivity mainly
focused on the yield aspects. On the other
hand, quantitative traits and other important
qualitative characters have been neglected.
Morphological characterization using
qualitative traits is a preliminary step to
estimate the variability and relationship
among cultivars. Qualitative characters are
important for plant descriptions (Kurlovich,
1998) and are influenced by consumer
preference, socio-economic scenario and
natural selection (Hien et al., 2007). Incase of
hybrid rice, so far very limited work has been
done on diversity of parental lines using
quantitative characters but no work has been
accomplished on diversity of parental lines
using agronomic qualitative traits. Hence,
keeping the importance of hybrid rice and
scant literature on these aspects, the present
investigation was undertaken as a first attempt
with the objective of variability assessment of
different maintainer lines for hybrid rice
development based on qualitative traits.
MATERIALS AND METHODS
Present investigations were conducted at the
Bangladesh Rice Research Institute (BRRI)
farm, Gazipur. Nineteen maintainer lines were
characterized for 13 qualitative traits. Among
them 17 maintainer lines were developed
locally and two of them namely IR78355
IR75595 originated from International Rice
Research Institute (IRRI) (Table 1). The
experiment was laid out in a randomized
complete block design (RCBD) with three
replications during T. Aman season 2015. The
BRRI developed maintainer lines were
BRRI19B, BRRI20B, BRRI22B, BRRI25B,
BRRI42B, BRRI52B, BRRI55B, BRRI60B,
BRRI63B, BRRI67B, BRRI69B, BRRI70B,
BRRI71B, BRRI73B, BRRI76B, BRRI79B,
BRRI81B. The maintainer lines originated from
IRRI were IR75595B, IR78355B. Twenty-one-
day old seedlings were transplanted at the rate
of one seedling per hill with plant to plant
distance of 15 cm and row to row distance of
20 cm. The standard cultivation practices
prescribed for hybrid rice were followed
precisely. Observations on maintainer lines
were recorded for 13qualitative traits viz ligule
colour, ligule shape, auricle colour, collar
colour, blade colour, blade pubescence, basal
leaf sheath colour, susceptibility to BLB, angle
of flag leaf, stigma colour, awn: distribution,
panicle exsertion, and seedcoat colour. The
phenotypically distinguishable qualitative
traits are used as a preliminary tool for
assessing genetic variability.
These characters were scored based on
‘Descriptors for cultivated rice (Oryza sativa
L.)’ developed by GRSD, BRRI (2018). Ten
random plants from each entry were selected
for recording observations. Frequency
distributions for all of the qualitative traits
were computed. Cluster analysis was done to
group the genotypes into a dendogram by
using PAST software.

Variability Assessment of Different Maintainer Lines for Hybrid Rice Development 81
Table 1. Composition of clusters based on similarity co-efficient for thirteen qualitative characters in nineteen maintainer lines.
Cluster No. of maintainer lines Maintainer line Frequency (%)
I 7 BRRI52B, BRRI60B BRRI63B, RRI76B, BRRI67B, RRI81B, BRRI25B
36.84
II 5 BRRI71B, IR78355B, IR75595B, BRRI73B, BRRI79B
26.32
III 4 BRRI55B, BRRI69B, BRRI22B, BRRI70B 21.05
IV 3 BRRI42B, BRRI19B, BRRI20B 15.79
RESULTS AND DISCUSSION
Qualitative characters are important for plant
description (Kurlovich, 1998) and mainly
influenced by the consumers preference, socio-
economic scenario and natural selection (Das
and Ghosh, 2011). These qualitative characters
are less influenced by the various
environmental conditions. The present study
exhibits considerable level of variability in
most of the observed qualitative traits except
auricle colour. Figure 1 shows the graphical
representation of frequency distribution for 13
qualitative traits. The majority of the
maintainer lines were characterized by white
ligule colour (89.47%), 2-cleft ligule shape
(63.15%). Again most of the maintainer lines
showed pale green collar colour (57.89%),
green blade colour (47.36%), intermediate
blade pubescence (63.15%), green basal leaf
sheath colour (73.68%), very low susceptibility
to BLB (84.21%), semi-erect angle of flag leaf
(68.42%) and white stigma colour (89.47%).
Panicle exertion included well exserted
(52.63%), moderately exerted (31.57%), and
just exserted (15.74%). On the basis of awning
character, most of the maintainer lines were
found to be awn less (94.73%), only one
maintainer line BRRI20B showed awn tip only
(5.26%). This type of unique character could be
efficiently used in identification and protection
from biopiracy. Among the 19 maintainer lines
most of the lines showed light brown seedcoat
colour (68.42%) followed by brown seedcoat
colour (31.57%). Similar findins were reported
by Akter et al., (2017), Moukoumbi et al.,
(2011), Ahmed et al.,(2015), Parikh et al., (2012),
Singh and Mishra., (2013), Pragnya et al., (2018)
and Shamim, M Z and Sharma, V K (2014).
However, Parikh et al., (2012) observed
green basal leaf sheath colour (84.5%), white
ligule colour (94.7%). M Z Islam (2017) and
Pragnya et al., (2018) found 2-cleft shaped
ligule in all jhum rice from hilly areas
landraces and soft rice genotypes respectively.
Monika et al., (2007) and Bora et al., (2008) used
the same traits to characterize nineteen and
eleven cultivars of rice respectively. Ahmed et
al. (2015) also reported that majority of the
genotypes possess green blade colour (47%)
and white colour of stigma (90%). Singh and
Mishra (2013) reported pubescence of blade
surface (57%), semi erect flag leaf attitude
(75%), awns absent (91%), well exserted
panicle (57%). Pragnya et al., (2018) also found
semi-erect flag leaf attitude in 14 soft rice
genotypes. Shamim and Sharma (2014) found
light brown seedcoat colour (38.8%) among
different rice varieties for qualitative traits.
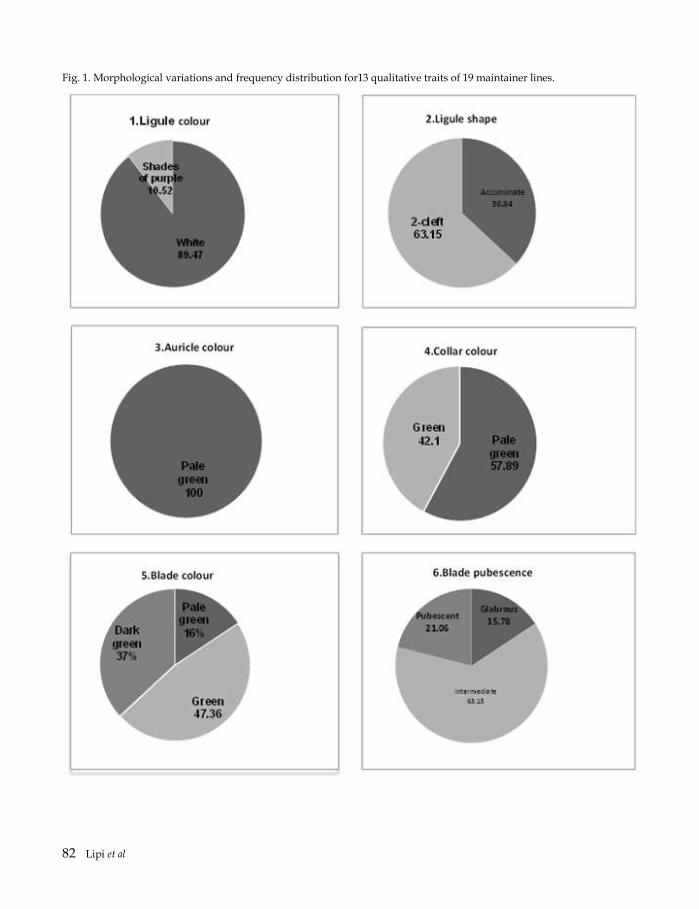
82 Lipi et al
Fig. 1. Morphological variations and frequency distribution for13 qualitative traits of 19 maintainer lines.

Variability Assessment of Different Maintainer Lines for Hybrid Rice Development 83
Fig. 1. Continued.

84 Lipi et al
All the maintainer lines were grouped into four major clusters at 0.25 minimum distance between clusters and its frequency distribution (Fig. 2). The value of 0.25 was fixed only for the convenience of explanation under this study. Cluster I contained maximum seven entries followed by five in cluster II, four in cluster III and three in cluster IV. Thus cluster I, cluster III and IV represented only BRRI developed maintainer lines but cluster II represented the both BRRI and IRRI developed maintainer lines. The genotypes from the same geographical origin mostly grouped together; however, the less frequent genotypes from different origins also grouped within the same cluster. Maintainer
lines BRRI52B and BRRI60B grouped into same cluster at minimum distance within clusters.
Therefore, these two maintainer lines can
be considered as morphologically closest and
might possess same genetic background.
According to Ali et al., (2000) cluster analysis
has the singular efficacy and ability to identify
crop accessions with the highest level of
similarity. Even though the dendogram also
proved the above statement in terms of
similarity existing among the tested
maintainer lines,a wide variability among
them was identified. Suriyagoda et al., (2011)
have reported a similar variability of rice
varieties.
Fig. 2. Dendogram of 19 maintainer lines of hybrid rice obtained through single linkage cluster analysis.

Variability Assessment of Different Maintainer Lines for Hybrid Rice Development 85
As per the scattered diagram (Fig. 3), the
maintainer lines were apparently distributed
into four clusters. The results indicated that the
maintainer linesthat were placed far away
from the centroid were more genetically
diverse, while the genotypes that were placed
near the centroid possessed more or less
similar genetic background. Similar findings
were also reported by other authors (Siddique
et al., 2016a, 2016b).
However, the selection of parents for hybridization from different clusters may provide more variability and high heterotic effect. Similar finding was also reported by Pradhan and Roy (1990). Similarly, the tested qualitative traits can be utilized to broaden the genetic base and for the improvement of parental lines. Further, Tehrim et al., (2012) also proved that agro-morphological traits can be used effectively to characterize the rice cultivars.
Fig. 3. Scatter diagram of 19 maintainer lines based on their qualitative traits.
CONCLUSION The present study shows a considerable level of variability among the studied maintainer lines. It interprets a considerable amount of morphological variation along with the qualitative traits of maintainer lines. The results show that cluster I, cluster III and IV represented only BRRI developed maintainer lines but cluster II represented both BRRI and IRRI developed maintainer lines. The
genotypes from the same geographical origin mostly grouped together; however, the less frequent genotypes from different origins also grouped within the same cluster. The selection of parents for hybridization from different clusters will provide more variability and high heterotic effect. Among the 13 traits, panicle exsertion and flag leaf angle are considered as important traits for hybrid rice development and selection could be done considering these traits.

86 Lipi et al
REFERENCES
Ahmed, M S, M Khalequzzaman, M K Bashar and A K M
Shamsuddin. 2015. Qualitative agro-morphological
character diversity of similar or duplicate named
rice (Oryza sativa L.) germplasm of Bangladesh. JBES.
7(4): 51-61.
Ahmed, M S, Bashar, M K and Shamsuddin, A K M. 2016.
Study of qualitative characters of Balam Rice (Oryza
sativa L.) landraces of Bangladesh. Rice Genomics
Genet. 7 (1): 1-8.
AIS. 2018. Krishi Diary 2016, Agricultural Information
Service, Khamarbari, Farmgate, Dhaka 1215,
Bangladesh.
Akter, N, M Z Islam, A Bhuiya, M A Siddique and M
Khalequzzaman. 2017. Distinctness of 45 irrigated
rice (Oryza sativa L.) landraces of Bangladesh
through agro-morphological traits. Eco-friendly
Agril. J.10 (10): 100-107.
Ali, S S, S J H Jafri, T Z Khan, A Mahmood and M A Butt.
2000. Heritability of yield and yield components of
rice. Pak. J. Agric. Res. 16: 89 - 91.
Bedoya, C A, S Dreisigacker, S Hearne, J Franco, C Mir and B
M Prasanna. 2017. Genetic diversity and population
structure of native maize populations in Latin America
and the Caribbean. PLOS ONE. 12 (4): e0173488.
https://doi.org/10.1371/journal.pone.0173488.
Bora, R, S D Deka and P Sen. 2008. Identification of rice
varieties of Assam, based on grain characters and
reaction to certain chemical tests. Seed Research. 36
(1): 51-55.
Das, S, A Ghosh. 2011. Characterization of rice germplasm
of West Bengal. Oryza. 47(3): 201-205.
GRSD, BRRI. 2018. Descriptors for cultivated rice (Oryza
sativa L.).Genetic Resources and Seed Division,
Bangladesh Rice Research Institiute, Gazipur 1701,
Bangladesh.
Hien, N L, WA Sarhadi, Y Hirata and Y Oikawa.2007.
Genetic diversity of morphological responses and
the relationships among Asia aromatic rice (Oryza
sativa L.) cultivars. Tropics 16: 343–355.
Islam, M Z, M Khalequzzaman, M A Siddique, N Akter, M
S Ahmed and M A Z Chowdhury. 2017. Phenotypic
characterization of jhum rice landraces collected
from Rangamati district in Bangladesh. Bangladesh
Rice J. 21(1): 47-57, 2017.
Islam, M Z, M Khalequzzaman, M K Bashar, N A Ivy, M
MHaque and M A K Mian. 2016. Variability
assessment of aromatic and fine rice germplasm in
Bangladesh based on quantitative traits. The Sci.
World J. http://dx.doi.org/10.1155/2016/ 2796720.
Islam, M Z, N Akter, T Chakrabarty, A Bhuiya, M A
Siddique and M Khalequzzaman. 2018. Agro-
morphological characterization and genetic diversity
of similar named aromatic rice (Oryza sativa L.)
landraces of Bangladesh. Bangladesh Rice J. 22 (1):
45-56
Jiang, S H, H Zhou, D Z Lin, Y J Dong, S H Ye and X M
Zhang. 2013. Identification and gene mapping of a
thermo-sensitive leaf-colour mutant at seedling
stage in rice. Chin J Rice Sci. 27: 359 - 364.
Julfiquar, A W, S S Virmani and A L Carpena. 1985.
Genetic divergence among some maintainer and
restorer lines in relation to hybrid breeding in rice
(Oryza sativa L.). Theory of Applied Genet. 70(6):
671-678.
Kurlovich, B S. 1998. Species and intraspecific diversity of
white, blue and yellow lupins. Plant genetic
Resource Newsletters. 115: 23-32.
Monika, A, A Joshi, K Navaraj, R C Sharma, P Singh and T
S Bharaj. 2007. Varietal characterization of rice
(Oryza sativa L.) based on morphological descriptors.
Seed Research. 35 (2): 188
Moukoumbi, Y D, M Sie, R Vodouhe, B N’dri, B Toulou, S
A Ogunbayo and A Ahanchede. 2011. Assessing
phenotypic diversity of interspecific rice varieties
using agromorphological characterization. J. of Pl.
Breed. and Crop Sci. 3(5): 74-86.
Parikh, M, N K Motiramani, N K Rastogi and B Sharma.
2012. Agro-morphological and quality
characterization of Dubraj group from aromatic Rice
germplasm of Chhattisgarh and Madhya Pradesh.
Soc. for pl. res. 25 (2): 387394.
Pradhan, K and A Roy. 1990. Genetic divergence in rice.
Oryza. 27(4): 415-418.
Pragnya, K, K V Radha Krishna, L V Subba Rao and K
Suneetha. 2018. Studies on Morphological
Characterization in Soft Rice (Oryza sativa L.)
Genotypes. Int. J. Curr. Microbiol. App. Sci. 7(05):
1348-1374.
Shamim, M Z and V K Sharma. 2014. Assessment of
variability and genetic diversity among different rice
varieties for qualitative traits.Indian J. Agric. Res. 48
(3): 237-240.
Siddique, M A, M Khalequzzaman M M Islam, Kaniz
Fatema and M A Latif. 2016a. Molecular
Variability Assessment of Different Maintainer Lines for Hybrid Rice Development 87
characterization and genetic diversity in
geographical indication (GI) rice (Oryza sativa L.)
cultivars of Bangladesh. Braz. J. Bot. DOI
10.1007/s40415-016-0271-1
Siddique, M A, M Khalequzzaman, K Fatema, M Z Islam,
M M Islam and M A Z Chowdhury. 2016b.
Molecular characterization and genetic diversity of
Aman rice (Oryza sativa L.) landraces in Bangladesh.
Bangladesh Rice J. 20 (2): 1-1
Singh, S K and D K Mishra. 2013. Principal component
analysis of inter sub specific RILs of rice for the
important traits responsible for yield and yield
quality. JNKVV Research Journal. 47(2):185-190.
Suriyagoda, L D B, R M M S, Thilakarathne, S P
Nissankaand S Samitha. 2011. Morphological
variation in selected rice (Oryza sativa L.) germplasm
of Sri Lanka. J. Natn. Sci. Foundation Sri Lanka. 39:
129 - 137.
Tehrim, S, Z H Pervaiz, M Y Mirza, M A Rabbani and M S
Masood. 2012. Assessment of phenotypic variability
in rice (Oryza sativa L.) cultivars using multivariate
analysis. Pak. J. Bot. 44: 999 - 1006.
Virmani, S S. 1994. Prospects of hybrid rice in the tropics
and subtropics. In: Hybrid rice technology: New
development and future Prospects (Ed.). S S
Virmani, IRRI, Manila, Philippines, pp.7-19.


