

FUNDAÇÃO GETULIO VARGAS ESCOLA DE ADMINISTRAÇÃO DE EMPRESAS DE SÃO PAULO
CRISTIANO AUGUSTO BORGES FORTI
BANK DIVIDENDS AND SIGNALING TO INFORMATION-SENSITIVE DEPOSITORS.
SÃO PAULO OUTUBRO DE 2012

CRISTIANO AUGUSTO BORGES FORTI
BANK DIVIDENDS AND SIGNALING TO INFORMATION-SENSITIVE DEPOSITORS.
Tese apresentada à Escola de Administração de Empresas de São Paulo da Fundação Getulio Vargas, como requisito para obtenção do título de Doutor em Administração de Empresas. Campo de conhecimento: Mercados Financeiros e Finanças Corporativas Orientador: Prof. Dr. Rafael Felipe Schiozer
SÃO PAULO
OUTUBRO DE 2012

Forti, Cristiano Augusto Borges. Bank dividends and signaling to information-sensitive depositors/ Cristiano Augusto Borges Forti - 2012. Orientador: Rafael Felipe Schiozer. Tese (doutorado) - Escola de Administração de Empresas de São Paulo. Orientador: Rafael Felipe Schiozer. Tese (doutorado) - Escola de Administração de Empresas de São Paulo. 1. Dividendos. 2. Bancos - Brasil. 3. Bancos - Finanças. 4. Investidores (Finanças). I. Schiozer, Rafael Felipe. II. Tese (doutorado) - Escola de Administração de Empresas de São Paulo. III. Título.
CDU 658.155.2
CRISTIANO AUGUSTO BORGES FORTI
BANK DIVIDENDS AND SIGNALING TO INFORMATION-SENSITIVE DEPOSITORS.
Tese apresentada à Escola de Administração de Empresas de São Paulo da Fundação Getulio Vargas, como requisito para obtenção do título de Doutor em Administração de Empresas. Campo de conhecimento: Mercados Financeiros e Finanças Corporativas Data de aprovação: _____ / _____ / _____ Banca Examinadora: Prof. Dr. Rafael Felipe Schiozer (Orientador - EAESP/FGV) Prof. Dr. Hsia Hua Sheng (EAESP/FGV) Prof. Dr. Antonio Gledson de Carvalho (EAESP/FGV) Prof. Dr. Paulo Renato Soares Terra (EA/UFRGS) Prof. Dr. Bruno Cara Giovannetti (FEA/USP)
Agradecimentos
Agradeço,
Ao meu orientador, Rafael Felipe Schiozer, por todas as ideias, oportunidades e ao
suporte que me ofereceu ao longo do meu programa de doutorado. Com ele aprendi muito,
academicamente e pessoalmente, e levarei comigo seus ensinamentos.
Aos meus amigos de intercâmbio na University of Illinois at Urbana-Champaign, Luiz
Ricardo Kabbach de Castro, Rafael Almeida da Matta, Igor Felizatti da Cunha e Guilherme
Kirch pelas nossas infindáveis, calorosas e ricas conversas e também pela atenção e amizade.
Aos Professores Heitor Almeida e Murillo Campello, por permitirem minha visita a
University of Illinois e por seus conselhos e ensinamentos.
Aos professores da EAESP, pela contribuição à minha formação acadêmica. Em
especial ao Professor Richard Saito por proporcionar uma disciplina tão desafiadora a seus
alunos.
Aos funcionários da EAESP, por todo auxílio que me foi dado.
A CAPES, que patrocinou o meu programa de doutorado.
Ao meu pai Ajair, a minha mãe Marina e a minha irmã Ludmila, pelo apoio
incondicional que me deram ao longo da minha vida.
Agradeço especialmente minha esposa Daniella. Obrigado por me ajudar de várias
maneiras na conclusão deste trabalho.

RESUMO
Esta tese investiga se a composição do endividamento dos bancos afeta sua política de dividendos. Identificou-se que investidores sensíveis a informações (investidores institucionais) são alvos de sinalização através de dividendos por parte dos bancos. Utilizando uma base de dados exclusiva de bancos brasileiros, foi possível identificar vários tipos de credores, especificamente, investidores institucionais, empresas não financeiras e pessoas físicas, que são alvos potenciais de sinalização por dividendos. Adicionalmente, a existência de vários bancos de capital fechado, controlados e geridos por um pequeno grupo de acionistas, em que a sinalização direcionada a acionistas é implausível, permite inferir que bancos que utilizam mais fundos de investidores sensíveis a informações (institucionais) pagam mais dividendos, controlando por diversas características. Durante a crise financeira, este comportamento foi ainda mais pronunciado. Esta relação reforça o papel dos dividendos como uma forma custosa e crível de comunicar sobre a qualidade dos ativos dos bancos. A hipótese de que os dividendos podem ser utilizados como uma forma de expropriação dos depositantes por parte dos acionistas é refutada, uma vez que, se fosse esse o caso, observar-se-ia esse maiores dividendos em bancos com depositantes menos sensíveis a informação. Além disso, foi verificada uma relação negativa entre o pagamento de dividendos e o custo de captação (juros pagos em certificados de depósito bancário) e uma relação positiva de dividendos com o tamanho e com os lucros passados, e que os bancos de capital fechado pagam mais dividendos do que os de capital aberto, uma descoberta que também se alinha com a ideia de que os depositantes seriam os alvos da sinalização por dividendos. Finalmente, encontrou-se também uma relação negativa entre dividendos e adequação de capital do bancos, o que indica que pressões regulatórias podem induzir os bancos a pagar menos dividendos e que o pagamento de dividendos é negativamente relacionado com o crescimento da carteira de crédito, o que é consistente com a ideia de que os bancos com maiores oportunidades de investimento retêm seus lucros para aumentar seu patrimônio líquido e sua capacidade de conceder crédito.
Palavras-chave: política de dividendos, dividendos, bancos brasileiros, sinalização.

ABSTRACT
This study investigates whether the composition of bank debt affects payout policy. I identify that information-sensitive depositors (Institutional Investors) are targets of dividend signaling by banks. I use a unique database of Brazilian banks, for which I am able to identify several types of debtholders, namely Institutional Investors, nonfinancial firms and individuals, which are potential targets of dividend signaling. I also exploit the features of the Brazilian banking system, such as the existence of several closely held banks, owned and managed by a small group of shareholders, for which shareholder-targeted signaling is implausible, and find that banks that rely more on information-sensitive (institutional) depositors for funding pay larger dividends, controlling for other features. During the financial crisis, this behavior was even more pronounced. This relationship reinforces the role of dividends as a costly and credible signal of the quality of bank assets. I also find that payout is negatively related to the banks’ cost of funding (interest rates paid on certificates of deposits), that dividends have a positive relationship with size and past profitability and that closely held banks pay more dividends than publicly traded banks, a finding that is also in line with the idea that depositors are targets of dividend-signaling. Finally, I find a negative relationship between dividends and the capital adequacy ratio, which indicates that regulatory pressure may induce banks to pay less dividends and that payouts are negatively related to the growth of the loan portfolio, consistent with the idea of banks retaining earnings to increase equity and thus their lending capacity.
Keywords: payout policy, dividends, Brazilian banks, signaling.
JEL Classification: G35, G21
8
LISTA DE TABELAS
Table 1 – Summary of factors influencing dividend payments 17
Table 2 – Compilation of variables cited in the background section 29
Table 3 – Evolution of the brazilian banking institutions by group 34
Table 4 – Evolution of the level of concentration in brazilian banking industry 34
Table 5 – Descriptive statistics 36
Table 6 – Description of the regression variables 45
Table 7 – Descriptive statistics of dependent variables 47
Table 8 – Descriptive statistics of independent variables 48
Table 9 – Descriptive statistics of payout by group 49
Table 10 – Descriptive statistics of occurrences of each form of payment 50
Table 11 – Factors that affect the payment of dividends 57
Table 12 – Factors that affect the payment of dividends with iv 63
Table 13 – Probit regression for high level of dividends 64
Table 14 – Factors that affect dividends with placebo test 66
Table 15 – Factors that affect dividends with triple interaction 68
Table 16 – Factors that affect the payment of dividends for only closely held banks 70
Table 17 – Factors that affect the payment of high dividends for only closely held banks 72
Table 18 – Factors that affect only closely held banks with iv 73
Table 19 – Factors that affect the selection of banks by Institutional Investors 76

9
CONTENTS
1. Introduction ....................................................................................................................... 10 2. Background ....................................................................................................................... 15
2.1. Dividend policy .............................................................................................................. 15 2.2. Substitutes for dividends ................................................................................................ 20
2.3. Bank dividends and their differences. Theory and evidence. ........................................ 22 2.4. Bank dividends in Brazil ................................................................................................ 25
2.5. Institutional Investors ..................................................................................................... 26 2.6. Summary of used variables from previous studies ........................................................ 28
3. Data ................................................................................................................................... 31 3.1. Background on the Brazilian Financial System ............................................................. 31
3.2. Data sources and sample construction ........................................................................... 35 3.3. Investigation Model ....................................................................................................... 36
4. Results ............................................................................................................................... 47 4.1. Descriptive statistics and tests results ............................................................................ 47
4.2. Main Model: regression results ...................................................................................... 55 4.3. Robustness checks ......................................................................................................... 60
4.3.1. Model specification robustness tests .......................................................................... 60 4.3.2. Check for alternative explanations ............................................................................. 61
4.4. Placebo Tests ................................................................................................................. 65 4.5. Further signaling evidence in closely held banks .......................................................... 67
4.6. Endogenous relationship between Payout and Institutional Investors ........................... 74 5. Conclusion ......................................................................................................................... 77
6. References ......................................................................................................................... 79 7. Appendix 1: Tobit Models versus OLS models ................................................................ 87
10
1. Introduction
Dividend policy varies widely among firms and industries, and its effect on firm value
remains controversial for finance researchers. The banking industry is among the industries
with the largest payout. Dickens, Casey and Newman (2002) show that in 2000, whereas 51%
of industrial US firms have not registered dividend distribution, only 8% of banks have not.
Despite this fact, banks have received little attention in studies on dividends and are generally
excluded from the samples of studies on firm payout.
Miller and Modigliani (1961) suggest that dividends could be used by managers to
convey information on future earnings. This notion of dividend signaling was then formally
modeled by Bhattacharya (1979), Miller and Rock (1985), John and Williams (1985) and
many others. The basic idea is that information asymmetry is mitigated when managers use
dividends to communicate information on their firm’s prospects. Most of the previous
empirical research on the signaling effect of dividends has used stock price responses to
dividend changes, initiations and omissions to gauge the informational content of dividends.
These tests do not distinguish shareholders from debtholders as the targets of signaling and
assume that the information about asset value conveyed by the dividends to both types of
claimholders are reflected in stock prices.
In another stream of the financial literature, Easterbrook (1984) shows that dividends
may have an important role in mitigating manager-shareholder and shareholder-debtholder
agency conflicts. Specifically, debtholders may use bond indentures to restrain leverage,
including the imposition of limits on dividend payments. This finding has led to a wide body
of empirical literature on dividend restrictions (e.g., HEALY and PALEPU (1990)),
bondholder expropriation after debt issuance (e.g., LONG et al. (1994)) and cross-country
studies on the influence of investor protection and agency costs on dividend policy (LA
PORTA et al. (2000) and BROCKMAN and UNLU (2009), to name a few).

11
In banks, the potential expropriation of debtholders is more severe. Banks are typically
leveraged, and bank debt contracts (deposits) are standardized, with little or no room for the
imposition of indentures and specific covenants. On the other hand, deposits are generally
demandable. Therefore, debtholders can discipline bank managers from expropriation and
excessive risk-taking by withdrawing their funds from the bank. There is empirical evidence
that market discipline is exerted by holders of subordinated debt (e.g., FLANNERY and
SORESCU, 1996, and IANNOTTA, 2011) and uninsured depositors (PARK and
PERISTIANI, 1998, MARTINEZ-PERIA and SCHMUCKLER, 2001), which show that
excessive risk-taking is punished with higher required interest rates and slower deposit
growth.
Signaling with dividends reduces equity and thus is very costly for banks because of
regulatory capital adequacy requirements. Therefore, it is quite plausible that bank dividends
are regarded as a credible signal about the quality of their assets and future prospects to
shareholders and depositors. On the other hand, depositors may view excessive dividends as
an expropriation mechanism and a tool to violate the preference for debt over equity if banks
are in impending distress, as Acharya et al. (2009) note. As such, increasing dividends may
appear as a mixed signal to debtholders, particularly when asset opaqueness and informational
asymmetry are exacerbated and depositors are not able to discern whether a bank is in
financial distress (for example, during a financial crisis).
This study investigates whether the composition of bank debt affects payout policy.
For this purpose, I use a unique database comprising the types of holders of certificates of
deposits in the Brazilian banking system. My identification strategy exploits specific features
found in Brazilian banks to investigate the factors that affect the payment of dividends in
banks. In particular, I use two characteristics of the Brazilian banking industry: i) the
existence of many domestic banks that do not have publicly traded shares and are owned and

12
managed by a small group of people (hereafter, closely held banks), and ii) minimum
mandatory dividends for publicly traded banks, required by the Brazilian legal framework.
These two features of the Brazilian banking system allow us to pursue my
identification strategy. First, closely held banks, if owned and managed by a small group of
individuals (e.g., a family), have no need to signal future prospects to shareholders. Therefore,
if any signaling is taking place in these banks, it is directed to debtholders. Second, whereas
all banks are required by law to pay minimum dividends to their shareholders, closely held
Brazilian banks are able to circumvent the legal minimum dividend requirements, using a
simple maneuver that works as follows: shareholders decide, at the same meeting, to pay
dividends and use them to increase capital (i.e., the money does not even leave the boundaries
of the firm, even though financial statements will report a dividend payment). Consequently,
minimum dividends are not in fact mandatory for closely held banks. This maneuver is
virtually impossible for publicly traded banks because it requires the unanimous approval of
shareholders.
Most studies on dividends using Brazilian banks use reported dividends as a measure
of payout and neglect this maneuver that firms perform to circumvent minimum dividend
requirements, resulting in severe measurement errors.
Ben-David, Franzoni and Moussawi (2011) argue that Institutional Investors are more
reactive than individual investors to bad news because they have internal risk management
systems or funding requirements that may force a periodic revision of the asset allocation. The
model by Huang and Ratnovski (2011) suggests that short-term wholesale financiers of banks
react to negative public signals by withdrawing. Additionally, Institutional Investors are
different from other depositors because they are customers of the bank only on the liabilities
side, unlike individuals and non-financial firms, which usually take loans from banks. This
feature gives Institutional Investors a higher degree of freedom to move their resources from

13
one bank to another. Wermers (2011) also finds evidence that Institutional Investors are more
financially sophisticated and reactive to new information.
I find that, among closely held banks, those that rely on Institutional Investors for
funding pay larger dividends. This behavior is more pronounced during financial crises, when
these banks have a greater necessity to signal their solvency and ability to yield future cash
flows. Because Institutional Investors are more reactive to new information, debtholder
expropriation and the violation of the preference of debt over equity in these banks are
implausible. Were the banks engaging in expropriation, larger dividends would be observed
among banks that have less information-sensitive depositors. This result shows that dividends
are indeed a credible signal to debtholders (depositors).
In addition, I also identify a negative relationship between the payment of dividends
and the interest rate paid on certificates of deposits (CDs), a finding in line with the concept
that dividends are a costly signal (i.e., banks with a lower cost of capital pay larger
dividends). Additionally, my results support the Lintner (1956) model by finding dividend
payout to have a positive relationship with profitability. I also find that closely held banks pay
more dividends than publicly traded banks, which is in line with the signaling role of
dividends. I find payout to have a positive relationship with size and a negative correlation
with capital adequacy. In addition, I find that government-owned banks pay fewer dividends,
which is also consistent with the signaling theory of dividends, as government-owned banks
are perceived to enjoy an implicit guarantee and thus have less need to signal the quality of
their assets to depositors and other debtholders. I also find that dividends are negatively
related to the growth of the loan portfolio, which is consistent with the idea of firms retaining
earnings to increase equity and thus their lending capacity when they have good investment
opportunities.

14
Moreover, the variables CD Interest rates, Institutional Investors and the interaction
between Crisis and Institutional Investors have not been previously used in dividend models
because these data are usually not publicly available. The controlling for the marginal cost of
funding (interest rates paid on CDs) is a clear advantage of my study over previous studies.
More importantly, the variable Institutional Investors enables the disentangling of two
possible interpretations: dividends as a signal to debtholders versus dividends as a tool for
debtholder expropriation.
The results are relevant for shareholders and depositors of financial institutions as well
as for regulators. For example, I show that when informational asymmetry and risk aversion
are more pronounced, as they were during the 2008 financial crisis, even though small
Brazilian banks suffered massive losses of deposits (Oliveira et al., 2012) and suffered from a
lack of funding, these banks maintained or even increased dividend payments, exactly when
they most needed to retain cash. The notion of paying more dividends during financial crises
also has a procyclical characteristic (i.e., banks end up increasing their leverage when they
most need to deleverage).
This study is organized as follows: chapter 2 reviews related literature. Chapter 3
describes the data, explains the identification strategy and methodology, and chapter 4
describes the data and reports the results. Chapter 5 concludes the study.

15
2. Background
2.1. Dividend policy
In a seminal paper about dividend policy, Lintner (1956) develops a theoretical model
of decisions on corporate dividends. He argues that managers have concerns about the
stability of payments and the market’s recognition of this stability by increasing firms’ market
value. According to his findings, most managers assume that investors set a premium for
stocks that pay stable dividends. Moreover, Lintner (1956) finds that managers first determine
the dividend policy and that other policies, such as investments, debt and cash holdings, are
defined from a given amount of dividends. He also suggests the existence of a positive
signaling effect of an increase in dividends, as the commitment to increase the long-term
disbursements of a firm would be a credible signal that the firm has the resources and capacity
to sustain this extra cash outflow.
Modigliani and Miller (1961) show that dividends would be irrelevant for determining
the value of the firm in the absence of market imperfections. Since then, researchers have kept
their focus on the various forms of market imperfections that would affect the payout policy,
such as taxes, agency costs, clientele effect and information asymmetries. As noted by Black
(1976), the answer to the simple question of why firms pay dividends is not at all obvious.
Therefore, Black’s (1976) "Dividend Puzzle" remains unsolved by the financial literature.
Among authors who have investigated the effects of information asymmetry, Miller
and Rock (1985) argue that there is an informational content signaled by the dividend policy
of firms, which is in line with Myers and Majluf’s (1984) pecking order theory for capital
structure. Grullon, Michaely and Swaminathan (2002) indicate that the payment of dividends,
beyond indicating that the firm is capable of yielding cash in the future, may signal that the
16
firm has no suitable investment opportunities. Koch and Sun (2004) confirm the hypothesis
that changes in dividends (either up or downwards) cause investors to revise their
expectations about the persistence of past earnings changes. Sant and Cowan (1994) find that
managers omit dividends when earnings become more volatile. They also find that dividend
omissions precede increases in return variance, beta and the dispersion of analyst earnings
forecasts.
Amihud and Murgia (1997) find that in Germany, where corporate dividends are taxed
at a lower rate than capital gains and thus are not tax-disadvantaged as in the US, the
informational content of dividends should be lower (or inexistent). However, they find that
the stock price reaction to dividend news in Germany is similar to that found in the US. The
US-centered view of dividends in the financial literature reflects the tax regime, which
discourages dividends. Central to this view is the "dividend puzzle" (Black (1976)): if
dividends are taxed at a higher rate than capital gains, why do companies pay such high cash
dividends - approximately 50 percent of net income in the US? In Germany, until recently, the
distribution of corporate earnings to shareholders has not imposed higher taxes on
shareholders. For most investors, taxes on earnings allocated to dividends are lower than if
earnings are retained.
Other potential factors may be associated with the dividend puzzle. Nissim and Ziv
(2001) find that dividend increases are positively related to unexpected earnings in each of the
three subsequent years, whereas dividend decreases are not significantly related to subsequent
earnings. This evidence supports the informational content of dividend hypothesis because
they find that dividend changes are positively related to the level of future profitability,
although their findings are not symmetric for dividend increases and decreases.
17
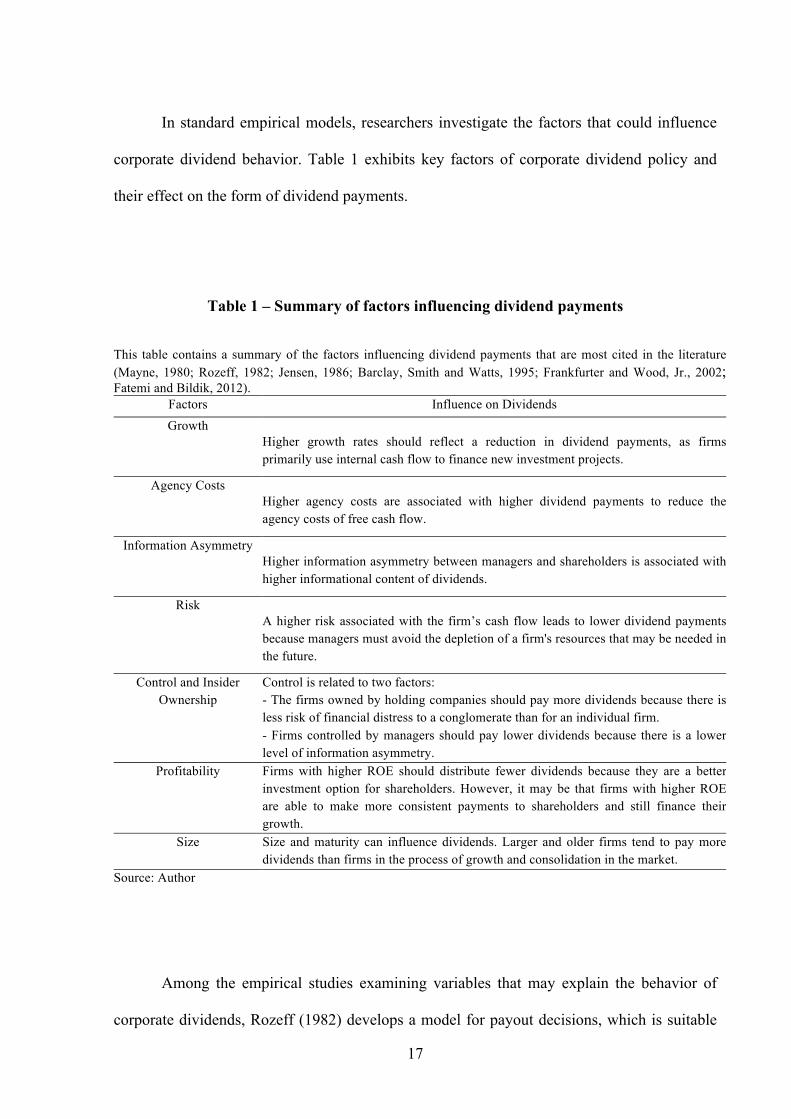
In standard empirical models, researchers investigate the factors that could influence
corporate dividend behavior. Table 1 exhibits key factors of corporate dividend policy and
their effect on the form of dividend payments.
Table 1 – Summary of factors influencing dividend payments
This table contains a summary of the factors influencing dividend payments that are most cited in the literature (Mayne, 1980; Rozeff, 1982; Jensen, 1986; Barclay, Smith and Watts, 1995; Frankfurter and Wood, Jr., 2002; Fatemi and Bildik, 2012).
Factors Influence on Dividends Growth
Higher growth rates should reflect a reduction in dividend payments, as firms primarily use internal cash flow to finance new investment projects.
Agency Costs Higher agency costs are associated with higher dividend payments to reduce the agency costs of free cash flow.
Information Asymmetry Higher information asymmetry between managers and shareholders is associated with higher informational content of dividends.
Risk A higher risk associated with the firm’s cash flow leads to lower dividend payments because managers must avoid the depletion of a firm's resources that may be needed in the future.
Control and Insider Ownership
Control is related to two factors: - The firms owned by holding companies should pay more dividends because there is less risk of financial distress to a conglomerate than for an individual firm. - Firms controlled by managers should pay lower dividends because there is a lower level of information asymmetry.
Profitability Firms with higher ROE should distribute fewer dividends because they are a better investment option for shareholders. However, it may be that firms with higher ROE are able to make more consistent payments to shareholders and still finance their growth.
Size Size and maturity can influence dividends. Larger and older firms tend to pay more dividends than firms in the process of growth and consolidation in the market.
Source: Author
Among the empirical studies examining variables that may explain the behavior of
corporate dividends, Rozeff (1982) develops a model for payout decisions, which is suitable

18
for use both in different time periods and different sectors of the economy. Rozeff (1982)
finds five statistically significant variables: beta, the percentage of insider ownership, the
growth rate of past earnings, the growth rate of earnings forecasts and the number of
common shareholders. Using the same model, other authors, such as Dempsey and Laber
(1992) and Dempsey et al. (1993), empirically verify the reliability of the five original
variables using different time horizons.
Kania and Bacon (2005) also develop a model to explain the payout ratio of firms
using the following variables: ROE, growth in sales, beta, liquidity, leverage, insider
ownership, institutional ownership, Capex and EPS growth. They use data from publicly
traded firms in the US in 2004 and find that all variables are statistically significant.
Given the diversity of models explaining payout policy, Frankfurter and Wood, Jr.
(2002) make a compilation to investigate the conflict between several theoretical models that
attempt to explain corporate dividends and empirical findings about them. The authors
examine the methods and variables (factors) used by each model to reveal a model or a set of
variables able to explain a firm’s behavior in paying cash dividends. Their findings do not
support most of the theoretical predictions, and the authors argue that such contradictions
reduce the empirical support for dividend theories. They also argue that dividends may
contain information but that their use for signaling does not explain why firms pay dividends.
The signaling effect is even more doubtful because of the ambiguity of signals (stability of
cash flow versus absence of good investment opportunities).
Another stream of research investigates dividend trends through time. Fama and
French (2001) provide evidence that indicates a significant shift in the dividend policies of US
industrial firms. Specifically, Fama and French find a substantial decline in the proportion of
firms paying dividends from a peak of 67% in 1978 to 21% in 1999. Going in the opposite
direction, DeAngelo et al. (2004) find that dividends paid by US industrial firms actually

19
increased (225% in nominal, and 23% in real terms) over the period 1978–2000. The authors
attribute their findings to the increasing concentration of dividends over this period.
Specifically, they find that in 2000, the largest 25 dividend payers paid 55% of all industrial
dividends, and the largest 100 paid 82% of this total. They conclude that not only are
dividends not disappearing, they are increasing and becoming more concentrated.
Renneboog and Trojanowski (2011) show that UK companies distributing funds to
shareholders are usually larger, more profitable, and less levered. In addition, these companies
grow more slowly and have fewer investment opportunities than their counterparts that do not
distribute excess funds to shareholders. The authors also find that unlike in the US, in the UK,
firms do not demonstrate a decreasing propensity to distribute cash to shareholders; despite an
increase in share repurchases, dividends continue to constitute a substantial proportion of the
total payout. They remark that both the US and the UK fit into the same market-based
corporate governance system (with a large number of listed companies, an active market for
corporate control, diffuse ownership, a common law system and strong shareholder
protection) and thus investigate whether the phenomena of “decreasing propensity to pay” and
“dividend substitution” are confined to the US and confirm their hypothesis.
Fatemi and Bildik (2012) find that the evolution of publicly traded firms’
characteristics worldwide toward smaller size, lower profitability and more investment
opportunities explains a significant portion of the decline in dividend payers. They also find
that the proportion of firms paying dividends declines significantly, providing further
evidence that the evolution of the market has reduced the historical significance played by
dividends. The authors use a 33-country sample and find that larger firms, with higher
profitability and lower growth opportunities, have a greater propensity to pay dividends.
Fatemi and Bildik (2012) also differences in dividend policy across industries and
countries. They find a declining tendency to pay dividends but substantial differences in the
20
proportion of payers. Firms with low market capitalization, low-to-medium profitability, high
investment outlays, and high rates of asset growth represent the lowest proportion of payers.
Looking for countries, they find a significant decline in the average payout ratios of dividend
payers.
Each country’s legal system exerts a significant influence on the dividend payout
ratios of its corporate sector, leading to variations depending on whether the country’s legal
system conforms to common or civil law. Interestingly, although the proportion of payers is
lower in common law countries than in civil law countries, Fatemi and Bildik (2012) observe
a sharp decline in the mean dividend payout ratios of firms in civil law countries and, further,
that there is a pronounced increase in common law countries.
Finally, Fatemi and Bildik (2012) investigate the concentration of dividends at the
global level. They find that dividends (and earnings) are highly concentrated among the
largest firms, where 66% of the total amount of dividends paid in 2006 by their sample (9,121
firms across 33 countries) were paid by the 10 largest dividend payers. These findings are
consistent with those of DeAngelo et al. (2004).
2.2. Substitutes for dividends
Share repurchases are an alternative for dividends as a means of distributing cash.
When firms repurchase their own stock, the amount of stock in free float decreases without a
change in the firm’s book value. Grullon and Michaely (2002) conduct an extensive research
on repurchases using a US dataset covering the period 1972–2000. Their main findings are as
follows: (1) repurchases have become an increasingly important form of cash payment to
shareholders; (2) the resources used in repurchases are primarily those that would normally be
used to increase dividends; (3) younger firms are more likely to distribute cash through

21
repurchases; and (4) the amount paid in dividends by firms, although high, is declining in
relative terms since the mid-80s, whereas the value of buybacks has increased significantly. In
addition, the value of repurchases maintains the total payout (repurchases + dividends) at
relatively constant levels between 1985 and 2000. (5) Firms that reduce the amount
repurchased through buyback programs experience a reduction in their share prices, but the
reduction is significantly lower than that observed in those firms that cut dividends by the
same amount. Grullon and Michaely (2004) show that repurchasing firms find a significant
reduction in systematic risk and the cost of capital compared to non-repurchasing firms and
that the reaction in stock prices is more relevant to firms that are more prone to overinvest.
Their findings thus are consistent with both the signaling and agency cost theories.
John and Knyazeva (2006) also examine repurchases but do so in a context of
corporate governance. Using data from US firms between 1992 and 2003, the main results are
as follows: (1) Dividends are substitutes for low levels of corporate governance. Lower levels
of internal and external governance are associated with higher dividends and a greater chance
of repurchases. (2) A higher ROE is associated with larger dividends and buybacks. (3)
Larger firms pay more dividends and repurchase more shares.
The Brazilian legal framework presents a distinctive type of payout, called interest on
equity, which works as a complement for dividends. Brazilian tax law allows firms to
distribute cash to shareholders in the form of dividends, interest on equity, or even a
combination of the two. Whereas dividends are tax-free for investors, interest on equity is not.
However, interest on equity, unlike dividends, is qualified as a financial expense and thus is
deductible from the firm’s taxable income, resulting in an increase in tax shields available to

22
firms. These payments are legally limited to a fraction of the firm’s equity1 and taxable to
shareholders but at a lower rate compared to the corporate tax rate.
The net tax burden is lower for interest on equity payments than for dividends,
providing an incentive for firms to offer payouts through interest on equity up to the legal
limit. Because there is also a minimum legal limit for dividends, and minimum dividends
generally exceed the maximum interest on equity, firms continue to pay dividends as an
addition to the tax advantages of interest on equity payments.
2.3. Bank dividends and their differences. Theory and evidence.
Mayne (1980) finds that banks linked to financial conglomerates pay higher dividends
than independent banks. This larger payout would be justified by a lower risk of these
institutions owned by a group of firms, which would reduce the risk of individual default. The
author offers the caveat that banks owned by conglomerates are likely to transfer cash to their
holding companies not only through dividends but also in the form of high management fees.
These payments cannot be measured in available databases. Therefore, the actual payout may
be even larger than reported for these institutions.
Boldin and Legget (1995) also investigate payout policy among US bank holding
companies and find a positive relationship between dividends and bank ratings. They also
find, consistent with Mayne (1980), that retained earnings represent a key source of capital for
US banking holding companies.
1 The maximum limit to interest on equity a given firm is legally allowed to pay to shareholders is the maximum among the following three measures: 1) Total Equity x Long Term Interest Rate (which is defined by the National Monetary Council); 2) 50% of after-tax earnings before the deduction of interest on equity; and 3) 50% of the sum (profit reserves + accumulated earnings).

23
Bessler and Nohel (1999) examine the effects of cutting dividends paid by US banks
and conclude that dividend cuts by major banks induce a contagion effect that reduces the
market value of other banks in the same segment. These findings are closely related to the
informational asymmetry and signaling hypotheses and are consistent with some features of
the models of bank runs of Diamond and Dybvig (1983): because bank assets are opaque,
investors use information from similar banks to assess their quality.
Casey and Dickens (2000) start from the Rozeff (1982) model to develop a framework
of dividend payout in banks. Due to the specific characteristics of financial institutions, the
authors perform some adjustments, adding the variable capital (shareholders' equity divided
by total assets) to control for the capitalization level of banks. Casey and Dickens (2000) find
that leverage has a positive effect on dividends (i.e., banks with higher leverage pay larger
dividends), which is consistent with the signaling effect. These findings were also previously
found by Chang and Rhee (1990) and Jensen et al. (1992). However, Casey and Dickens
(2000) add that the regulators set a minimum amount of capital (equity) for financial
institutions and thus that banks with the highest leverage levels are forced to reduce their
dividends to meet regulatory levels. It is thus an empirical issue to determine whether capital
influences payout negatively or positively2.
First, Casey and Dickens (2000) apply the original Rozeff (1982) model to a dataset of
banks and find that the determinants of bank dividends are different from those of
nonfinancial firms, as three of the five variables of the Rozeff’s model are unimportant for
bank dividends. Consequently, the Rozeff (1982) model cannot be generalized to banks. The
findings of Casey and Dickens (2000), when using their own model for banks, differ when the
2 Pereira (2011) applies a dynamic model and finds that Brazilian banks with low capital buffers (i.e., banks with capital just above the minimum regulatory requirement) tend to simultaneously increase their equity and reduce the risk of their assets in the following period. Although the study does not directly investigate how capital is increased (i.e., through retained earnings or infusions of external capital), it is highly likely that payouts are reduced among constrained banks.
24
period of analysis changes. However, in one of the periods, the significant variables are
growth, number of shareholders and equity. The authors conclude that the main finding is the
confirmation of the difference between banks and other industries.
Barclay, Smith and Watts (BSW) (1995) investigate corporate dividends and use Tobit
regression instead of ordinary least squares (OLS) because of the high number of firms for
which dividends are equal to zero. Dickens, Casey and Newman (2002) replicate the BSW
model using an updated database and find all variables to be statistically significant and
parameters to be virtually identical to those found by BSW (1995). Therefore, the explanatory
factors of corporate dividends are investment opportunities, regulation system, size, and
signaling.
Once the validity of the model is confirmed, the authors are able to use a variation that
is suitable for banks. These adaptations are a change in the dummy for the regulation system
and the addition of three factors: inside ownership, past dividends and risk factors. Dickens,
Casey and Newman (2002) use their model on a bank dataset, finding that banks’ dividend
yield (the dependent variable) has a negative relationship with investment opportunities,
signage, inside ownership and risk and a positive relationship with size and past dividends.
Therefore, banks pay fewer dividends when they have more investment opportunities and
when they are smaller. Lower dividend yields are correlated with higher future earnings. The
authors find no significant coefficient for regulation, but its signal was presented as expected.
Dickens, Casey and Newman (2002) explain that this finding may be because banks in the
sample have capital adequacy ratios well above the regulatory minimum. Past dividends
present a significant coefficient, showing that banks are concerned about maintaining
consistency in their dividend payments policy. Insider ownership has a negative and
significant relationship with payout, which shows, as expected, that banks with lower agency

25
costs pay fewer dividends. However, the volatility of earnings shows no significance,
although the signal is as expected.
Cornett et al. (2008) conduct a study on banks that have gone public, comparing pre-
and post-issue dividends. They find that banks are more likely to pay dividends after the IPO;
a typical characteristic of banks is to begin paying dividends soon after an IPO. In addition,
they find that banks that launch dividend programs are more likely to be acquired. Cornett et
al. (2008) assert that dividends may be a signal distinguishing strong banks from weak banks.
Therefore, banks that pay dividends are perceived as healthier and become more attractive for
an acquisition. The authors also argue that dividend payments may signal asset quality or the
capacity to yield high free cash flow or even an interest in being acquired. The results indicate
that a change in dividend policy has a higher signaling power for banks than for nonfinancial
firms and is consistent with the finding of Dickens, Casey and Newman (2002) that the
proportion of firms not paying dividends is much lower for banks than for industrial firms.
2.4. Bank dividends in Brazil
Studies on dividend policy in Brazilian firms have focused on the replication of
models used by authors of the above theoretical perspectives over the specific contexts,
legislation and macroeconomic environment in the country. They investigate the effect of
taxes (Brito and Rietti, 1981), the magnitude and frequency of payments (Heineberg and
Procianoy, 2003), the impact of mandatory minimum dividends (Paiva and Lima, 2001;
Garcia and Bugarin, 2001), the clientele effect (Procianoy and Verdi, 2003), stock
repurchases (Gabrielli and Saito, 2003), the effect of dividend announcements (Novis Neto
and Saito, 2003; Firmino, Santos and Matsumoto, 2004), pecking order (Brito and Silva,

26
2005), the effects of interest on equity (Paiva and Lima, 2001) among others, and almost all
studies exclude financial firms from their samples.
Martins and Novaes (2012) investigate Brazilian mandatory dividend rules, examining
investment and dividend decisions of publicly traded firms, and they find that a significant
fraction of these firms use loopholes in Brazil's mandatory dividend rules to avoid paying
dividends, even though this maneuver lasts for only one year. The authors also find that the
mandatory dividend rules are effective in explaining why the average dividend yield in Brazil
is higher than in the US without making it harder for firms to invest.
Procianoy and Weber (2009) examine the determinants of bank dividends in Brazil
and assess whether there are differences against the findings by Heineberg and Procianoy
(2003) for nonfinancial firms. It is important to note that they failed to consider that reported
dividends do not necessarily correspond to actual payout. As mentioned before, it is possible
for a Brazilian firm to circumvent the legal obligation to distribute 25% of its annual income.
As such, these studies may have incurred in serious measurement error.
2.5. Institutional Investors
Among authors who have studied the role of Institutional Investors as claimholders of
the firms, Grinstein and Michaely (2005) define them as distinctive (relative to individual
investors) in that they are likely to be better scrutinizers and to enjoy an informational
advantage. Institutional Investors also have the benefit of a tax advantage (US Institutional
Investors) on dividends relative to individuals and are subject to prudent-man rules.
Corporate theories suggest several reasons for why ownership structure and payout
policies may be related. First, agency theories suggest that with lower monitoring costs,
managers are likely to share more of their firm’s profits with investors. Jensen (1986) argues

27
that with enhanced monitoring, firms are more likely to pay out their free cash flow.
Assuming that Institutional Investors are better able to monitor managers’ activities, these
theories imply that larger institutional holdings will lead to higher payouts (holding all else
constant).
Investigating equity holdings, Grinstein and Michaely (2005) examine the relationship
between Institutional Investors’ holdings and payout policy in the US. They find clear
evidence that Institutional Investors prefer dividend-paying firms even after controlling for
size, risk and market-to-book ratio. They also find that firms that increase their dividends do
not attract more institutional holdings and that despite a potentially larger tax advantage
and/or prudent-man rule restrictions, pension funds and bank trusts do not show a preference
for high dividends in terms of dividends scaled by earnings. Finally, they find that
Institutional Investors’ ownership and concentration of ownership do not cause firms to
increase payout.
Ben-David, Franzoni and Moussawi (2011) provide evidence that investor
sophistication magnifies the speed of reaction to news. Moreover, Institutional Investors have
risk management controls in place to preempt violations of capital requirements. In addition,
managers employed by Institutional Investors have career concerns, as their compensation
depends on the performance of the assets they select. Guercio (1996) investigates that
portfolio managers of bank trusts, pension funds and mutual funds are subject to prudent-man
rules. Prudent-man laws purport to protect beneficiaries by allowing them to seek damages
from a fiduciary who fails to invest in their best interest. As a result, Guercio (1996) find that
fiduciaries under this law have an incentive to protect themselves from liability by tilting their
portfolios toward high-quality assets that are easy to defend in court. The greater threat of
legal actions provides bank managers with a stronger incentive to tilt their portfolios toward
equities that they perceive to be prudent investments. Ben-David, Franzoni and Moussawi

28
(2011) state that these mechanisms are likely to make Institutional Investors more reactive
than individual investors to bad news.
If these assumptions are true, Institutional Investors are more sensitive and reactive to
bad news. First, they have portfolio managers that are responsible for the assets allocation
and, at least, they respond for fails in their allocation. Second, they are more structured to
monitor their investment portfolios. In short, they are information-sensitive.
2.6. Summary of used variables from previous studies
From all studies presented, I can compile relevant variables used to determine
dividend decisions, as shown in Table 2.

29
Table 2 – Compilation of variables cited in the background section
This table contains a compilation of name, type, comments (when necessary) and authors of each variable cited in the background section. Name Type Comments Author
Changes in Dividend Payout
Dependent Lintner (1956)
Dividend Payout Dependent Rozeff(1982), Casey and Dickens(2000), Kania and Bacon (2005); Mayne (1980)
Dividend Yield Dependent Barclay, Smith and Watts (1995), Dickens, Casey and Newman (2002)
ROA Explanatory Aivazian, Booth and Cleary (2003); Kania and Bacon (2005); John and Knyazeva(2006)
Size Explanatory Some studies use the natural logarithm of Total Assets, while others use natural logarithm of sales.
Moh´d, Perry and Rimbey(1995), Mayne (1980), Fatemi and Bildik (2012) Renneboog and Trojanowski (2011)
Past Dividends Explanatory Mick and Bacon (2003), Lintner(1956), Dickens, Casey and Newman (2002),
Insiders Explanatory Volume or percentage of shares held by managers.
Rozeff(1982), Casey and Dickens(2000), Kania and Bacon (2005), Dickens, Casey and Newman (2002)
Institutional Ownership
Explanatory Indicates whether a conglomerate controls the firm. Some authors use a dummy variable, while others use the participation of institutional owners in relative terms in a continuous variable.
Kania and Bacon (2005), Mayne (1980)
Profit Growth Explanatory Rozeff(1982), Casey and Dickens(2000), Kania and Bacon (2005), Mayne (1980)
Sales Growth Explanatory Kania and Bacon (2005) Expected profit
growth rate Explanatory Rozeff(1982), Casey and
Dickens(2000), Barclay, Smith and Watts (1995), Dickens, Casey and Newman (2002)
Beta Explanatory Proxy for operational and financial risk of the firm.
Rozeff(1982), Casey and Dickens(2000), Kania and Bacon (2005)
Number of Shareholders
Explanatory Spread of control and agency costs. Rozeff(1982), Casey and Dickens(2000)
Capital Explanatory Equity on Assets. Papers about banks use this variable as a proxy for the Banks Regulatory Control.
Casey and Dickens(2000), Mayne (1980), Barclay, Smith and Watts (1995), Dickens, Casey and Newman (2002)
Liquidity Explanatory Kania and Bacon (2005) Leverage Explanatory Kania and Bacon (2005)
Capex Explanatory Kania and Bacon (2005) Operational Profit
(EBIT) Explanatory Natural logarithm of Operational Profit Mayne (1980), Barclay, Smith and
Watts (1995), Dickens, Casey and Newman (2002)
Market to Book Explanatory Proxy for Growth Opportunities Barclay, Smith and Watts (1995), Dickens, Casey and Newman (2002)
Earnings Volatility
Explanatory Standard deviation of past earnings Dickens, Casey and Newman (2002)
Source: Author

30
Most of the variables listed in Table 2 are control variables that allow us to pursue my
identification strategy to be able to address whether banks pay dividends to signal quality to
information-sensitive debtholders. In the next section, I describe in detail my identification
strategy, the selection and treatment of the sample and data, which comprise public
information available at the Central Bank of Brazil’s website as well as private data provided
by the Brazilian supervising authority.

31
3. Data
3.1. Background on the Brazilian Financial System
Since the launch of the inflation stabilization plan (Plano Real) in 1994, the Brazilian
financial system has experienced extensive restructuring. With the stabilization of inflation,
banks struggled in their attempts to find new sources of profits. As Oliveira (2007) notes, one
of Brazilian banks’ first actions was to increase non-interest revenues by charging service
fees. Meanwhile, banks began trying to cut costs to reduce non-interest expenses. The other
procedure was to increase interest revenues through credit operations. However, lending
practices were still developing, and the risk assessment of credit operations was incipient in
Brazilian banks at that time.
At the same time, the Mexican crisis of 1995 inhibited economic growth in Brazil,
which, conjugated with poor quality risk assessment, led to an increase in loan losses. As a
result, in the second half of 1995, two major banks (Banco Economico and Banco Nacional)
faced distress, forcing the Central Bank of Brazil to intervene. Such interventions created
uncertainties about the financial health of the Brazilian banking industry. Soon after, the
government launched major restructuring programs to prevent a systemic crisis (Goldfajn et
al., 2003).
One of these programs - PROES (Program of Incentives for the Reduction of the
State Role in Banking Activity) – was intended to drive the restructuring and privatization of
insolvent banks owned by states of the federation. The PROEF (Program for the
Strengthening of the Federal Financial Institutions) included major capital injections into the
two largest federal banks. From an initial 35 governmental banks in 1995, only 10 banks
remained under state control. Among them are two major federal banks– Caixa Econômica
Federal and Banco do Brasil.
32
At the same time, the Central Bank of Brazil launched the PROER (Program of
Incentives for Restructuring and Strengthening the National Financial System). According to
Goldfajn et al. (2003), PROER incorporated some innovative aspects into the restructuring
framework for Brazil’s banking industry, in particular by requiring changes in institutional
ownership and making managers and owners legally and administratively responsible for their
actions. The Central Bank of Brazil began to intervene in banks, and a series of mergers and
acquisitions took place, providing room for the increased participation of foreign banks in the
Brazilian market.
Brazilian regulations demand that banks elicit to the Central Bank the specific
controlling shareholder or block of shareholders and classifies banks operating in the country
into three groups: (1) Privately owned banks, (2) Governmental banks and (3) Foreign banks3.
To adjust the Central Bank of Brazil’s banking classification to my identification strategy, I
further separate the group of privately owned banks according to their ownership structure
into two subgroups: (a) Closely held with domestic control and (b) Publicly traded with
domestic control.
Banks controlled by either the federal government or states of the federation compose
the group of governmental banks. Despite being few in number, they play an important role in
the banking sector, as the two main governmental banks (Bank of Brazil and Caixa
Economica Federal – Federal Saving Bank) are among the five largest banks operating in
Brazil, representing almost 30% of all assets and 42% of all credit operations of the Brazilian
banking system in 2009 (See Table 3).
The Central Bank of Brazil defines foreign banks as banks with full foreign capital or
under foreign control. These banks are typically full subsidiaries of foreign financial
3 There is also a fourth group of banks called cooperative banks. These banks represent less than 1.5% of the total assets of the banking system and are outside the scope of this study because of their particular ownership and operating structure.
33
institutions and are subject to the same type of regulation of domestic banks. Table 3 (Panel
A and B) shows that since 2001, these banks have lost ground in the Brazilian banking market
in terms of market share.
Brazil’s privately owned banks are controlled by domestic shareholders. The group of
publicly traded banks comprises banks controlled by domestic shareholders with a minority
share of stock traded on exchanges. The group of closely held banks is composed of banks
also controlled by domestic shareholders, but their stocks are not traded on exchanges. In this
group are virtually no minority shareholders, and whenever they exist, a control agreement
between majority and minority shareholders is required by the Central Bank. This group
constitute the majority of banks in the Brazilian banking industry. Typically, closely held
banks have very concentrated ownership, with their shares belonging to one single
shareholder or a small group of individuals (in many cases, a family) who also hold top
management positions or are on the board of directors.
Another remarkable feature of the Brazilian banking system is its concentration.
Historically, the country has had few big banks that have a large share of the total assets of the
banking system. In 2001, the six largest banks accounted for 63% of total assets (see Table
4). In 2009, concentration increased due to mergers and acquisitions, and the top six banks
accounted for 91% of total assets. Despite the concentration, the total assets of the banking
industry increased by 248%, corresponding to a growth of over 16.8% per annum in this
period, with 7.51% inflation per annum, despite Brazil’s yearly GDP growth of just 3.4% in
the same period, according to the Central Bank of Brazil. Credit increased even more
dramatically in this period, from 229.5 billion BLR in 2001 to 889.2 billion BLR for a growth
rate of 288%.

34
Table 3 – Evolution of the Brazilian banking institutions by group
This table exhibits the evolution of the Brazilian banking institutions by Group. Panel A exhibits the evolution of total assets by the Central Bank of Brazil’s group in BLR Billions. Panel B exhibits the evolution of credit by Central Bank of Brazil’s group in BLR Billions. Percentage of the total in brackets.
PANEL A – Total Assets (values in BLR Billions)
Group 2001 2005 2009
Governmental 300.4 509.0 1,040.6
(32%) (33%) (30%)
Private (Publicly Traded and Closely Held) 349.0 675.2 1,843.0
(38%) (44%) (52%)
Foreign 280.1 358.4 635.6
(30%) (23%) (18%)
Total 929.5 1,542.6 3.519.2
PANEL B – Total Loans (values in BLR Billions)
Group 2001 2005 2009
Governmental 57.7 127.3 371.4
(25%) (31%) (42%)
Private (Publicly Traded and Closely Held) 98.3 170.4 343.9
(43%) (42%) (39%)
Foreign 73.5 110.0 173.9
(32%) (27%) (19%)
Total 229.5 407.7 889.2
Source: Central Bank of Brazil
Table 4 – Evolution of the level of concentration in Brazilian banking industry
This table exhibits the evolution of the level of concentration in Brazilian banking industry. Values in millions. Year Total assets (BLR) Percentage of assets of 6 largest banks
2001 929.5 63%
2005 1,542.6 65%
2009 3,519.2 91%
Source: Central Bank of Brazil

35
3.2. Data sources and sample construction
This study uses two data sources. The first set of data is available to the public,
provided by the Central Bank of Brazil. The data consist of annual observations of all banks
in Brazil between 2001 and 2009. They include detailed balance sheet, income and earnings
reports and selected regulatory indicators, such as the capital adequacy ratio for all Brazilian
banks. From an initial sample of 204 banks, I exclude subsidiaries of other banks in the
sample. I use this procedure to consider only the effective payout of banks to shareholders and
avoid considering dividends being paid by one bank to another, which is more closely related
to the concept of internal capital markets than to dividends.
A second database, containing private data provided by the Central Bank of Brazil,
comprises daily balances of certificates of deposits in the hands of Institutional Investors,
non-financial firms and individual investors, as well as the annual weighted average interest
rates paid on certificate of deposits issued by each bank.
Through the consolidation of both databases, I remain with an unbalanced panel of
177 banks in 9 years and 1537 bank-years. Table 5 describes the number of cross-sectional
observations as well as each sub group in each year.

36
Table 5 – Descriptive statistics
This table exhibits descriptive statistics of the sample. For each year it presents the number of banks, of governmental banks, of publicly traded banks, of closely held banks, of foreign banks and number of banks belonging to conglomerates. The banks belonging to conglomerates, except the ones that are directly controlled by a nonfinancial firm were dropped from the final dataset. Year # of
Banks # of
Governmental Banks
# of Publicly traded banks
# of Closely held banks
# of Foreign banks
# of Banks Belonging to
Conglomerates 2001 185 17 4 92 72 8
2002 182 16 4 92 70 7
2003 178 15 4 91 68 7
2004 171 15 4 89 63 6
2005 169 15 4 89 61 6
2006 165 14 4 89 58 6
2007 165 14 10 85 56 6
2008 165 12 12 86 55 6
2009 159 9 12 85 53 4
Source: Author
3.3. Investigation Model
As mentioned before, the identification strategy exploits specific features found in
Brazilian banks, such as the existence of many banks that do not have publicly traded shares
and are owned and managed by a small group of people (closely held banks) and the existence
of minimum mandatory dividends for publicly traded banks, required by the Brazilian legal
framework.
First, closely held banks, owned and managed by a small group of individuals (e.g., a
family), have little or no need to signal future prospects to shareholders. Therefore, if these
banks are engaging in any signaling, it is directed to debtholders. Second, closely held
Brazilian banks are able to easily circumvent the legal minimum dividend requirements,
whereas all other banks are required by law to pay minimum dividends4. Consequently,
4Closely held banks are able to circumvent minimum dividends relatively easily by using the simple maneuver described in section 1. As mentioned in section 2, Martins and Novaes (2012) find that some publicly traded

37
minimum dividends are not in fact mandatory for closely held banks. These combined
features allow for the conclusion that dividends paid by closely held banks are not due to legal
requirements or a signal to shareholders.
Because the main purpose of this study is to investigate whether the composition of
bank debt affects payout policy, I make no further distinction between dividends, interest on
equity and share repurchases. Consequently, hereafter I use the terms dividends and payout
interchangeably to refer to the sum of dividends, interest on equity and repurchases.
The entire new set of variables is winsorized at the 0.025 level to address the potential
problem of extreme observations or measurement errors. From this point, it is assumed that all
variables were treated and that outliers no longer interfere with test results.
To investigate whether the composition of bank debt affects payout policy, I first
consider the most relevant control variables used by previous papers (Mayne, 1980; Rozeff,
1982; Barclay, Smith and Watts, 1995; Nissim and Ziv, 2001; Cornett et al., 2008;
Renneboog and Trojanowski, 2011; Fatemi and Bildik, 2012). Details of the previous use of
each variable by the related papers can be observed in Table 2. Then, other explanatory
variables are proposed as follows.
- Payout: This is the dependent variable and is calculated as the sum of dividends,
repurchases and interest on equity divided by earnings. Alternatively, bank equity
is used in the denominator. This variable represents the proportion of earnings (or
equity) paid to shareholders. I add dividends and interest on equity because
whether there is anything that influences the choice of firms for one of these
options, the study conducted by Boulton et al. (2010) does not provide evidence
Brazilian companies find loopholes to avoid the payment of minimum dividends. However, these loopholes are more complicated than for closely held firms and are limited to a small number of companies and to only one year.

38
that such a selection affects the total cash flow to shareholders. As mentioned
before, the actual payout may be different from the reported payout because of a
maneuver that works as follows: shareholders determine at the same meeting to
pay dividends and reinvest them to increase capital. The money does not even
leave the firm, even though financial statements will report a dividend payment to
shareholders. Specifically, I search for increases in capital in the Statement of
Changes in Equity (SOCE) for each period when the bank made a payment of
interest on equity. When there is a simultaneous increase in capital and dividend
payments, the value of the increase in capital is subtracted from the reported
payout to determine the actual payout. This maneuver is particularly useful for
banks because they can use interest on equity as a tax shield (because interest in
equity is considered a financial expense) without effectively paying out to
shareholders.
- Institutional Investors: I use the ratio between certificates of deposits issued to
Institutional Investors and total assets as a measure of reliance on Institutional
Investors for funding. Ben-David, Franzoni and Moussawi (2011) argue that
Institutional Investors are more reactive to bad news than other depositors because
they have internal risk management systems or funding requirements that may
induce revisions of their asset allocations. In addition, Institutional Investors are
different from other depositors because they are customers of the bank only on the
liabilities side. This feature gives Institutional Investors a higher degree of
freedom to move their resources across banks. Consequently, banks that raise
more funds through Institutional Investors may have a greater need to signal the
quality of their operations and the ability to yield future cash flows through

39
dividends. Therefore, the finding of a positive signal is evidence supporting the
signaling theory.
- Crisis Dummy: This is an indicator variable that assumes a value of 1 for the 2008
year and 0 otherwise. The year 2008 was selected as a crisis year based on a study
by Aït-Sahalia et al. (2010), which states that the global crisis began in 2008,
despite the sub-prime crisis, which started in 2007 but did not spread overseas.
The 2008 crisis is exogenous to the Brazilian banking system because the
Brazilian banks were not exposed to the financial products that sparked the crisis
(Oliveira et al., 2012). Based on prudential theories, it is expected that in general,
banks pay smaller dividends during crises to be better able to endure the
turbulence of a financial turmoil. However, based on signaling theory, it is
expected that during the crisis, informational asymmetry is exacerbated and banks
face the need to signal their solvency and ability to generate future cash flows.
- Crisis Dummy x Institutional Investors: This is an interaction variable between the
crisis dummy and Institutional Investors variable and is the main variable of
interest. If banks use dividends to signal to debtholders, banks with a larger
reliance on information-sensitive depositors (Institutional Investors) for funding
will have a higher propensity to pay dividends. On the other hand, if instead of
signaling, banks use dividends to expropriate debtholders during the crisis, this
phenomenon would be more pronounced in banks with less information sensitive
depositors, as uninformed depositors would be less likely to withdraw their funds.
Therefore, a negative signal would be evidence indicating debtholder
expropriation and the violation of the theory claiming the preference of debt over
equity.

40
- Size: I measure size as the natural logarithm of assets. As in previous studies
(Fatemi and Bildik, 2012; Renneboog and Trojanowski, 2011; Moh´d, Perry and
Rimbey, 1995; Mayne, 1980), it is expected that larger banks have a higher
propensity to pay dividends than small banks.
- Return on assets (ROA): This term controls for banks’ profitability. I expect that
profitable banks pay more than others. A positive sign is expected (Aivazian,
Booth and Cleary, 2003; Kania and Bacon, 2005; John and Knyazeva, 2006)
- Capital adequacy ratio: The effect of capitalization on dividends is ambiguous. On
the one hand, capital-constrained banks may be influenced by the regulatory
system to retain earnings and thus pay fewer dividends, causing capital to have a
negative influence on bank dividends. Pereira and Saito (2010) find that banks in
Brazil face pressure to increase capital as their capital adequacy ratio approaches
the minimum regulatory requirement. Therefore, they are likely to retain earnings
and follow the pecking order, using retained earnings as the primary financing
source. On the other hand, low-capitalized banks face a greater necessity to signal
the quality of their assets to the main providers of funding (depositors and other
debtholders). Which effect dominates the other is thus an empirical question. I use
the first lag of capital in my model.
- Leverage: The financial literature often uses a signaling factor between leverage
and dividends. A growth in the debt level is a credible signal of high future cash
flows. In this context, managers should pay more dividends to confirm this signal.
Therefore, most payout models do not include leverage because the payout level
may be endogenous to the leverage level (Casey and Dickens, 2000; Chang and
Rhee, 1990; Jensen et al., 1992). This assertion mostly occurs in papers on
nonfinancial firms. However, among banks, the level of debt may be linked to

41
their portfolio quality due to the regulation system model. Therefore, some banks
may face the necessity of a reduction in the dividends level to adjust their capital
adequacy. In dividend payout models for financial firms, capital level is widely
used as an explanatory variable as well (Casey and Dickens, 2000; Mayne, 1980;
Barclay, Smith and Watts, 1995; Dickens, Casey and Newman, 2002). I use the
first lag of leverage in my model due to the influence of leverage on dividends.
The expected sign of leverage is an empirical issue, as noted above, and thus
cannot be defined in advance.
- Interest paid on certificates of deposit (CDs): Because CDs represent the primary
source of funding for Brazilian banks, the interest rate paid on CDs is a proxy for
financial constraints. As noted by Paravisini (2008), the optimal response of an
unconstrained bank to an expansion in external financing without altering the cost
of capital is to distribute it among investors as dividends or to expand lending (as
long as loans have positive NPVs). The same underlying idea is behind the
investment-cash flow literature in corporate finance. Because I control for lending
expansion, I expect interest paid on CDs to be negatively related to payout. A
negative signal also indicates that, ceteris paribus, a higher marginal cost of
funding is associated with a lower propensity to pay dividends, which is consistent
with the idea that dividends are costly.
- Closely held banks dummy: This indicator variable assumes a value of 1 for
private, closely held banks and 0 otherwise. Because this is the main target of my
investigation, I do not use this dummy on my main econometric model because I
already have control dummies for all other classifications of banks. Therefore,
closely held banks are my bases, and the coefficient of all other classification

42
dummies will provide the difference between each other. However, in some
robustness checks, I use this variable in interactions with other variables.
- Governmental bank dummy: This indicator variable assumes a value of 1 for
banks controlled by the government and 0 otherwise. I expect that governmental
banks pay less than closely held banks because these banks may be perceived as
enjoying an implicit guarantee from the government and thus as having less need
to signal their quality.
- Subsidiaries of foreign banks dummy: This indicator variable assumes a value of 1
for banks that are subsidiaries of foreign banks and 0 otherwise. Because most of
these banks are organized as full subsidiaries (i.e., have one single shareholder),
they can also easily circumvent minimum dividend requirements.
- Publicly traded dummy: This indicator variable assumes a value of 1 for private
banks that have publicly traded stocks and 0 otherwise. I cannot define the
expected sign of this dummy ex ante. A positive sign could indicate one (or both)
of the following: i) shareholders are the main targets of dividend signaling, and
banks that are closely held do not need to signal to their shareholders, as they are
insiders, or ii) publicly traded banks cannot circumvent minimum dividend
requirements and thus pay larger dividends. On the other hand, the interpretation
of a negative sign would be that closely held banks, even being able to circumvent
minimum dividend requirements and pay fewer or no dividends at all, deliberately
choose to pay higher dividends. This deliberate decision, in turn, could have two
different interpretations: i) closely held banks have a greater necessity to signal
quality to their depositors, or ii) closely held banks expropriate debtholders by
paying large dividends. The distinction between the first and the second

43
interpretation can be made by analyzing the effect of information-sensitive
depositors.
- Growth in loans: measures the growth rate of the loan portfolio. To increase the
loan portfolio, banks need more equity and consequently pay fewer dividends. I
thus expect a negative sign for this variable.
- Credit Risk measures the observable quality of a bank's assets. Banks with low
portfolio quality should reduce their dividend payments to prevent liquidity
problems. I use the ratio between loan loss reserves and total loans as the measure
of loan risk. I expect a negative sign for this variable.
Equation (1) summarizes the previous discussion:
Payouti,t = α + Institutional Investorsi,t + Crisist + (Crisist x Institutional Investorsi,t) + CD Interest
Ratesi,t + ROAi,t + Sizei,t + Capitali,t-1 + Leveragei,t-1 + Governmentali,t + Publicly
Tradedi + Foreign banki,t + Credit Growthi,t + Credit Riski,t + dt + εi,t
(1)
Where i and t represent the firm and year, respectively, and α, d and ε represent the intercept,
year dummies and error term, respectively. The list of variables created, their basic rationale,
their formulas, as well as the expected signs for the model to be presented in the next section
are exhibited in Table 6.
It is noteworthy that the variables CD Interest rates and Institutional Investors and the
interaction between Crisis and Institutional Investors have not been previously used in
dividend models because these data are usually not publicly available. I claim that controlling
for the marginal cost of funding (interest rates paid on CDs) is a clear advantage of my study

44
over previous studies. More importantly, the variable Institutional Investors allows us to
disentangle two possible interpretations: dividends as a signal to debtholders versus dividends
as a tool for debtholder expropriation.
An important characteristic of the sample, which interferes directly in the empirical
methodology applied, lies in the fact that the value of the dividends is equal to zero in
approximately 40% of the observations. For this reason, I use a censored Tobit panel model (I
do not use bank fixed effects, as some variables refer to time-invariant characteristics of
banks, such as government ownership). An alternative investigation about the use of OLS
instead of Tobit can be observed in appendix 1.
Endogeneity problems can arise from selection bias, where the choice of the bank by
Institutional Investors can be made using previous information such as the level of dividends
or the profitability of the bank. To address this issue, I also run a Tobit model with
instrumental variables. (I call them IVtobit models). They use instrumental variables for
Institutional Investors aiming to clear the endogenous relationship between the level of
Institutional Investors and the payout of each bank. The instruments are the past levels of
Institutional Investors and the variable big bank (see Table 6). Tests of the validity of the
instruments show that these variables are valid and not weak instruments.

45
Table 6 – Description of the regression variables
This table describes the regression variables. The first column gives the name used in the econometric model and in other tables, the second exhibit the expected sign for the parameter, the third describes and the fourth shows the operational definition.
Variable Expected Sign
Description Operational Definition
Size (+) Size of bank Natural logarithm of assets of the bank
ROA (+) Return on assets Operating Income divided by Total Assets
CD interest rate
(-) Interest paid on Certificates of Deposit
Weighted average (by volume issued) interest rate paid on freshly issued CDs
Institutional Investors
(+) Percentage of CDs issued to Institutional Investors
CDs held by Institutional Investors divided by the total amount of CDs issued
Leverage (+/-) Bank Leverage Liabilities divided by Equity
Capital (+/-) Capital Adequacy Equity divided by Risk-weighted Assets
Publicly Traded
(-) Control for Public traded bank. Dummy variable with value = 1 to publicly traded bank and 0 to non-publicly traded.
Governmental Ownership
(-) Control for Government owned bank.
Dummy variable with value = 1 to government-controlled bank and 0 to nongovernmental bank.
Closely Held (+) Control for Closely Held bank. Dummy variable with value = 1 to Closely Held bank and 0 to non-closely held bank.
Subsidiaries of Foreign Banks
(-) Control for Subsidiaries of Foreign banks.
Dummy variable with value = 1 to subsidiaries of foreign banks and 0 for non-foreign banks.
Credit Risk (-) Risk of loan portfolio. Nonperforming loans divided by total loans.
Credit Growth (-) Growth rate of the loan portfolio. Current loan portfolio minus the portfolio of the previous year divided by the portfolio of the previous year.
Crisis Dummy
(-) Dummy for 2008 Turmoil Dummy variable with value = 1 to 2008 year and 0 to other years
Crisis x Institutional Investors
(+) Interaction between Crisis dummy and Institutional Investors
Interaction variable between the Crisis dummy and the Percentage of CDs issued to Institutional Investors.
Cash Payments
Total of cash payments to shareholders
Sum of dividends, interests on equity and repurchases.
Payout Earning
Payout rate of bank. Cash Payments divided by Total Earnings After Taxes.
Payout Assets Payout rate of bank relative to the Total of Assets
Cash Payments divided by Total Assets
Payout Equity Payout rate of bank relative to the Equity
Cash Payments divided by Equity
Big Bank Control for Big banks. Dummy variable with value = 1 to Big banks and 0 to non-big banks. Used as an instrument variable.
Source: Author

46
Furthermore, substantial empirical robustness comes from the use of the crisis dummy
because for Brazilian banks, the 2008 crisis is an exogenous shock. Taking these
considerations together with the share of Institutional Investors’ holdings of any bank during
the 2008 crisis produces a robust variable without any internal interference or selection bias5.
This combination is stronger than any instrument. A further comprehensive set of robustness
checks also help to ensure the interpretation of my findings.
5 I also test for the possible selection bias of the banks by the Institutional Investors. See the chapter on robustness tests.

47
4. Results
4.1. Descriptive statistics and tests results
Table 7, 8 and 9 present summary statistics of the total payout and explanatory
variables. Table 7, Panel A, presents the two dependent variables used in models to explain
the dividend policy of banks (Total Payout/Earnings and Total Payout/Equity). Although
these variables have different magnitudes, they exhibit remarkably similar behavior over time
(see Figure 2). Panel B shows the amount of cash distributed by the banks between 2001 and
2009, and three main characteristics are observed: (1) There is a remarkable and roughly
constant growth rate in the total payout. (2) The amounts of interest on equity and dividends
are similar in magnitude. (3) Unlike in the US, the value of repurchases represents only 2.9%
of the total payments to shareholders (see Figure 1, Panels 1 and 2).
Table 7 – Descriptive statistics of dependent variables
This table exhibits descriptive statistics of dependent variables. Panel A shows the mean value of the two dependent variables over the years. Panel B shows the payments’ magnitude of each form allowed by Brazilian Tax laws. The sample includes all banks in activity in Brazil between 2001 and 2009 except banks belonging to conglomerates.
Panel A Panel B Year PAYOUT/
EQUITY PAYOUT/
EARNINGS Dividends BLR (M)
Interests on Equity
BLR (M)
Repurchases BLR (M)
Total Payments BLR (M)
2001 0.034 0.247 1,841 3,135 268 5,244 2002 0.064 0.306 8,019 3,584 230 11,833 2003 0.058 0.269 5,801 7,843 358 14,002 2004 0.041 0.220 5,549 7,120 157 12,826 2005 0.054 0.265 8,396 11,449 1,332 21,177 2006 0.045 0.218 5,487 11,083 68 16,638 2007 0.039 0.211 11,934 10,049 476 22,459 2008 0.048 0.318 12,745 12,918 1,354 27,017 2009 0.051 0.329 11,355 13,733 309 25,397
Total 71,127 80,912 4,553 156,592 Source: Author

48
Table 8 shows descriptive statistics for the independent variables by bank group.
Closely held and publicly traded banks rely more on Institutional Investors (27% and 40%,
respectively), although the distribution in both is quite different because the median for the
closely held banks is only 7.3% while the median for the publicly traded banks is almost the
same as the mean, 41.4%. The governmental and foreign banks are remarkably less profitable
than their counterparts: the ROA (Return on Assets) of the closely held and publicly traded
banks are quite similar (4% and 5%, respectively), while the ROA of the governmental and
foreign banks are only 2.5% and 2.8%, respectively. The governmental and publicly traded
banks are larger than the closely held and foreign banks. Also, the governmental banks have
almost double the leverage level of their counterparts and, consequently, a lower capital
adequacy ratio. The loan portfolio of the governmental banks also grew more slowly than
those of their peers during the sample period.
Table 8 – Descriptive statistics of independent variables
Descriptive statistics. This table exhibits the mean and median (in brackets) for the explanatory variables of the regressions. The column Institutional Investors shows the percentage of CDs issued to Institutional Investors, ROA shows the Return on Assets, Size here shows the magnitude of Total Assets in BLR (Millions), Leverage shows Liabilities divided by Equity, Capital Adequacy is Equity Divided by Risk-weighted Assets, Credit Risk shows the nonperforming loans divided by total loans, Credit Growth is the growth rate of the loan portfolio. The sample includes all banks in activity in Brazil between 2001 and 2009. Type of Bank Institutional
Investors ROA
(%) SIZE BLR (M)
LEVERAGE CAPITAL ADEQUACY
LOANS RISK
GROWTH IN LOANS
Closely Held 27.10 4.04 6,318 5.22 0.33 0.05 0.43 (7.27) (3.24) (552) (3.29) (0.23) (0.03) (0.16) Governmental 9.49 2.56 44,000 9.77 0.21 0.08 0.15 (1.59) (2.45) (4,209) (8.41) (0.11) (0.07) (0.16) Public Traded 40.01 4.99 57,417 5.55 0.30 0.03 0.58 (41.42) (3.18) (7,091) (5.30) (0.16) (0.03) (0.22) Foreign 23.00 2.78 7,190 6.19 0.27 0.04 0.41 (0.00) (2.07) (1,486) (4.97) (0.17) (0.02) (0.12) Source: Author

49
Table 9 shows descriptive statistics for the distribution of the payouts over the
subgroup of banks. The foreign banks have a higher frequency of payouts (payout/earnings)
equal to 0%, the governmental banks have a higher frequency of payouts between 0% and
40%, and the closely held and publicly traded banks have a higher frequency of payouts
greater than 40% of their earnings.
Table 9 – Descriptive statistics of payout by group
Descriptive statistics. This table exhibits the percentage of payout (payout/earnings) for each sub group of banks in Brazil. The column “Payout = 0%“ shows the percentage of observations on the sample with payout equal to zero. Column “Payout between 0% and 40%“ shows the percentage of observations where the payout is higher than 0% and lower than 40%. Column “Payout> 40%” shows the percentage of observations where the payout is higher than 40%. The sample includes all banks in activity in Brazil between 2001 and 2009. Type of Bank
Payout = 0% Payout between 0% and 40% Payout > 40%
Closely Held 32% 29% 38%
Governmental 20% 54% 27%
Public Traded 15% 44% 41%
Foreign 53% 19% 29%
Total (Average) 38% 28% 34% Source: Author
To examine the methods of payment used by each type of bank, Table 10 shows a
consistent use of all forms of payment by both the private banks and the government banks.
The high use of interest on equity is noteworthy, corroborating the hypothesis that banks use
interest on equity as a tax-shield until the limit for this form of tax payment is reached, and
they complement its payout through the use of regular dividends. Publicly traded banks only
pay dividends in 7% of cases, which indicates that they use interest on equity in 93% of their
payments.

50
Table 10 – Descriptive statistics of occurrences of each form of payment
Descriptive statistics. This table shows the number of occurrences for each form of cash payment to shareholders for each sub group of banks in Brazil. The column “Only Dividends “ shows the number of occurrences of the payment only throughout dividends. Column “Only interests on equity” shows the number of occurrences of the payment throughout interests on equity. “Dividends and interests on equity” shows the number of occurrences of the payment throughout dividends and interests on equity at the same time. The sample includes all banks in activity in Brazil between 2001 and 2009. Type of bank Only dividends Only interests on
equity
Dividends and interests on
equity
Closely Held 161 263 162
(27%) (45%) (28%)
Governmental 32 21 48
(32%) (21%) (48%)
Public Traded 4 31 21
(7%) (55%) (38%)
Foreign 93 118 65
(34%) (43%) (24%)
Total 290 433 296
Source: Author
Table 7 and Figure 2 also show that there is no industry standard for payouts in
relation to either earnings or to equity. Although there is no consistent payout pattern relative
to earnings or equity, there is a strong correlation with ROA, as shown in Figure 3. The ROA
and payout over assets exhibit similar trends until 2007, when they both deviate from this
trend. A reversal of this magnitude could indicate that the most important factor for managers
regarding decisions about payouts is not the payout’s relationship with other variables, but its
amount and its growth rate, as discussed by Lintner (1956) and as shown in Figure 1, Panel B.

51
Figure 1 The evolution of disbursement of Brazilian banks. Panel A exhibits the magnitude of each form of payment. Panel B presents the total cash payment on each year for all banks. The sample includes all banks in activity in Brazil between 2001 and 2009 except banks belonging to conglomerates. Amounts in billion of Brazilian Real. Panel A
Panel B
Source: Author
015
Bi
10 B
i5
BiTo
tal P
aym
ents
R$
2000 2002 2004 2006 2008 2010Year
DIVIDENDS INTERESTS ON EQUITYREPURCHASES
5 Bi
15 B
i25
Bi
20 B
i10
BiC
ash
Paym
ents
(R$)
2000 2002 2004 2006 2008 2010Year

52
Figure 2 This figure exhibits the two dependent variables used in models to explain dividend policy of banks. (Total Payout/Earnings and Total Payout/Equity). Each variable have separate scale, the left is for Payout Equity while the right is for Payout Earnings. The sample includes all banks in activity in Brazil between 2001 and 2009 except banks belonging to conglomerates. Total Payout is the Sum of dividends, interests on equity and repurchases.
Source: Author
.2.2
5.3
.35
Payo
ut o
n Ea
rnin
gs
.03
.04
.05
.06
.07
Payo
ut o
n Eq
uity
2000 2002 2004 2006 2008 2010Year
PAYOUT - EQUITY PAYOUT - EARNINGS

53
Figure 3 This figure exhibits the relationship between payout and ROA. Each variable have separate scale, the left is for Payout Assets (Payout/Total Assets) while the right is for ROA (Operating Income divided by Total Assets). The sample includes all banks in activity in Brazil between 2001 and 2009 except subsidiary banks belonging to conglomerates. Total Payout is the Sum of dividends, interests on equity and repurchases.
Source: Author
Figure 4 exhibits the dispersion of total payouts over the years. The banks are clearly
increasing the distribution of their cash flows.
Finally, from Figures 2 and 3, one could conclude that the banks boosted their
dividends during the 2008 crisis. This conclusion is misleading because there was a reduction
in earnings in 2008. Taking into consideration the resistance of managers to reducing the
value of dividends and comparing the total payout relative to equity in the previous years, the
dividend behavior in 2008 cannot be considered abnormal.
Because the 2008 crisis negatively affected the banking system, a reduction in the
magnitude of the dividend payments might be expected during this period. There are two
possible explanations for the increase in total payouts in 2008: The first stems from the need
to signal the quality of assets during the crisis, when informational asymmetry issues are
.02
.03
.04
.05
Ret
urn
on A
sset
s
.2.2
5.3
.35
Payo
ut
2000 2002 2004 2006 2008 2010Year
Total Payout Return on Assets

54
exacerbated. The second is related to a possible expropriation of depositors and other
debtholders by stockholders (i.e., given the imminence of collapse, shareholders would cash
out as much as they could). A regression analysis in the next section of this study addresses
this issue.
Figure 4 This figure exhibits the dispersion of Brazilian Bank dividends over time. Dividends are expressed in natural logarithm of the total payout. The sample includes all banks in activity in Brazil between 2001 and 2009 except subsidiary banks belonging to conglomerates. Total Payout is the Sum of dividends, interests on equity and repurchases.
Source: Author
05
1015
Ln T
otal
Pay
out
2000 2002 2004 2006 2008 2010Years
95% CI Fitted valuesLn Total Payout
“Dispersion of Dividends over time”
55
4.2. Main Model: regression results
To test my hypothesis regarding signaling to debtholders, I run the main model to
verify the impact of debt composition on dividends and the influence of the 2008 crisis on
payout against an alternative explanation of a “cash out” during the crisis. My attention will
be drawn to three main variables: Institutional Investors, Crisis and the interaction between
them.
The results of the main model (Table 11, column 1) show that the dividends are
positively related to the reliance on Institutional Investors, indicating that banks use dividends
as a signal to this type of investor. In Brazil, where most banks are closely held, Institutional
Investors are the prime targets of dividend signaling. Relative to earnings, banks pay 0.15
percentage points more dividends for each additional percentage point in the share of assets
being funded by CDs held by Institutional Investors. More importantly, this relationship is
stronger during the crisis because the interaction variable showed a significant and positive
sign. The coefficient indicates that a one percentage point increase in Institutional Investors
during the 2008 crisis causes the total payout to increase 0.67 percentage points relative to
earnings, in addition to the 0.15 percentage points paid during normal times. In short, those
banks with more Institutional Investors pay larger dividends than those banks that rely less on
these investors both in normal times and during the 2008 turmoil.
The negative coefficient for the crisis dummy indicates that during the 2008 turmoil,
ceteris paribus, the banks paid smaller dividends than in the other years. This finding indicates
that during the turmoil, the total payout decreased 0.148 percentage points relative to the
earnings for a bank without Institutional Investors. For the average bank, the marginal net
56
effect of the crisis was 0.0226. This result reinforces my findings because the interaction
between the crisis and Institutional Investors returns a positive and significant coefficient. In
short, during the 2008 crisis, banks paid fewer dividends, with the exception of those banks
that relied more on funding from Institutional Investors.
Because Institutional Investors are information-sensitive and more reactive to
bad news than other depositors, one could expect that any “cash out” movement would be
quickly perceived by Institutional Investors, who would immediately withdraw their deposits.
If a dividend “cash out” occurred, one could expect it to occur in banks with less reactive
depositors. Taken together, the results for the crisis dummy and the interaction Institutional
Investors x crisis show that that the alternative hypothesis of a "cash out" during the crisis
cannot be supported.
I cannot ascertain why, unlike the evidence shown by Acharya et al. (2009) for the US
and Europe, the shareholders of the Brazilian banks have not yet cashed out. One possibility
is that the Brazilian banks were not as distressed as the banks in developed countries, and thus
the values of their banks as a going concern could be larger than the amount cashed out.
Another possibility is that this result arose because the controlling shareholders of the closely
held banks have almost no incentive to “cash out” when the bank is in financial distress
because the Brazilian regulatory system imposes severe penalties on the controlling
shareholders of banks that fail to meet the regulatory capital standards. These penalties
include intervention, civil and criminal lawsuits and, more importantly, the non-availability of
personal wealth.
6 The average value for the variable Institutional Investors is 0.253. As such, the net effect of the crisis for the average bank is 0.253 x 0.67 – 0.148 = 0.022.

57
Table 11 – Factors that affect the payment of dividends
Factors that affect the payment of dividends in Brazilian banks. This table exhibits Tobit regressions. The dependent variable in the models 1 and 2 is PAYOUT EARNING. The dependent variable in the model 3 is PAYOUT EQUITY. Model 1 represents the main model, with the dummy for crisis (2008 Turmoil) and the interaction between Institutional Investors and crisis. Models 2 and 3 represent a robustness checks to the main model, without the dummy for crisis and the interaction between Institutional Investors and crisis. The sample includes all banks operating in Brazil between 2001 and 2009 except banks belonging to conglomerates. All models have dummies for years. Absolute values of t-statistics of the coefficients of the independent variables are shown in the parentheses. The significance levels are * p<0.10, ** p<0.05, *** p<0.01. Dependent Variable Payout/Earnings Payout/Equity Expected Sign (1) (2) (3) Institutional Investors (+) 0.1532*** 0.2067*** 0.0402*** (2.69) (3.65) (3.38) Crisis (Dummy) -0.1482* (-1.78) Institutional Investors x Crisis (+) 0.6781*** (3.05) CD interest rate (-) -4.6100 -4.4256 -1.1187 (-1.34) (-1.26) (-1.48) Return on Assets (ROA) (+) 3.1565*** 3.1233*** 0.7921*** (8.10) (8.04) (7.05) Firm Size (+) 0.0897*** 0.0905*** 0.0197*** (7.63) (7.65) (8.01) Capital (L1) (+/-) -0.3722*** -0.3762*** -0.0890*** (-3.66) (-3.67) (-4.25) Leverage (L1) (+/-) -0.0114*** -0.0127*** -0.0026*** (-2.78) (-3.10) (-3.27) Governmental (-) -0.0778 -0.0709 -0.0125 (-1.37) (-1.25) (-0.99) Publicly Traded (-) -0.2587*** -0.2267*** -0.0716*** (-3.18) (-2.60) (-5.62) Foreign Subsidiaries (-) -0.3011*** -0.3013*** -0.0487*** (-7.16) (-7.12) (-5.73) Growth in Credit (-) -0.0123 -0.0129 -0.0055 (-0.72) (-0.76) (-1.49) Credit Risk (-) -0.9487*** -0.9828*** -0.0665 (-2.85) (-2.96) (-0.90) Constant -0.8580*** -0.8718*** -0.2050*** (-5.21) (-5.26) (-6.17) Year Dummy Yes Yes Yes Number of Observations 1082 1082 1084 Number of Banks 168 168 168 Log-likelihood -728.9901 -735.0072 350.4087 Source: Author
58
Following the rationale that the cost of dividend signaling with is positively related to
the marginal cost of funding, the negative signal for CD Interest Rates endorses Kauko’s
(2011) theory that optimal dividends are negatively related to the cost of funding.
The results of the main model (Table 11, column 1) also reveal other factors that
influence the bank dividend payout: ROA, Size, Capital, Leverage, Governmental, Publicly
Traded, Foreign Subsidiaries, Growth in Credit and Credit Risk. All of the parameters have
the predicted signal.
As expected, one of the most influential factors on bank payout is the ROA. The
profitability of the bank has a direct influence on its dividend policy. This relationship could
derive from the minimum dividends that are mandatory in Brazil; these dividends are a
fraction of earnings and cannot be easily circumvented by publicly traded banks. In addition,
the ROA represents the bank’s ability to generate cash and also reinforces the use of
dividends to provide information regarding the quality of assets by sending a credible signal
regarding the bank’s ability to generate earnings. Table 11, column 1, indicates that a one
percentage point increase in the ROA causes the total payout to increase 3.2 percentage points
relative to earnings.
The negative sign for capital indicates that those banks that are more capitalized pay
fewer dividends or, alternatively, that the banks that are more capital-constrained pay larger
dividends. The coefficient indicates that a one percentage point increase in Capital Adequacy
causes the total payout to decrease 0.37 percentage points relative to earnings. This result
indicates that highly levered banks have a greater need to signal their ability to generate future
cash flows. The importance of the signaling effect over the regulatory effect (which would
imply that less-capitalized banks pay lower dividends) could be due to the fact that most
banks in Brazil have a capital adequacy ratio that is substantially greater than the 11%
regulatory minimum. As such, bank managers would not be seriously concerned about not
59
meeting the regulatory requirements. Despite the general prediction of the positive effect of
leverage on payouts in the financial literature, my results show that leverage has a negative
relationship with the actual payouts.
The positive parameter for Size indicates that larger banks are more likely to pay
higher amounts of cash to their shareholders, which is consistent with the previous findings
for US banks and for nonfinancial firms in Brazil (Mayne, 1980, Dickens, Case and Newman,
2002, Martins and Novaes, 2012) and with the theoretical model of Reeding (1997).
Closely held banks pay more dividends than any other class of bank (publicly traded,
governmental and foreign banks), which is consistent with the signaling purpose of dividends.
The information on publicly traded banks is less opaque because they must function under
more stringent disclosure requirements and, unlike closely held banks, are monitored by
analysts. This result is particularly important because closely held banks can easily
circumvent the minimum mandatory dividends and because it indicates that closely held
banks actually decide to pay more dividends.
I also find that government-owned banks pay fewer dividends, which is consistent
with the idea that these banks enjoy an implicit guarantee from the government and thus have
less need to signal their quality. Another possible interpretation is that, during the studied
period, the governmental banks were used by the government to foster specific economic
activities, including activities in the areas of housing, agriculture and infrastructure, thus
creating a need to increase their capital by retaining earnings. Because I also control for the
growth in the loan portfolio, the first interpretation appears to be more plausible.
Governmental banks pay 0.07 percentage points (relative to earnings) fewer dividends than
closely held banks. Publicly traded banks pay 0.25 percentage points (relative to earnings)
fewer dividends than closely held banks, while those banks with foreign subsidiaries pay 0.30
percentage points (relative to earnings) fewer dividends than closely held banks.

60
Consistent with theory, growth in loans is negatively related to payout, although I find
no statistical significance.
Finally, Credit risk is negatively related to payout. This relationship implies that the
risk of the loan portfolio reduces the payout by banks. When facing an increase in
nonperforming loans, banks reduce their payout; this result is consistent with the financial
literature.
4.3. Robustness checks
As a robustness check, I address two main issues: The first concerns the use of an
interaction between the crisis and the Institutional Investors that can interfere with other
coefficients due to either correlation or inflation of variance. The second concerns alternative
explanations for my primary hypothesis.
4.3.1. Model specification robustness tests
My main model uses an interaction variable (Institutional Investors and Crisis) that
can interfere with the results of other parameters. To ensure the robustness and efficiency of
the parameters, I run an alternative Tobit model without the interaction to verify the behavior
of all of the variables against the payouts. It is expected that all of the variables will return the
same signal and significance. If the values of the parameters remain unchanged (signal and
significance) in this test, this result will provide assurance that the main model using the
interaction variables is robust for this sample.
The results of this regression (Table 11, Column 2) reveal the factors that influence
the bank dividend payout: Institutional Investors, CD interest rate, ROA, Size, Capital,
61
Leverage, Publicly Traded and Foreign Subsidiaries. All of the parameters have the predicted
signal and maintain almost the same value when compared to the main model (with the crisis
dummy and the interaction variables), supporting the robustness of the main model.
Furthermore, I also test for the use of equity rather than earnings as a scaling variable,
as mentioned in the model specification in chapter 3. The only difference between the
specifications of columns 2 and 3 of Table 11 is that Total Payout is scaled by equity instead
of earnings in column 3. The results of this regression show similar results in terms of
statistical significance. Despite the difference in the magnitude of some of the parameters, as
indicated by changes in the denominator of the left-hand-side variable, all of the signs and
significances were unchanged with the exception of the variable credit risk, which became
statistically insignificant.
It is important to note that even when some specifications of the model are changed,
the results remain remarkably stable and consistent. If the model suffered from any
specification issues, changes to the estimated parameters in the main model would be
observed. Thus, it is plausible to infer that, from the specification point of view, the model is
robust.
4.3.2. Check for alternative explanations
As a check for alternative explanations, I address two issues. The first test is for a
possible endogenous relationship between dividend payout and Institutional Investors. One
concern about the main model is that it is hard to disentangle the selection bias that can occur
when Institutional Investors select banks in which to invest. One possible solution involves
using instrumented variables to mitigate this problem.

62
Table 12 includes the same three regressions as Table 11 using instrumented
variables Tobit (IVTOBIT) instead of Tobit. The instrumented variable is Institutional
Investors. The instruments are the past levels of Institutional Investors and the variable big
bank (see Table 6). The coefficients of all of the variables differ only slightly from the
original model, and more importantly, all of the variables, including my main variable of
interest, Institutional Investors x crisis, remain unchanged, maintaining the same significance
and signal. This problem, the endogeneity of Institutional Investors and banks, will be
addressed again using an alternative approach.
The second robustness check for alternative explanations seeks to confirm the
hypothesis that those banks that pay greater dividends (over 40%7 of their earnings) are also
those that rely more on funds from Institutional Investors (signaling hypothesis). To test this
hypothesis, I created a binary variable that has a value of 1 for banks that pay dividends
greater than or equal to 40% of earnings and a value of 0 for banks that pay less than 40%.
Table 13 shows that Institutional Investors is positively related to the high payout dummy
after controlling for several sources of bank heterogeneity and other factors that affect the
dividend policy. The coefficient is statistically significant at the 1% level.
To mitigate endogeneity problems between ROA and high level of dividends and
between Institutional Investors and high level of dividends, I also run instrumented
regressions using IVPROBIT instead of Probit. The results (Table 13, columns 2 and 3)
show differences only in the instrumented variable. When ROA is instrumented (column 2),
its coefficient becomes statistically significant and its value increases. When Institutional
Investors is instrumented (column 3), its coefficient slightly is increased in value. Neither
7 The value 40% was chosen because of the mandatory minimum dividends in Brazil. Brazilian law requires firms to pay out at least 25% of their earnings. Changes in the value of the dummy high dividends to 50% do not affect the results.

63
variation (column 2 or 3) affects the statistical significance or the signal of the Institutional
Investors parameter.
Table 12 – Factors that affect the payment of dividends with IV
Factors that affect the payment of dividends in Brazilian banks. This table exhibits Instrumented Variables Tobit regressions (IVTOBIT). The dependent variable in the models 1 and 2 is PAYOUT EARNING. The dependent variable in the model 3 is PAYOUT EQUITY. Model 1 represents the main model, with a dummy for crisis (2008 Turmoil) and an interaction between Institutional Investors and crisis. Models 2 and 3 represent specification robustness for the main model without the crisis dummy and the interaction between Institutional Investors. Models 1, 2 and 3 use instrumental variables to handle the endogeneity of Institutional Investors. The instruments are Big Banks and the lagged value of the instrumented variable. The sample includes all banks operating in Brazil between 2001 and 2009 except banks belonging to conglomerates. All models have dummies for years. Absolute values of t-statistics of the coefficients of the independent variables are shown in the parentheses. The significance levels are * p<0.10, ** p<0.05, *** p<0.01. Dependent Variable Payout/Earnings Payout/Equity Expected (1) (2) (3) Sign IVTOBIT IVTOBIT IVTOBIT Institutional Investors (+) 0.2403*** 0.2057*** 0.0397*** (3.04) (3.45) (3.23) Crisis (Dummy) -0.1245 (-1.48) Institutional Investors x Crisis (+) 0.6053*** (3.03) CD interest rate (-) -5.3658* -6.3282** -1.7727*** (-1.78) (-2.00) (-2.71) Return on Assets (ROA) (+) 3.1389*** 5.4585*** 1.5958*** (8.02) (5.45) (7.66) Firm Size (+) 0.0875*** 0.0784*** 0.0156*** (7.12) (5.86) (5.63) Capital (L1) (+/-) -0.3392*** -0.5050*** -0.1336*** (-3.22) (-4.28) (-5.48) Leverage (L1) (+/-) -0.3391*** -0.0091** -0.0013 (-2.64) (-2.01) (-1.43) Governmental (-) -0.0573 -0.0726 -0.0130 (0.86) (-1.07) (-0.93) Publicly Traded (-) -0.2542*** -0.2301** -0.0727*** (-2.84) (-2.52) (-3.82) Foreign Subsidiaries (-) -0.2909*** -0.2653*** -0.0366*** (-6.88) (-5.89) (-3.97) Growth in Credit (-) -0.0123 -0.0121 -0.0052 (-0.76) (-0.74) (-1.52) Credit Risk (-) -0.9384*** -0.6085 0.0556 (-2.54) (-1.52) (0.70) Constant -0.8680*** -0.8263*** -0.1898*** (-5.14) (-4.75) (-5.28) Year Dummy Yes Yes Yes Number of Observations 1082 1082 1084 Number of Banks 168 168 168 Log-likelihood -407.7052 1097.7469 2193.8473 Source: Author
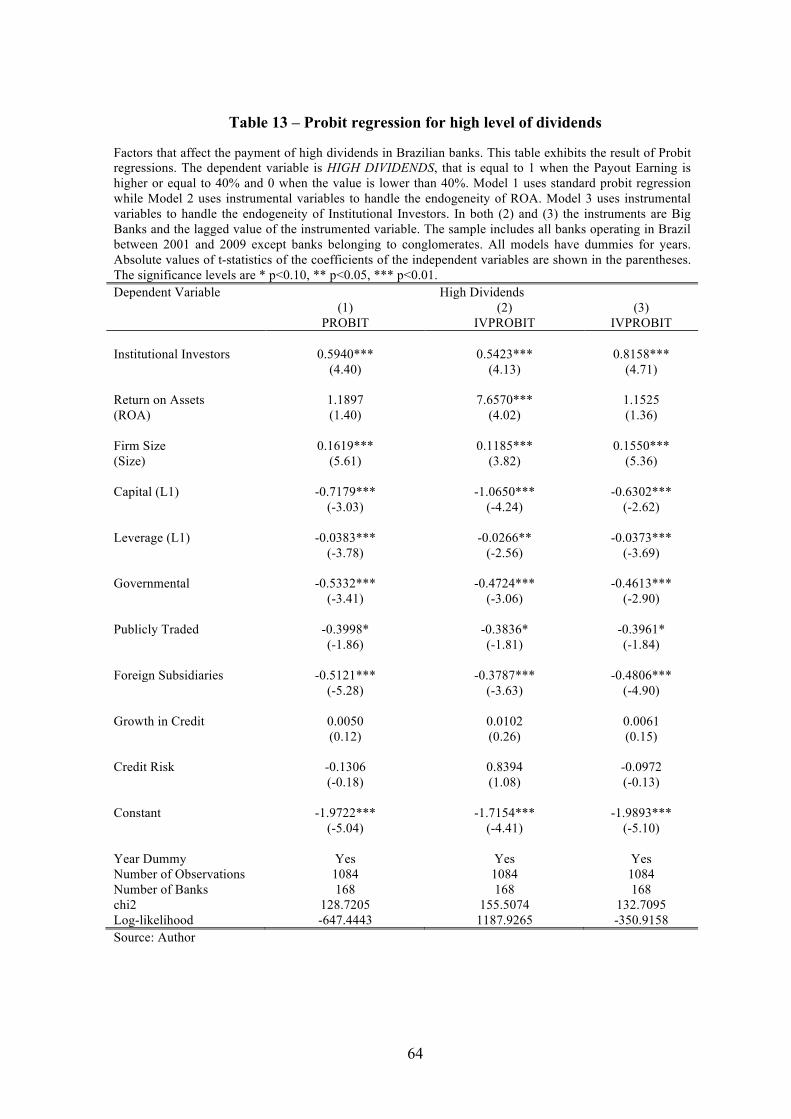
64
Table 13 – Probit regression for high level of dividends
Factors that affect the payment of high dividends in Brazilian banks. This table exhibits the result of Probit regressions. The dependent variable is HIGH DIVIDENDS, that is equal to 1 when the Payout Earning is higher or equal to 40% and 0 when the value is lower than 40%. Model 1 uses standard probit regression while Model 2 uses instrumental variables to handle the endogeneity of ROA. Model 3 uses instrumental variables to handle the endogeneity of Institutional Investors. In both (2) and (3) the instruments are Big Banks and the lagged value of the instrumented variable. The sample includes all banks operating in Brazil between 2001 and 2009 except banks belonging to conglomerates. All models have dummies for years. Absolute values of t-statistics of the coefficients of the independent variables are shown in the parentheses. The significance levels are * p<0.10, ** p<0.05, *** p<0.01. Dependent Variable High Dividends (1) (2) (3) PROBIT IVPROBIT IVPROBIT Institutional Investors 0.5940*** 0.5423*** 0.8158*** (4.40) (4.13) (4.71) Return on Assets 1.1897 7.6570*** 1.1525 (ROA) (1.40) (4.02) (1.36) Firm Size 0.1619*** 0.1185*** 0.1550*** (Size) (5.61) (3.82) (5.36) Capital (L1) -0.7179*** -1.0650*** -0.6302*** (-3.03) (-4.24) (-2.62) Leverage (L1) -0.0383*** -0.0266** -0.0373*** (-3.78) (-2.56) (-3.69) Governmental -0.5332*** -0.4724*** -0.4613*** (-3.41) (-3.06) (-2.90) Publicly Traded -0.3998* -0.3836* -0.3961* (-1.86) (-1.81) (-1.84) Foreign Subsidiaries -0.5121*** -0.3787*** -0.4806*** (-5.28) (-3.63) (-4.90) Growth in Credit 0.0050 0.0102 0.0061 (0.12) (0.26) (0.15) Credit Risk -0.1306 0.8394 -0.0972 (-0.18) (1.08) (-0.13) Constant -1.9722*** -1.7154*** -1.9893*** (-5.04) (-4.41) (-5.10) Year Dummy Yes Yes Yes Number of Observations 1084 1084 1084 Number of Banks 168 168 168 chi2 128.7205 155.5074 132.7095 Log-likelihood -647.4443 1187.9265 -350.9158 Source: Author
65
4.4. Placebo Tests
To ensure that the inferences regarding dividend payments during the crisis are true, I
run an alternative placebo model where the crisis dummy receives a value of 1 for other years
to test the behavior of the interaction Institutional Investors x crisis. The expectation is that,
because the other years are not crisis periods, the interaction between the two variables will
not be significant because the banks do not need to increase their signaling in a non-crisis
economic environment. Columns 3 and 4 of Table 14 report the placebo tests for the crisis
dummy assuming a value of 1 for 2006 and a value of 0 for other years and show, as
expected, that the placebo crisis dummy interaction with Institutional Investors is not
significant while all of the other variables maintain their signal and their significance. I repeat
this placebo test for all of the other years in the sample period and obtain similar results (not
reported).

66
Table 14 – Factors that affect dividends with placebo test
Factors that affect the payment of dividends in Brazilian banks. This table exhibits Tobit and Instrumented tobit regressions. The dependent variable in the models 1 to 4 is PAYOUT EARNING. Models 1 and 2 represents the main model. Models 3 and 4 represents the main model, but with the addition of a placebo dummy for crisis (I use 2006). Models 2 and 4 use instrumental variables to handle the endogeneity of Institutional Investors. In both (2) and (4) the instruments are Big Banks and the lagged value of the instrumented variable. The sample includes all banks operating in Brazil between 2001 and 2009 except banks belonging to conglomerates. All models have dummies for years. Absolute values of t-statistics of the coefficients of the independent variables are shown in the parentheses. The significance levels are * p<0.10, ** p<0.05, *** p<0.01. Dependent Variable Payout/Earnings Payout/Earnings Real Crisis Dummy Placebo Crisis Dummy Expected (1) (2) (3) (4) Sign TOBIT IVTOBIT TOBIT IVTOBIT Institutional Investors (+) 0.1532*** 0.2403*** 0.2221*** 0.3077*** (2.69) (3.04) (3.65) (3.69) Crisis (Dummy) -0.1482* -0.1245 -0.1460** -0.1239 (-1.78) (-1.48) (-1.96) (-1.51) Institutional Investors x Crisis (+) 0. 6781*** 0.6053*** -0.1153 -0.1902 (3.05) (3.03) (-0.93) (-1.18) CD interest rate (-) -4.6100 -5.3658* -4.5041 -5.2749* (-1.34) (-1.78) (-1.28) (-1.73) Return on Assets (ROA) (+) 3.1565*** 3.1389*** 3.1350*** 3.1295*** (8.10) (8.02) (8.05) (7.96) Firm Size (+) 0.0897*** 0.0875*** 0.0903*** 0.0881*** (7.63) (7.12) (7.64) (7.10) Capital (L1) (+/-) -0.3722*** -0.3392*** -0.3764*** -0.3454*** (-3.66) (-3.22) (-3.67) (-3.25) Leverage (L1) (+/-) -0.0114*** -0.3391*** -0.0125*** -0.0121*** (-2.78) (-2.64) (-3.06) (-2.86) Governmental (-) -0.0778 -0.0573 -0.0720 -0.0544 (-1.37) (0.86) (-1.26) (-0.81) Publicly Traded (-) -0.2587*** -0.2542*** -0.2300*** -0.2315*** (-3.18) (-2.84) (-2.64) (-2.59) Foreign Subsidiaries (-) -0.3011*** -0.2909*** -0.3015*** -0.2920*** (-7.16) (-6.88) (-7.13) (-6.86) Growth in Credit (-) -0.0123 -0.0123 -0.0129 -0.0129 (-0.72) (-0.76) (-0.76) (-0.80) Credit Risk (-) -0.9487*** -0.9384*** -0.9876*** -0.9747*** (-2.85) (-2.54) (-2.98) (-2.63) Constant -0.8580*** -0.8680*** -0.8746*** -0.8847*** (-5.21) (-5.14) (-5.27) (-5.21) Year Dummy Yes Yes Yes Yes Number of Observations 1082 1082 1082 1082 Number of Banks 168 168 168 168 Log-likelihood -728.9901 -407.7052 -734.7227 -410.7092 Source: Author
67
4.5. Further signaling evidence in closely held banks
The previous results support the finding that dividends are not used as a tool for
debtholder expropriation in Brazilian banks either during the financial crisis or in normal
times. However, I have used data from all banks (governmental, publicly traded, foreign and
closely held). Higher dividends for closely held banks during the crisis could indicate that
there is a “cash out” movement because these banks are less likely to be bailed out by the
government. To test for this alternative explanation for the previous results, I create another
variation of the main model by adding a triple interaction between the 2008 crisis,
Institutional Investors and Closely held banks. This interaction is used to discover whether the
previous results are robust when only the closely held banks’ behavior during the 2008
turmoil is assessed and, furthermore, whether these results are associated with the reliance of
banks on Institutional Investors.
The results (See Table 15, column 1) demonstrate, as expected, that the triple
interaction between closely held, crisis and Institutional Investors is positive despite not being
statistically significant (t = 1.33). Thus, closely held banks with more Institutional Investors
paid more dividends during the 2008 turmoil (Crisis = 1), controlling for other factors. The
negative coefficient for the Crisis dummy indicates that, in general, banks paid fewer
dividends during the 2008 turmoil. In short, although banks paid fewer dividends during the
2008 crisis, closely held banks with more Institutional Investors increased their dividends.
This result confirms the hypothesis regarding the signaling purpose of bank dividends.
Considering that a “cash out” movement appears less likely to occur in those banks that issue
more CDs to Institutional Investors than in those that issue fewer, this result is again
consistent with the signaling theory.

68
Table 15 – Factors that affect dividends with triple interaction
Factors that affect the payment of dividends in Brazilian banks. This table exhibits Tobit regressions. The dependent variable in the models 1 and 2 is PAYOUT EARNING. Model 1 represents the main model with the addition of a dummy for crisis (2008 Turmoil) and a triple interaction between Institutional Investors, publicly traded banks and crisis. Model 2 represents the main model, but instead, with the addition of a placebo dummy for crisis (I use 2006) and the same triple interaction of the column 1 but using the placebo crisis instead of the real dummy for crisis. The sample includes all banks operating in Brazil between 2001 and 2009 except banks belonging to conglomerates. All models have dummies for years. Absolute values of t-statistics of the coefficients of the independent variables are shown in the parentheses. The significance levels are * p<0.10, ** p<0.05, *** p<0.01. Dependent Variable Payout/Earnings Expected (1) (2) Sign Real Crisis Dummy Placebo Crisis Dummy Institutional Investors (+) 0.2316*** 0.3407 *** (2.70) (3.71) Crisis (Dummy) (-) -0.1423* -0.1444* (-1.71) (-1.94) Closely Held x Crisis x (+) 0.3168 -0.2484 Institutional Investors (1.33) (-1.61) CD interest rate (-) -4.6100 -4.2706 (-1.36) (-1.22) Return on Assets (+) 3.1809*** 3.1541*** (ROA) (8.19) (8.15) Firm Size (+) 0.0924*** 0.0924*** (SIZE) (7.82) (7.81) Capital (L1) (+/-) -0.3742*** -0.3812*** (-3.69) (-3.73) Leverage (L1) (-) -0.0114*** -0.0126*** (-2.81) (-3.06) Closely Held (+) 0.1182** 0.1117* (1.99) (1.86) Publicly Traded (-) -0.2265*** -0.1947** (-2.66) (-2.21) Foreign Subsidiaries (-) -0.2362*** -0.2442*** (-4.48) (-4.60) Growth in Credit (-) -0.0114 -0.0125 (-0.67) (-0.74) Credit Risk (-) -0.9275*** -0.9747*** (-2.78) (-2.92) Constant -0.9867*** -0.9887*** (-5.07) (-5.05) Year Dummy Yes Yes Number of Observations 1082 1082 R2 0.1623 0.1554 Log-likelihood -726.8580 -732.8875 Source: Author

69
The triple interaction was also used in a test for the placebo crisis dummy to increase
the robustness of the previous findings. When the year 2006 (without crisis) is used as a crisis
year, the parameter changes its signal but not its statistical significance (Table 15, column 2).
To confirm the findings, I also use all of the other years as placebo dummies for the crisis,
and I do not find any other year with statistical significance for the relationship between
crisis, closely held banks and Institutional Investors (results not reported).
Finally, I check for one possible pitfall in the findings about signaling to depositors.
One could argue that the inclusion of publicly traded banks, governmental banks and
subsidiaries of foreign banks can distort the results because they would have many different
signaling targets. Conversely, closely held domestic banks, which are owned and managed by
a small group, would have debtholders (depositors) as the only possible target for signaling, if
they have any target at all. To address this issue, I run the main model for the domestic
closely held banks only. Despite the reduction in sample size, the results remain practically
unchanged compared to the results obtained when the entire sample was used (See Table 16).
None of the parameters experience a signal change or a substantial change in their statistical
significance.
Of particular interest is the fact that, despite the sample reduction, the crisis dummy
maintained its negative sign while the interaction between the crisis dummy and Institutional
Investors remained positive and statistically significant.
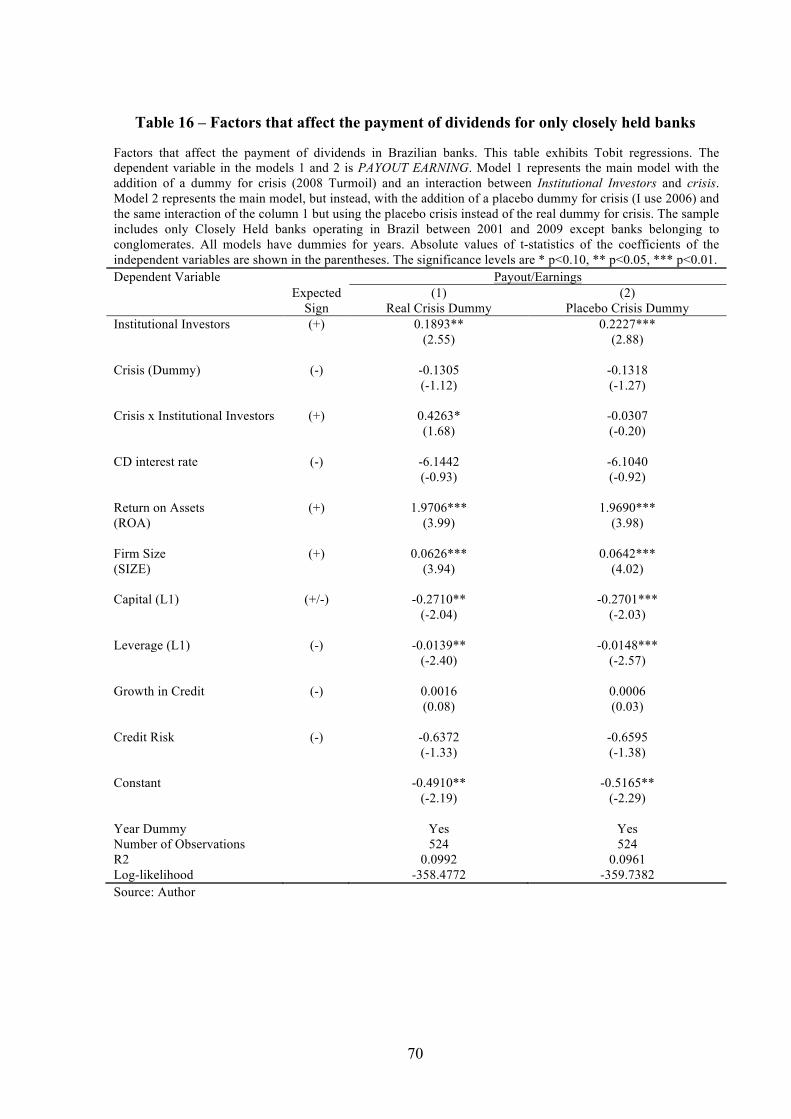
70
Table 16 – Factors that affect the payment of dividends for only closely held banks
Factors that affect the payment of dividends in Brazilian banks. This table exhibits Tobit regressions. The dependent variable in the models 1 and 2 is PAYOUT EARNING. Model 1 represents the main model with the addition of a dummy for crisis (2008 Turmoil) and an interaction between Institutional Investors and crisis. Model 2 represents the main model, but instead, with the addition of a placebo dummy for crisis (I use 2006) and the same interaction of the column 1 but using the placebo crisis instead of the real dummy for crisis. The sample includes only Closely Held banks operating in Brazil between 2001 and 2009 except banks belonging to conglomerates. All models have dummies for years. Absolute values of t-statistics of the coefficients of the independent variables are shown in the parentheses. The significance levels are * p<0.10, ** p<0.05, *** p<0.01. Dependent Variable Payout/Earnings Expected (1) (2) Sign Real Crisis Dummy Placebo Crisis Dummy Institutional Investors (+) 0.1893** 0.2227*** (2.55) (2.88) Crisis (Dummy) (-) -0.1305 -0.1318 (-1.12) (-1.27) Crisis x Institutional Investors (+) 0.4263* -0.0307 (1.68) (-0.20) CD interest rate (-) -6.1442 -6.1040 (-0.93) (-0.92) Return on Assets (+) 1.9706*** 1.9690*** (ROA) (3.99) (3.98) Firm Size (+) 0.0626*** 0.0642*** (SIZE) (3.94) (4.02) Capital (L1) (+/-) -0.2710** -0.2701*** (-2.04) (-2.03) Leverage (L1) (-) -0.0139** -0.0148*** (-2.40) (-2.57) Growth in Credit (-) 0.0016 0.0006 (0.08) (0.03) Credit Risk (-) -0.6372 -0.6595 (-1.33) (-1.38) Constant -0.4910** -0.5165** (-2.19) (-2.29) Year Dummy Yes Yes Number of Observations 524 524 R2 0.0992 0.0961 Log-likelihood -358.4772 -359.7382 Source: Author

71
I also use a placebo crisis dummy to increase the robustness of my findings. When I
use the year 2006 (without crisis) as a crisis year, the parameter changes its signal and
becomes statistically insignificant (Table 16, column 2). To confirm the findings, I also use
all of the other years as placebo dummies for the crisis and find similar results (not reported).
I also run a test including a sample of only domestic closely held banks to test the
hypothesis that those banks that pay more dividends (over 40% of their profits) are also those
that obtain more funds from Institutional Investors (signaling hypothesis). Again, I create a
binary variable that has a value of 1 for those banks that pay dividends greater than or equal to
40% of their earnings and a value of 0 for those banks that pay less than 40%. Table 17
shows that even within a sample containing only domestic closely held banks, Institutional
Investors is positively related to a high level of dividend payout.
Finally, I also run the alternative model (see Table 12) as a stability robustness check
of the parameters of the factors that affect dividend payments for the sample comprising only
closely held banks. An alternative explanation for the results is that closely held banks have a
different target for signaling and therefore have different payout factors. Table 18 shows the
results of this test. Despite the sample reduction, all of the parameters maintain the same sign
and statistical significance. Institutional Investors is statistically significant at the 1% level.

72
Table 17 – Factors that affect the payment of high dividends for only closely held banks
Factors that affect the payment of high dividends in Brazilian banks. This table exhibits the result of Probit regressions. The dependent variable is HIGH DIVIDENDS, that is equal to 1 when the Payout Earning is higher or equal to 40% and 0 when the value is lower than 40%. Model 1 uses standard probit regression while Model 2 uses instrumental variables to handle the endogeneity of ROA. The sample includes all private closely held banks operating in Brazil between 2001 and 2009 except banks belonging to conglomerates. All models have dummies for years. Absolute values of t-statistics of the coefficients of the independent variables are shown in the parentheses. The significance levels are * p<0.10, ** p<0.05, *** p<0.01. Dependent Variable High Dividends (1) (2) PROBIT IVPROBIT Institutional Investors 0.6783*** 0.5805*** (3.26) (3.01) Return on Assets 4.6746*** 15.6181*** (ROA) (3.25) (6.82) Firm Size 0.2429*** 0.1184** (Size) (5.38) (2.13) Capital (L1) -0.9506** -1.6492*** (-2.18) (-3.84) Leverage (L1) -0.0375** -0.0220 (-2.46) (-1.54) Growth in Credit -0.0356 -0.0036 (-0.51) (-0.06) Credit Risk -0.4944 1.3513 (-0.46) (1.09) Constant -3.7799*** -2.3835*** (-5.77) (-3.06) Year Dummy Yes Yes Number of Observations 498 498 chi2 72.3267 156.0937 Log-likelihood -263.2371 581.1964
Source: Author

73
Table 18 – Factors that affect only closely held banks with IV
Factors that affect the payment of dividends in Brazilian banks. This table exhibits the result of Tobit regressions. The dependent variable in the models 1 and 2 is PAYOUT EQUITY. Model 1 uses instrumental variables to handle the endogeneity of Institutional Investors. The instruments are Big Banks and the lagged value of the instrumented variable. The sample includes all private closely held banks operating in Brazil between 2001 and 2009 except banks belonging to conglomerates. All models have dummies for years. Absolute values of t-statistics of the coefficients of the independent variables are shown in the parentheses. The significance levels are * p<0.10, ** p<0.05, *** p<0.01. Dependent Variable Payout/Equity Expected (1) (2) Sign TOBIT IVTOBIT Institutional Investors (+) 0.0362*** 0.0507*** (2.83) (3.18) CD interest rate (-) -1.5025 -1.7378** (-1.14) (-2.20) Return on Assets (+) 0.5304*** 0.5258*** (ROA) (4.05) (6.22) Firm Size (+) 0.0143*** 0.0136*** (SIZE) (4.80) (4.31) Capital (L1) (+/-) -0.0796*** -0.0748*** (-3.32) (-3.23) Leverage (L1) (-) -0.0032*** -0.0033*** (-3.23) (-3.32) Growth in Credit (-) 0.0013 0.0014 (0.30) (0.38) Credit Risk (-) 0.0363 0.0410 (0.37) (0.49) Constant -0.1247*** -0.1222*** (-3.17) (-2.83) Year Dummy Yes Yes Number of Observations 525 525 Log-likelihood 263.3508 516.9445 Source: Author
74
4.6. Endogenous relationship between Payout and Institutional Investors
To obtain more evidence against the alternative explanation that Institutional Investors
select banks for their profitability and thus choose banks with a greater likelihood of paying
higher dividends, I run some regressions to investigate which factors affect this selection.
Using panel data, fixed effects and the control variables (see Table 6) as regressors, I
examine two dependent variables: (1) the percentage of CDs held by Institutional Investors
out of the total number of CDs issued by the bank and (2) the natural logarithm of the total
number of CDs issued.
The first variable investigates which factors affect the selection of banks by
Institutional Investors. I expect that, controlling for other heterogeneous factors of banks such
as size, leverage, capital adequacy, growth and risk, Institutional Investors do not select better
banks using either the Return on Assets or the Payout level. As an alternative, a dynamic
version of the first dependent variable was created. This dynamic version includes the use of
the past level of Institutional Investors as an explanatory variable to determine the
maintenance of the portfolios held by Institutional Investors over time. The second dependent
variable investigates which factors affect bank selection by all types of investors.
Table 19, columns 1 and 2, show that, as expected, neither Return on Assets (ROA) or
Payout are positively related with Institutional Investors. ROA is statistically significant but
has a negative sign, indicating that, controlling for other factors, Institutional Investors select
banks with a lower ROA. The coefficient for Payout is not statistically significant.
Institutional Investors select larger banks (see the positive sign of Size) and banks with lower
Capital Adequacy Ratio, Leverage and Credit Risk. As expected, the past levels of
Institutional Investors are positively related and statistically significant.

75
Table 19, column 3, shows that, when choosing banks in which to invest their money,
investor reactions are generally positively correlated with Size and negatively correlated with
payout, capital adequacy, leverage, Growth in credit and Credit Risk.
Table 19 allows us to dismiss any suspicion of a selection bias from Institutional
Investors that could be an alternative explanation for my findings.

76
Table 19 – Factors that affect the selection of banks by Institutional Investors
Factors that affect the selection of banks by Institutional Investors. The dependent variable on columns 1 and 2 is the percentage of CDs held by Institutional Investors in the total amount of CDs issued by the bank. The model of column 1 and 3 exhibits results for fixed effects static panel while column 2 exhibit results for fixed effects dynamic panel data. The dependent variable in column 3 is the natural logarithm of the total amount of CDs issued. All models have dummies for years. Absolute values of t-statistics of the coefficients of the independent variables are shown in the parentheses. The significance levels are * p<0.10, ** p<0.05, *** p<0.01.
Dependent Variable % of Institutional Investors
% of Institutional Investors Total of CD Issued
(1) (2) (3) % of Institutional Investors (L1) 0.3927*** (8.03) Return on Assets -0.4172** -0.2897* 0.2831 (ROA) (-2.28) (-1.89) (0.28) Payout/Earnings -0.0126 -0.0089 -0.2717** (-0.55) (-0.50) (-2.44) CD interest rate 0.9875 1.2237 -8.3778 (0.88) (1.19) (-0.80) Crisis (Dummy) -0.1384*** -0.0927*** 0.4555* (-3.71) (-3.06) (1.87) Firm Size 0.0481** 0.0386** 0.7762*** (SIZE) (2.44) (2.51) (5.16) Capital (L1) -0.2229** -0.1377** -1.4996* (-2.59) (-2.17) (-1.92) Leverage (L1) -0.0077** -0.0049* -0.0361** (-2.19) (-1.75) (-2.10) Growth in Credit -0.0048 0.0005 -0.1557*** (-0.65) (0.06) (-2.84) Credit Risk -0.4164* -0.2788 -3.2455*** (-1.85) (-1.49) (-2.78) Constant -0.2184 -0.2606 4.3126** (-0.82) (-1.25) (2.14) Year Dummy Yes Yes Yes Fixed Effects Yes Yes Yes Number of Observations 1082 1082 873 R2 0.0758 0.2240 0.3519 Log-likelihood 363.1651 457.7637 -1117.7571 Source: Author

77
5. Conclusion
This paper investigates whether bank debt composition affects the dividend payment
during the financial crisis and in crisis-free times. Specifically, I study whether dividends are
used to signal the banks’ future prospects to depositors. I exploit distinctive features of the
Brazilian banking industry, such as the existence of several types of banks in terms of both
ownership and size. In particular, I exploit the unique ownership structure found in Brazilian
banks, with emphasis on the fact that there are several closely held banks that are typically
owned by a small group of stockholders who also manage the bank and that these banks are
allowed to circumvent the minimum dividend requirements.
Previous studies on dividend policy assume that shareholders are the prime targets of
signaling. However, most Brazilian banks are privately held and owner-managed (i.e., closely
held). Thus, in these banks, dividends convey no new information to the shareholders, and the
target for signaling, if any, should be different. The hypothesis is that banks use dividends to
signal the holders of the certificates of deposit (CDs), who are the main providers of funding
for Brazilian banks. Banks use dividends to send signals to their debtholders (depositors)
about the future profitability of their portfolio of assets. Not all of the debtholders are equally
likely to be signaled through dividends, however, because some of the depositors are known
to be more information-sensitive than others. I show, in an unprecedented manner, that
institutional depositors are the main targets of dividend signaling.
I use annual data from 168 banks active in Brazil between 2001 and 2009. A highlight
of the database is that, in addition to publicly available data, this database comprises the
balances of the certificates of deposits belonging to Institutional Investors, non-financial firms
and individual investors, as well as the annual weighted average interest rates paid on
certificates of deposit by each bank.

78
The main finding is that depositors are indeed the targets of dividend signaling. I show
that, controlling for other bank characteristics, those banks with a greater percentage of
deposits issued to information-sensitive depositors (Institutional Investors) pay higher
dividends. This behavior is even more pronounced during the financial crisis. Therefore, the
bank dividends are not used as a tool for debtholder expropriation, as discussed by Acharya et
al. (2009). The evidence strongly suggests that this was not the case in Brazil because both the
publicly traded and closely held banks that exhibited greater reliance on Institutional Investors
for funding paid more dividends during the 2008 turmoil. Because this type of depositor is
more information sensitive, a “cash out” movement would be expected to be more
pronounced in those banks that rely on other, less information-sensitive types of depositors
for funding. Thus, a “cash out” movement appears to be implausible.
I also identify a negative relationship between the payment of dividends and the
interest rate paid on certificates of deposit, indicating that, controlling for other factors, banks
that have a higher cost of funding pay fewer dividends, consistent with the idea that dividend
signaling is costly. Additionally, I find that dividend payout in Brazilian banks has a positive
relationship with both profitability and size and a negative relationship with both capital
adequacy and growth of the loan portfolio. I also find that publicly traded banks pay fewer
dividends than closely held banks and that governmental banks pay fewer dividends than their
private counterparts. These findings are consistent with both the signaling theory (i.e., banks
use dividends as a costly signal of bank asset quality) and the idea that banks with greater
investment opportunities retain more earnings.

79
6. References
ACHARYA V.V.; GUJRAL I.; SHIN, H.S. Dividend and Bank Capital in the Financial Crisis
of 2007-2009. Working paper, http://ssrn.com/abstract=1362299, 2009
AIVAZIAN, V.; BOOTH, L.; CLEARY, S. Do Emerging Market Firms Follow Different
Dividend Policies From U.S. Firms? Journal of Financial Research. Vol. 26, Issue 3, p. 371–
387, September 2003.
AÏT-SAHALIA, Y.; ANDRITZKY, J.; JOBST, A.; NOWAK, S.; TAMIRISA, N. Market
response to policy initiatives during the global financial crisis. Working Paper 15809
http://www.nber.org/papers/w15809. 2010.
AMIHUD, Y; MURGIA M. Dividends, Taxes, and Signaling: Evidence from Germany. The
journal of finance – Vol. LII, No. 1 – March 1997
BARCLAY, M.J.; SMITH, C.W. Jr.; WATTS, R.L. The determinants of corporate leverage
and dividend policies. Journal of Applied Corporate Finance (Winter) p. 4-19. 1995.
BESSLER, W.; NOHEL, T. Asymmetric information, dividend reductions, and contagion
effects in bank stock returns. Journal of Banking and Finance, Vol. 24, Issue 11, November
2000, Pages 1831-1848
BEN-DAVID, I.; FRANZONI, F.; MOUSSAWI, R. Hedge fund stock trading in the financial
crisis of 2007-2009, AFA 2011 Denver Meetings Paper, available at:
http://ssrn.com/abstract=1550240.
BHATTACHARYA, S. Imperfect Information, Dividend Policy, and ‘The Bird In The Hand’
Fallacy. Bell Journal of Economics, 10 (1), 259-270. 1979.
BLACK, F. The Dividend Puzzle. Journal of Portfolio Management, 2 (Winter 1976), 5-8.
BLACK, F.; SCHOLES. M. The effects of dividend yield and dividend policy on common
stock prices and returns. Journal of Financial Economics. Vol. 1, Issue 1, May 1974, pp 1-22

80
BOLDIN, R.; LEGGETT, K. (1995). Bank Dividend Policy as a Signal of Bank Quality.
Financial Services Review, 4(1): 1-8.
BOULTON, T. J.; BRAGA-ALVES, M. V.; SHASTRI, K. Payout Policy in Brazil:
Dividends versus Interest on Equity. X Brazilian Finance Meeting, 2010, São Paulo. Anais
eletrônicos. São Paulo:SBFIn,2010.
BRITO, N. R. O.; RIETTI, R. C. Efeito Clientela, Níveis Marginais de Taxação e Eficiência:
o caso de dividendos no mercado acionário brasileiro. In; Brito, N.O (org.). O Mercado de
Capitais e a Estrutura Empresarial Brasileira. Rio de Janeiro: [s.n] 1981.
BRITO, R. D.; SILVA, J. C. Testando as previsões de trade-off e pecking order sobre
dividendos e dívida no Brasil. Estudos Econômicos, vol 35, n.1,2005
BROCKMAN, P.; UNLU, E.. Dividend policy, creditor rights, and the agency costs of debt.
Journal of Financial Economics, Vol. 92 (2009), p. 276-299.
CASEY, K.M.; DICKENS, R.N. The effects of tax and regulatory changes on commercial
bank dividend policy. The Quarterly Review of Economics and Finance. Vol 40 (2000) p.
279-293.
CHANG, R.P.; RHEE. G. The impact of personal taxes on corporate dividend policy and
capital structure decisions. Financial Management, 19, 21-31. 1990.
CHAREST, G. Dividend Information, Stock Returns and Market Efficiency II, Journal of
Financial Economics, v.6, n.2/3, p. 297-330, jun-set.1978.
CORNETT, M. M., FAYMAN, A., MARCUS, A., TEHRANIAN H., 2008, “Banks, IPOs,
Dividends and Takeovers,” Working Paper, Boston College.
CORREIA, L.F; AMARAL, H.F. O impacto da política de dividendos sobre a rentabilidade
de títulos negociados na Bovespa no período de 1994 a 2000. In: Encontro EnANPAD, 26.
2002, Salvador, Anais. Salvador:ANPAD, 2002.
81
DeAngelo, H., DeAngelo, L., and D. Skinner, 2004. Are dividends disappearing? Dividend
concentration and the consolidation of earnings. Journal of Financial Economics 72, 425-456.
DEMPSEY, S.J.; LABER, G. Effects of agency and transaction costs on dividend payout
ratios: further evidence of the agency-transaction cost hypothesis. The Journal of Financial
Research. Nr. 15, 317-321. 1992.
DEMPSEY, S.J.; LABER, G.; ROZEFF, M. Dividend policies in practice: is there an industry
effect? Quarterly Journal of Business and Economics. Nr. 32, p.3-13. 1993.
DIAMOND, D. W.; DYBVIG, P. H. Bank Runs, Deposit Insurance, and Liquidity. The
Journal of Political Economy, Vol. 91, No. 3. (Jun., 1983), pp. 401-419.
DICKENS, R.N.; CASEY, K.M.; NEWMAN, J.A. Bank Dividend Policy: Explanatory
Factors. Quarterly Journal of Business and Economics. Nr. 41, p.3-12. 2002.
EASTERBROOK, F. H. Two Agency-Cost Explanations of Dividends. The American
Economic Review, Vol. 74, No. 4 (Sep., 1984), p. 650-659.
Fama, E. and K. French, 2001. Disappearing dividends: Changing firm characteristics or
lower propensity to pay? Journal of Financial Economics 60, 3-43.
FATEMI, A.; BILDIK, R. Yes, dividends are disappearing: Worldwide evidence. Journal of
Banking & Finance No. 36 p.662–677 – 2012
FIRMINO, A.L.G; SANTOS, A.G.Q; MATSUMOTO, A.S. Dividendos Interessam? Uma
constatação empírica recente sobre a relevância da política de dividendos na bolsa de valores
de São Paulo (1996 a 2002). In: ENCONTRO BRASILEIRO DE FINANÇAS, 4. 2004, São
Paulo. Anais eletrônicos. São Paulo:SBFIN, 2004.
FLANNERY, M. J.; SORESCU S. M. Evidence of Bank Market Discipline in Subordinated
Debenture Yields: 1983- 1991. The Journal of Finance, Vol. 51 (1996), p. 1347-1377.

82
FRANKFURTER, G.M.; WOOD JR., B.G. Dividend policy theories and their empirical tests.
International Review of Financial Analisys,11. Pp. 111-138. 2002.
GABRIELLI, M. F.; SAITO, R. Recompra de ações no Brasil: regulamentação e impactos
sobre minoritários. Anais. Enampad, 2003.
GARCIA, A.L.G; BUGARIN, M.S. Incentivos para os administradores de empresas estatais:
o papel dos dividendos mínimos obrigatórios e o desenho ótimo dos salários. In:
ENCONTRO BRASILEIRO DE FINANÇAS, 1. 2001, São Paulo. Anais Eletrônicos. São
Paulo:SBFIN, 2001.
GOLDFAJN, I.; HENNINGS, K.; MORI, H. Brazil's financial system: Resilience to shocks,
no currency substitution, but struggling to promote growth. Working paper
http://www.bcb.gov.br. June, 2003.
GRINSTEIN, Y.; MICHAELY, R. Institutional Holdings and Payout Policy. The journal of
finance • vol. lx, no. 3 • june 2005.
GRULLON, G.; MICHAELY, R. Dividends, Share Repurchases, and the Substitution
Hypothesis. The Journal of Finance. Vol. 57, nr. 4. August, 2002.
GRULLON, G.; MICHAELY, R. The information content of share repurchase programs, The
Journal Of Finance • Vol. 59, No. 2. 2004, pp 651-80.
GRULLON, G.; MICHAELY, R.; SWAMINATHAN, B. Are dividend changes a sign of firm
maturity? The Journal of Business. Vol. 75, n.3(Jul. 2002) p. 287-424.
GUERCIO, D. D. The distorting effect of the prudent-man laws on institutional equity
investments. Journal of Financial Economics No. 40 (1996) p.31-62
HEINEBERG, R.; PROCIANOY, J. L. Aspectos determinantes do pagamento de proventos
em dinheiro das empresas com ações negociadas na BOVESPA. In: XXVII Enanpad, 2003,
São Paulo. Anais...São Paulo: XXVII Enanpad, 2003.
83
IANNOTTA, G., Market discipline in the banking industry. Evidence from spread dispersion,
European Journal of Finance. Vol. 17, (2011), forthcoming.
JENSEN, M. C. Agency Costs of Free Cash Flow, Corporate Finance, and Takeovers.
American Economic Review, 76 (2), 323-329. 1986
JENSEN, M. C.; MECKLING, W. H. Theory of the Firm: Managerial Behavior, Agency
Costs and Ownership Structure. Journal of Financial Economics, v3, n4, p. 305-360. 1976
JENSEN, G.R.; SOLBERG, D.P.; ZORN, T.S. Simultaneous determination of insider
ownership, debt, and dividend policies. The Journal of Financial and Quantitative Analisys.
Nr. 27, p 247-263. 1992.
JOHN, K.; KNYAZEVA, A. Payout policy, agency conflicts and corporate governance.
Working paper, New York University, 2006.
JOHN, K.; WILLIAMS, Joseph. Dividends, dilution, and taxes: a signaling equilibrium.
Journal of finance, v. 40, 1985.
KANIA, S. L.; BACON, F. W. What factors motivate the corporate dividend decision.
ASBBS E-Journal, v1. n.1. 2005.
KAUKO, K. Why is equity capital expensive for banks?, Proceeding of the Brazilian Central
Bank Seminar on Risks, Financial Stability and Banking Economics (2011), available online
at:
http://bcb.gov.br/pec/depep/Seminarios/2011_VISemRiscosBCB/Arquivos/2011_VISemRisc
osBCB_17h00_KarloKauko.pdf
KOCH, A. S.; AMY X. S. Dividend Changes and the Persistence of Past Earnings Changes,
The Journal Of Finance, Vol. 59, No. 5, 2004, p. 2093-116.
LA PORTA, R., LOPEZ-DE-SILANES, F., SHLEIFER, A., VISHNY, R., Agency Problems
and Dividend Policies Around the World, Journal of Finance, Vol. 55, 2000.

84
LINTNER, J. Distribution of Incomes of Corporations among Dividends, Retained Earnings,
and Taxes. The American Economic Review, 1956.
LONG, M. S.; MALITZ, I. B.; SEFCIK S.E. An Empirical Examination of Dividend Policy
Following Debt Issues, The Journal of Financial and Quantitative Analysis, Vol. 29 (1994), p.
131-144.
MARTINEZ PERIA, M. S., SCHMUKLER, S. L., 2001. Do depositors punish banks for band
behavior? Market discipline, deposit insurance and banking crises, J. Finance, 54 (3), 1029-
1051.
MARTINS, T.C., NOVAES, W., Mandatory dividend rules: Do they make it harder for firms
to invest? J. Corp. Finance (2012), doi:10.1016/j.jcorpfin.2012.05.002
MAYNE, L.S. Bank holding company characteristics and the upstreaming of bank funds.
Journal of Money, Credit and Banking. Vol. 12, n.2, Part 1(May, 1980) p. 209-214.
MILLER, M.; ROCK, K. Dividend Policy under Asymmetric Information. The Journal of
Finance, 1985, Vol. 40, Nº 4, pp. 1031-1051.
MILLER, M..; MODIGLIANI, F. Dividend Policy, Growth and the Valuation of Shares.
Journal of Business, 34, 411-433. 1961.
MOH´D, M. A.; PERRY, L.G.; RIMBEY, J.N. An investigation of the dynamic relationship
between agency theory and dividend policy. The Financial Review.(May) pp. 367-385. 1995.
MYERS, S. C.; MAJLUF, N. S. Corporate Financing and Investment Decisions When Firms
Have Information That Investors Do Not Have. Journal of Financial Economics 13:187–221.
1984.
NISSIM, D; ZIV, A. Dividend Changes and Future Profitability. The Journal of Finance –
Vol LVI no 6 . Dec 2001.

85
NOVIS NETO, J.A.; SAITO, R. Pagamentos de dividendos e persistência de retornos
anormais das ações: evidência do mercado brasileiro. Revista de Administração da USP. São
Paulo, v. 38, n.2, p. 135-143, abr/mai/jun. 2003.
OLIVEIRA, R.F.; SCHIOZER, R.F., BARROS, L.A.B.C. Depositors’ Perception of “Too-
Big-to-Fail”, 2012. available at www.ssrn.com
PAIVA, J. W.;LIMA, A.V. A influência da tributação e dos juros sobre o capital próprio na
política de dividendos das companhias brasileiras. In: I Encontro Brasileiro de Finanças,
2001, São Paulo. Anais eletrônicos. São Paulo:SBFIn,2001.
PALEPU, K.; HEALY, P. M. "Effectiveness of Accounting-Based Dividend Covenants".
Journal of Accounting and Economics. Vol. 12 (1990): p. 97-124
PARAVISINI, D. "Local Bank Financial Constraints and Firm Access to External Finance."
Journal of Finance 63, no. 5 (October 2008), p. 2161-2193.
PARK, S.; PERISTIANI, S. Market Discipline by Thrift Depositors, Journal of Money, Credit
and Banking, Vol. 30 (1998), p 347-364.
PEREIRA, J. A. C. M. Regulation issues in the banking industry, Doctoral Dissertation,
Fundação Getulio Vargas/EAESP, 2011.
PEREIRA, J.; SAITO, R. Banking regulation and supervision: evidence on decision making
regarding capital requirements. Mimeo, 2010.
PERIA, Maria S. M. and SCHMUKLER Sergio L., 2001, Do depositors punish banks for
band behavior? Market discipline, deposit insurance and banking crises, Journal of Finance,
54 (3), 1029-1051.
PROCIANOY, J. L.;VERDI, R. dos S. O efeito clientela no mercado brasileiro: Será que os
investidores são irracionais? Revista Brasileira de Finanças. v. 1, n.2, p.217-242. Dezembro
2003.
86
RATNOVSKI, L.; HUANG, R. The Dark Side of Bank Wholesale Funding. IMF Working
Papers, Vol. , pp. 1-28, 2010. Available at SSRN: http://ssrn.com/abstract=1760359
REEDING, L.S., Firm Size and Dividend Payouts, Journal of Financial Intermediation, 6,
224-248, 1997.
RENNEBOOG, L.; TROJANOWSKI, G. Patterns in payout policy and payout channel
choice. Journal of Banking & Finance. Vol. 35, Issue 6, June 2011, Pages 1477–1490
ROZEFF, M.S., Growth, beta, and agency costs as determinants of dividend payout ratios.
The Journal of Financial Research, 5, 249-259. 1982.
SANT, R.; COWAN, A. R. Do dividends signal earnings? The case of omitted dividends.
Journal of Banking and Finance, 1994, v18 #6, 1113-1133
WEBER, R.A.; PROCIANOY, J. L. Are banking dividends different? Evidence from the
Brazilian banking sector. IX Encontro Brasileiro de Finanças. UNISINOS São Leopoldo RS.
2009.
WERMERS, R., 2011. Money fund runs. Available at SSRN:
http://ssrn.com/abstract=1784445

87
7. Appendix 1: Tobit Models versus OLS models
The OLS model has some strict assumptions that can be difficult to meet when
working with a dividend distribution. The presence of heteroskedasticity and high asymmetry
can lead to biased estimators. One solution that is commonly used in econometric analysis to
address asymmetry issues in the data is to transform the variable into its logarithmic form.
This option resolves heteroskedasticity and skewness but exacts a high price for the empirical
research regarding dividend signaling because it is necessary to trim all of the observations
with a value equal to zero. When the payout is equal to zero, a lot of information is collected
because Brazilian law requires firms to pay out at least 25% of their profits. There are some
limited exceptions that allow firms to avoid paying dividends for a certain period. However,
this period of non-payment of dividends and a possible return to paying dividends can contain
information that is very important to the study of dividends.
Taking these considerations together, the alternative is to use the amount of payout
(even if it is equal to zero) and to scale it to either earnings or equity. From the theoretical
perspective, scaling to earnings results in the percentage of earnings that the firms decide to
distribute to their shareholders. Scaling to equity, on the other hand, results in a measure of
the size of the payout relative to the wealth of the firm. As a result, the distribution of
dividends scaled by earnings reveals an uncharacteristic sample distribution, as can be seen in
Figure 1.

88
Figure 1
This figure exhibits the estimate density of the distribution of payout scaled by earnings. The sample includes all banks in activity in Brazil between 2001 and 2009 except banks belonging to conglomerates.
Source: Author
Thus, to ensure that its use is not appropriate for the sampling distribution of
dividends, the tests for homoskedasticity, skewness and kurtosis (see Table 1) show
that the dividends do not fit the assumptions of the OLS models. Figure 2 includes the
diagnostic plot of the residuals for the OLS regression. There is a clear censored
behavior on the residuals.
Table 1 This table exhibits specification tests for OLS regression. The dependent variable is PAYOUT EARNING (Dividends plus Interests on equity divided by Total Earnings). The null hypothesis for the post estimation is that the residuals are normal distributed. Source chi2 df p Heteroskedasticity 176.64 140 0.0196 Skewness 95.83 17 0.0000 Kurtosis 40.31 1 0.0000 Total 312.79 158 0.0000 Source: Author
01
23
Den
sity
0 .5 1 1.5 2Payout / Earnings
kernel = epanechnikov
Kernel density estimate

89
Figure 2 This figure exhibits the residual diagnostic plot of the model using OLS.
Source: Author
Table 2 shows the detailed statistics of Payout/Earnings. Due to the high number of
zeros on the dividends distribution, the sample is heavily skewed (Panel A). However, even if
I exclude all of the zeros from the sample, it remains skewed (Panel B).
-.50
.51
1.5
Resid
uals
-.2 0 .2 .4 .6Fitted values
OLS Residual diagnostic plot

90
Table 2 This table exhibits detailed summary statistics of PAYOUT EARNING (Dividends plus Interests on equity divided by Total Earnings). Panel A and B presents skewness, kurtosis, the four smallest and four largest values, and percentiles. Panel A uses all the data and in Panel B all zero values were dropped. In both the variable is heavily skewed. Panel A Percentiles Smallest Payout/Earning 1% 0 0 5% 0 0 10% 0 0 25% 0 0 Observations 1537 50% .1162883 Mean .2646482 Largest Std. Dev. .3694975 75% .3981552 1.629087 90% .7457213 1.629087 Variance .1365284 95% 1.015205 1.629087 Skewness 1.915815 99% 1.629087 1.629087 Kurtosis 6.751352 Panel B Percentiles Smallest Payout/Earning 1% .0094487 .0020889 5% .0180413 .0026805 10% .0675242 .0033462 25% .2210823 .0043015 Observations 902 50% .3344036 Mean .4509582 Largest Std. Dev. .3855368 75% .5679867 1.629087 90% .95883 1.629087 Variance .1486386 95% 1.468197 1.629087 Skewness 1.540283 99% 1.629087 1.629087 Kurtosis 5.121868 Source: Author
Because I need all of the payout observations, even the zeros, and because the
payout distribution is clearly censored regarding the value of zero, I choose the Tobit model
(censored model) because it is better able to manage these issues with this sample
distribution, yielding more robust and efficient parameters.
As a robustness check, I also run the OLS regressions with the natural logarithm of the
dividends as a dependent variable with no additional contribution. It is important to remember
that when I use the natural logarithm of the dividends, I automatically exclude all of the
observations with values equal to zero. Because the dividend’s information is my focus in this
paper, the loss of all of the zeros should lead to biased results.


