

1
BANK MILLENNIUM GROUP
INSTITUTIONAL PRESENTATION
April 2021

2
Macroeconomic
environment
in Poland
Banking sector
in Poland
Bank Millennium
general overview
and strategy
1. 2. 3.
AGENDA
Financial
performance
4.

3
Macroeconomic environment
in Poland
01
INSTITUTIONAL PRESENTATION

4
MACROECONOMIC OVERVIEW Economy
Polish economy surprised on the upside
in 4Q20 showing some resilience to reintroduced restrictions for a part of
the service and trade sector. Manufacturing rebounded particularly
strongly due to increasing global trade and demand from abroad. Outlook for
2021 remains favourable despite slower-than- expected vaccination roll-out and
strong impact of restrictions in economies of main trading partners.
Source: GUS, Bank Millennium, F - forecast
GDP growth rate (% y/y) CPI inflation (% y/y) Registered unemployment rate (%)
Data from real economy (% y/y) Exports and expected foreign orders (% y/y, pts)

5
MACROECONOMIC OVERVIEW Economy
Source: Macrobond, MinFin, Bank Millennium
Inflow of European Union funds to Poland
Exports and import according to national accounts Current and capital account balance
Inflow of foreign direct investments to Poland
(% y/y) (% GDP)
(EUR bn) (EUR bn)
6
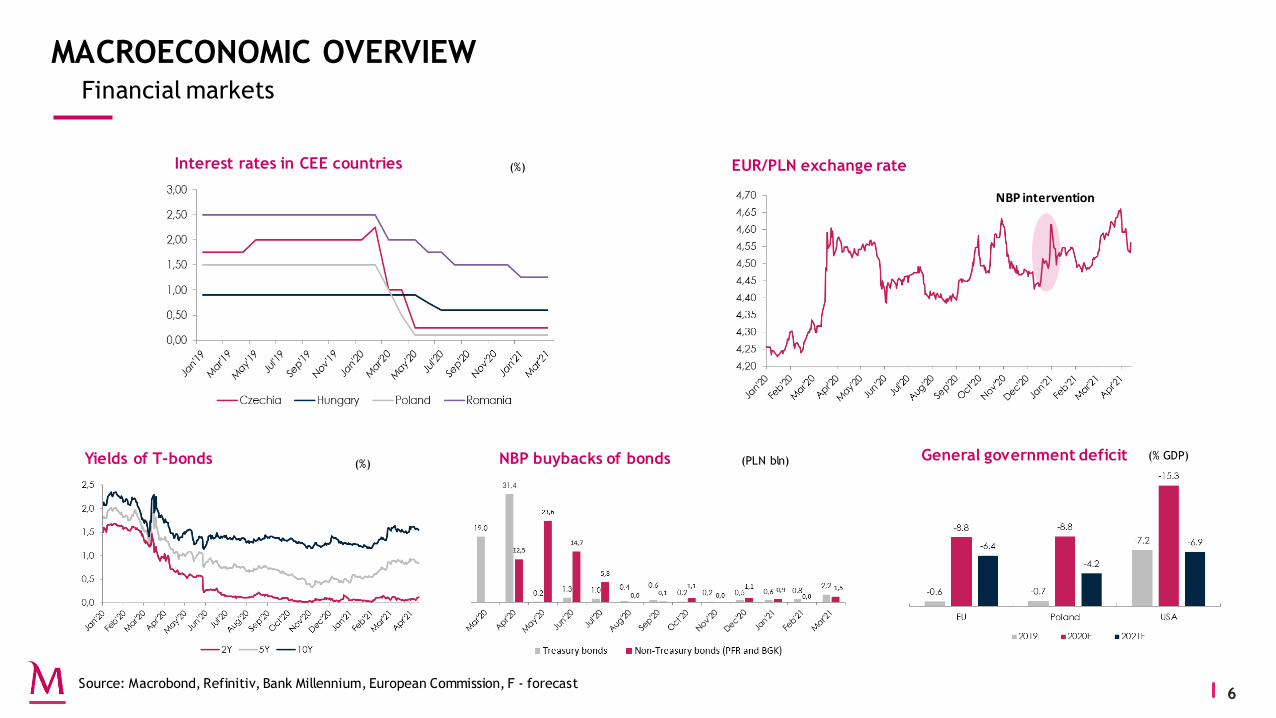
MACROECONOMIC OVERVIEW Financial markets
Yields of T-bonds
Interest rates in CEE countries EUR/PLN exchange rate
NBP buybacks of bonds General government deficit
Source: Macrobond, Refinitiv, Bank Millennium, European Commission, F - forecast
(%) (PLN bln) (% GDP)
NBP intervention
(%)

7
MACROECONOMIC OVERVIEW Monetary aggregates
Loans to households Mortgage loans Loans to companies
Households: non-mortgage loans Deposits from households Deposits from companies
Annual growth rate of
households deposits remained strong in 4Q.
Growth rate of deposits from companies decreased
as public aid from first Financial Shield ended.
4Q20 showed continuation
of trends from previous quarter. Loans for
companies and non-mortgage loans were
declining. On the other hand, mortgage loans
continued relatively strong growth.
Source: NBP, Bank Millennium
(PLN bn, % y/y) (PLN bn, % y/y) (PLN bn, % y/y)
(PLN bn, % y/y) (PLN bn, % y/y) (PLN bn, % y/y)

8
INSTITUTIONAL PRESENTATION
Banking sector in Poland
02

9
POLISH BANKING SECTOR OVERVIEW (*)
Top 5 banks in Poland comprise 50% of total assets of the sector and top 10 make 72%, but consolidation of the sector continues
Highest standards in modern technology implementation (e.g. mobile users, pay-pass payments) and quality of service
Strongly capitalized and highly competitive
banking sector in Poland
30 fully registered banks, 530 co-operative banks (active mainly in rural areas of the country) and additional 36 international banks acting in Poland in a form of branch
Around 11.5k banking outlets (5.5k branches) and c149 thousand persons employed in the sector
Strong resilience during the pandemic crisis – only one bank was subject to resolution procedure (due to pre-pandemic issue), fall-outs of small co-operative banks
Strong banking supervision and high level of solvency of Polish banks (average TCR = 19%, CET1 = 17% ) confirmed by stress tests
Comfortable liquidity (L/D = 88%) supported margins, while interest rates at historical low levels
Profitability under pressure due to high obligatory burdens: new banking tax (highest in Europe), guarantee fund payments and regulatory limits on many fees (insurance, interchange, mutual funds)
(*) Polish Financial Supervision Authority YE20 data

10
THE BIGGEST BANKS IN POLAND As at 31 December 2020 (PLNbn)
228,1
142,4 142,0 124,7 109,8 75,6 74,1 56,2
21,9 35,1
123,7
68,9 66,0 55,5
52,2
33,6 19,0 15,7
31,7 6,5
17
15 14
4 13
7 3
5
381,8
232,1 229,3
186,6 180,1
119,6
97,8 78,6
60,9 48,2
0
30
60
90
120
150
180
210
240
270
300
330
360
390
PKO PEK SAN ING MBK BNP MIL ALR CITI GNB
Loans and advances to clients
Debt securities
Other financial assets
Other assets
Total headcount* Total distribution network
27 708
15 678 13 579
10 219 8 142 8 135
8 464 6 771
26 007
14 994 12 616
9 019 7 653
8 507
7 493 6 688
0
5 000
10 000
15 000
20 000
25 000
30 000
PKO PEK SAN BNPP ALR ING MIL MBK
4Q19 4Q20
1 004
550 668
477
200
459 372 290
19
492
380 65 225
474 63
0
200
400
600
800
1 000
1 200
1 400
1 600
PKO SAN PEK MIL ALR BNPP MBK ING CITI
Franchise/Partners Own
1 496
930
733 702
674
459 372 353
(*) Total FTEs

11
RECENT M&A TRANSACTIONS IN THE POLISH BANKING SECTOR
2007 2009 2011
1)
2)
3)
2012
1)
2)
2013
3)
2014 2015 2015
1)
2)
2017
1)
2)
2018 2019
1)
2)
Upper logo: Acquirer Lower logo: Acquired entity
(*)
2020
(*) Most of assets/liabilities of Idea Bank acquired as a part of resolution process at the
turn of 2020/21

12
Bank Millennium general overview
and strategy
03
INSTITUTIONAL PRESENTATION

13
HISTORY OF BANK MILLENNIUM AT A GLANCE
1989 1992 1997 1998 2003
Bank Inicjatyw
Gospodarczych BIG S.A. is founded - the
first bank under new law introduced after
the collapse of communism in
Poland.
BIG S.A. is the first
bank listed on the Warsaw Stock
Exchange.
Merger with Bank
Gdański (a regional retail bank) –
change of the name to BIG Bank
GDAŃSKI SA.
Joint venture with
Portuguese BCP to create the Millennium
project – a nation-wide network of modern
branches. BCP become strategic shareholder
in 2000 year.
BIG Bank GDAŃSKI
re-branded to Bank Millennium - a year
before BCP adapted that name
2006
Change of the Bank's
image, adoption of visual identity of
the strategic shareholder - Banco
Comercial Português (Millennium bcp)
2010 2015
Successful capital
increase through the rights issue
worth PLN1.1bn
Increase of a
free-float after reduction of
Millennium bcp participation to
50.1%
Net profit of
PLN701m supported by
one-off VISA transaction
2016 2017
High TCR (22%)
boosted by PLN700m Tier
2 issue
1-st step to
open Mortgage
bank
2018
Agreement
signed with Société Générale
on acquisition of Euro Bank
2019
Acquisition of
Euro Bank
2020
PFSA* permission
to establish a
mortgage bank by Bank Millennium S.A.
(*) Polish Financial Supervision Authority

14
MORTGAGES – OUR LONG-TERM CUSTOMER ACQUISITION PRODUCT Millennium Mortgage Bank (MBH) received a banking licence on June 16, 2020; operating licence (and a start of business) is expected in 1H21
BM’s origination of mortgage loans* BM’s market share in origination*
Share of mortgage loans in total portfolio (top 9 banks)
(PLNbn) (%)
(%)
MBH will provide opportunities for medium term sustainable
development of mortgage lending business and will allow
to:
reduce assets-liabilities maturity mismatch
diversify funding mix
provide access to large and cheaper than senior
unsecured debt funding market of covered bonds
reduce MREL requirement
0,7 0,9
2,8 3,4
4,5
7,2
2015 2016 2017 2018 2019 2020
50,9
%
48,1
%
42,1
%
35,9
%
33,8
%
34,5
%
24,0
%
18,6
%
7,7
%
53,6
%
49,7
%
43,8
%
40,5
%
37,4
%
35,6
%
28,6
%
21,4
%
9,7
%
0%
10%
20%
30%
40%
50%
60%
70%
80%
BM Bank #2 #3 ... #4 ... #5 ... #3 ... #7 ... #8 ... #9
4Q19 4Q20
+61.3% CAGR
Rationale for establishing MBH
1,7
%
2,4
%
6,5
%
6,6
%
7,3
%
12,2
%
0%
2%
4%
6%
8%
10%
12%
14%
2015 2016 2017 2018 2019 2020

15
OVERVIEW OF STRATEGIES SINCE 2009
2018-2020:
“Accelerated growth”
• Complementing current growth engine in Retail (C/A
acquisition) with new engines (cash Loan, investments and
micro business) • Accelerate the growth in
Corporate through lending and enhanced sales force
efficiency • Focus growth around client
satisfaction, in retail mass personalization and in business
with sectorial knowledge approach
• Strong leverage of digital in banking and beyond as
competitive edge • Opportunistic approach to
inorganic growth options • Win the war for talent thanks
to engaging and inspiring work environment
2015-2017:
“Focus on profitability preservation, while keeping
organic growth target”
• Accelerating acquisition of retail customers via
traditional, new and digital channels, while maintaining
segment profitability • Keeping differentiating
through customer experience, further
leveraging digital and customer intelligence
• Keeping the growth momentum in corporate
segment while improving profitability
• Maintaining operational excellence and strict cost
control
2012-2014: “Rebalancing the
business model for profitability”
• Rebalanced product mix (e.g., mortgage vs. cash loan, term
vs. other deposits), deposits price optimization
• Setting Corporate lending on a growth track with new
targeting tools and RM management models
• Focus on strengthening competitive advantage
(online, mobile, quality, customer intelligence)
• Further reduced opera-ting expenses by strict admin. cost
management and lean initiatives
2009-2011: “Managing through
the crisis”
• Conservative liquidity management, strengthening
capital ratios • Improved risk management
• Improving core profitability drivers
• Restructuring of distribution platform, improving
efficiency through strict cost management

16
BANK MILLENNIUM TODAY
6% average market share, of which 7-8% in retail segment and 4% in
corporate business
Profitability under pressure from extraordinary items
(reported ROE at 0.2%) (***)
Strong TCR (19.5%) ratio and one of the lowest impaired loans ratio
among top banks
Well developed retail banking platform with 702 branches in
attractive locations
2.6 million (*) active retail clients, 2.1 million (*) online active clients
1.7 million (*) mobile active clients
Proven track-record of tight cost control; cost/income ratio at 49% (**)
(*) YE20 data, (**) 2020 reported data (adjusted for extraordinary items: 46.7%), *** 2020 data, adjusted ROE: 7.8%
17
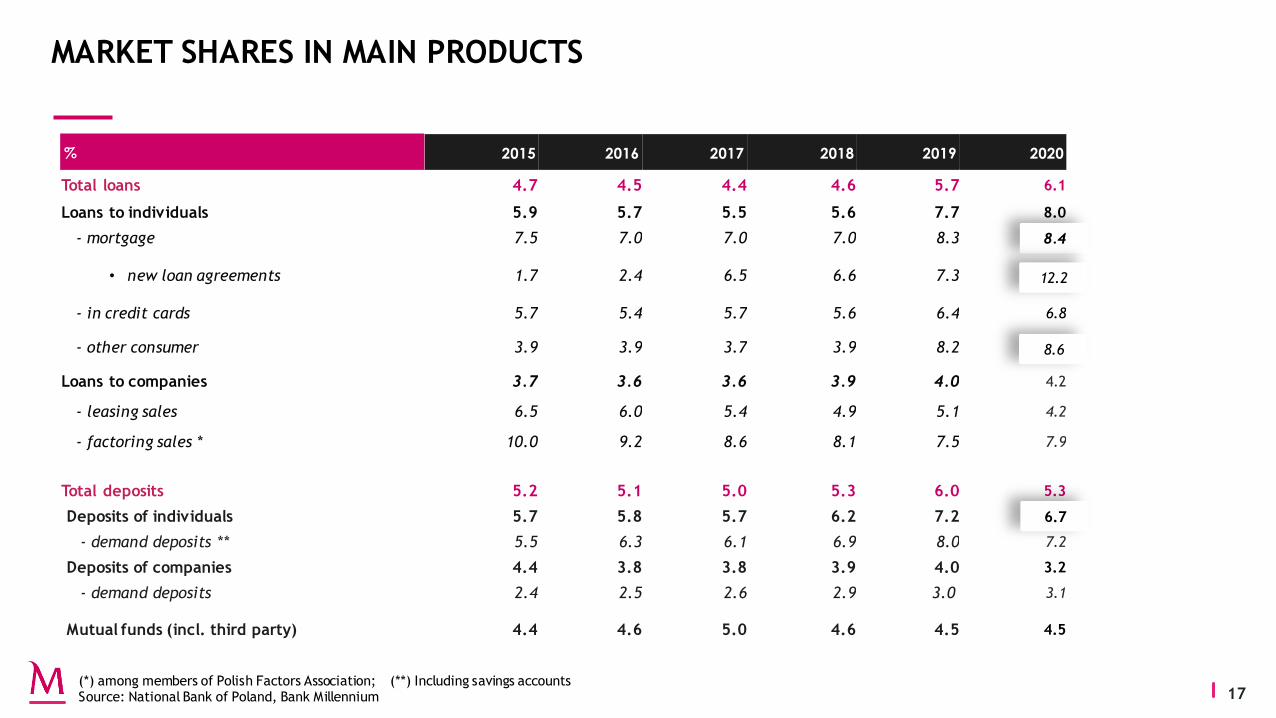
MARKET SHARES IN MAIN PRODUCTS
% 2015 2016 2017 2018 2019 2020
Total loans 4.7 4.5 4.4 4.6 5.7 6.1
Loans to individuals 5.9 5.7 5.5 5.6 7.7 8.0
- mortgage 7.5 7.0 7.0 7.0 8.3 8.4
• new loan agreements 1.7 2.4 6.5 6.6 7.3 12.2
- in credit cards 5.7 5.4 5.7 5.6 6.4 6.8
- other consumer 3.9 3.9 3.7 3.9 8.2 8.6
Loans to companies 3.7 3.6 3.6 3.9 4.0 4.2
- leasing sales 6.5 6.0 5.4 4.9 5.1 4.2
- factoring sales * 10.0 9.2 8.6 8.1 7.5 7.9
Total deposits 5.2 5.1 5.0 5.3 6.0 5.3
Deposits of individuals 5.7 5.8 5.7 6.2 7.2 6.7
- demand deposits ** 5.5 6.3 6.1 6.9 8.0 7.2
Deposits of companies 4.4 3.8 3.8 3.9 4.0 3.2
- demand deposits 2.4 2.5 2.6 2.9 3.0 3.1
Mutual funds (incl. third party) 4.4 4.6 5.0 4.6 4.5 4.5
(*) among members of Polish Factors Association; (**) Including savings accounts Source: National Bank of Poland, Bank Millennium
8.4
12.2
8.6
6.7

18
EB INTEGRATION AND FURTHER OPERATIONAL EFFICIENCY IMPROVEMENTS Tangible and recurrent cost synergies achieved ahead of plan
Integration costs and synergies 1Q19 2Q19 3Q19 4Q19 FY19 1Q20 2Q20 3Q20 4Q20 FY20
Integration costs* -2.0 -17.8 -44.3 -52.2 -116.3 -30.1 -5.2 -17.3 -14.3 -66.9
- o/w depreciation - - - -0.8 -0.8 -0.4 -0.5 -0.7 -0.7 -2.3
Additional provisions on Euro Bank
portfolio** - -80.6 -8.0 - -88.6 - - -
Total impact (pre-tax) -1.9 -98.4 -52.3 -52.2 -204.9 -30.1 -5.2 -17.3 -14.3 -66.9
Synergies - - - 23.4 23.4 25.0 37.1 48.1 57.3 167.6
Net impact (pre-tax) *** -1.5 -79.7 -42.4 -23.2 -146.9 -5.1 31.9 30.8 43.1 100.6
Will stay clearly below the plan (incurred to date represent 88% of the plan) Integration costs FY20 synergies above
the plan Net synergies in a steady uptrend
with FY20 result >PLN100mn, above the plan, and 2021 expected to bring 2x higher result
(PLNmn)
100.6
(*) Costs: P&L OPEX directly related to Euro Bank acquisition, merger and integration. Expenses: additionally there was a PLN37mn PPA adjustment, while capex totalled PLN33mn in 2019; (**) 12-month expected credit loss (ECL) estimated on fair value of loan portfolio in accordance with IFRS 9 (on D1 in 2Q19 ) plus extra provisions on normal loans being subsequently reclassified after D1; (***) net of tax in 2019

19
BANK MILLENNIUM BRANCHES (as at 31 December 2020)
Network of 702 branches
own branches
franchise branches
606 605 602 573 542 502 477
233 228 228 226 224
224 225
2Q19 3Q19 4Q19 1Q20 2Q20 3Q20 4Q20
Branches Franchise branches
Branches and franchise branches
Employment
8 550 8 654
8 464 8 412
8 141
7 846
7 493
2Q19 3Q19 4Q19 1Q20 2Q20 3Q20 4Q20
(FTE)

20
PROJECT ’MILLENNIUM THROUGH COVID-19’
(*) excluding Euro Bank related integration costs and BFG costs
Reduction of the cost of deposits following the 140bp interest rate cut
Careful management of credit risk, with more
conservative provisioning in 1H20 and tight monitoring which may help to mitigate the
potential negative impacts from the crisis on asset quality, although more clear picture will only come
after the end of credit holidays period used by part of clients
Cost reduction by accelerating the plan of capturing the cost
synergies from the Euro Bank acquisition and further delivering cost savings of 10%* in 2020
alone
Accelerating digitalisation of sales & service
and internal processes. Maintaining the focus on business
development, especially on mortgage loans
• Results was 2020 will be negatively impacted by the significant interest rate cuts and additional provisions for FX mortgage loans legal risk
• In this context, the Bank adopted mitigation measures that are already providing relief, namely through:

21
2021 – A TRANSITION YEAR BEFORE NEW STRATEGY ROLL-OUT
Quick recovery of
business results
Focus on operational efficiency
• New operational efficiency program: Processes Re-engineering, automatisation, standardisation and simplification
• # radical productivity
• Fine-tuning of branch network after 21% reduction in 2020
• C/I of c.a. 47%
Full digitalisation
• Extending digital customer base beyond current age segments
• Exceeding 80% digital clients by the end of YE21
• 80% end-to-end sales processes coverage on digital platforms
• Keeping top-notch customer digital experience
• Improvement of business results through better pricing and sales increase in core products
• Double-digit growth of cash loan sales
• Mortgage sales above PLN7bn
• Corporate loan book growth >PLN1.1bn

22
RELATIONS WITH BCP AND MANAGEMENT COMPOSITION
Joao Bras Jorge CEO
Fernando Bicho Deputy CEO, CFO
Andrzej Gliński Corporate Business
Wojciech Haase CRO
Wojciech Rybak Retail Business
Antonio Pinto Digital & Marketing
Jarosław Hermann IT & Operations
5,0%
5,4%
14,8%
20,0%
44,1%
46,2%
49,6%
50,0%
65,5%
65,5%
50,1%
0% 10% 20% 30% 40% 50% 60% 70%
1998
1999
1999
2000
2002
2002
2002
2002
2006
2010
2015-2019
BCP subscribed PLN691m during the right issue
Sale of 15.4% through ABB in March’15 BCP stake evolution since 1998
BCP demonstrated in the past strong support to
Bank Millennium in Poland; commitment in equity
was shown during the capital increase concluded
in February 2010. BCP also supported liquidity,
especially in 2009-2010 years (EUR 200 million
bilateral loan matured in April 2011, and money
market line – until July 2010)
Currently, no dependence on BCP funding and no
exposure to BCP or Portuguese public debt
8 managers from Portugal employed on permanent
basis, including 3 Management Board members

23
SOLID FOUNDATIONS APPRECIATED BY INVESTORS
Bank Millennium: ytd share price performance
50,1%
9,1%
6,3%
7,1%
27,5%
BCP
Nationale-Nederlanden Pension Fund
Aviva Pension Fund
PZU „Złota Jesień" Pension Fund
Remaining free float
Stable
shareholders
(*)
Bank’s current ratings
Moody’s Baa1 / P2/ baa3 / stable outlook
Fitch BBB- / F3/ bbb- /Rrating Watch Negativ e
+14.0%
+15.7%
0%
5%
10%
15%
20%
25%
30%
35%
40%
MIL WIG-Banks
-70%
-60%
-50%
-40%
-30%
-20%
-10%
0%
10%
MIL WIG-Banks
-30%
-44%
Bank Millennium: share price performance in 2020

24
Financial performance
04
INSTITUTIONAL PRESENTATION

25
KEY PROFIT & LOSS ITEMS
PLNmn 2020 2019 Change Y/Y 4Q20 3Q20 Change Q/Q
Net interest income 2 583.1 2 499.4 3.3% 624.6 628.6 -0.6%
Net commission income 746.1 699.2 6.7% 192.7 179.8 7.2%
Total operating income 3 577.8 3 471.5 3.1% 909.5 887.2 2.5%
Total costs -1 752.8 -1 726.1 1.5% -417.7 -412.1 1.4%
Costs without EB integration and BFG -1 519.5 -1 489.6 2.0% -377.2 -367.5 2.6%
Loan loss provisions (incl. Covid-19) -621.3 -439.0 41.5% -165.4 -156.3 5.8%
FX mortg. legal risk provisions -713.6 -223.1 219.8% -415.9 -129.7 220.8%
Banking tax on assets -279.1 -248.0 12.6% -70.1 -67.8 3.4%
Net profit 22.8 560.7 -95.9% -109.1 60.1 -281.3%
Net profit without extraordinary items* 709.5 921.1 -23.0% 203.5 179.4 13.5%
NIM 2.61% 2.84% -0.23 pp 2.53% 2.49% 0.04 pp
Cost/Income reported ytd 49.0% 49.7% -0.7 pp
Cost/Income adjusted (*) ytd 46.9% -0.2 pp
Cost of risk ytd 83 bp 68 bp +15 bp
ROE ytd 0.2% 6.4% -6.2 pp
ROE adjusted (*) ytd 7.8% 10.6% -2.8 pp
(*) Extraordinary items
3.1%
7.2%
46.7%

26
KEY PROFIT & LOSS ITEMS
PLNmn Dec. 20 Dec. 19 Change Y/Y Sept. 20 Change Q/Q
Active customers (ths) 2 633 2 571 62 2 631 2
incl. on-line and mobile 2 053 1 838 215 2 022 31
Customer funds 90 264 90 295 0.0% 94 133 -4.1%
Deposits 81 511 81 455 0.1% 85 852 -5.1%
Deposits of individuals 61 875 61 092 1.3% 61 933 -0.1%
Loans 74 088 69 615 6.4% 72 590 2.1%
FX mortgage loans excl. EB 13 140 13 493 -2.6% 13 515 -2.8%
Loans without FX mortgage 59 960 55 151 8.7% 58 084
L/D 90.9% 85.5% 5.4 pp 84.6% 6.6 pp
Impaired loan ratio (*) 4.95% 4.6% 0.4 pp 4.7% 0.3 pp
Coverage ratio 65.7% 62.5% 3.2 pp 68.0% -2.3 pp
CET1 = T1 16.5% 16.9% -0.4 pp 17.0% -0.5 pp
TCR 19.5% 20.1% -0.6 pp 20.0% -0.5 pp
*) stage 3 and POCI loans share in gross total loans
6.4%
3.2%

27
FINANCIAL HIGHLIGHTS OF 4Q20/2020 Lower interest rates and extraordinary items taking a toll on the results
NII stable, NIM up
+4bp q/q
Fees up
+7% q/q
HR costs down
-10% q/q
Provision coverage up
DPD90+ 119%
Costs only marginally up
+2%
Revenues up y/y
+3%
4Q20
2020

28
BUSINESS HIGHLIGHTS OF 4Q20/2020 Retail business fast returning to/above pre-Covid levels, corporate activity on the mend
Mortgage sales
>PLN2.0bn
AuM
+7% q/q
Debit cards
>3mn
Loans
+6% y/y
Active digital customers
>2.0mn
Mortgage sales
PLN6.8bn+57%
4Q20
2020

29
INVESTOR RELATIONS CONTACT:
Head of Investor Relations
Dariusz Górski
Tel: +48 514 509 925, +48 22 598 1115
e-mail: [email protected]
Katarzyna Stawinoga
Tel: +48 22 598 1110
e-mail: [email protected]
Marek Miśków
Tel: +48 22 598 1116
e-mail: [email protected]
www.bankmillennium.pl Kanał na YouTube @BankMillennium


