

BANK OF JAMAICA
Quarterly Monetary Policy Report July to September 2015 • Volume 16 • Number 2


Overview
During the September 2015 quarter, the Bank of Jamaica (BOJ) reduced the rate on the 30-day Certificate
of Deposit (CD) to 5.25 per cent from 5.50 per cent at end June 2015, the second adjustment since the
beginning of the fiscal year. The easing of the monetary policy stance continued to reflect the lowering of
inflation expectations, improvements in the country’s macroeconomic conditions and the Bank’s outlook
for lower domestic inflation in the near- and medium-term. In addition, and consistent with the more
accommodative monetary policy stance, the Bank reduced the spread on its lending facilities relative to
the 30-day CD rate by a further 75 basis points (bps) over the review quarter.
Headline inflation at end-September 2015 decelerated to 1.8 per cent relative to 4.4 per cent at the end of
the preceding quarter. This reduction was in line with the general trend decline that has been observed since
the September 2013 quarter. The reduction largely reflected declines in the cost associated with energy
and transport, while agriculture and processed foods prices increased at a slower pace. Notably, core
inflation continued to decelerate in September 2015 quarter, representing the fourth consecutive quarter
of moderation. Inflation is expected to pick-up in both the December 2015 and March 2016 quarters to
end the fiscal year within the target range of 5.5 per cent to 7.5 per cent. This outlook is predominantly
informed by the projection of moderate increases in international commodity prices for the remainder of
the fiscal year.
Real economic output for the September 2015 quarter is assessed to have expanded within the range of
1.0 per cent to 2.0 per cent, following two consecutive quarters of expansion. The estimated outturn for the
review quarter mainly reflects the performance of the goods producing industries, in particular Agriculture,
Forestry & Fishing and Manufacture. In addition, Hotels & Restaurants is assessed to have been the driver
for growth within the services industry. With regard to aggregate demand the improvement is primarily
associated with net external demand. Real GDP growth for FY2015/16 is projected to remain in the range
of 1.0 per cent to 2.0 per cent, with the pace of expansion increasing over the medium-term. This outlook
is predicated on the continued recovery in the economies of Jamaica’s major trading partners, expected
improvements in business and consumer confidence as well as further gains in external competitiveness,
which is expected to stimulate net external demand.
For the September 2015 quarter, private sector expectations for inflation 12 months ahead remain well
anchored in single digit territory. In the context of relatively low inflation expectations coupled with the
strong evidence of reduced exchange rate pass-through to inflation, it is anticipated that movements in
the exchange rate will gradually decline in importance as a nominal anchor for inflation. Further, as the
benefits of the current economic reform programme become entrenched, as is being observed in low and
stable nominal interest rates, the pick-up in private sector credit and expansion in the stock market, this
should continue to bolster the prospects for new investments and overall output expansion. Concurrently,
improvements in the current account and private capital inflows including foreign direct investments should
continue to underpin stability in Jamaica’s external accounts. In this regard, against the backdrop of the
significantly lowered risks to meeting the monetary targets over the near-term, the Bank will continue to
implement policy to support the entrenchment of low and stable inflation over the near- to- medium term.
Brian Wynter
Governor


CONTENTS
1.0 Inflation 9
Inflation Developments 9
Inflation Outlook & Forecast 11
Box 1.2: Inflation Differential 16
2.0 International Economy 17
Trends in the Global Economy 17
Advanced Economies 18
International Financial Markets 20
Commodity Prices 21
The Implications for the Jamaican Economy 23
3.0 Jamaican Economy 24
Real Sector Developments 24
Aggregate Supply 24
Aggregate Demand 27
Real Sector Outlook 28
Box 2: Trends in selected measures of Labour Productivity 29
Monetary Policy, Money and Financial Markets 30
Monetary Policy 30
Financial Markets 31
Foreign Exchange Market 31
Equities Market 32
Private Sector Credit and Lending Rates 34
Money 36
Box 3: Credit Conditions Survey 38
Fiscal Developments 40
Box 4: Jamaica’s Macroeconomic Programme under the EFF 42
4.0 Implications for Monetary Policy 44
Main Policy Considerations 44
Prices and Output 44
Expectations 44
Financial Markets 45
Monetary Targets 45
Box 5: Monetary Policy Transmission 45
Monetary Policy 46
Additional Tables 47
Glossary 60
List of Boxes 64

ABBREVIATIONS
ARMI Agricultural Raw Materials Index
BOC Bank of Canada
BOJ Bank of Jamaica
BoJ Bank of Japan
BRO Bi-monthly repurchase operations
bps Basis points
CDI Credit Demand Index
ECB European Central Bank
EFF Extended Fund Facility
EFR Excess funds rate
EMBI+ JP Morgan Emerging Market Bond Index
EPI Export Price Index
Fed Federal Reserve Bank
FOMC Federal Open Market Committee
FY Fiscal Year
GDP Gross Domestic Product
GOJ Government of Jamaica
GOJGBs Government of Jamaica Global Bonds
IES Inflation Expeactations Survey
IMF International Monetary Fund
IPI Import Price Index
JCC Jamaica Chamber of Commerce
JSE Jamaica Stock Exchange
LME London Metal Exchange
NDA Net Domestic Assets
NIR Net International Reserve
OMO Open Market Operations
PBOC People’s Bank of China
QCCS Quarterly Credit Condition Survey
QPC Quantitative Performance Criteria
SCT Special Consumption Tax
SDRs Special Drawing Rights
SLF Standing Liquidity Facility

SMEs Small and Medium-sized Enterprises
TAJ Tax Administration of Jamaica
TOT Terms of Trade
USA United States of America
USDA United States Department of Agriculture
WTI West Texas Intermediate


- 9 -
Quarterly Monetary Policy Report July to September 2015
Inflation Developments
At end-September 2015 headline inflation
decelerated to 1.8 per cent, the lowest since 1967,
relative to 4.4 per cent at the end of the preceding
quarter. The outturn is below the target range of 5.5
per cent to 7.5 per cent for the current fiscal year
(see Table 1 and Box 1). This reduction in inflation
was in line with the general trend decline that has
been observed since the September 2013 quarter.
The reduction largely reflected declines in the cost
associated with energy and transport. The cost
for agriculture and processed food increased at a
slower pace relative to the preceding quarter (see
Figure 1). With regard to core inflation, the outturn
of 4.0 per cent represents the fourth consecutive
quarter of deceleration. Inflation among agricultural food items moderated
relative to the June quarter, in spite of reductions
in the supplies of most domestic agricultural
commodities (see Figure 2). This is notwithstanding
the marked increases in the prices of vegetables
and starchy foods in the review quarter, as a result
of the decline in supplies.
Table 1 Inflation and Major Components
(Annual point-to-point per cent change)
Headline Core* FNB** HWEG** Sep-14 9.0 6.7 12.5 6.2
Dec-14 6.4 6.0 10.1 -2.0
Mar-15 4.0 5.5 7.9 -9.5
Jun-15 4.4 4.8 7.8 -7.5
Sep-15 1.8 4.0 5.5 -10.9
FY15/16 5.5-7.5
Source: STATIN & BOJ Notes: [*] Core inflation represents that portion of headline inflation that excludes the influence of agriculture and energy related services such as electricity and transport. [**] FNB (Food & Non-Alcoholic Beverages) and HWEG (Housing, Water, Electricity Gas & Other Fuels) are major components of the Consumer Price Index (CPI) basket.
Figure 1 Component Contributions to Inflation
(Annual point-to-point per cent change)
Source: STATIN & BOJ
1.0 Inflation
Consistent with the Bank’s forecast, inflation decelerated for the September 2015 quarter relative to the
June 2015 quarter. This reduction mainly reflected a decline in energy and transport prices as well as a
moderation in price changes among processed food items. Inflation for the FY2015/16 will be within the
5.5 per cent - 7.5 per cent target range. Over the next four quarters, the Bank is projecting inflation to
be within the range of 4.5 per cent to 6.5 per cent. This forecast is largely predicated on international
commodity prices remaining at moderate, though increasing, levels throughout the rest of the fiscal year.
Inflationary impulses are also expected to emanate from a measured improvement in domestic demand
conditions over this period. This improvement is underpinned by an anticipated increase in consumption
during the upcoming quarter which is expected to continue in subsequent quarters. Adverse weather
conditions remain the main upside risk to the inflation outturn over the next four quarters. The downside
risks principally relate to lower than anticipated international commodity prices and weaker than expected
domestic demand conditions. In light of these factors the near-term risks to the forecast are considered
to be balanced.

- 10 -
July to September 2015
Quarterly Monetary Policy Report
of some pass-through from exchange rate
depreciation (see Figure 3).
Price declines in electricity and fuel resulted in
deflation in energy and transport for the September
2015 quarter, largely reflecting the impact of the
reduction in crude oil prices (see Figure 5 and
International Economy). It should be noted that
these declines were in contrast to the increases in
Declines in international grains prices underpinned
the abatement in inflation among processed foods
for the fourth consecutive quarter. The decline in
international grains prices was largely due to the
increase in crop yield in major harvesting regions
arising from favourable weather conditions.
Notwithstanding the moderation in processed food
inflation, this category has remained the major
contributor to inflation since the September 2014
quarter (see Figures 1 and 4).
Inflation emanating from other services was
marginally higher when compared to the previous
quarter. This outturn for the review quarter mainly
reflected the seasonal impact of demand related
to back-to-school expenses as well as the impact
Figure 4 Imported Agriculture Price Indices
(Base year = March 2008)
Source: Bloomberg & BOJ Calculations Grain prices represent a weighted average of wheat, corn and rice.
Figure 3 Inflation from Processed Foods and Non-
Energy Services relative to annual depreciation (per
cent)
Source: Bank of Jamaica Exchange rate depreciation up to one year (4-quarters) in the past has displayed a positive correlation with processed food inflation and other services inflation (non-energy related). With respect to non-energy related services there was a correlation of 0.72 at a lag of four (4) quarters. When matched against inflation from processed foods, exchange rate depreication reflects its largest correlation of 0.56 which occurred within three (3) months.
Figure 2 Estimated Vegetable & Starchy Foods
Supplies (Tonnes)
Source: RADA

- 11 -
Quarterly Monetary Policy Report July to September 2015
crude oil prices in the previous quarter.
Similar to the previous eleven quarters, there were
no inflationary pressures from capacity utilization
or the labour market during the quarter under
review (see Figure 6). In particular, the output gap
remained negative for the September 2015 quarter.
Furthermore, the gap between the unemployment
rate and the Non-Accelerating Inflation Rate of
Figure 5 Energy Price Indices
(Base year = March 2008)
Source: Bank of Jamaica
Figure 6 Output Gap and Gap between Unemployment
and NAIRU
Source: Bank of Jamaica The above chart presents the output gap, the gap between actual output and potential, and the NAIRU gap, the gap between Unemployment and the Non-Accelerating Inflation Rate of Unemployment (NAIRU). When output is below potential (negative output gap) inflationary pressures are negative due to economic slack. When unemployment exceeds the NAIRU (positive NAIRU gap), there is also slack in the labour market contributing to low wages and by extension, low inflationary pressures.
Unemployment (NAIRU) suggested no inflationary
pressures from the labour market. In light of
the aforementioned, there were no inflationary
pressures from factor prices, especially wages
during the quarter.
Inflation Outlook & Forecasts
Inflation is expected to pick-up in both the
December 2015 and March 2016 quarters to end
fiscal FY2015/16 within the target range of 5.5 per
cent to 7.5 per cent. This forecast is predicated
on increases in the prices of domestic agricultural
commodities due to the recent dry conditions as
well as an uptick in the price of crude oil. However,
inflation from agricultural commodities is expected
to abate in the latter part of the December 2015
quarter with price reversals in the March 2016
quarter as the Island recovers from the drought
conditions.
The prices of international commodities,
particularly crude oil, are projected to reflect some
modest increases, starting in the December 2015
quarter, contributing to an increase in domestic
inflation over the near-term. This projected rise
is predicated on a gradual improvement in global
demand conditions as well as a reduction in shale
production by the United States of America.
The output gap is projected to narrow over the
near-term despite remaining negative. In this
regard, minimal inflationary pressures are likely
to emanate from domestic demand conditions.
Likewise, growth in the monetary aggregates
continue to pose no substantial threat to inflation
over the short term (see Monetary Developments).
In addition, continued low inflation expectations
as reflected in the Bank’s most recent Inflation
Expectations Survey (IES) of businesses, should
assist in tempering price increases (see Box 1.1:
BOJ’s Inflation Expectations Survey (IES)).
Inflation over the subsequent four quarters is
projected, on average, to be within the range of
4.5 per cent to 6.5 per cent. This forecast is

- 12 -
July to September 2015
Quarterly Monetary Policy Report
Box 1.0: BOJ’s Macroeconomic Model (MonMod)
Component contribution to Inflation implied by the
Phillips Curve
The Bank’s Macroeconomic Model (MonMod)
evaluates the determination of inflation in the
economy using the theoretical underpinnings of a
forward looking open economy Phillips Curve. In
that regard, the key determinants include (1) the
surplus or shortage of aggregate supply (output
GAP); (2) the impact of imported inflation and (3)
expectations among consumers and businesses.
Notably, expectations are modeled as both adaptive
(backward looking) and rational (forward looking)
(see Phillips Curve equation below).
𝛑𝛑𝐭𝐭 = 𝛂𝛂𝛑𝛑𝐭𝐭−𝟏𝟏 + (𝟏𝟏 − 𝛂𝛂)𝛑𝛑𝐭𝐭+𝟏𝟏 + 𝛃𝛃𝟏𝟏𝐆𝐆𝐆𝐆𝐏𝐏𝐭𝐭 + 𝛃𝛃𝟐𝟐𝐒𝐒𝐭𝐭 + 𝛜𝛜𝐭𝐭
Where is the Inflation rate at a given point in
time, is the corresponding output gap and is
a composite of the exchange rate change and US
inflation. Unexplained inflation is captured in .
The Bank’s MonMod was reestimated in October
2015 taking into account the inflation outturn of 1.8
per cent for the September 2015 quarter (see Figure
below). The results from the model suggested that
inflation would have accelerated during the quarter
due primarily to an uptick in inflation expectations.
However, imported inflation remained largely
predicated on the
projection for modest increases in international
commodity prices, a strengthening in domestic
economic growth and the impact of continued
fiscal discipline in addition to a supportive monetary
policy stance. It should be noted that the forecast
range was unchanged from the end-June 2015
quater.
Inflation Risks
The upside risks to inflation over the next four
quarters include an intensification of adverse
weather conditions and higher than anticipated
international commodity prices. The downside
risks relate to lower than projected international
commodity prices and weaker domestic demand
conditions. In this regard, the BOJ perceives the
near-term risks to this forecast to be balanced
(see Figure 8).
πt GAPt St
𝜖𝜖𝑡𝑡
Figure 7 Inflation Forecast Performance
(Annual Inflation forecast for each fiscal year)
Source: Bank of Jamaica The graph reflects how well the Bank’s forecasts of inflation compare to the actual inflation outturn for each quarter ahead. Fiscal year targets are also provided to indicate what the targets were at any given point in time.
Figure 8 Inflation Fan
(Annual Inflation forecast)
Source: Bank of Jamaica

- 13 -
Quarterly Monetary Policy Report July to September 2015
unchanged while domestic demand conditions
continued to be weak evidenced by the negative
output gap. In addition the results from the model
showed a substantial decline in the residual for
the September 2015 quarter. This result primarily
reflected the non-reoccurence of the transport
shock in the comparable quarter of 2014.
In the December 2015 quarter, inflation is projected
to accelerate, primarily reflecting a normalization.
Consequent on an uptick in inflation expectations
and a narrowing in the output gap, inflation is
projected to increase over the remaining quarters
of FY2015/16.
Box 1.1: BOJ’s Inflation Expectations Survey (IES)
Overview
In September 2015, the results from the IES
showed a decline in expected inflation 12 months
ahead relative to the June 2015 survey. The
perception of inflation control also declined relative
to the previous quarter. Despite this, there has
been a general upward trend in the index which
has been observed since the March 2014 quarter.
With regard to the exchange rate, respondents
expected an acceleration in the pace of currency
depreciation over all three horizons. The majority
of businesses surveyed believed that the Bank’s
OMO rate will remain the same over the next three
months. Relative to June 2015, the perception
of present and future business conditions both
declined. Notably, perceptions of both present and
future business conditions have generally trended
upwards since the June 2013 quarter.
Inflation Expectations
In the September 2015 survey, there was an uptick
in the expected inflation for CY2015 to 7.3 per cent
from the 7.2 per cent that was recorded in the June
2015 survey. Expected inflation for the calendar
year was above the BOJ’s forecast. Respondents’
expectation of inflation 12 months ahead, however,
declined to 4.6 per cent in the September 2015
survey from 5.2 per cent recorded in June 2015 (see
Figure 1). In particular respondents’ expectation of
inflation for September 2016 was below the Bank’s
forecast for that period.
Perception of Inflation Control
The index of inflation control declined to 220.0
from 235.8 in the June 2015 survey (see Figure
2). This result mainly reflected a decline in the
number of respondents who were ‘satisfied’
and ‘very satisfied’ with the authorities’ control
of inflation. Additionally, there was a rise in the
number of respondents who were neither ‘satisfied’
nor ‘dissatisfied’.
Figure 1: Expected 12-Month Ahead Inflation

- 14 -
July to September 2015
Quarterly Monetary Policy Report
Exchange Rate ExpectationsRelative to the June 2015 survey, the respondents
expected an increase in the pace of currency
depreciation over the 3-month and 6-month
horizons while anticipating a slow down in the pace
of depreciation over the 12-month time horizon
(see Table 1).
Interest Rate Expectations: OMO Rate The expected 180-day Treasury Bill (T-Bill) rate,
three months hence, declined to 6.5 per cent from
6.6 per cent reported in the June 2015 survey. This
expectation was slightly above the actual 180-day
T-Bill rate for August 2015
Perception of Present and Future Business
Conditions In the most recent survey the perceptions of present
business conditions improved while the perception
of future business conditions declined relative to
the June 2015 survey. However, since the June
2013 quarter, perceptions of both present and
future business conditions have generally trended
upwards (see Figures 3 and 4)
Expected Increase in Operating Expenses
Respondents indicated that they expect the largest
increase in production costs over the next 12
months to emanate from higher costs for utilities.
The cost of stock replacement was expected to be
the second largest contributor to higher production
costs over the next 12 months. Also, the cost
of raw materials was expected to contribute to
higher production costs for the year ahead. Wages
& salaries continued to be the input cost least
expected to increase over the next 12 months.
Figure 2: Perception of Inflation Control Question: How satisfied are you with the way inflation is
being controlled by the Government?
Source: Bank of Jamaica’s Inflation Expectations Survey
Notes: The Index of inflation control is calculated as the number
of satisfied respondents minus the number of dissatisfied
respondents plus 100
Table 1: Exchange Rate Expectations
Question: In July 2015 the exchange rate was
J$117.42=US$1.00. What do you think the rate will be for
the following time periods ahead, 3 months, 6 months and
12 months?
Expected Depreciation Periods Ahead Dec-14 Mar-15 Jun-15 Sep-15
3 Months 1.4 1.7 1.0 1.7
6 Months 2.1 3.0 1.5 2.7
12 Months 3.0 3.8 4.3 3.5
Source: Bank of Jamaica’s Inflation Expectations Survey.
Note: the survey responses to question have been converted
to per cent change.
Figure 3: Present Business Conditions and Real GDP
growth
(Index- LHS and Per cent – RHS)
Source: Bank of Jamaica’s Inflation Expectations

- 15 -
Quarterly Monetary Policy Report July to September 2015
Box 1.2: Inflation Differential
Background
In April 2013, Jamaica entered into an Extended
Fund Facility (EFF) with the IMF. A medium-
term goal of the economic programme is to
bring inflation in line with that of our main trading
partners, particularly the USA. At the start of the
programme, annual inflation was 9.1 per cent as
at end-March 2013 and was forecast to gradually
decline to 8.5 per cent at end-March 2017.
Concurrently, US inflation was 1.5 per cent and
the IMF forecast inflation of 2.3 per cent. In that
context, the inflation differential was 7.6 per cent
at end-March 2013 and was forecast to gradually
decline to 6.2 per cent at end-March 2017.
Developments
Domestic and Foreign Inflation
Since April 2013, domestic inflation has fallen
much faster than had been expected. This has
been mainly due to favourable supply shocks to
oil and other commodities which contributed to a
significant decline in commodity prices, particularly
towards the end of 2014. In addition, sustained
fiscal consolidation under the EFF programme, a
slow-down in the pass-through of exchange rate
Figure 4: Future Business Conditions and Real
GDP growth (Index)
Source: Bank of Jamaica’s Inflation Expectations Survey
Note: Rates on foreign currency personal loans were not
collected.
depreciation to domestic prices and weaker GDP
growth than previously expected also contributed
to a faster than expected decline in inflation.
Consequently, annual inflation at end-September
2015 was 1.8 per cent.
Inflation in the USA, Jamaica’s main trading
partner, has also declined sharply consequent on
the fall in commodity prices. At end-September
2015, the USA recorded annual inflation of 0.0 per
cent relative to 1.5 per cent at end-March 2013.
Inflation Differential
The faster fall in domestic inflation, relative to
foreign inflation, resulted in a narrowing of the
inflation differential to 1.8 percentage points as at
September 2015 from 7.6 percentage points as
at the start of the EFF programme (see Figure 1).
The differential is, however, expected to normalize
to approximately 5.0 percentage points at end-
March 2016, consistent with the projections for
domestic inflation.
Exchange Rate Response
Concurrent with the fall in the inflation differential,
the annual depreciation of the exchange rate has
slowed to approximately 6.0 per cent at end-
September 2015 from 13.2 per cent at the start
of the EFF programme (see Figure 1). Although,
the rate of depreciation of the exchange rate was
above the inflation differential as at September
2015, the depreciation should moderate as the
inflation differential continues to trend downwards
(see Foreign Exchange Market).

- 16 -
July to September 2015
Quarterly Monetary Policy Report
Figure 1: Inflation Differential and Exchange Rate
Depreciation

- 17 -
Quarterly Monetary Policy Report July to September 2015
Trends in the Global Economy
Global economic output for 2015 is expected to
moderate further to 3.2 per cent, relative to previous
forecasts (see Table 2 and Figure 9). The downward
revision to world growth is largely underpinned by
slower growth in some large economies for the
September quarter, which is anticipated to persist
for the remainder of 2015. Notably, global growth
during the quarter was restrained by the impact
of economic and financial sector weaknesses in
China on several developed and emerging market
economies. Global growth was also affected by the
impact of lower commodity prices on commodity
exporting economies. Against this background,
world growth is estimated to have moderated to
3.3 per cent in the September quarter from 3.6 per
cent in the June quarter.
Notwithstanding the slowdown in global growth,
there was an acceleration in the 12-month point-
to-point inflation for several of Jamaica’s major
trading partners during the quarter, albeit well
below respective inflation targets. For 2015,
most of Jamaica’s trading partners are expected
to record lower inflation, consistent with lower
global demand and the fall in commodity prices,
particularly oil.
In terms of monetary policy, the central
banks of most major economies maintained
an accommodative stance. In particular, the
People’s Bank of China (PBOC), as well as the
Bank of Canada (BOC) implemented additional
2.0 International EconomyFor the September 2015 quarter, growth in the world economy is estimated to have decelerated relative
to the June 2015 quarter. This weaker performance mainly reflected a deceleration in growth within the
US economy and major emerging market economies such as China. Notably, concerns regarding slower
growth in China had a significant adverse impact on global financial markets throughout the quarter. In
particular, heightened uncertainty led to increased demand for safe haven assets such as US Treasury bonds,
contributing to a further strengthening of the US dollar and a fall in dollar-denominated commodity prices.
Lower commodity prices also emanated from a continued increase in global supplies and expectations of
weaker global demand. These developments led the central banks of most major economies to maintain
an accommodative policy stance with some central banks implementing additional measures to stabilize
financial markets and stimulate growth.
Table 1: Overview of Selected Variables (Per Cent)
2014 2015
GDP Actual Current Forecast
Previous Forecast as at 24 Jul. 2015
World 3.4 3.2 3.3
USA 2.4 2.5 2.3
Canada 2.4 1.1 1.3
Japan -0.1 0.7 1.0
UK 3.0 2.6 2.6
Euro 0.9 1.5 1.5
China 7.4 6.8 7.0
Inflation (eop)
USA 0.8 0.5 0.9
Canada 1.5 1.0 1.4
Japan 2.4 0.5 0.8
UK 0.5 0.4 0.9
Euro -0.2 0.5 0.8
China 1.5 2.1 2.5
Source: Bank of Jamaica and Bloomberg

- 18 -
July to September 2015
Quarterly Monetary Policy Report
expansionary policy measures in an effort to
stimulate growth and stabilize economic and
financial conditions (see Figure 10). In contrast,
the Central Bank of Brazil tightened monetary
policy in response to inflationary pressures. In this
context, the Bank of Jamaica (BOJ) anticipates
continued growth of the global economy over the
forthcoming quarters of 2015 and 2016, albeit at a
slower pace than previously envisioned.
Advanced Economies
United States of America
Preliminary estimates published by the Bureau of
Economic Affairs, indicate that for the September
2015 quarter USA real output expanded by 1.5
per cent on an annualized basis, which is lower
than the Bank’s estimated growth of 2.2 per cent
and the previous quarter’s outturn of 3.9 per cent.
The deceleration in real output was underpinned
by a reduction in private inventory investment,
exports, non-residential fixed investment, personal
consumption expenditure, the spending of state and
local government and residential fixed investment.
Notably, export growth for the USA remains a
challenge given the continued strengthening of the
US dollar relative to other major currencies and
weak external demand conditions. In addition,
the impact of low commodity prices curtailed
investment expenditure, particularly in the energy
sector.
Labour market conditions continued to reflect an
improvement as evidenced in a quarterly decline of
0.2 percentage point in the average unemployment
rate to 5.2 per cent (see Table 3). The Bank
anticipates that as the labour market improves,
this effect should translate to increased consumer
spending in the US economy. However, net exports
may exert a downward pull to growth in the near-
term against the background of the relatively strong
US dollar and weak external demand conditions. In
addition, relatively low oil prices could continue to
adversely affect investments. Overall, the Bank is
projecting quarterly annualized growth to be within
the range of 2.2 per cent to 2.8 per cent over the
next four quarters. This should translate to GDP
growth of 2.5 per cent and 2.6 per cent for 2015
and 2016, respectively.
In terms of inflation, at end-September 2015, the
12-month change in the consumer price index
increased to 0.2 per cent, from 0.1 per cent as at
end-June 2015. The outturn reflected higher prices
Figure 9: Global Economic Growth
Source: Bank of Jamaica
Figure 10: Policy Interest Rates, monthly data (Per Cent)
Source: Bloomberg
Table 3: Unemployment Rate for Selected Economies
(Quarterly Average Per Cent)
USA Canada Euro
Sep-2014 6.1 6.9 11.5
Dec-2014 5.7 6.6 11.5
Mar-2015 5.5 6.7 11.2
Jun-2015 5.3 6.8 11.1
Sep-2015 5.2 6.9* 11.0*
Source: Official statistics offices, * Bloomberg forecast

- 19 -
Quarterly Monetary Policy Report July to September 2015
an expansionary monetary policy stance until this
target is met.
Canada
Real output in Canada is estimated to have
expanded by 2.2 per cent on an annualized
basis, for the September 2015 quarter, following
a contraction of 0.5 per cent in the June 2015
quarter. The resumption of growth in the September
quarter was largely driven by increased household
spending while exchange rate-sensitive exports
gained momentum due to the depreciation in the
Canadian dollar. It should be noted that on 15 July
2015, the BOC reduced the target for the overnight
rate by 25 bps to 0.5 per cent. This monetary
policy initiative occurred against the background
of the negative impact that the decline in oil prices
has had on investment spending and employment
in the Canadian economy. The policy change is
aniticipted to stimulate growth in Canada in the
near-term.
In the context of lower transportation and energy
costs, headline inflation in Canada is estimated
to have decelerated to 0.9 per cent at end-
September 2015 from 1.0 per cent at end-June
2015. The Bank expects inflation to trend within
the range of 0.9 per cent to 1.8 per cent over
the next four quarters, as growth in the Canadian
economy accelerates within the range of 2.0 per
cent to 2.2 per cent.
China
For China, the expansion in real output for the
September 2015 quarter decelerated to 6.9 per
cent on an annualized basis from 7.0 per cent in
the June 2015 quarter. During the review quarter,
lower growth was largely underpinned by the
impact of continued financial market volatility and
weaker global demand. The slowdown in growth
was mainly reflected in a decline in factory activity.
In an effort to further stimulate growth in the
Chinese economy, the government devalued
the Yuan on 11 August 2015 to facilitate a more
for recreational activities, the impact of which was
partly offset by continued declines in energy costs.
In a context where the Fed’s outlook for inflation
remained below the target rate of 2.0 per cent,
the central bank maintained an accommodative
monetary policy stance during the September
quarter. The BOJ is forecasting that inflation in the
USA for the next four quarters will be within the
range of 0.1 per cent and 0.7 per cent. This is
consistent with the latest projection by the Federal
Open Market Committee (FOMC) for inflation to
remain below its target.
Euro Area
Real output in the Euro area expanded by 1.6 per
cent on an annualized basis, in the review period,
following growth of 1.5 per cent in the June 2015
quarter. The growth for the September 2015 quarter
reflected the impact of expansionary monetary
policy measures implemented by the European
Central Bank (ECB) aimed at improving demand
conditions in the region. The easing of monetary
policy in the Euro area has facilitated a reduction in
bank lending rates and increased access to credit
by Small and Medium-Sized Enterprises (SMEs),
which has resulted in growth in credit to the private
sector. Further, the unemployment rate in the Euro
area moderated marginally to 11.0 per cent for the
September 2015 quarter.
The Bank anticipates that economic activity in the
region will increase marginally for the remainder of
2015 as domestic demand conditions continue to
improve. In light of this, the Euro area is expected
to record growth of 1.5 per cent and 1.6 per cent
in 2015 and 2016, respectively.
Headline CPI inflation in the Euro area was -0.1
per cent at end-September 2015 in contrast to
inflation of 0.2 per cent as at June 2015. This
outturn largely reflected the impact of the decline
in energy prices. The Bank expects inflation to
trend below the target rate of 2.0 per cent for
the next four quarters. It should be noted that the
ECB has indicated its committment to maintain

- 20 -
July to September 2015
Quarterly Monetary Policy Report
market-determined exchange rate. However, this
coincided with the heightened volatility in the global
equity and currency markets amidst concerns
of a slowdown in the world’s second largest
economy. In response, the PBOC made several
interventions in the foreign exchange market to
stabilize the Yuan and reduce capital outflows. On
26 August 2015, the PBOC further reduced interest
rates and announced a reduction in the required
reserve ratio to facilitate increased investment in
the stock market and promote economic activity.
Specifically, the PBOC cut its 1-year lending rate
and 1-year deposit rate by 25 bps each to 4.60 per
cent and 1.75 per cent, respectively. The PBOC
announced a reduction in the required reserve ratio
by 50 bps to 18.0 per cent on 06 September 2015.
Against this background, the Bank of Jamaica
projects that economic growth in China for the next
four quarters will be within the range of 6.5 per
cent and 6.8 per cent while inflation is forecast to
be within the range of 1.8 per cent to 2.9 per cent.
International Financial Markets
For the September 2015 quarter, increased volatility
in the global financial market reduced investor
appetite for risk. Notably, there was increased
demand for US Treasury bonds (USTBs) in the
context of the prospects of a slowdown in global
growth associated with adverse developments in
China and expectations of an impending increase
in the Fed Funds rate. In this context, the average
yield on USTBs fell by 26 bps to 1.56 per cent, on
an annual basis mainly reflecting lower yields on
long-term bonds (see Figure 11). On a quarterly
basis, the average yield on USTBs declined by 18
bps. In the context of the foregoing, the quarterly
spread between the 3-month USD LIBOR and the
3-month USTB (TED spread) increased by 4.4 bps
to average 30.5 bps (see Table 4).
With respect to emerging market bonds, the upward
trend in the JP Morgan emerging market bond index
(EMBI+) continued for the quarter. Relative to the
September 2014 quarter, the average yield on the
EMBI+ increased by 72 bps to 6.52 per cent. On
a quarterly basis, the average yield on the EMBI+
rose by 23 bps.
The average yield on Government of Jamaica
global bonds composite index (GOJGBs) reflected
a reversal in the downward trend observed since
December 2013. Notably,the average yield on the
index increased by 61 bps to 6.79 per cent for
the September 2015 quarter. However, the outturn
was 19 bps lower than the average yield for the
September 2014 quarter. The increase in average
yields for the September quarter largely reflected
the impact of reduced preference for risky assets
as well as the impact of the inclusion of the
indicative yields of two GOJ global bonds issued
during the quarter. Against this background, the
spread between GOJGBs and USTBs widened
by 5 bps to 4.69 per cent when compared to the
September 2014 quarter. However, the spread
between the GOJGBs and the EMBI+ narrowed by
92 bps to 0.27 per cent relative to a year ago,
Figure 11: Selected Average Sovereign Bond Yields
(Per Cent)
Source: Bloomberg
Table 3: Average spread between the 3-month
USD LIBOR and the 3-month USTB (TED spread)
Sep - 14 21.5
Dec - 14 21.6
Mar - 15 23.3
Jun - 15 26.1
Sep - 15 30.5
Source: Bloomberg

- 21 -
Quarterly Monetary Policy Report July to September 2015
which is reflective of the higher average yields on
emerging market bond also observed over the
review quarter.
During the quarter, there was a decline in selected
stock market indices largely underpinned by
financial market volality in China. This was the first
reduction recorded since the June 2012 quarter
(see Figure 12). The declines in the September
quarter translated to annual declines of 4.4 per
cent, 2.6 per cent and 0.7 per cent, in the Dow
Jones Industrial Average, the S&P 500 and the
Eurofirst 300 indices, respectively.
With respect to the performance of selected
currencies, there was a general depreciation of
most of the major currencies against the US dollar
on both an annual and quarterly basis. For the
September 2015 quarter, the US dollar index
increased by 0.9 per cent and 15.7 per cent
when compared to the June 2015 quarter and the
September 2014 quarter.1 This was sparked by
the devaluation of the Chinese Yuan by the PBOC
in August 2015. This subsequently led to significant
depreciations in the currencies of other emerging
market countries given fears of a slowdown in
China and the possible spillover effect on these
1 The US Dollar Index (USDX) is computed by the Intercontinental
Exchange Futures, U.S., which uses the euro, Japanese yen,
Canadian dollar, British pound, Swedish krona and Swiss franc
exchange rates relative to the US dollar, supplied by approximately
500 banks.
economies. Further, there was reduced demand
for emerging market curriences as the adverse
financial and economic developments in China
led to capital outflows from these economies.
As a result, the currencies of some advanced
economies such as the USA, Euro area and Japan
appreciated in the review quarter, as investors
sought safe haven assets.
Commodity Prices
Selected commodity prices declined during the
September 2015 quarter, largely reflecting the
impact of buoyant supplies, relatively weak global
economic and market fundamentals coupled with
a stronger US dollar. The Bank’s Fuel Sub-Index
felll by 52.2 per cent on an annual basis to an
average price of US$46.44 per barrel.2 Lower
prices for West Texas Intermediate (WTI) crude oil
were largely as a result of the persistent oversupply
of crude oil on the international market. The
downward pressure on oil prices during the quarter
stemmed largely from the continued growth in
shale oil production in the USA. Record crude oil
production and exports from Iraq. The expectation
of additional supplies from Iran by January 2016
also contributed to lower prices. The growth in
2 Relative to the previous quarter, prices fell by 19.9 per cent.
Figure 12: Selected Stock Market Indices (Per cent)
Source: Bloomberg
Figure 13: The Bank’s Commodity Price Indices
Sources: Bloomberg, World Bank and BOJ

- 22 -
July to September 2015
Quarterly Monetary Policy Report
crude oil production in the USA was supported by
increased drilling activities as a number of oil rigs
that were idle over previous quarters were returned
to the fields.3
Similarly, the Bank’s Agricultural Raw Material Index
(ARMI) reflected lower prices across all categories
of grains against the background of buoyant
supplies and weaker global demand conditions
during the review quarter. Reports from the United
States Department of Agriculture (USDA) explained
that the robust supplies of grains in the market
were supported by excellent growing conditions for
corn and soybean in the USA, as well as increased
wheat production from the European Union (EU)
and the Former Soviet Union area. In addition, the
expectation of increased productivity in Brazil was
anticipated to further add to supplies of soybean
in the near term following the implementation of
structural reforms and the conversion of some
pasture land for use as cropland. In terms of
demand, lower agricultural commodity prices were
also underpinned by the expectation that the slower
growth in China, the second largest commodity
importing country, would result in excess grains on
the market. In addition, demand for commodities,
which are denominated in US dollars, fell against
the background of the appreciation of the US dollar,
which made investments in these commodities
more expensive. In the context of the foregoing,
the ARMI declined by 14.5 per cent and 3.7 per
cent when compared to the September 2014 and
June 2015 quarters, respectively (see Figure 13).
Aluminium prices on the London Metal Exchange
(LME) declined by 19.4 per cent relative to
September 2014 and fell by 9.5 per cent on
a quarterly basis. These declines were largely
influenced by the relatively weaker demand
conditions and buoyant supplies during the quarter.
In particular, lower prices were largely attributed
to (i) persistent stock overhang of aluminium, (ii)
3 Rig count data for the USA, as published by Baker Hughes,
indicated that July and August 2015 were the only months that
accounted for an increase since the start of 2015.
appreciation of the US dollar, (iii) reduced cost of
production given the lower energy prices and (iv)
softer demand from China.
In terms of the outlook for commodity prices for the
next four quarters, crude oil prices are projected to
increase, but remain below US$60.00 per barrel,
on average. This trajectory is primarily informed
by the expected gradual improvement in global
demand conditions and the forecast from the
International Energy Agency for a reduction in shale
oil production. However, this impact is anticipated
to be partly constrained by the expectation of
additional supplies of crude oil, particularly from
Iran in early 2016.
Similarly, aluminium prices are projected to trend
upwards, albeit at a slower pace than previously
projected. This is primarily associated with the
anticipated pick-up in demand from some
advanced economies such as the Euro area.
However, this impact is expected to be partly
offset by the anticipation of buoyant supplies as
China, the world’s largest producer, maintains
its production levels in the context of an already
oversupplied market.
In terms of agricultural commodities, prices are
forecast to increase over the next four quarters
but at a more tempered pace relative to previous
projections. This downward revision takes into
account the current oversupply of grains and the
prospect of further buoyant yields. In addition, the
relative strength of the US dollar is expected to
have a restraining impact on commodity prices for
the remainder of the fiscal year. However, as the
global economy strengthens, improved demand
conditions should place some upward pressure
on prices to facilitate a slight upward trend in the
average price of grains by mid-2016. In addition,
the adverse impact of El Niño weather conditions
on supplies from major grain-producing countries
may contribute to higher prices.

- 23 -
Quarterly Monetary Policy Report July to September 2015
The Implications for the Jamaican Economy
Jamaica’s terms of trade (TOT) index strengthened
for the September 2015 quarter as the developments
in the global economic and financial environments
continued to support strong declines in import
prices. For the review quarter, the index increased
by 33.8 per cent and 2.6 per cent relative to the
comparable period in 2014 and the June 2015
quarter, respectively. This improvement mainly
reflected a reduction of 28.6 per cent in the Import
Price Index (IPI), the impact of which was partially
offset by a decline of 4.4 per cent in the Export
Price Index (EPI).
When compared to the previous quarter, the
estimated decline in the IPI was largely attributed
to the impact of the continued decline in the prices
of crude oil and grains. The lower EPI mainly
reflected a weakening of alumina prices supported
by lower implicit tourism prices due to reduced
tourism travel, the impact of which was partly
offset by higher coffee and sugar prices.4
The TOT is projected to maintain its increasing trend
over the next four quarters, albeit at a moderate
pace. This continued improvement is underpinned
by the assumption for a notable recovery in the
EPI for the March 2016 quarter, supported by a
mild upward trend in import prices. Consistent
with the expectation that a number of advanced
and emerging market economies will continue
to expand into 2016, prices in the international
commodities market are expected to rise, though
slowly, as global demand strengthens.
In light of the forecast of relatively higher
international commodity prices, domestic inflation
is expected to trend upwards over the next
four quarters. Further, growth in the Jamaican
economy is expected to strengthen against the
background of continued improvement in the US
labour market, which should support continued
growth in inflows from tourism and remittances. In
4 The price of aluminium is used as a proxy for alumina prices.
addition, the successful economic performance of
the Government is expected to continue to attract
foreign direct investments, which should bode well
for growth in the domestic economy.
- 24 -
Quarterly Monetary Policy Report
July to September 2015
Real Sector Developments
Aggregate Supply
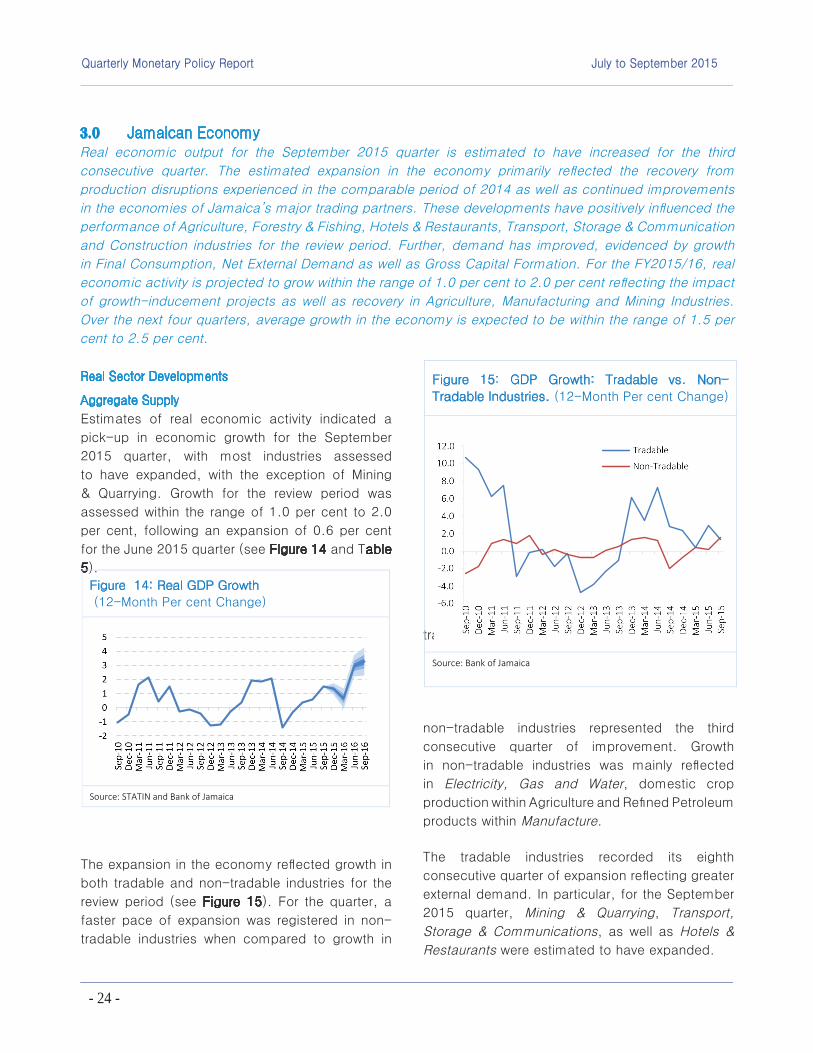
Estimates of real economic activity indicated a
pick-up in economic growth for the September
2015 quarter, with most industries assessed
to have expanded, with the exception of Mining
& Quarrying. Growth for the review period was
assessed within the range of 1.0 per cent to 2.0
per cent, following an expansion of 0.6 per cent
for the June 2015 quarter (see Figure 14 and Table
5).
The expansion in the economy reflected growth in
both tradable and non-tradable industries for the
review period (see Figure 15). For the quarter, a
faster pace of expansion was registered in non-
tradable industries when compared to growth in
3.0 Jamaican EconomyReal economic output for the September 2015 quarter is estimated to have increased for the third
consecutive quarter. The estimated expansion in the economy primarily reflected the recovery from
production disruptions experienced in the comparable period of 2014 as well as continued improvements
in the economies of Jamaica’s major trading partners. These developments have positively influenced the
performance of Agriculture, Forestry & Fishing, Hotels & Restaurants, Transport, Storage & Communication
and Construction industries for the review period. Further, demand has improved, evidenced by growth
in Final Consumption, Net External Demand as well as Gross Capital Formation. For the FY2015/16, real
economic activity is projected to grow within the range of 1.0 per cent to 2.0 per cent reflecting the impact
of growth-inducement projects as well as recovery in Agriculture, Manufacturing and Mining Industries.
Over the next four quarters, average growth in the economy is expected to be within the range of 1.5 per
cent to 2.5 per cent.
tradable industries. The positive performance of
non-tradable industries represented the third
consecutive quarter of improvement. Growth
in non-tradable industries was mainly reflected
in Electricity, Gas and Water, domestic crop
production within Agriculture and Refined Petroleum
products within Manufacture.
The tradable industries recorded its eighth
consecutive quarter of expansion reflecting greater
external demand. In particular, for the September
2015 quarter, Mining & Quarrying, Transport,
Storage & Communications, as well as Hotels &
Restaurants were estimated to have expanded.
Figure 14: Real GDP Growth
(12-Month Per cent Change)
Source: STATIN and Bank of Jamaica
Figure 15: GDP Growth: Tradable vs. Non-
Tradable Industries. (12-Month Per cent Change)
Source: Bank of Jamaica

- 25 -
Quarterly Monetary Policy Report July to September 2015
For the September 2015 quarter, Agriculture,
Forestry & Fishing is assessed to have recorded
a second consecutive quarter of growth. The
industry’s performance reflected recovery in
domestic crop production which was partially
offset by a decline in export agriculture (see
Figure 16). With regard to domestic production,
there were estimated expansions in the output
of fruits and root crops mainly reflecting some
recovery relative to the drought period experienced
in the September 2014 quarter. The estimated
contraction in traditional export crops was mainly
driven by declines in the output of cocoa and
plantain, the impact of which was partly offset by
estimated increases in exports of bananas, coffee
and sugar.
Value added in Hotels & Restaurants is estimated
to have expanded in the September 2015 quarter at
a slower pace than average growth of 3.8 per cent
for the preceding four quarters. Notwithstanding the
deceleration in growth, this expansion represents
the tenth consecutive quarter of expansion since the
March 2013 quarter. The industry’s performance
was mainly driven by a slower growth in Hotels,
largely attributed to a deceleration in the growth
of stop-over visitor arrivals and visitor expenditure
(see Figure 17). The pace of stop-over visitor
Table 1.0: Industry Contribution to Growth
(September 2015 Quarter)
Contribution Estimated Impact on
Growth
GOODS 58.9 2.5 to 3.5
Agriculture, Forestry & Fishing 9.9 1.5 to 2.5 Mining & Quarrying 1.2 0.0 to 1.5
Manufacture 42.7 6.5 to 7.5 Construction 5.1 0.5 to 1.5 SERVICES 40.5 0.0 to 0.5
Electricity & Water Supply 7.5 0.0 to 0.5 Wholesale & Retail Trade, Repairs & Installation of Machinery & Equipment 4.7 0.0 to 0.5
Hotels & Restaurants 7.7 0.0 to 1.5
Transport Storage & Communication 7.6 0.0 to 0.5
Financing & Insurance Services 5.4 0.0 to 0.5
Real Estate, Renting & Business Activities 3.8 0.5 to 1.5
Producers of Government Services -1.0 0.0 to 0.5
Other Services 4.8 0.5 to 1.5 Financial Intermediation Services Indirectly Measured -0.6 -0.5 to 0.5
TOTAL GDP 100.0 1.0 to 2.0
Source: Bank of Jamaica
Figure 16: Domestic & Export Crop Production
(12-Month Per cent Change)
Source: Bank of Jamaica & Ministry of Agriculture
Figure 17: Total Stop-over Visitor Arrivals & Visitor
Expenditure. (12-Month Per cent Change)
Source: Jamaica Tourist Board
- 26 -
Quarterly Monetary Policy Report
July to September 2015
projects. Notwithstanding these developments,
growth in the industry slowed due to the decline in
housing starts by the National Housing Trust.
Value added for Wholesale & Retail Trade, Repairs,
Installation of Machinery & Equipment during
the review period, is primarily inferred from an
increase in manufacturing and construction related
activities. Further, growth in the industry would
have been supported by an estimated expansion
in capital goods and raw materials imports.
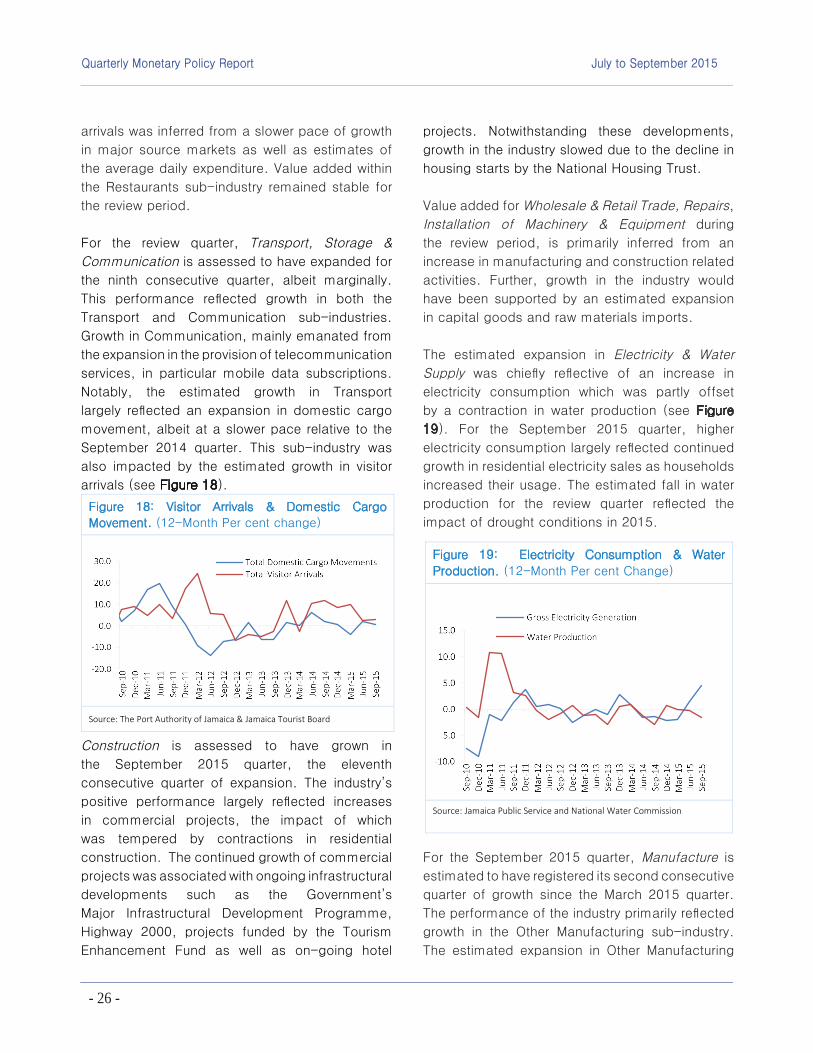
The estimated expansion in Electricity & Water
Supply was chiefly reflective of an increase in
electricity consumption which was partly offset
by a contraction in water production (see Figure
19). For the September 2015 quarter, higher
electricity consumption largely reflected continued
growth in residential electricity sales as households
increased their usage. The estimated fall in water
production for the review quarter reflected the
impact of drought conditions in 2015.
For the September 2015 quarter, Manufacture is
estimated to have registered its second consecutive
quarter of growth since the March 2015 quarter.
The performance of the industry primarily reflected
growth in the Other Manufacturing sub-industry.
The estimated expansion in Other Manufacturing
arrivals was inferred from a slower pace of growth
in major source markets as well as estimates of
the average daily expenditure. Value added within
the Restaurants sub-industry remained stable for
the review period.
For the review quarter, Transport, Storage &
Communication is assessed to have expanded for
the ninth consecutive quarter, albeit marginally.
This performance reflected growth in both the
Transport and Communication sub-industries.
Growth in Communication, mainly emanated from
the expansion in the provision of telecommunication
services, in particular mobile data subscriptions.
Notably, the estimated growth in Transport
largely reflected an expansion in domestic cargo
movement, albeit at a slower pace relative to the
September 2014 quarter. This sub-industry was
also impacted by the estimated growth in visitor
arrivals (see Figure 18).
Construction is assessed to have grown in
the September 2015 quarter, the eleventh
consecutive quarter of expansion. The industry’s
positive performance largely reflected increases
in commercial projects, the impact of which
was tempered by contractions in residential
construction. The continued growth of commercial
projects was associated with ongoing infrastructural
developments such as the Government’s
Major Infrastructural Development Programme,
Highway 2000, projects funded by the Tourism
Enhancement Fund as well as on-going hotel
Figure 18: Visitor Arrivals & Domestic Cargo
Movement. (12-Month Per cent change)
Source: The Port Authority of Jamaica & Jamaica Tourist Board
Figure 19: Electricity Consumption & Water
Production. (12-Month Per cent Change)
Source: Jamaica Public Service and National Water Commission

- 27 -
Quarterly Monetary Policy Report July to September 2015
was mainly driven by growth in petroleum refining
reflecting recovery from disruptions in production in
the corresponding period of the previous year. For
the Food & Beverages sub-industry, expansions
were mainly reflected in Food excluding Sugar and
Alcoholic Beverages. With regard to Food excluding
Sugar, the expansion reflected an increase in the
processing of poultry meat.
Mining & Quarrying is assessed to have expanded
for the review period. The performance of the
industry was mainly driven by growth in crude
bauxite production, the impact of which was
partly offset by a marginal contraction in alumina
production (see Figure 21). The increase in bauxite
production reflected the increased capacity
utilization at one bauxite plant as well as the re-
commissioning of bauxite mining operations at
another plant. In relation to alumina production,
the output for the review period relative to the
September 2014 quarter mainly stemmed from
lower capacity utilization within the industry, arising
from disruptions in production at an alumina plant.
Aggregate Demand
Preliminary estimates of aggregate spending
indicated that Aggregated Demand continued to
strengthen. This assessment was premised on
improvements in all components of aggregate
demand for the September 2015 quarter.
With regard to the assessed expansion in Final
Consumption, both Private and Public Consumption
are estimated to have grown. The estimated
expansion in Private Consumption was inferred from
growth in real remittance inflows and total credit
card transactions (see Figure 22).This marginal
expansion in household spending was consistent
with the JCC Survey of Consumer Confidence
which reflected the continued improvement in
consumer confidence, albeit at a slower pace (see
Figure 23). For Public Consumption, the expansion
was inferred from the continued rise in non-interest
government spending during the review period. In
particular, Programmes & Wages increased at a
faster pace relative to the comparable period of
last year.
The estimated improvement in Net External Demand
occurred in the context where the contractions
in imports of goods and services outweighed
the decline in export goods and services (see
Figure 24). Of note, the reduction in imports was
attributable to an estimated contraction in the
volumes of non-fuel raw materials, the impact of
which was partly offset by a marginal expansion
in the volumes of consumer goods imports.
The performance of exports primarily reflected
contractions in citrus and alumina, partly offset by
Figure 21: Trends in Crude Bauxite, Alumina & Total
Bauxite Production. (12-Month Per cent Change)
Source: Jamaica Bauxite Institute
Figure 20: Petroleum refining. (12-Month Per cent
Change)
Source: Petrojam Ltd.

- 28 -
Quarterly Monetary Policy Report
July to September 2015
an expansion in the volumes of coffee, bauxite
and mineral fuel exports.
The estimated expansion in Gross Capital
Formation was mainly inferred from increased
capital and raw material goods imports as well
as greater foreign direct investment (FDI).The
expansion in FDI for the September 2015 quarter
was mainly related to infrastructural developments
such as the North-South leg of Highway 2000
as well as hotel expansion and rehabilitation.
Notably, the expansion in Gross Capital Formation
was estimated to have been tempered by the
decelerated pace of improvement in the index of
businesses’ future expectations reported by JCC’s
Business Confidence Survey.
Real Sector Outlook
Real GDP growth for FY2015/16 is projected to
remain within the range of 1.0 per cent to 2.0 per cent
while average quarterly growth over the near-term
is expected to be within the range of 1.5 to 2.5 per
cent. Further, the pace of expansion in economic
activity is expected to increase over the medium-
term. It is envisaged that growth for FY2015/16
will occur in the context of continued recovery
in the economies of Jamaica’s major trading
partners, improvements in business and consumer
confidence as well as a further improvement in
Net External Demand. Furthermore, the domestic
economy is projected to benefit from the ongoing
reforms under the IMF-EFF programme which are
expected to improve the business environment.
On balance, risks to the growth outlook are tilted
to the downside, amid uncertainty about slowing
growth in the economies of Jamaica’s major trading
partners as well as concerns about the possibility
of a further decelerations in investor expectations.
Further, unfavourable weather conditions could
mar the economic growth forecast.
Figure 22: Real Total Credit Card Transactions and
Remittances Inflows: Effects on Domestic Demand
(12-Month Per cent Change)
Source: Bank of Jamaica and STATIN
Figure 23: Business and Consumer Confidence
Index (12-Month Per Cent Change)
Source: Bank of Jamaica and Jamaica Chamber of Commerce
Figure 24: Trends in Exports & Imports of Goods
and Services (US$ Millions)
Source: Bank of Jamaica and STATIN

- 29 -
Quarterly Monetary Policy Report July to September 2015
Box 2: Trends in selected measures of Labour
Productivity
Introduction
In the context of an increasingly interconnected
global environment, the success of Jamaica’s
economic reform programme (ERP) is hinged
on, amongst other things, its ability to enhance
its competitiveness. For a small open developing
economy, such as Jamaica, a crucial factor for
improving competitiveness is closely connected to
the country’s ability to improve overall productivity.
In general, this involves creating greater output
through enhanced allocation of production inputs
including labour, technology, energy and raw
materials. In practice, productivity increases when
a higher (or the same) level of output is produced
with the same (or fewer) resources.
Why is labour productivity important?
Higher levels of productivity are particularly
important as it is the most fundamental
determinant of the standard of living. More
specifically, increased productivity expands supply
leading to higher incomes. In turn, higher incomes
reduce poverty. Further, an increase in the overall
productivity is highly correlated with improvements
in the business environment which augurs well for
economic growth. This approach of increasing
labour productivity towards improving external
competitiveness is desirable as it improves living
standards at the same time.5
Measuring Labour Productivity
There are several ways of measuring labour
productivity. These include output per hour worked,
output per worker and unit labour cost. Notably,
productivity can be influenced by non-price factors
such as adequate business infrastructure and social
welfare, low levels of crime and bureaucracy. In
addition, strong labour relations, which involves a
harmonious relations between management and
5 There are several approaches to improving external
competitiveness including relative-price and non-price
adjustments.
employees, is known to improve productivity.
Recent Developments in Productivity
The degree of external competitiveness is illustrated
by the comparison of the level of productivity in one
country relative to another. The indices of labour
productivity as measured by the output per hour
worked shows that Jamaica’s labour productivity
has lagged behind that of the US, UK, Canada
and Europe (See Figure 1). It should be noted that
Jamaica displayed a downward trend in labour
productivity which was negatively impacted by the
global financial crisis in 2008 and has remained
relatively constant in the aftermath of the crisis. The
widening gap is indicative of losses in Jamaica’s
competitiveness vis-à-vis the US, a trend which
has slowed after the crisis. Between the June
2010 and June 2015 quarters, average quarterly
productivity per hour worked increased by 0.3 per
cent in Jamaica. This compares to increases of
0.7 per cent, 0.5 per cent, 1.1 per cent and 0.9 per
cent in US, UK, Canada and Europe, respectively.
With respect to the output per worker measure of
labour productivity, Jamaica’s productivity has
also lagged behind a set of selected countries
from Latin America and the Caribbean (See Figure
2). During the period 2010 and 2013, the average
increase in output per worker in Jamaica was
0.3 per cent. In contrast, the average increase in
productivity per worker over the same period was
0.7 per cent, 2.9 per cent, 2.4 per cent, 1.5 per
cent and 0.3 per cent in Barbados, Costa Rica,
Dominica Republic, US and Mexico respectively.
Figure 1: Labour Productivity (Output per Hour worked)
Source: International Financial Statistics database and Bank of Jamaica

- 30 -
Quarterly Monetary Policy Report
July to September 2015
Monetary Policy, Money and Financial Markets
Monetary Policy
During the September 2015 quarter, the Bank
of Jamaica (BOJ) reduced the signal rate, the
rate on the 30-day Certificate of Deposit (CD),
to 5.25 per cent from 5.50 per cent (see Figure
25).5 The easing of the monetary policy stance,
the second adjustment since the beginning of
the fiscal year, continued to reflect the Bank’s
outlook for lower near and medium-term
domestic inflation. Improvements in the country’s
macroeconomic conditions also supported the
decision for a further reduction in the policy rate.
Other favourable developments that supported the
lowering of the policy rate included the growth in
the net international reserves and a strengthening
5 The Bank maintained the domestic currency cash reserve and
liquid assets requirements at 12.0 per cent and 26.0 per cent,
respectively.
in the current account position of the balance of
payments.
In addition, during the review quarter, the Bank
reduced the spread relative to the 30-day CD rate
by 75 basis points (bps) for its lending facilities.
In this context, the rates on the standing liquidity
facility (SLF), bi-monthly repurchase operations
(BRO) and excess funds rate (EFR) were reduced
to 7.50 per cent, 7.00 per cent and 9.55 per cent.
The adjustment during the quarter was the third for
the fiscal year resulting in a cumulative decline of
175 bps for the fiscal year to September.
The Bank’s policy actions facilitated an easing of
the tight liquidity conditions that prevailed in the
June 2015 quarter. Liquidity was injected through
net foreign currency purchases via the Surrender
facility, net issues of repurchase agreements and
to a lesser extent, maturing OMO instruments
(see Table 6). Notably, there was an injection of
$6.9 billion via the BOJ’s repurchase operations
as institutions continued to utilize the BRO, SLF
and EFR facilities to satisfy some of their liquidity
needs. The overall Jamaica Dollar liquidity impact
of the Bank’s operations for the quarter was a net
injection of $22.2 billion relative to $13.1 billion
in the June 2015 quarter. The injection by the
BOJ’s operations for the September 2015 quarter
was partially offset by an absorption $16.4 billion
from Government’s operations, primarily due to tax
receipts.
Conclusion and Implications
Notwithstanding the focus on one factor of
production, the assessment underscores the
need for diligence in pursuing the structural
reforms embodied in the ERP as well as other
reforms geared towards improving the business
environment and overall levels of productivity.
Moreover, an active process of identifying and
eliminating impediments to the productivity of
labour, capital and technology will remain integral
to Jamaica’s economic growth prospects.
Figure 25: Interest rate on BOJ’s 30-day Certificate of
Deposit
Source: Bank of Jamaica
Figure 2: Labour Productivity (Output per Worker)
Source: International Financial Statistics database and Bank of Jamaica

- 31 -
Quarterly Monetary Policy Report July to September 2015
For the September 2015 quarter, the coupons on
the 3- to 7-year BOJ US dollar CDs were reduced
by an average of 12 to 26 bps. In spite of lower
rates, there was a rollover rate of 74 per cent
primarily reflecting increased placements on the
3-year instrument (see Table 7).
Money Markets
Despite the policy actions, there were periods of
tight liquidity in the private money market during
the September 2015 quarter. These periods were
partly due to a narrow distribution of funds among
banks as well as the BOJ’s intervention in the foreign
exchange market to meet increased demand
for foreign currency. In this context, the average
Table 6: BOJ Liquidity Operations
April - June 2015 July - September 2015
Injection Absorption Net Average Injection Absorption Net Average
Rate Rate
(J$BN) (J$BN) (%) (J$BN) (J$BN) (%)
30-day 48.30 47.30 1.00 5.63 44.98 46.23 -1.26 5.63
365-day VR CD 6.00 3.00 3.00 6.82 6.41 1.15 5.26 6.82
548-day VR CD 0.00 0.00 0.00 0.43 0.00 0.43
729-day VR CD 0.00 3.80 -3.80 7.25 0.00 1.04 -1.04 7.25
365-day FR USD IB 0.00 0.00 0.00 0.00 0.21 -0.21
Repos (net) 0.00 19.20 -19.20 8.92 0.00 8.92 FX (Trading Room &PSE) 66.76 34.68 32.08 63.70 51.53 12.17
Net Injection 13.08 24.26
Other' 0.00 0.00 0.00 0.00 0.00
GOJ operations 88.01 107.85 -19.84 103.00 119.40 -16.40 Net Injection (All Operations) -6.76
7.86
Source: Bank of Jamaica Notes: (i) FR USD IB denotes Fixed Rate US dollar Indexed Bond (ii) Injections reflect maturities of instruments while absorptions reflect new issues of these instruments in each time period, and (iii) Average rates on VR CDs reflect average initial coupons.
Table 7: Placements & Maturities of BOJ USD Instruments
April - June 2015 July - September 2015 Placements Maturities Average Placements Maturities Average (US$MN) (US$MN) Yield (%) (US$MN) (US$MN) Yield (%) 1-year 0 19.12 2-year 10.1 0.0 - 0.0 0.0 - 3-year 11.2 0.0 3.13 74.0 0.0 2.87 4-year 12.1 0.0 - 2.5 0.0 - 4.5-year 0.0 1.6 - 0.0 97.3 - 5-year 0.0 0.0 4.16 0.5 0.0 3.95 7-year 23.1 0.0 4.69 8.7 0.0 4.57 TOTAL 56.5 1.6 85.8 116.5
Source: Bank of Jamaica
overnight private money market rate and interbank
rates rose by 36 bps and 20 bps to 3.49 per cent
and 3.70 per cent, respectively. In contrast, the
average 30-day private money market rate fell by
17 bps to 6.14 per cent.
Notwithstanding the periods of tight liquidity, the
90- and 180-day Treasury bill rates both declined
by 28 bps to 6.20 per cent and 6.35 per cent,
respectively. However, the rate on the 30-day
Treasury Bill was unchanged. The performance
of the instruments reflected the continued positive
outlook for inflation and market participant’s
favourable outlook for liquidity over the near term
(see Figure 26). In particular, with the exception
of Treasury Bills, there were no other issues of
GOJ instruments in the domestic market during the
quarter.
Foreign Exchange Market
The weighted average selling rate of the Jamaica
Dollar vis-á-vis the US dollar closed the September
2015 quarter at J$119.06 = US$1.00 reflecting an
increased pace of depreciation to 5.67 per cent
from 4.26 per cent at the end of the previous
quarter (see Figures 27 and 28).The faster pace
of depreciation reflected a reversal of the trend
observed since the September 2013 quarter.
The uptick in the pace of depreciation against
the US dollar for the September 2015 quarter
occurred in the context of higher net demand for
Figure 26: Average Selected Market Interest Rates
Source: Bank of Jamaica Notes: (i) PMMR is the private money market rate (ii) O/N is the overnight rate in the market accessible by all financial institutions while the interbank rate (I/B) is the overnight rate accessible only by banks.

- 32 -
Quarterly Monetary Policy Report
July to September 2015
foreign currency to satisfy Balance of Payments
current account transactions (see Figure 11). The
higher net demand reflected increased payments
as well as lower receipts. Higher payments were
associated with increased demand for non-fuel
imports. Lower receipts reflected a decline in
non-traditional exports, in particular, mineral fuel
the impact of which was partly offset by higher
inflows from tourism and remittances. Private
capital inflows were also estimated to have been
lower for the same period. During the September
2015 quarter, demand pressures in the foreign
exchange market were tempered by BOJ net sales
of US$297.9 million.
There was an estimated gain of 3.3 per cent in
Jamaica’s external price competitiveness, as
measured by the real effective exchange rate
(REER) at end-September 2015, compared to
the estimated gain of 1.1 per cent at the end of
the previous quarter (see Figure 11). The gain
in competitiveness reflected the faster pace of
depreciation of the domestic currency as well
as a lower rate of domestic inflation, relative to
Jamaica’s major trading partners. Specifically,
Jamaica’s rate of inflation declined by 2.4 per
cent, in contrast to the increase of 0.4 per cent in
the weighted average inflation rate of Jamaica’s
major trading partners.
Figure 27: WASR of Select Major Currencies (e.o.p.) (12 –
month point-to-point)
Equities Market
With the exception of the Cross Listed Index, all
the Jamaica Stock Exchange (JSE) indices rose at
end-September 2015 relative to the annual change
as at end-June 2015. Notably, both the JSE Main
Index and the Junior Market Index grew by 33.3 per
cent and 49.9 per cent, respectively, for the year
ended September 2015. The outturn for the JSE
Main compared favourably to average growth of
4.1 per cent for the last five years (see Figure 29).
The performance of the equities market during
the review period reflected improved investor
sentiments. This improvement was in the context
of positive macroeconomic developments
including relatively low inflation, enhanced liquidity
conditions and the continued reduction in the
Bank’s policy rate. These positive developments
were complemented by Jamaica’s continued
positive performance under the EFF programme.
In addition to the improved investor sentiment,
higher company profit earnings by large corporates
listed on the JSE also contributed to the favourable
performance of equities. Furthermore, investments
in equities provided a more attractive option
Figure 11: The Real Effective Exchange Rate (REER), WASR and Net
Demand* (12– month point-to-point percentage change)
Source: Bank of Jamaica
Notes: (i) A decline in the level of the REER (a negative change) implies an improvement in
external price competitiveness
*Net demand is referred to as the overall cash demand for balance of payments current
account transactions and is calculated as the difference between estimated current account
cash inflows and outflows.

- 33 -
Quarterly Monetary Policy Report July to September 2015
relative to foreign currency and domestic money
market investments. More specifically, equities
offered a return of 33.3 per cent for the review
period, while capital gains due to depreciation on
foreign currency investments were 5.3 per cent
and interest rates in the 30-day money market
declined by 1.9 percentage points to 6.3 per cent
at end-September 2015 (see Figure 30).6
There was a general increase in the values of key
market indicators for the year ended September
2015. In particular, the value of transactions,
volume of stocks traded and number of transactions
for the main JSE Index recorded respective growth
rates of 24.4 per cent, 7.0 per cent and 5.9 per
cent (see Figure 31).
The improved outturn in the equities market was
also reflected in the advance to decline ratio which
increased to 28:3 for the year ended September
2015 relative to 8:20 for the year ended September
2014. Price appreciation was broad-based and
reflected the performance of stocks within all seven
sectors. The Communication and Financial sectors
accounted for six of the top ten advancing stocks
based on recorded average price appreciations
6 Capital gains are calculated as the 12-month point-to-point
change. Returns on equities reflect price appreciation/depreciation
and is computed based on the JSE Main Index.
Figure 29: Annual Growth of the JSE Indices
(12-Month Per cent Change)
-30.0
-15.0
0.0
15.0
30.0
45.0
60.0
75.0
90.0
-30.0
-5.0
20.0
45.0
70.0
95.0
120.0
145.0
170.0
Sep
-10
De
c-1
0
Ma
r-1
1
Jun
-11
Sep
-11
De
c-1
1
Ma
r-1
2
Jun
-12
Sep
-12
De
c-1
2
Ma
r-1
3
Jun
-13
Sep
-13
De
c-1
3
Ma
r-1
4
Jun
-14
Sep
-14
De
c-1
4
Ma
r-1
5
Jun
-15
Sep
-15
ALL JA
SELECT
Crosslisted
Junior Market
JSE Combined Index
JSE Main Index (RHS)
Source: Jamaica Stock Exchange
Figure 30: Returns from Private Money Market and Gains
from JSE Main Index and Foreign Currency Investments
(Per cent)
-30.0
-10.0
10.0
30.0
50.0
Se
p-1
0
De
c-1
0
Ma
r-1
1
Jun
-11
Se
p-1
1
De
c-1
1
Ma
r-1
2
Jun
-12
Se
p-1
2
De
c-1
2
Ma
r-1
3
Jun
-13
Se
p-1
3
De
c-1
3
Ma
r-1
4
Jun
-14
Se
p-1
4
De
c-1
4
Ma
r-1
5
Jun
-15
Se
p-1
5
30-day Private Money Market Rate
12-Month Change in the Main JSE Index
12-Month Change in Foreign Currency Investments
Source: Jamaica Stock Exchange and Bank of Jamaica
of 113.1 per cent and 79.5 per cent, respectively
(see Table 8).7 Notably, only three stocks declined
for the review period (see Table 9).
7 During the September 2015 quarter, within the Communication
sector, Radio Jamaica Limited announced a proposed
amalgamation with the Gleaner Company Limited.
Figure 31: Annual Movement in Volumes, Values Traded &
Number of Transactions (Main JSE Index)
(12-Month Per cent Change)
-60.0
-40.0
-20.0
0.0
20.0
40.0
60.0
80.0
100.0
Sep
-10
De
c-1
0
Ma
r-1
1
Jun
-11
Sep
-11
De
c-1
1
Ma
r-1
2
Jun
-12
Sep
-12
De
c-1
2
Ma
r-1
3
Jun
-13
Sep
-13
De
c-1
3
Ma
r-1
4
Jun
-14
Sep
-14
De
c-1
4
Ma
r-1
5
Jun
-15
Sep
-15
Volume
Values traded
No. of Transactions
Source: Jamaica Stock Exchange
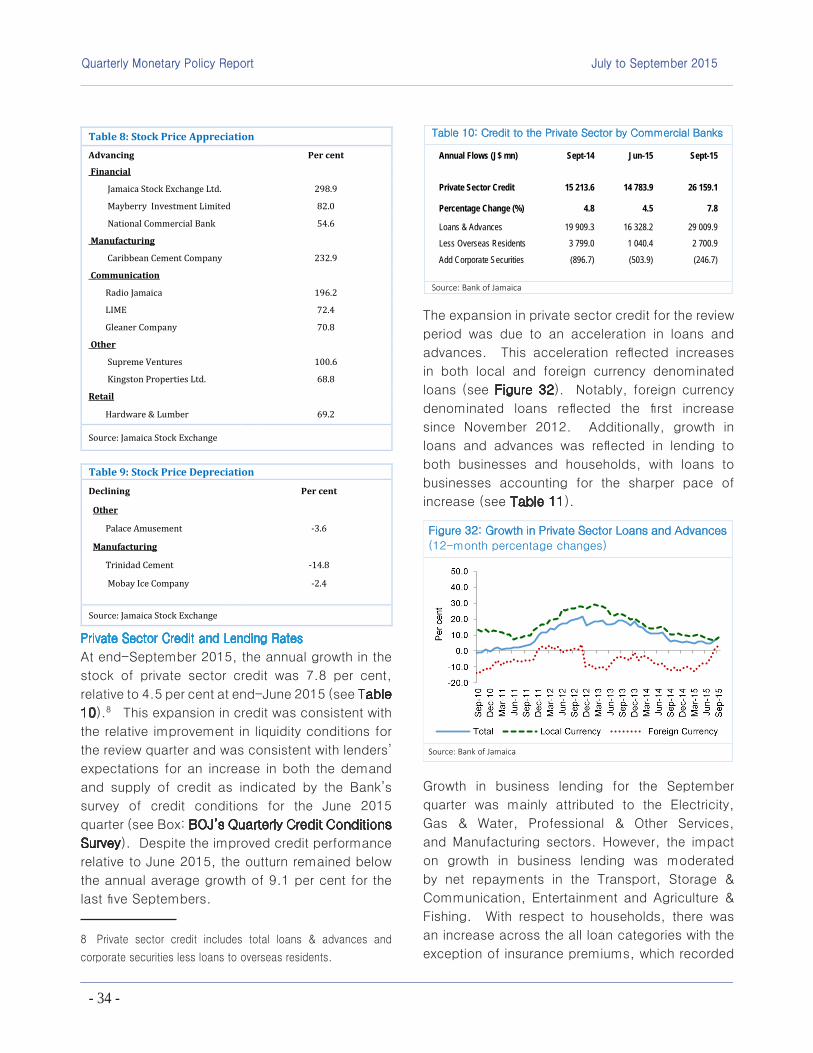
- 34 -
Quarterly Monetary Policy Report
July to September 2015
Private Sector Credit and Lending Rates
At end-September 2015, the annual growth in the
stock of private sector credit was 7.8 per cent,
relative to 4.5 per cent at end-June 2015 (see Table
10).8 This expansion in credit was consistent with
the relative improvement in liquidity conditions for
the review quarter and was consistent with lenders’
expectations for an increase in both the demand
and supply of credit as indicated by the Bank’s
survey of credit conditions for the June 2015
quarter (see Box: BOJ’s Quarterly Credit Conditions
Survey). Despite the improved credit performance
relative to June 2015, the outturn remained below
the annual average growth of 9.1 per cent for the
last five Septembers.
8 Private sector credit includes total loans & advances and
corporate securities less loans to overseas residents.
Table 8: Stock Price Appreciation Advancing Per cent
Financial
Jamaica Stock Exchange Ltd. 298.9
Mayberry Investment Limited 82.0
National Commercial Bank 54.6
Manufacturing
Caribbean Cement Company 232.9
Communication
Radio Jamaica 196.2
LIME 72.4
Gleaner Company 70.8
Other
Supreme Ventures 100.6
Kingston Properties Ltd. 68.8
Retail
Hardware & Lumber 69.2
Source: Jamaica Stock Exchange
Table 9: Stock Price Depreciation
Declining Per cent
Other
Palace Amusement -3.6
Manufacturing
Trinidad Cement -14.8
Mobay Ice Company -2.4
Source: Jamaica Stock Exchange
The expansion in private sector credit for the review
period was due to an acceleration in loans and
advances. This acceleration reflected increases
in both local and foreign currency denominated
loans (see Figure 32). Notably, foreign currency
denominated loans reflected the first increase
since November 2012. Additionally, growth in
loans and advances was reflected in lending to
both businesses and households, with loans to
businesses accounting for the sharper pace of
increase (see Table 11).
Growth in business lending for the September
quarter was mainly attributed to the Electricity,
Gas & Water, Professional & Other Services,
and Manufacturing sectors. However, the impact
on growth in business lending was moderated
by net repayments in the Transport, Storage &
Communication, Entertainment and Agriculture &
Fishing. With respect to households, there was
an increase across the all loan categories with the
exception of insurance premiums, which recorded
Table 10: Credit to the Private Sector by Commercial Banks
Annual Flows (J$ mn) Sept-14 Jun-15 Sept-15 Private Sector Credit 15 213.6 14 783.9 26 159.1
Percentage Change (%) 4.8 4.5 7.8
Loans & Advances 19 909.3 16 328.2 29 009.9
Less Overseas Residents 3 799.0 1 040.4 2 700.9
Add Corporate Securities (896.7) (503.9) (246.7)
Source: Bank of Jamaica
Figure 32: Growth in Private Sector Loans and Advances
(12-month percentage changes)
Source: Bank of Jamaica

- 35 -
Quarterly Monetary Policy Report July to September 2015
a marginal net repayment. Specifically, there were
notable increases in instalment and terms loans
for the review period. Notably, the faster pace of
growth in mortgage and instalment loans occurred
against the background of the trend decline in
lending rates to these market segments.
Real growth in private sector credit at end-
September 2015 continued the trend improvement
evident since August 2014 (see Figure 33). This
sharp growth in real credit largely reflected the
faster pace of decline in annual inflation which
Table 11: Distribution of Total Loans & Advances to the
Private Sector by Commercial Banks
Annual Flows Jun-14 Sep-14 Jun-15 Sep-15
Business Lending 9 445.8 5 003.9 4 499.6 13 552.4
Agriculture & Fishing 3 455.5 1 138.2 (1 107.2) 86.6
Mining & Quarrying 115.6 36.8 250.5 152.7
Manufacturing 1 533.9 1 812.0 1 671.8 3 091.3
Construction & Land Development 1 458.5 1 099.2 434.6 687.3
Transport, Storage & Communication 799.3 1.0 (1 867.9) (2 070.2)
Tourism 304.9 253.1 2 535.2 2 008.2
Distribution 3 299.9 3 260.5 1 879.5 2 619.7
Electricity, Gas & Water (1 685.3) (2 842.4) (1 976.6) 3 116.1
Entertainment 491.5 283.1 ( 898.4) ( 811.6) Professional & Other Services ( 327.9) ( 37.6) 3 578.3 4 672.3
Household & Other Lending 23 086.1 14 905.3 11 828.6 15 457.5
Personal 20 447.6 11 106.4 10 788.2 12 756.6
o/w Demand loans ( 40.2) 3 280.5 3 783.9 2 695.2
o/w Term loans 5 697.5 3 603.6 337.7 4 352.4
o/w Mortgage 8 529.8 2 315.4 1 986.3 2 179.5
o/w Installment 7 467.0 4 658.6 4 784.5 5 612.2 o/w Overdraft
loans 24.4 10.4 ( 80.7) 110.6 o/w Insurance
premiums ( 0.4) ( 15.7) ( 13.5) ( 2.8)
Overseas Residents 2 638.5 3 799.0 1 040.4 2 700.9
Net Lending 32 531.9 19 909.3 16 328.2 29 009.9
Annual Growth 10.7% 6.2% 4.8% 8.5% Source: Bank of Jamaica Notes: (i) Loans & Advances include local and foreign currency loans extended to businesses and individuals.
was supported by growth in nominal private sector
credit (see Inflation).
The overall weighted average lending rate of
commercial banks declined relative to end June
2015. However, relative to end September 2014,
there was an increase of 28 bps in the overall
lending rate (see Table 12). This increase was
predominantly driven by personal loans, which
recorded an increase of 261 bps relative to
September 2014. Notwithstanding this, lending
rates in most of the other loan categories declined
in the context of the Bank’s policy actions during
the review quarter (see Monetary Policy). Notably,
lending rates to the local government sector
recorded the sharpest decline.
Against this background, the quality of the loan
portfolio improved to record lows for the review
period. In particular, the ratios of non-performing
loans (NPL) to private sector loans and total
loans at end-September 2015 declined by 75 bps
and 64 bps to 4.54 per cent and 4.17 per cent,
respectively, relative to end-September 2014 (see
Figure 34). The declines in the NPL ratios reflected
a sharper reduction in total past due loans relative
to the growth in private sector loans and total
loans. This was attributable to the faster pace
of loan recoveries relative to the decline in gross
loans charged off.
Figure 33: Real Growth in Private Sector Credit
(12-month percentage changes)
Source: Bank of Jamaica

- 36 -
Quarterly Monetary Policy Report
July to September 2015
Money
The monetary base grew by 12.2 per cent on an
annualised basis at end-September 2015 relative
to 8.9 per cent and 4.5 per cent as at end-June
2015 and end-September 2014, respectively. The
annual growth at end September 2015, mainly
reflected an increase of the currency stock of 14.7
per cent, which was higher than the 9.5 per cent
and 5.8 per cent recorded at end-June 2015 and
Table 12: Commercial Bank: Domestic Currency Lending
Rates by Loan Type
Jun-14 Sep-14 Jun-15 Sep-15
OVERALL 17.50 16.71 17.17 16.99
Public Sector 16.10 10.28 10.30 8.85 Local Govt. & O.P.E 11.47 11.35 12.65 8.14 Central Government 16.61 10.10 9.74 9.17
Private Sector 17.53 16.82 17.30 17.15
Instalment 16.29 16.41 15.79 15.55 Mortgage 9.79 9.76 9.69 9.66 Personal 25.53 23.48 26.26 25.85 Commercial 12.98 12.85 12.75 12.79
Annual Change (Basis Points) Jun-14 Sep-14 Jun-15 Sep-15 OVERALL 22 -74 -33 28 Public Sector 7 8 -581 -143 Local Govt. & O.P.E 45 78 118 -321 Central Government 10 -4 -687 -93
Private Sector 18 -78 -23 33 Instalment -121 -45 -50 -86 Mortgage -51 -17 -10 -10
Personal 258 -154 73 237 Commercial -130 19 -23 -6
Source: Bank of Jamaica
Figure 34: Commercial Bank Loan Quality
(percentages)
Source: Bank of Jamaica
end-September 2014, respectively (see Table 13
and Figure 35).
With regard to the sources of the change in the
monetary base, there was an increase of $37.3
billion (US$325.4 million) in the NIR stock relative
to end-June 2015, the impact of which was
partially offset by a contraction of $33.8 billion
in the net domestic assets (NDA) (see Table
Table 13: Bank of Jamaica Operating Targets
Stock
Flow Sep-14 Jun-15 Sep-15 Q –o- Q Y-o-Y
NIR (US$MN) 2 200.6 2 116.5 2 441.9 325.4 241.3
NIR(J$MN) 234 096.3 242 679.0 279 986.1 37 307.1 45 889.8
- Assets 288 848.3 290 923.5 331 419.2 40 495.7 42 570.9
- Liabilities -54 752.0 -48 244.5 -51 433.1 -3 188.6 3 318.9
Net Domestic Assets
-137 846.8
-138 203.4
-171 987.5 -33 784.1 -34 140.7
- Net Claims on Public Sector 110 474.8 140 317.0 101 215.6 -39 101.4 -9 259.2
- Net Credit to Banks -22 606.0 -24 229.3 -24 897.5 - 668.2 -2 291.5 - Open Market Operations -35 206.8 -51 609.4 -48 743.7 2 865.7 -13 536.9
- Other -190
508.7 -202
681.7 -199
561.8 3 119.9 -9 053.1
-o/w USD FR CDs -91 040.8 -99 089.1 -95 937.5 3 151.6 -4 896.7
Monetary Base 96 249.6 104 475.6 107 998.6 3 523.0 11 749.0
- Currency Issue 61 573.4 67 916.9 70 635.1 2 718.2 9 061.7
- Cash Reserve 34 271.2 35 852.7 36 680.4 827.7 2 409.2
- Current Account 405.0 706.1 683.2 - 22.9 278.2
Source: Bank of Jamaica
Figure 35: Money Multiplier vs Growth in Base and Broad Money
(Annual percentage changes)
2.30
2.40
2.50
2.60
2.70
2.80
2.90
3.00
3.10
-5.0
0.0
5.0
10.0
15.0
20.0
Mar
-10
Jun-
10Se
p-10
Dec-
10M
ar-1
1Ju
n-11
Sep-
11De
c-11
Mar
-12
Jun-
12Se
p-12
Dec-
12M
ar-1
3Ju
n-13
Sep-
13De
c-13
Mar
-14
Jun-
14Se
p-14
Dec-
14M
ar-1
5Ju
n-15
Sep-
15
Per
cent
Base Money Broad MoneyMoney Multiplier (RHS)
Source: Bank of Jamaica

- 37 -
Quarterly Monetary Policy Report July to September 2015
13).9 The increase in the NIR mainly reflected
the purchase of the US dollar proceeds of GOJ
debt raising on the international capital markets
in July as well as market purchases which more
than offset the payment of GOJ debt and market
sales during the period. The contraction in the
NDA mainly reflected the build-up of Government
deposits at the Bank. The growth in the NIR in
the review quarter contributed to the year on year
increase in the NIR which influenced the annual
expansion in base money. This annual growth in
the NIR more than offset a year on year decline in
the NDA. The NDA decline was largely as a result
of growth in open market liabilities and net public
sector liabilities, with the latter arising mainly from
the build-up in Central Government deposits at the
Bank.
At end-September 2015, the money multiplier, as
measured by the ratio of broad money (M2J) to
base money, was 2.67 per cent relative to 2.64
per cent at end-June 2015. The increase in the
money multiplier resulted from the faster annual
growth of 12.8 per cent in broad money relative to
the expansion in the monetary base. For the review
quarter, the growth in M2J was faster than the 7.8
per cent recorded at end-June 2015. Notably, the
expansion in broad money for the September 2015
quarter was also faster than the average annual
growth of 4.4 per cent for the last five years. The
growth in broad money was reflected in faster
growth in all categories of deposits and currency
in circulation relative to end-June 2015 and a
year earlier. Against this background, growth in
broad money outpaced the estimated expansion
in nominal Gross Domestic Product (GDP), which
is indicative of possible emerging risks to inflation
(see Figure 36).
9 At end-September 2015, gross reserves amounted to US$2
890.5 million, representing 22.4 weeks of goods and services
imports.
With respect to the measure of broad money
supply that includes the Jamaica Dollar value of
foreign currency deposits, M2*, there was annual
growth of 14.1 per cent at end-September 2015.
This compares with annual growth of 9.2 per cent
and 2.0 per cent at end-June 2015 and end-
September 2014, respectively. The growth in
M2* at end-September 2015 was influenced by
depreciation of 5.67 in the WASR of the Jamaica
Dollar vis-à-vis the US dollar, as well as an
increase of 10.1per cent in the US dollar stock of
private sector deposits. Despite the growth in the
Jamaica Dollar value of foreign currency deposits,
the dollarization ratio declined to 45.3 per cent
from 45.4 per cent at end-June 2015.
Figure 32: Broad Money and Nominal GDP Growth
(percentage changes)
Source: Bank of Jamaica

- 38 -
Quarterly Monetary Policy Report
July to September 2015
Box 3: Credit Conditions Survey
OverviewThe results of the BOJ’s QCCS for the June 2015
quarter indicated that credit conditions eased
marginally, similar to the March 2015 quarter (see
Figure 1). This performance in June was in contrast
to an expected tightening in credit conditions that
was indicated by respondents in the March 2015
survey for the June quarter.
The marginal but steady easing in credit market
conditions was underpinned by improvements
in lending policies applied to unsecured loans.
Lenders highlighted that the activation of the credit
bureau and the current downward trend in market
interest rates have increased their risk appetite.
As a result, lenders extended the maximum size
of credit lines and reduced the fees applicable to
unsecured loans during the review quarter. For the
September 2015 quarter, lenders anticipate credit
market conditions will continue to ease marginally,
reflecting less stringent policies for secured loans
and policies associated with unsecured loans are
expected to continue to ease but at a slower pace
than in the June quarter.
Figure 1: Index of Credit Market Conditions
Source: Bank of Jamaica’s Quarterly Credit Conditions Survey Notes: (i) The asterisk (*) represents forward looking expectations provided by the respondents for the June quarter. (ii) The index is the average response for changes in eight credit terms reported in the Credit Conditions Survey. (iii) An index greater than 100 indicates an easing of credit market conditions while an index below 100 indicates a tightening of market conditions.
September
2015
forecast
Credit Supply
For the June 2015 quarter, the supply of credit
remained robust as reflected in the Credit Supply
Index (CSI) of 102.7, although lower than the
105.9 anticipated in the previous survey (see
Figure 2). The outturn for the review quarter
reflected increases for both local and foreign
currency lending facilities, which were made
accessible to both businesses and households.
Although personal loans continued to account
for the greater proportion of the credit supplied,
there was an increase in credit made available to
businesses during the review quarter (see Figure
3). Of the credit allocated to businesses, there was
a marginal redistribution of credit from medium
businesses to small firms while credit supplied to
large and micro businesses remained unchanged
relative to the March 2015 survey results.
Lenders indicated that activity in the market was
low but extremely competitive, which has made
generating new loans difficult, particularly among
large corporations. Consequently, there was a
general thrust among creditors to explore initiatives
to improve lending to micro-business markets. In
addition, lenders suggested that public education
on entrepreneurship could assist with attracting the
public to consider business opportunities.
Figure 2: Credit Supply and Demand Indices
Source: Bank of Jamaica’s Credit Conditions Survey Notes: (i) *-Expectations for the upcoming quarter indicated by respondents in the previous survey and (ii) Indices greater than 100 indicate an increase in the variable while an index less than 100 indicates a decline.
September
2015
forecast
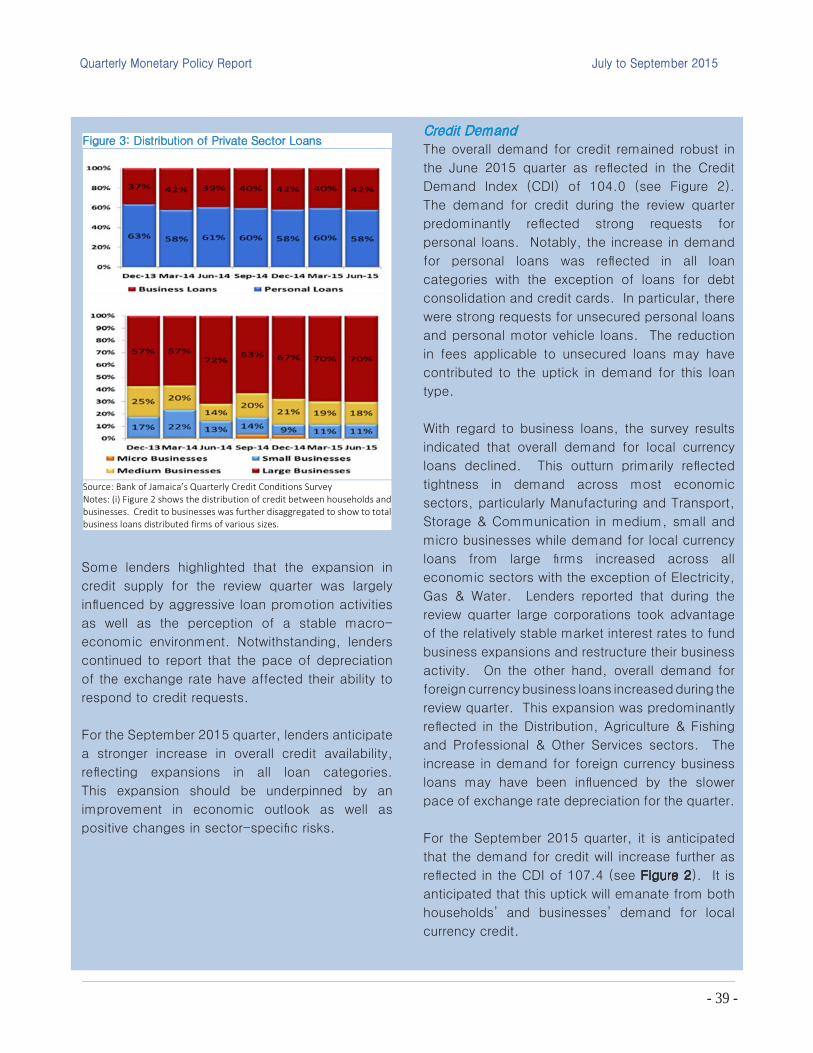
- 39 -
Quarterly Monetary Policy Report July to September 2015
Some lenders highlighted that the expansion in
credit supply for the review quarter was largely
influenced by aggressive loan promotion activities
as well as the perception of a stable macro-
economic environment. Notwithstanding, lenders
continued to report that the pace of depreciation
of the exchange rate have affected their ability to
respond to credit requests.
For the September 2015 quarter, lenders anticipate
a stronger increase in overall credit availability,
reflecting expansions in all loan categories.
This expansion should be underpinned by an
improvement in economic outlook as well as
positive changes in sector-specific risks.
Figure 3: Distribution of Private Sector Loans
Source: Bank of Jamaica’s Quarterly Credit Conditions Survey Notes: (i) Figure 2 shows the distribution of credit between households and businesses. Credit to businesses was further disaggregated to show to total business loans distributed firms of various sizes.
Credit Demand
The overall demand for credit remained robust in
the June 2015 quarter as reflected in the Credit
Demand Index (CDI) of 104.0 (see Figure 2).
The demand for credit during the review quarter
predominantly reflected strong requests for
personal loans. Notably, the increase in demand
for personal loans was reflected in all loan
categories with the exception of loans for debt
consolidation and credit cards. In particular, there
were strong requests for unsecured personal loans
and personal motor vehicle loans. The reduction
in fees applicable to unsecured loans may have
contributed to the uptick in demand for this loan
type.
With regard to business loans, the survey results
indicated that overall demand for local currency
loans declined. This outturn primarily reflected
tightness in demand across most economic
sectors, particularly Manufacturing and Transport,
Storage & Communication in medium, small and
micro businesses while demand for local currency
loans from large firms increased across all
economic sectors with the exception of Electricity,
Gas & Water. Lenders reported that during the
review quarter large corporations took advantage
of the relatively stable market interest rates to fund
business expansions and restructure their business
activity. On the other hand, overall demand for
foreign currency business loans increased during the
review quarter. This expansion was predominantly
reflected in the Distribution, Agriculture & Fishing
and Professional & Other Services sectors. The
increase in demand for foreign currency business
loans may have been influenced by the slower
pace of exchange rate depreciation for the quarter.
For the September 2015 quarter, it is anticipated
that the demand for credit will increase further as
reflected in the CDI of 107.4 (see Figure 2). It is
anticipated that this uptick will emanate from both
households’ and businesses’ demand for local
currency credit.

- 40 -
Quarterly Monetary Policy Report
July to September 2015
Fiscal Developments
Information for the September 2015 quarter
indicated that the Central Government recorded
a fiscal deficit of $3.7 billion, relative to the
budgeted deficit of $12.9 billion (see Table 14).
The outturn for the quarter reflected lower than
anticipated Expenditure, the impact of which was
partially offset by lower than budgeted Revenue
& Grants. In relation to the overall balance there
was a surplus of $44.6 billion, $35.4 billion higher
than the targeted surplus. For the fiscal year
(FY) to September 2015, the Central Government
performance resulted in a primary surplus of $50.8
billion, $10.8 billion above the targeted surplus
under the EFF-programme. Similarly, tax revenue
was $10.1 billion above the indicative EFF target.
Revenue & Grants, for the review quarter was
$567.9 million below budget. The outturn emanated
mainly from lower grants and bauxite levy receipts
as the other categories of revenue were relatively in
line with budget. The underperformance of grants
largely reflected delayed funding due to the slower
than expected execution of some capital projects.
Notably, there were greater tax receipts from
Income & Profits and Production & Consumption
consequent on the over-performance of corporate
taxes, ‘tax on Interest’ and SCT (local). The tax
revenue outturn was facilitated by an improvement
in compliance due to increased administrative
efforts by the Tax Administration of Jamaica (TAJ).
In addition, lower payments of refunds and higher
receipts arising from the tax on alcohol aided the
Price of Credit
Based on the survey responses, average interest
rates on local currency loans decreased for the
June 2015 quarter relative to the March 2015
quarter, largely reflecting a decline in lending rates
on personal loans (see Table 1).
With respect to interest rates on foreign currency
loans, the survey results indicate an overall
increase, consistent with the rise in demand for
these loans. The higher interest rates were due to
a significant increase in lending rates applied to
business loans, which could reflect the impact of
tight US dollar liquidity on the cost of these funds.
Against this background, average rates on local
currency loans fell by 0.20 percentage points (pps)
for the June 2015 quarter (see Table 1). Notably,
rates on personal loans declined by 1.06 pps to
18.96% while rates on local currency business
loans increased to 15.03% from 14.61% during
the review quarter. With respect to foreign currency
denominated loans, lenders reported that interest
rates on foreign currency business loans increased
by 4.84 pps to 13.15%.
Lenders expect a general increase in local
currency interest rates in the September 2015
quarter. More specifically, interest rates on local
currency personal loans and the prime rate are
expected to increase. Lenders indicated that they
Table 1: Interest Rates on Local and Foreign Currency Loans
Source: Bank of Jamaica’s Credit Conditions Survey Notes: * Expectations for interest rates indicated by respondents of the survey.
expect interest rates to increase for Jamaica Dollar
facilities as liquidity challenges persist. Consistent
with anticipated slowdown in demand for foreign
currency loans, interest rates on these loans are
expected to fall in the September 2015 quarter.
For more detailed analysis of the survey see BOJ
Credit Conditions Survey Report.

- 41 -
Quarterly Monetary Policy Report July to September 2015
Figure 36: C-Efficiency Ratio (Per cent)
over-performance in ‘tax on interest’ and SCT
(local), respectively. However, there were, reduced
tax receipts from International Trade largely
reflected in SCT (imports) and customs duty, due
to weaker than expected imports.
In the context of the newly implemented tax
revenue measures in FY2015/16 and the increased
administrative efforts of the TAJ, tax receipts in
the review period were 14.4 per cent above the
outturn for the September 2014 quarter. The
increased administrative efforts contributed to a
higher C-Efficiency (GCT & SCT) ratio of 78.5 per
cent, for the September 2015 quarter relative to
an implicit budget target of 70.8 per cent.5 The
5 The C-Efficiency ratio captures the efficiency of Government’s
tax collection and is defined as the ratio of the share of value-
added tax (VAT) revenue to consumption divided by the standard
VAT rate. The generally accepted benchmark for the C-efficiency
for small countries is 83.0 percent. Factors linked to a high
FY15/16
Prov. Budget Diff Budget
Revenue & Grants 109.2 109.8 -0.6 458.1
o/w Tax Revenues 99.7 98.2 1.5 411.9
Non- Tax Revenue 7.3 7.0 0.4 31.0
Grants 1.6 3.4 -1.8 9.5
Expenditure 113.0 122.7 -9.7 463.0
Programmes 34.3 35.0 -0.7 135.7
Wages & Salaries 40.6 44.3 -3.8 165.2
Interest Payment 34.6 35.9 -1.3 131.6
Capital Investment 3.5 7.5 -3.9 30.4
Budget Surplus/Deficit -3.7 -12.9 9.2 -4.9
Primary Balance 30.9 23.0 7.9 126.7
Current Balance -2.0 -9.0 7.1 15.0
Total Financing 257.0 51.4 205.6 128.9
Foreign Loans 253.5 33.2 220.3 72.6
Domestic Loans 3.4 18.2 -14.7 56.3
Amortisation 208.7 29.3 179.4 178.6
Foreign 204.5 5.2 199.3 178.6
Domestic 4.2 24.1 -19.9 95.1
Overall Balance 44.6 9.2 35.4 -54.5
Table14: Summary of Fis cal Operations
($J billions)
Source: Ministry of Finance and Planning
September 2015 Quarter
efficiency outturn was 17.4 percentage points
above the average ratio for the previous three
September quarters driven largely by increased
compliance (see Figure 36).
Expenditure for the September 2015 quarter was
$9.7 billion below budget, arising largely from
lower than planned recurrent and capital spending
(see Table 14). In particular, lower than budgeted
payments for capital expenditure, wages & salaries
and interest cost primarily influenced the outturn.
Delays in the settlement of new wage agreements
for FY2015/16 and FY2016/17 impeded the
payment of new salaries as budgeted. The slower
pace of depreciation as well as the lower interest
rates contributed to the deviation in interest
payments.
The Government’s financing requirement for
the September 2015 quarter was $212.4 billion
arising from the fiscal deficit of $3.7 billion and
amortization payments of $208.7 billion. The
Government operations during the quarter were
financed by borrowing of $257.0 billion, which
was more than sufficient to offset the financing
C-efficiency are a relatively high ratio of trade to GDP (presumably
because it is relatively easier to collect the VAT at the point of
import tan domestically); high literacy rates and the age of the
VAT..
0.0
10.0
20.0
30.0
40.0
50.0
60.0
70.0
80.0
Jun-
10
Sep-
10
Dec-
10
Mar
-11
Jun-
11
Sep-
11
Dec-
11
Mar
-12
Jun-
12
Sep-
12
Dec-
12
Mar
-13
Jun-
13
Sep-
13
Dec-
13
Mar
-14
Jun-
14
Sep-
14
Dec-
14
Mar
-15
Jun-
15
Sep-
15
C-Efficiency (Ratio Gct) - Excluding Arrears
C-Efficiency (Ratio GCT and SCT) - Excluding Arrears
Linear (C-Efficiency (Ratio Gct) - Excluding Arrears)
Linear (C-Efficiency (Ratio GCT and SCT) - Excluding Arrears)

- 42 -
Quarterly Monetary Policy Report
July to September 2015
requirement. Consequently, the Government built-
up balances of $44.6 billion during the quarter.
Loan inflows over the period reflected the receipts
of US$2.0 billion and US$130.0 million from
the international capital markets and the Inter-
American Development Bank, respectively, as well
as the issue of Treasury Bills. Amortization during
the review period mainly reflected the payment
of US$1.5 billion to Venezuela for the pay down
of outstanding PetroCaribe Development Fund
liabilities.
Box 4: Jamaica’s Macroeconomic Programme
under the EFF OverviewJamaica’s medium-term macroeconomic
programme is supported by a four-year Extended
Fund Facility (EFF) from the International Monetary
Fund (IMF). Performance under the programme
is assessed based on quarterly quantitative
performance criteria (QPCs) and structural
benchmarks over the period of the EFF. The
achievement of these targets unlocks financing
from multilateral financial institutions including
the IMF.6 7 This programme is aimed at creating
the conditions for sustained growth through a
significant improvement in the fiscal sustainability
as well as price and non-price competitiveness.
Since the start of the programme, both the fiscal
and monetary authorities have met the agreed
benchmarks and targets. In this regard, on 23
September 2015, the Executive Board of the IMF
6 The Executive Board of the IMF approved the four-year EFF
arrangement for Jamaica on 01 May 2013.
7 The EFF was established to provide assistance to countries: (i)
experiencing serious payments imbalances because of structural
impediments; or (ii) characterized by slow growth and an inherently
weak balance of payments position. This facility has a longer
engagement and repayment period compared to the previous
Stand-by Arrangement (SBA) with the IMF. https://www.imf.org/
external/np/exr/facts/eff.htm
This review coincided with the regular Article IV Consultation
conducted every two years.
concluded the ninth review of the programme and
confirmed the country’s successful performance.
This enabled the disbursement of SDR 28.32
million (approximately US$39.7 million).
Total disbursements under the EFF to end-
September 2015 amounted to SDR445.45 million
(approximately US$665.1 million).8
At end-September 2015, Jamaica completed the
tenth quarter of its macroeconomic programme.
All structural benchmarks were met. With regards
to the fiscal and monetary performance, it is
anticipated that Jamaica would have met all the
QPCs for the quarter (See Table 2).
8 Total disbursement agreed under the EFF is SDR 615.38
million (225 percent of quota).
Table 1: Structural Benchmarks
Benchmark Deadline Status
1 Finalize the transition of
retail repos to the trust-
based framework.
Aug-15 Met
2 Establish a new Cash
Management Unit in the
AGD, and transfer the
cash management
function (currently handled
by FPMU) to this new unit.
Sep-15 Met
3 Make the Banking Services
Act effective.
Sep-15 Met
Source: Bank of Jamaica

- 43 -
Quarterly Monetary Policy Report July to September 2015
Table 2: Quantitative Performance Targets (In billions of Jamaica dollars)
Dec-13 Sep-14 Dec-14 Mar-15 Jun-15 Sep-15
Dec-
15
Fiscal targets Stock Criteria Actual Criteria Actual Actual Actual Criteria Actual Criteria
Actual
Criteria
1.
Primary balance of
the central
government (floor) …. 38.4 43.6 66.0 66.8 121.0 117.2 17.0 20.7 40.0 50.8 60.8
2. Tax Revenues (floor) …. 166.0 169.0 260.0 258.6 384.0 370.9 88.0 95.8 185.0 195.1 280.0
3.
Overall balance of
the public sector
(floor) …. -30.2 -23.1 -37.0 -17.0 -11.6 1.7 -33.0 -7.9 -34.0 9.2 -40.2
4. Central government
direct debt (ceiling) 1672.0 23.2 99.9 92.4 67.9 90.6 77.8 4.5 -37.9 40.0 -11.0 47.0
5.
Central government
guaranteed debt
(ceiling) …. 2.7 1.1 0.1 0.1 -1.8 -1.8 2.0 n.a. 2.0 0.0 0.0
6.
Central government
accumulation of
domestic expenditure
arrears (ceiling) 21.6 0.0 n.a 0.0 -0.1 0.0 0.0 0.0 n.a. 0.0 -1.3 0.0
7.
Central government
accumulation of tax
refund arrears
(ceiling) 24.6 0.0 -0.9 0.0 -2.9 0.0 -1.4 0.0 -2.4 0.0 n.a 0.0
8.
Consolidated
government
accumulation of
external arrears
(ceiling) …. 0.0 0.0 0.0 0.0 0.0 0.0 0.0 0.0 0.0 0.0 0.0
9. Social spending
(floor) …. 8.9 n.a 14.8 18.2 21.7 n.a 4.5 n.a. 9.2 14.1 15.6
Monetary targets
10. Cumulative change in
NIR (floor) …. 187.3 1159.3 217.2 970.4 391.0 1290.0 380.2 125.7 -463.3 444.2 -338.0
11. NIR stock floor 1045.1 1232.3 2204.4 1262.2 2015.5 1436.0 2335.0 1425.2 2123.4 1534.4 2441.9 1659.7
12. Cumulative change in
NDA (ceiling) -7.6 -17.1 -130.7 -12.7 -98.0 -40.4 -139.8 -36.1 -22.2 56.1 -51.9 61.8
Source: Bank of Jamaica
Note: The NIR/NDA criteria reflect adjusted targets to account for any surplus or shortfall in programme loan disbursements from multilateral institutions (the IBRD, IDB,
and CDB) relative to the baseline projection.

- 44 -
Quarterly Monetary Policy Report
July to September 2015
Main Policy Considerations
Prices and Output
Headline inflation is projected to gradually increase
from 1.8 per cent at end-September 2015 to end
FY2015/16 within the target range of 5.5 per cent
to 7.5 per cent. This increase primarily reflects
projected higher prices for domestic agriculture
due to the impact of the recent dry conditions and
moderate increases in crude oil prices. However,
the forecasts for agricultural prices incorporates
some moderation in the latter part of the December
2015 quarter with price reversals expected in the
March 2016 quarter as the Island recovers from
the dry conditions. Over the next four quarters,
inflation is forecasted to remain relatively stable
within a range of 4.5 per cent - 6.5 per cent.
This forecast reflects the anticipated impact of
improvements in domestic demand conditions and
higher international commodity prices which should
result from improved global demand conditions
relative to projected supplies.
Output is forecasted to expand within the range
of 1.0 per cent to 2.0 per cent for FY2015/16,
reflecting an improvement relative to FY2014/15.
This improvement is predicated primarily on
projections for continued recovery in the economies
of Jamaica’s major trading partners. The recovery
in these economies coupled with the gains in price
competitiveness under the Programme should
manifest in improved net external demand for
the country. In addition to these external factors,
the Bank anticipates improvements in business
and consumer confidence, despite the declines
recorded in the September 2015 quarter.
The Bank’s assessment continues to suggest that
the recovery in output poses little upside risk to
the inflation outlook. This is in the context where
the additional growth should be facilitated by
improved productive processes and introduction
of additional capacity.9
Expectations
For September 2015, private sector expectations
for inflation 12 months ahead remain fairly well
anchored in single digit territory.10 In addition,
private sector expectations remain below the
Bank’s projection. In the context of overwhelming
evidence of reduced exchange rate pass-through
to inflation since the beginning of the economic
programme, it is anticipated that movements in the
exchange rate will gradually decline in importance
as a nominal anchor.11 The adjustments in inflation
expectations coupled with lower nominal interest
rates on Jamaica Dollar-denominated assets
should continue to create an environment of low,
9 See Inflation Section and Figures 1 and 6 for a more detailed
discussion on capacity conditions and inflation.
10 See BOX 1.1 BOJ’s Inflation Expectations Survey (IES).
11 The exchange rate pass-through refers to the proportion of
changes to the exchange rate that result in changes in domestic
prices. Studies by the BOJ have shown this to be close to 100.0
per cent in one year, prior to 1995. However, this level declined to
approximately 49.0 per cent by 2001. See McFarlane, L., (2002),
“Consumer Price Inflation and Exchange Rate Pass-Through in
Jamaica”. BOJ’s recent assessment suggests that the pass-
through has fallen below 30.0 per cent.
4.0 Implications for Monetary PolicyThe Bank projects that headline inflation will gradually increase during the last half of FY2015/16 to end
within the target range of 5.5 per cent to 7.5 per cent. This forecast reflects increases in the prices of
domestic agriculture due to the impact of the dry conditions which persisted during the September quarter
as well as higher crude oil prices. Over the next four quarters inflation is expected to be in the of 4.5 per
cent - 6.5 per cent. Stronger growth in output is projected for FY2015/16, primarily reflecting the positive
impact from net external demand and domestic competitiveness. Concurrently, GDP growth is expected
to accelerate over the next four quarters. In the context of the aforementioned, the Bank’s policy stance
will remain generally accommodative over the next four quarters.

- 45 -
July to September 2015Quarterly Monetary Policy Report
stable and positive real interest rates over the
near- to medium-term. This environment augurs
well for strong private capital inflows (see Box 4:
Monetary Policy Transmission Mechanism).
Financial Markets
Real rates in the private money market increased
marginally in the September 2015 quarter primarily
reflecting the fall in domestic inflation and relatively
stable interest rates following the Bank’s policy
action during the quarter. Given the relative stability
of inflation expectations, nominal interest rates are
expected to remain relatively low over the near-
to medium-term. This interest rate environment
should continue to bolster prospects for new
investments and overall output expansion.12
Monetary Targets
The Bank comfortably met the NIR and NDA targets
for the nine reviews since the beginning of the
Programme.13 It is the Bank’s assessment that
the targets for the September 2015 quarter were
again comfortably met. Further, the projections
suggest that growth in the monetary base will
remain consistent with the targets for the NIR and
NDA over the next four quarters. The continued
attainment of the NIR targets is supported by the
projected reduction in the current account deficit
and improvements in net private capital inflows.
12 Near-term refers to the next four quarters while medium-
term refers to the next one to five years.
13 The NDA is calculated as the difference between the stock of
base money and the NIR.
Figure 1: Monetary Transmission Process
Source: Allen, C and W. Robinson, 2005, “Monetary Policy Rules
and the Transmission Mechanism in Jamaica”, Money Affairs,
Volume XVIII
Box 5: Monetary Policy Transmission Mechanism
The monetary policy transmission mechanism
is the process through which adjustments in the
central bank’s policy rate induces changes in
the price and allocation of goods and services.
For most central banks the ultimate goal of the
transmission process is a desired level of inflation.
Studies on the transmission mechanism in Jamaica
have shown that the credit and the exchange rate
channels are the main conduits through which
policy affects inflation (see Figure 1). The credit
channel impacts inflation through aggregate
demand and the output gap. With respect to
the exchange rate, the impact has been through
imported inflation and changes in expectations
given the country’s openness.
Consistent with the findings for other countries,
the transmission process in Jamaica is long
lived. Allen and Robinson (2005) suggested that
changes in the policy rate have the largest impact
approximately three to four quarters after a rate
adjustment and that it could take three to four
years before the full impact dissipates. Given the
inherent lag in the transmission process, monetary
policy must be forward-looking to influence short-
term interest rates to deliver a desirable long-term
inflation outcome.

- 46 -
Quarterly Monetary Policy Report
July to September 2015
Monetary Policy Outlook
The Bank reduced its policy rate by 25 bps in
September 2015 quarter, the second adjustment
for the fiscal year. This adjustment was consistent
with the forecasted path for inflation over the
near-term as well as the downward trend in
inflation expectations (see Box 4: Monetary
Policy Transmission Mechanism). The outlook
over the next four quarters is consistent with the
maintenance of the accommodative monetary
stance. This policy posture is also contingent on
the continued strong fiscal performance.

- 47 -
Quarterly Monetary Policy Report July to September 2015
Additional Tables 1: INFLATION RATES 48
2: ALL JAMAICA INFLATION - Point-to-Point (June 2015) 49
3: BANK OF JAMAICA OPERATING TARGETS 50
4: MONETARY AGGREGATES 50
5: COMMERCIAL BANKS' SELECTED INTEREST RATES (%) 51
6: GOJ TREASURY BILL YIELDS 51
7: BANK OF JAMAICA OPEN MARKET INTEREST RATES 52
8: Placements and Maturities* in BOJ OMO Instruments 53
9: EXTERNAL TRADE - GOODS EXPORTS (f.o.b) 54
10: BALANCE OF PAYMENTS QUARTERLY SUMMARY 55
11: FOREIGN EXCHANGE SELLING RATES 56
12: BANK OF JAMAICA: NET INTERNATIONAL RESERVES 56
13: VALUE ADDED BY INDUSTRY AT CONSTANT (2007) PRICES (% CHANGE) 57
14: USD LONDON INTERBANK OFFER RATE–LIBOR (End- of-Period) 57
15: PRIME LENDING RATES (End-of-Period) 58
16: INTERNATIONAL EXCHANGE RATES 58
17: WORLD COMMODITY PRICES (Period Averages) 59
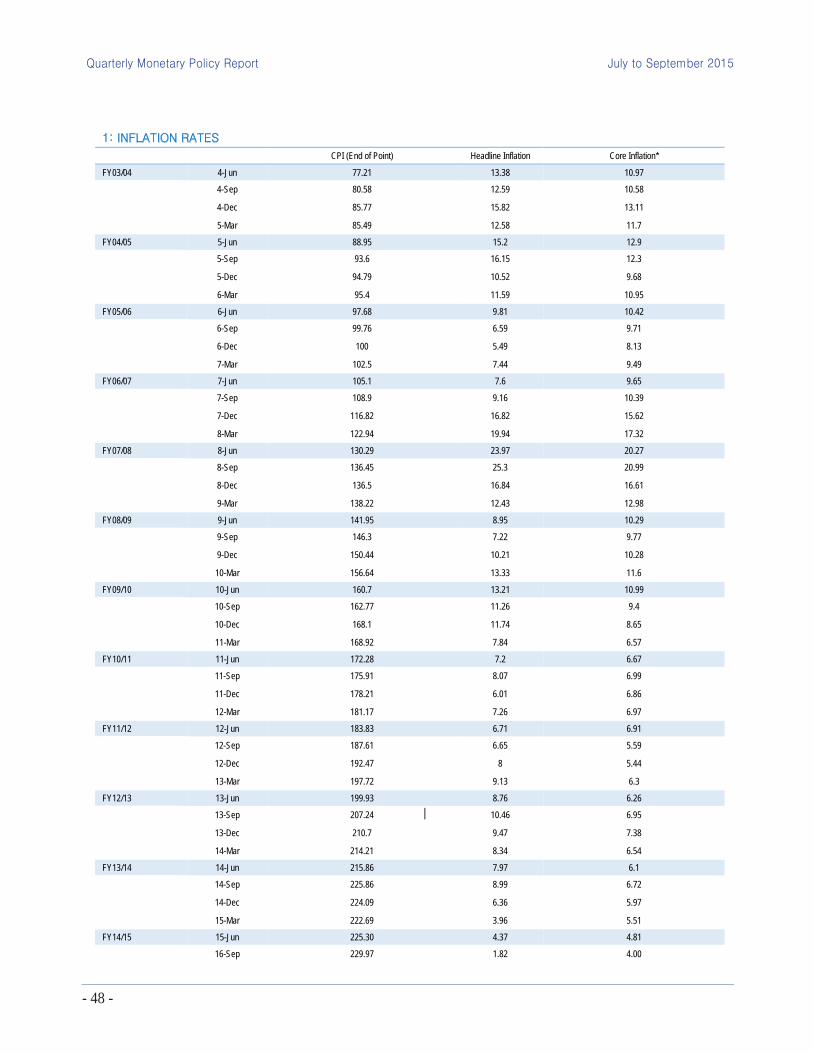
- 48 -
Quarterly Monetary Policy Report
July to September 2015
I
1: INFLATION RATES CPI (End of Point) Headline Inflation Core Inflation*
FY03/04 4-Jun 77.21 13.38 10.97
4-Sep 80.58 12.59 10.58
4-Dec 85.77 15.82 13.11
5-Mar 85.49 12.58 11.7
FY04/05 5-Jun 88.95 15.2 12.9
5-Sep 93.6 16.15 12.3
5-Dec 94.79 10.52 9.68
6-Mar 95.4 11.59 10.95
FY05/06 6-Jun 97.68 9.81 10.42
6-Sep 99.76 6.59 9.71
6-Dec 100 5.49 8.13
7-Mar 102.5 7.44 9.49
FY06/07 7-Jun 105.1 7.6 9.65
7-Sep 108.9 9.16 10.39
7-Dec 116.82 16.82 15.62
8-Mar 122.94 19.94 17.32
FY07/08 8-Jun 130.29 23.97 20.27
8-Sep 136.45 25.3 20.99
8-Dec 136.5 16.84 16.61
9-Mar 138.22 12.43 12.98
FY08/09 9-Jun 141.95 8.95 10.29
9-Sep 146.3 7.22 9.77
9-Dec 150.44 10.21 10.28
10-Mar 156.64 13.33 11.6
FY09/10 10-Jun 160.7 13.21 10.99
10-Sep 162.77 11.26 9.4
10-Dec 168.1 11.74 8.65
11-Mar 168.92 7.84 6.57
FY10/11 11-Jun 172.28 7.2 6.67
11-Sep 175.91 8.07 6.99
11-Dec 178.21 6.01 6.86
12-Mar 181.17 7.26 6.97
FY11/12 12-Jun 183.83 6.71 6.91
12-Sep 187.61 6.65 5.59
12-Dec 192.47 8 5.44
13-Mar 197.72 9.13 6.3
FY12/13 13-Jun 199.93 8.76 6.26
13-Sep 207.24 10.46 6.95
13-Dec 210.7 9.47 7.38
14-Mar 214.21 8.34 6.54
FY13/14 14-Jun 215.86 7.97 6.1
14-Sep 225.86 8.99 6.72
14-Dec 224.09 6.36 5.97
15-Mar 222.69 3.96 5.51
FY14/15 15-Jun 225.30 4.37 4.81
16-Sep 229.97 1.82 4.00
* Core inflation is measured as headline inflation excluding agriculture and fuel related components of the CPI Basket (CPI‐AF)

- 49 -
Quarterly Monetary Policy Report July to September 2015
2: ALL JAMAICA INFLATION - Point-to-Point (September 2015)
Divisions, Classes and Groups Weight (%) Inflation (%) Weighted Inflation Contribution
FOOD & NON-ALCOHOLIC BEVERAGES 37.45 1.14 0.43 129.24
Food 35.1 1.19 0.42 126.45
Bread and Cereals 6.1 0.07 0.00 1.29
Meat 7.66 0.15 0.01 3.54
Fish and Seafood 5.33 0.11 0.01 1.82
Milk, Cheese and Eggs 3.11 0.11 0.00 1.04
Oils and Fats 1.64 0.11 0.00 0.57
Fruit 1.14 0.88 0.01 3.04
Vegetables and Starchy Foods 6.85 4.20 0.29 86.87
Sugar, Jam, Honey, Chocolate and Confectionery 1.72 0.15 0.00 0.76
Food Products n.e.c. 1.55 0.51 0.01 2.39
Non-Alcoholic Beverages 2.35 0.23 0.01 1.66
Coffee, Tea and Cocoa 0.66 0.34 0.00 0.67
Mineral Waters, Soft Drinks, Fruit and Vegetable Juices 1.69 0.19 0.00 0.96
ALCOHOLIC BEVERAGES AND TOBACCO 1.38 0.14 0.00 0.60
CLOTHING AND FOOTWEAR 3.33 0.64 0.02 6.39
Clothing 2.12 0.37 0.01 2.39
Footwear 1.22 1.04 0.01 3.85
HOUSING, WATER, ELECTRICITY, GAS AND OTHER FUELS 12.76 -1.15 -0.15 -44.36
Rentals for Housing 3.52 0.00 0.00 0.00
Maintenance and Repair of Dwelling 0.8 0.20 0.00 0.49
Water Supply and Miscellaneous Services Related to the Dwelling 1.32 -1.59 -0.02 -6.33
Electricity, Gas and Other Fuels 7.12 -1.84 -0.13 -39.62 FURNISHINGS, HOUSEHOLD EQUIPMENT AND ROUTINE HOUSEHOLD MAINTENANCE 4.93 0.13 0.01 1.87
Furniture and Furnishings 0.69 0.10 0.00 0.20
Household Textiles 0.32 0.17 0.00 0.16
Household Appliances 0.56 0.38 0.00 0.64
Glassware, Tableware and Household Utensils 0.05 0.20 0.00 0.03
Tools and Equipment for House and Garden 0.15 0.22 0.00 0.10
Goods and Services for Routine Household Maintenance 3.16 0.08 0.00 0.74
HEALTH 3.29 0.15 0.01 1.51
Medical Products, Appliances and Equipment 1.22 0.16 0 0.59
Health Services 2.07 0.15 0 0.92
TRANSPORT 12.82 -1.04 -0.13 -40.31
COMMUNICATION 3.99 0 0 0
RECREATION AND CULTURE 3.36 0.53 0.02 5.35
EDUCATION 2.14 5.27 0.11 34.08
RESTAURANTS & ACCOMMODATION SERVICES 6.19 0.02 0 0.36
MISCELLANEOUS GOODS AND SERVICES 8.37 0.21 0.02 5.27
ALL DIVISIONS 100 0.43 0.33 100

- 50 -
Quarterly Monetary Policy Report
July to September 2015
4: MONETARY AGGREGATES
BASE M1J M1* M2J M2* M3J M3*
FY10/11 Jun-10 77757.80 93074.23 93074.23 218702.11 332339.11 306741.21 420378.21
Sep-10 74230.90 95444.97 95444.97 221386.83 328598.33 311288.97 418500.47
Dec-10 85093.00 103252.10 103252.10 230232.17 337664.44 321728.87 429161.14
Mar-11 78919.19 97448.70 97448.70 225681.98 332828.17 319837.08 426983.27
FY11/12 Jun-11 80560.55 102219.91 102219.91 232910.73 341652.12 329909.45 438650.84
Sep-11 80479.50 97967.02 97967.02 227561.92 332330.13 325013.24 429781.45
Dec-11 91710.12 112757.18 112757.18 245020.02 351418.54 355367.82 461766.34
Mar-12 83696.70 103826.70 103826.70 236177.27 349882.92 348301.96 462007.61
FY12/13 Jun-12 84337.37 104266.47 104266.47 236397.42 351510.21 338191.88 453304.66
Sep-12 85193.86 105164.94 105164.94 237685.09 351396.29 340031.63 453742.83
Dec-12 97648.46 117908.77 117908.77 253848.71 383195.99 357503.67 486850.96
Mar-13 91294.45 113240.38 113240.38 252128.71 396423.90 355217.29 499512.48
FY13/14 Jun-13 90221.88 110381.42 110381.42 250702.54 397899.09 354684.76 501881.32
Sep-13 92083.29 113684.42 113684.42 259771.42 409003.99 369324.33 518556.90
Dec-13 103633.38 122884.67 122884.67 267936.36 418628.15 374695.17 525386.96
Mar-14* 94428.02 119019.10 119019.10 262328.5 422293.20 373800.60 533765.30
FY14/15 Jun-14* 95944.45 114410.60 114410.60 256212.30 418589.90 369666.90 532044.50
Sept-14 96249.59 114321.90 114321.90 255533.40 417063.70 371626.90 533157.20
Dec-14 108882.53 132667.25 132667.25 276864.33 446540.66 396051.52 565727.85
Mar-15 101081.30 127331.43 127331.43 273286.91 444356.87 398263.53 569333.49
FY15/16 Jun-15 104475.6 142761.90 142761.90 292242.71 471576.37 422968.84 602302.50
Sept-15 107998.6 137336.80 137336.80 288215.89 475790.09 421278.58 608852.79
3: BANK OF JAMAICA OPERATING TARGETS
Actual Actual Actual Actual Actual Actual Actual Actual Actual
Sep-13 Dec-13 Mar-14 Jun-14 Sept-14 Dec-14 Mar-15 Jun-15 Sept-14
Net International Reserves (US$) 910.1 1,047.8 1,303.6 1,376.1 2,200.6 2,002.0 2,293.7 2,116.5 2,441.9
NET INT'L RESERVES (J$) 85,681.0 111,468.2 138,679.5 146,393.0 234,096.3 212,969.6 244,001.7 225,154.3 279,986.1
Assets 161,309.8 193,351.8 217,929.9 214,518.3 288,848.3 263,172.4 286,134.5 269,914.9 331,967.0
Liabilities -75,628.9 -81,883.6 -79,250.3 -68,125.3 -54,752.0 -50,202.8 -42,132.9 -44,760.6 -51,433.1
NET DOMESTIC ASSETS 6,402.3 -7,834.8 -44,251.5 -50,448.6 -137,846.8 -104,087.0 -142,920.4 -120,678.7 -171,987.5
-Net Claims on Public Sector 162,943.8 157,750.3 158,974.9 192,366.7 110,474.8 142,209.3 95,157.1 140,317.0 101,215.6
-Net Credit to Banks -21,124.3 -21,500.4 -21,390.8 -22,702.7 -22,606.0 -23,210.1 -23,886.3 -24,229.3 -24,897.5
-Open Market Operations -53,306.5 -49,948.2 -30,533.2 -40,570.1 -35,206.8 -25,480.8 -38,871.7 -51,609.4 -48,743.7
-Other -82,110.6 -94,136.5 -151,302.5 -
179,542.5 -190,508.7 -197,605.5 -194,311.1 -202,681.7 -199,561.8
MONETARY BASE 92,083.3 103,633.4 94,428.0 95,944.4 96,249.6 108,882.5 101,081.3 104,475.6 107,998.6
- Currency Issue 58,183.1 69,801.7 61,110.2 62,025.3 61,573.4 74,937.1 66,356.3 67,916.9 70,635.1
- Cash Reserve 32,689.2 33,593.3 32,275.6 32,914.5 34,271.2 33,385.0 34,566.9 35,852.7 36,680.4
- Current Account 1,211.0 238.4 1,042.2 1,004.6 405.0 260.5 158.0 706.1 683.2
GROWTH IN MONETARY BASE [F-Y-T-D] 0.9 13.5 3.4 1.6 1.9 15.3 7.0 3.4 6.8
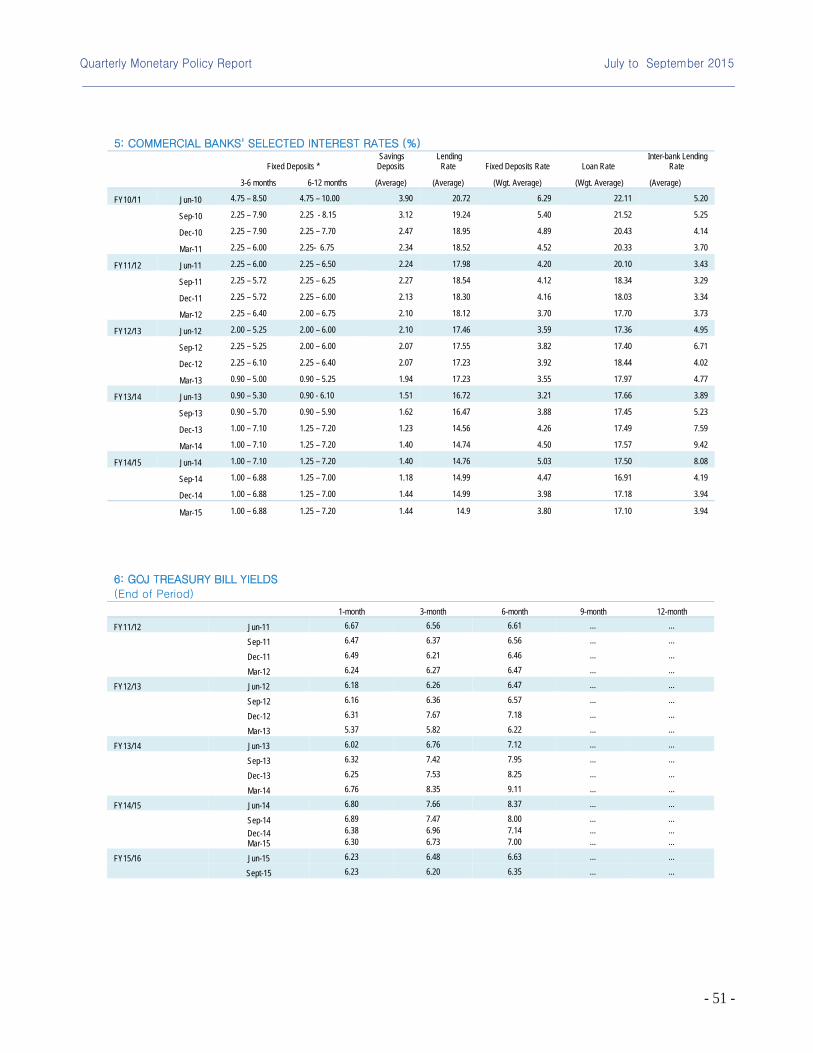
- 51 -
Quarterly Monetary Policy Report July to September 2015
5: COMMERCIAL BANKS' SELECTED INTEREST RATES (%)
Fixed Deposits * Savings Deposits
Lending Rate Fixed Deposits Rate Loan Rate
Inter-bank Lending Rate
3-6 months 6-12 months (Average) (Average) (Wgt. Average) (Wgt. Average) (Average)
FY10/11 Jun-10 4.75 – 8.50 4.75 – 10.00 3.90 20.72 6.29 22.11 5.20
Sep-10 2.25 – 7.90 2.25 - 8.15 3.12 19.24 5.40 21.52 5.25
Dec-10 2.25 – 7.90 2.25 – 7.70 2.47 18.95 4.89 20.43 4.14
Mar-11 2.25 – 6.00 2.25- 6.75 2.34 18.52 4.52 20.33 3.70
FY11/12 Jun-11 2.25 – 6.00 2.25 – 6.50 2.24 17.98 4.20 20.10 3.43
Sep-11 2.25 – 5.72 2.25 – 6.25 2.27 18.54 4.12 18.34 3.29
Dec-11 2.25 – 5.72 2.25 – 6.00 2.13 18.30 4.16 18.03 3.34
Mar-12 2.25 – 6.40 2.00 – 6.75 2.10 18.12 3.70 17.70 3.73
FY12/13 Jun-12 2.00 – 5.25 2.00 – 6.00 2.10 17.46 3.59 17.36 4.95
Sep-12 2.25 – 5.25 2.00 – 6.00 2.07 17.55 3.82 17.40 6.71
Dec-12 2.25 – 6.10 2.25 – 6.40 2.07 17.23 3.92 18.44 4.02
Mar-13 0.90 – 5.00 0.90 – 5.25 1.94 17.23 3.55 17.97 4.77
FY13/14 Jun-13 0.90 – 5.30 0.90 - 6.10 1.51 16.72 3.21 17.66 3.89
Sep-13 0.90 – 5.70 0.90 – 5.90 1.62 16.47 3.88 17.45 5.23
Dec-13 1.00 – 7.10 1.25 – 7.20 1.23 14.56 4.26 17.49 7.59
Mar-14 1.00 – 7.10 1.25 – 7.20 1.40 14.74 4.50 17.57 9.42
FY14/15 Jun-14 1.00 – 7.10 1.25 – 7.20 1.40 14.76 5.03 17.50 8.08
Sep-14 1.00 – 6.88 1.25 – 7.00 1.18 14.99 4.47 16.91 4.19
Dec-14 1.00 – 6.88 1.25 – 7.00 1.44 14.99 3.98 17.18 3.94
Mar-15 1.00 – 6.88 1.25 – 7.20 1.44 14.9 3.80 17.10 3.94
6: GOJ TREASURY BILL YIELDS
(End of Period)
1-month 3-month 6-month 9-month 12-month
FY11/12 Jun-11 6.67 6.56 6.61 … …
Sep-11 6.47 6.37 6.56 … …
Dec-11 6.49 6.21 6.46 … …
Mar-12 6.24 6.27 6.47 … …
FY12/13 Jun-12 6.18 6.26 6.47 … …
Sep-12 6.16 6.36 6.57 … …
Dec-12 6.31 7.67 7.18 … …
Mar-13 5.37 5.82 6.22 … …
FY13/14 Jun-13 6.02 6.76 7.12 … …
Sep-13 6.32 7.42 7.95 … …
Dec-13 6.25 7.53 8.25 … …
Mar-14 6.76 8.35 9.11 … …
FY14/15 Jun-14 6.80 7.66 8.37 … …
Sep-14 6.89 7.47 8.00 … …Dec-14Mar-15
6.38 6.30
6.96 6.73
7.14 7.00
……
……
FY15/16 Jun-15 6.23 6.48 6.63 … …
Sept-15 6.23 6.20 6.35 … …
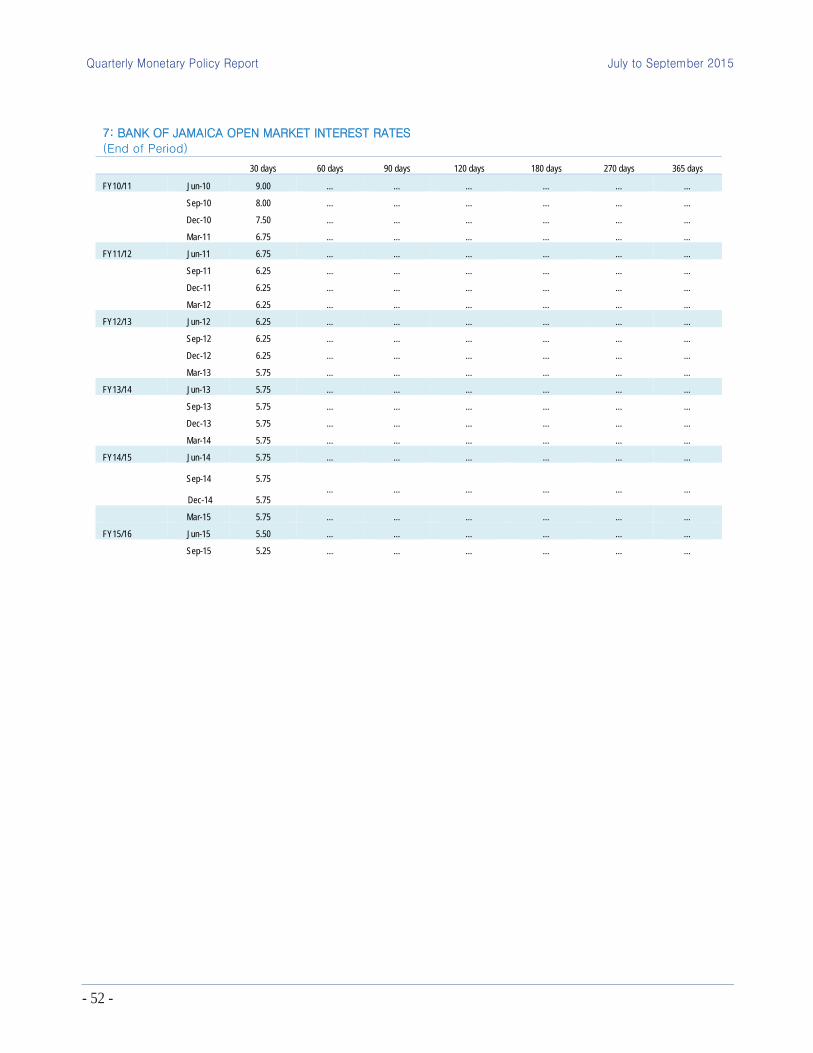
- 52 -
Quarterly Monetary Policy Report
July to September 2015
7: BANK OF JAMAICA OPEN MARKET INTEREST RATES
(End of Period) 30 days 60 days 90 days 120 days 180 days 270 days 365 days
FY10/11 Jun-10 9.00 … … … … … …
Sep-10 8.00 … … … … … …
Dec-10 7.50 … … … … … …
Mar-11 6.75 … … … … … …
FY11/12 Jun-11 6.75 … … … … … …
Sep-11 6.25 … … … … … …
Dec-11 6.25 … … … … … …
Mar-12 6.25 … … … … … …
FY12/13 Jun-12 6.25 … … … … … …
Sep-12 6.25 … … … … … …
Dec-12 6.25 … … … … … …
Mar-13 5.75 … … … … … …
FY13/14 Jun-13 5.75 … … … … … …
Sep-13 5.75 … … … … … …
Dec-13 5.75 … … … … … …
Mar-14 5.75 … … … … … …
FY14/15 Jun-14 5.75 … … … … … …
Sep-14 5.75
Dec-14 5.75 … … … … … …
Mar-15 5.75 … … … … … …
FY15/16 Jun-15 5.50 … … … … … …
Sep-15 5.25 … … … … … …

- 53 -
Quarterly Monetary Policy Report July to September 2015
8: Placements and Maturities* in BOJ OMO Instruments
April – June 2015 July – September 2015
Maturities Placements Average Maturities Placements Average
(J$BN) (J$BN) Yield (%) (J$BN) (J$BN) Yield (%)
19-day 0.0 0.0 0.0 0.0 0.0 0.0
30-day 48.3 47.3 5.63 45.0 46.3 5.63
182-day VR CD 0.0 0.0 0.0 0.0 0.0 0.0
275-day VR CD 0.0 0.0 0.0 0.0 0.0 0.0
365-day VR CD 6.0 3.0 6.82 6.4 1.2 6.82
548-day VR CD 0.0 0.0 0.4 0.0
729-day VR CD 0.0 3.8 7.25 0.0 1.0 7.25
182-day FR USD 0.0 0.0 0.0 0.0
Indexed Bond 0.0 0.0 0.0 0.0
365-day FR USD 0.0 0.0 0.0 0.0
Indexed Bond 0.0 0.0 0.0 0.2
Repos 0.0 19.2 8.9 0.0
FX (Trading Room) 66.8 34.7 63.7 51.53
Other 0.0 0.0 0.0 0.0
Net Injection (ALL Operations) 88.0 107.9 103.0 119.4
Maturities Placements Average Maturities Placements Average
(US$MN) (US$MN) Yield (%) (US$MN) (US$MN) Yield (%)
1-year FR USD CD 0.0 19.12 -
2-year FR USD CD 0.0 0.0 - 0.0 0.0 -
3-year FR USD CD 21.6 0.0 3.08 74.0 0.0 3.08
4-year FR USD CD 0.0 0.0 - 2.5 0.0 -
4.5-year FR USD CD 0.00 0.00 0.00 0.00 97.3 -
5-year FR USD CD 10.6 0.0 4.14 10.6 0.0 3.95
7-year FR USD CD 22.6 0.0 4.67 8.7 0.0 4.57
3-year FR CD# 0.00 0.00 - 0.00 0.00 -
TOTAL 54.8 0.0 85.8 116.5
*Excludes overnight transactions

- 54 -
Quarterly Monetary Policy Report
July to September 2015
9: EXTERNAL TRADE - GOODS EXPORTS (f.o.b)
(Flows - US$MN)
Bauxite Alumina Sugar Bananas Other
Traditional Non-Traditional Other Total
Goods Exports
FY10/11 133.2 446.7 47.9 0.0 76.6 448.2 227.5 1380.1 Jun-10 31.6 83.6 13.3 0.0 22.4 109.5 49.1 309.4 Sep-10 37.0 87.1 7.7 0.0 22.4 110.7 54.7 319.7 Dec-10 29.6 146.0 0.0 0.0 13.5 101.0 53.3 343.4 Mar-11 34.9 130.0 26.9 0.0 18.3 127.0 70.4 407.6
FY11/12 138.3 578.8 91.5 0.1 76.5 509.3 275.3 1669.7 Jun-11 33.5 163.2 28.9 0.0 22.7 134.2 66.9 449.4 Sep-11 38.7 141.8 6.4 0.0 19.9 117.1 73.9 397.8 Dec-11 34.8 145.8 0.0 0.0 14.7 111.0 62.7 368.9 Mar-12 31.3 128.0 56.2 0.0 19.2 147.0 71.8 453.6
FY12/13 131.8 516.7 54.7 0.1 80.8 707.1 252.9 1744.1 Jun-12 31.8 132.4 37.5 0.0 22.3 126.8 66.7 417.5 Sep-12 34.7 130.7 0.5 0.0 20.4 162.3 58.6 407.1 Dec-12 32.4 117.2 0.0 0.0 19.3 223.5 57.9 450.3 Mar-13 33.0 136.4 16.8 0.0 18.8 194.5 69.7 469.2
FY13/14 125.0 526.1 53.7 0.1 70.9 455.8 260.3 1491.9 Jun-13 31.6 127.0 36.3 0.0 23.5 104.0 62.4 384.8 Sep-13 30.6 117.6 0.0 0.0 18.5 120.3 75.8 362.8 Dec-13 32.8 142.7 0.0 0.0 13.8 118.7 55.4 363.4 Mar-14 30.0 138.7 17.4 0.0 15.1 112.9 66.8 381.0
FY14/15 Jun-14 34.4 108.6 26.5 0.0 21.0 98.9 67.9 355.7
Sep-14 33.4 151.6 11.9 0.0 16.4 101.0 70.8 385.1 Dec-14 33.4 130.4 0.0 0.0 12.3 108.8 58.7 343.8 Mar-15 35.3 132.3 17.1 0.1 6.8 101.4 45.1 338.1
FY15/16
Jun-15 33.8 139.5 18.3 0.1 4.8 76.5 44.5 317.4

- 55 -
Quarterly Monetary Policy Report July to September 2015
10: BALANCE OF PAYMENTS QUARTERLY SUMMARY
(US$MN)
13-Sep 13-Dec 14-Mar 14-Jun 14-Sep 14-Dec 15-Mar 15-Jun
1. Current Account -327.1 -494.1 -127.1 -270.8 -337.3 -343.0 40.7 -85.5
A. Goods Balance -921.9 -1108.8 -873.1 -912.0 -949.6 -968.2 -772.4 -832.0
Exports (f.o.b) 362.8 363.5 396.0 370.3 385.1 343.8 336.5 317.4
Imports (f.o.b) 1284.7 1472.2 1269.1 1282.3 1334.7 1312.0 1108.9 1149.4
B. Services Balance 94.9 98.6 230.8 158.9 114.0 136.6 309.2 224.1
Transportation -167.6 -185.5 -200.8 -163.0 -169.1 -163.3 -140.4 -146.5
Travel 418.7 437.7 595.5 504.9 458.8 500.6 640.5 524.7
Other Services -156.2 -153.6 -163.9 -183.1 -175.7 -200.7 -190.8 -154.1
Goods & Services Balance -827.0 -1010.2 -642.3 -753.1 -835.6 -831.6 -463.2 -608.0
C. Income -43.4 -98.1 -40.7 -79.0 -85.7 -101.5 -40.2 -79.2
Compensation of employees 15.3 15.9 7.3 5.3 19.9 35.3 12.2 4.9
Investment Income -58.8 -114.0 -47.9 -84.3 -105.5 -136.8 -52.4 -84.1
D. Current Transfers 543.3 614.2 555.9 561.3 584.0 590.1 544.1 601.7
General Government 57.9 98.1 63.3 45.5 59.4 52.8 42.8 54.2
Other Sectors 485.4 516.1 492.6 515.8 524.5 537.3 501.3 547.5
2. Capital & Financial Account 339.8 330.5 403.9 375.1 -32.8 326.5 311.1 137.9
A. Capital Account -7.2 -5.6 -7.9 -6.9 -6.1 -6.7 0.8 -5.5
Capital Transfers -7.2 -5.6 -7.9 -6.9 -6.1 -6.7 0.8 -5.5
General Government 0.5 1.7 0.6 1.4 1.5 0.6 9.3 2.8
Other Sectors -7.6 -7.2 -8.5 -8.3 -7.6 -7.2 -8.5 -8.3 Acq/disp of non-produced non- fin assets 0.0 0.0 0.0 0.0 0.0 0.0 0.0 0.0
B. Financial Account 347.0 336.0 411.8 382.0 -26.7 333.2 310.3 143.4
Direct Investment 147.0 138.2 112.5 154.7 120.9 127.4 146.0 107.8
Portfolio Investment 50.1 32.2 51.6 12.1 15.3 15.7 51.6 12.1
Other official investment 67.8 208.4 147.9 170.9 787.5 -222.7 23.7 -255.9
Other private Investment -11.0 94.9 355.6 116.8 -125.9 213.4 381.6 102.1
Reserves 93.1 -137.7 -255.8 -72.5 -824.4 199.5 -292.6 177.2
Errors & Omissions -12.7 163.6 -276.7 -104.4 370.1 16.5 -351.8 -52.4

- 56 -
Quarterly Monetary Policy Report
July to September 2015
12: BANK OF JAMAICA: NET INTERNATIONAL RESERVES
(End-of-Point) (US$MN) (US$MN) (US$MN) Weeks of Imports
Gross Foreign
Assets Gross Foreign Liabilities International Reserves (Net) Goods Goods & Services
FY10/11 Jun-10 2,526.70 730.90 1,795.80 25.40 18.60 Sep-10 2,789.70 816.00 1,973.70 29.60 21.50 Dec-10 2,979.20 807.80 2,171.40 31.90 23.20 Mar-11 3,434.70 881.50 2,553.20 37.20 26.70 FY11/12 Jun-11 3,156.70 889.60 2,267.10 28.50 21.40 Sep-11 2,949.20 868.60 2,080.60 27.80 20.70 Dec-11 2,820.40 854.30 1,966.10 25.50 19.20 Mar-12 2,638.90 861.80 1,777.10 23.20 17.50 FY12/13 Jun-12 2,385.10 844.70 1,540.40 21.10 15.90 Sep-12 2,115.90 858.10 1,257.80 18.90 14.10 Dec-12 1,980.80 855.20 1,125.60 17.70 13.20 Mar-13 1,718.40 834.10 884.30 15.40 11.50 FY13/14 Jun-13 1,881.10 877.90 1,003.20 16.70 12.60 Sep-13 1,713.50 803.40 910.10 15.80 11.90 Dec-13 1,817.60 769.70 1,047.90 17.30 12.80 Mar-14 2,048.60 745.00 1,303.60 19.10 14.40 FY14/15 Jun-14 2,016.53 640.40 1,376.13 20.19 14.57 Sep-14 2,715.25 514.68 2,200.57 27.79 19.66
Dec-14 Mar-15
2,473.01 2,689.74
471.92 396.06
2,001.09 2,293.68
26.31 28.61
18.41 20.02
FY15/16 Jun-15 2,537.27 420.76 2,116.51 29.00 19.83 Sep-15 2,890.45 448.57 2441.88 32.34 22.39
11: FOREIGN EXCHANGE SELLING RATES
(J$ per unit of foreign currency - end of period)
US$ Can$ GB ₤ FY10/11 Jun-10 89.5100 88.0600 135.0700 Sep-10 86.0200 82.2600 128.5800 Dec-10 86.2500 83.8400 135.8700 Mar-11 85.8600 85.3400 133.7400 FY11/12 Jun-11 85.9100 88.6100 137.7700 Sep-11 86.3000 83.3100 134.6900 Dec-11 86.6000 84.2000 134.4400 Mar-12 87.3000 87.6500 139.2800 FY12/13 Jun-12 88.7000 86.7100 138.6600 Sep-12 89.9300 91.4200 145.3900 Dec-12 92.9800 93.3100 152.6400 Mar-13 98.8900 97.9900 151.9000 FY13/14 Jun-13 101.3800 96.7000 154.4800 Sep-13 103.6000 100.7100 167.1600 Dec-13 106.3800 99.7200 175.8400 Mar-14 109.5700 98.9300 181.7700 FY14/15 Jun-14 112.2022 103.1802 191.8988 Sep-14 112.6662 101.0142 180.2393
Dec-14 Mar-15
114.6607 115.0435
97.6896 90.6202
177.6759 169.9738
FY15/16 Jun-15 116.9832 93.8399 183.7774 Sep-15 119.0553 88.6177 180.1478

- 57 -
Quarterly Monetary Policy Report July to September 2015
13: VALUE ADDED BY INDUSTRY AT CONSTANT (2007) PRICES (% CHANGE)
December 2012 – December 2014 (Seasonally Unadjusted)
(Percentage Change (%) Over the Corresponding Quarter of Previous Year)
Dec-12 Mar-13 Jun-13 Sep-13 Dec-13 Mar-14 Jun-14 Sep-14 Dec-14
Total Value Added at Basic Prices -1.2 -1.2 -0.2 0.4 1.8 1.6 1.9 -1.4 -0.4
Agriculture, Forestry & Fishing -8.4 -11.7 -6.5 5.4 13.2 17.3 17.1 -22.9 -12.8
Mining & Quarrying -10.3 -9.6 5.2 5.0 11.5 8.5 -0.3 -2.0 -2.1
Manufacturing -1.8 -0.9 0.4 -0.6 -1.1 -1.1 4.2 -5.9 -1.7
Food, Beverages & Tobacco -0.8 0.2 -0.3 -0.7 2.6 -1.0 3.4 1.1 -0.7
Other Manufacturing -2.7 -2.4 1.5 -0.6 -4.5 -1.3 5.4 -14.5 -2.8
Construction & Installation -3.3 0.4 2.2 2.2 2.8 1.1 1.2 1.7 1.3
Electricity & Water -3.8 -3.0 -2.0 -3.6 1.0 0.5 -1.6 -1.1 -2.4 Wholesale & Retail Trade; Repairs; Installation Of Machinery -1.9 0.1 -0.5 -0.1 0.1 0.1 0.1 0.4 0.3
Hotels and Restaurants -1.3 -2.0 0.7 0.9 5.9 0.2 2.3 4.1 5.6
Transport, Storage & Communication 2.0 0.9 -0.7 0.4 1.1 0.7 1.0 1.1 1.6
Finance & Insurance Services 0.7 0.3 0.5 0.2 0.4 0.1 0.2 0.2 0.4
Real Estate & Business Services 0.3 0.3 0.3 0.3 0.4 0.6 0.6 0.4 0.5
Government Services 0.1 -0.1 -0.3 -0.3 -0.2 -0.2 -0.2 -0.2 -0.2
Other Services 0.3 -0.3 1.0 -0.8 0.8 0.6 1.1 1.6 1.5 Less Financial Intermediation Services Indirectly Measured (FISIM) -3.4 -2.2 -0.1 0.2 0.5 -0.2 -0.8 -0.6 0.5
14: USD LONDON INTERBANK OFFER RATE–LIBOR (End- of-Period)
1-month 3-month 6-month 12-month FY10/11 Jun-10 0.3484 0.5339 0.7525 1.1731
Sep-10 0.2563 0.2900 0.4625 0.7778 Dec-10 0.2606 0.3028 0.4559 0.7809 Mar-11 0.2435 0.3030 0.4595 0.7825
FY11/12 Jun-11 0.1856 0.2458 0.3978 0.7335 Sep-11 0.2394 0.3743 0.5578 0.8649 Dec-11 0.2953 4.9075 0.8085 1.1281 Mar-12 0.2413 0.4682 0.7334 1.0485
FY12/13 Jun-12 0.2458 0.4606 0.7344 1.0680 Sep-12 0.2143 0.3585 0.6359 0.9730 Dec-12 0.2087 0.3060 0.5083 0.8435 Mar-13 0.2037 0.2826 0.4449 0.7315
FY13/14 Jun-13 0.1958 0.2731 0.4144 0.6902 Sep-13 0.1789 0.2489 0.3685 0.6294 Dec-13 0.1677 0.2461 0.3480 0.5831 Mar-14 0.1520 0.2306 0.3289 0.5581
FY14/15 Jun-14 0.1552 0.2307 0.3268 0.5451 Sep-14 0.1565 0.2351 0.3304 0.5786 Dec-14 0.1713 0.2556 0.3628 0.6288
Mar-15 0.1763 0.2708 0.4007 0.6942 FY15/16 Jun-15 0.1865 0.2832 0.4449 0.7715 Sep-15 0.1930 0.325 0.534 0.8511

- 58 -
Quarterly Monetary Policy Report
July to September 2015
16: INTERNATIONAL EXCHANGE RATES
Sterling vs. US$ Canadian $ vs. US$ Yen vs. US$ Euro vs. US$
FY10/11 Jun-10 0.6691 1.0606 88.5310 0.8137
Sep-10 0.6358 1.0298 83.5200 0.7353
Dec-10 0.6411 0.9946 81.1260 0.7468
Mar-11 0.6232 0.9718 82.7770 0.7051
FY11/12 Jun-11 0.6230 0.9634 80.5600 0.6896
Sep-11 0.6417 1.0503 77.0600 0.7468
Dec-11 0.6435 1.0213 76.9100 0.7714
Mar-12 0.6256 0.9991 82.4340 0.7500
FY12/13 Jun-12 0.6376 1.0191 79.8040 0.7894
Sep-12 0.6199 0.9837 77.9480 0.7779
Dec-12 0.6150 0.9949 86.6630 0.7584
Mar-13 0.6588 1.0156 94.0370 0.7787
FY13/14 Jun-13 0.6575 1.0512 99.1700 0.7687
Sep-13 0.6181 1.0285 98.3270 0.7389
Dec-13 0.6034 1.0636 105.2030 0.7258
Mar-14 0.6012 1.1053 103.0100 0.7259
FY14/15 Jun-14 0.5846 1.0676 101.2900 0.7305
Sep-14 0.6168 1.1196 109.6491 0.7917
Dec-14 0.6418 1.1614 119.8035 0.8264 Mar-15 0.6737 1.2679 119.9472 0.9321
FY15/16 Jun-15 0.6737 1.2483 122.1001 0.8966
Sep-15 0.6609 1.3394 119.6745 0.8943
15: PRIME LENDING RATES (End-of-Period)
EURO-ZONE UNITED STATES UNITED KINGDOM Repo rate Fed Funds Rate Discount Rate Prime Rate Repo rate FY10/11 Jun-10 1.00 0 – 0.25 0.75 3.25 0.50 Sep-10 1.00 0 – 0.25 0.75 3.25 0.50 Dec-10 1.00 0 – 0.25 0.75 3.25 0.50 Mar-11 1.00 0 - 0.25 0.75 3.25 0.50 FY11/12 Jun-11 1.25 0 – 0.25 0.75 3.25 0.50 Sep-11 1.50 0 – 0.25 0.75 3.25 0.50 Dec-11 1.00 0 – 0.25 0.75 3.25 0.50 Mar-12 1.00 0 - 0.25 0.75 3.25 0.50 FY12/13 Jun-12 1.00 0 - 0.25 0.75 3.25 0.50 Sep-12 0.75 0 - 0.25 0.75 3.25 0.50 Dec-12 0.75 0 - 0.25 0.75 3.25 0.50 Mar-13 0.75 0 - 0.25 0.75 3.25 0.50 FY13/14 Jun-13 0.50 0 - 0.25 0.75 3.25 0.50 Sep-13 0.50 0 - 0.25 0.75 3.25 0.50 Dec-13 0.25 0 - 0.25 0.75 3.25 0.50 Mar-14 0.25 0 - 0.25 0.75 3.25 0.50 FY14/15 Jun-14 0.15 0 - 0.25 0.75 3.25 0.50 Sep-14 0.05 0 - 0.25 0.75 3.25 0.50 Dec-14 0.05 0 - 0.25 0.75 3.25 0.50 Mar-15 0.05 0 - 0.25 0.75 3.25 0.50
FY15/16 Jun-15 0.05 0 - 0.25 0.75 3.25 0.50
Sep-15 0.05 0 - 0.25 0.75 3.25 0.50

- 59 -
Quarterly Monetary Policy Report July to September 2015
17: WORLD COMMODITY PRICES (Period Averages)
CRUDE OIL PRICES FOOD
North Sea Brent
(US$/barrel – f.o.b.) West Texas Intermediate
(US$/barrel – f.o.b.) Wheat (US$/mt, Average Winter)
Coffee (USc/kg, Arabica brand)
FY10/11 Jun-10 78.69 78.03 182.14 392.00 Sep-10 76.41 76.20 245.66 468.49 Dec-10 86.80 85.17 284.25 513.85 Mar-11 104.90 94.10 325.63 620.03 FY11/12 Jun-11 117.10 102.56 320.60 636.54 Sep-11 112.48 89.76 293.06 597.37 Dec-11 109.29 94.06 265.07 536.18 Mar-12 118.60 102.94 268.88 486.95 FY12/13 Jun-12 108.86 93.50 260.39 400.35 Sep-12 109.95 92.22 341.46 399.96 Dec-12 110.45 88.19 346.48 357.12 Mar-13 112.91 94.40 309.51 335.49 FY13/14 Jun-13 103.01 94.23 294.50 319.86 Sep-13 110.10 105.83 281.76 298.23 Dec-13 109.41 97.48 292.20 276.82 Mar-14 107.88 98.67 280.67 382.67 FY14/15 Jun-14 109.78 102.98 292.86 467.06 Sep-14 102.08 97.07 238.17 455.92 Dec-14 76.01 73.16 248.61 464.59 Mar-15 53.93 48.63 231.09 389.21
FY15/16 Jun-15 62.10 57.97 210.64 354.39
Sep-15 47.24 51.52 189.86 336.22

- 60 -
July to September 2015
Quarterly Monetary Policy Report
Glossary
Amortization: The repayment of a loan in installments over an agreed period of time.
Base Money: The sum of notes and coins held by the public and the cash reserves of commercial banks (including both their
holding of cash and their deposits at the central bank). The monetary base is the operating target used in the BOJ monetary policy
framework and can be controlled through open market operations. Changes in the monetary base emanate from sources within the
net domestic assets (NDA) as well as the net international reserves (NIR).
Basis Point (bp): This is a unit of percentage measure which is equal to one hundredth of one percent ( 0.01% = 1bp). Basis points
is commonly used when discussing interest rates and fixed income securities.
Bond Market: The domestic bond market primarily captures debt instruments offered by the Central Government to fund its budgetary
needs.
Cash Reserve Requirement: The requirement by law that a percentage of deposit liabilities of deposit-taking institutions must be
held as interest free deposits at the Central Bank.
Core Inflation: Also called Underlying Inflation. It is that part of overall inflation that can be attributed to changes in base money.
Central Banks typically try to control core inflation because there are some parts of inflation that are outside of their control. One
example of this is the effect of changes in oil prices.
Credit: Loans extended by banks, building societies and other financial institutions.
Currency Issue: refers to Jamaican notes and coins in the hands of the public (currency in circulation) in addition to notes and coins
held by financial institutions in their vaults (vault cash). Bank of Jamaica redeems (buys) or issues (sells) notes and coins to financial
institutions when institutions have a demand for cash. The difference between currency issued and that which is redeemed during
a period of time is referred to as net currency issue.
Exchange rate (nominal): The number of units of one currency offered in exchange for another. For example a Jamaica dollar/
United States dollar exchange rate of ‘forty two dollars to one’ indicates that forty-two Jamaican dollars are needed to obtain one
United States dollar.
Exchange rate pass-through: The effect of exchange rate changes on one or more of the following: import and export prices,
consumer prices, investments and trade volumes.
Export Price Index: The export price index (EPI) is a weighted index of the prices of goods and services sold by residents of a country
to foreign buyers.
Foreign exchange cash demand/supply: The amount of foreign exchange purchased by market participants from the authorized
dealers and cambios, while cash supply/inflows is the amount sold to the Bank of Jamaica, authorized dealers and cambios by
market participants, private institutions and multilateral agencies.
Financial Programme: An integrated system of macroeconomic accounts and behavioural relationships defining the set of monetary,
fiscal and exchange rate policy measures designed to achieve specified macroeconomic targets.
Financial Asset: An instrument issued by an institution (e.g. BOJ) that provides economic benefits, by (1) generating interest income
or net profits and (2) acting as a store of value. These benefits are created through a formal/informal borrowing/lending relationship.
Most common types of financial assets are money and credit.

- 61 -
Quarterly Monetary Policy Report July to September 2015
Fiscal deficit: The excess of the Government’s expenditure over its revenue for a given period of time.
Fiscal Year: The twelve months beginning in April. Thus fiscal year 2000/2001 refers to the period April 2000 to March 2001.
Government Securities: Debt instruments issued by the Ministry of Finance either to bridge timing gaps between revenue and
expenditure or to cover any excess of expenditure over revenue. These securities include short-term instruments such as Treasury
Bills and more long-term ones like Local Registered Stock, or Debentures.
Gross Domestic Product (GDP): This is the total value of all goods and services produced within an economy over a particular time
period –either a year or three month.
Import Price Index: The import price index (IPI) is a weighted index of the prices of goods and services purchased by residents of
a country from foreign sellers.
Inflation: refers to the change in the general price level. In Jamaica, this is derived as the change in the Consumer Price Index (CPI)
calculated and published by the Statistical Institute of Jamaica.
Intermediate Target: An intermediate target of policy. e.g. the money supply or the exchange rate, has three main characteristics.
It is not directly determined by the Central Bank,
It responds, however, to a stimulus that the Central Bank can vary, and
Its behaviour should to be closely related to the ultimate target-inflation.
Jamaica Central Securities Depository (JCSD): The Principal function of the JCSD is to provide for relatively risk-free settlement
of share transactions. It accomplishes this by employing an electronic, book-entry system for registering changes of ownership
of securities which eliminates the need for physical certificates. The JCSD also provides vaulting facilities for the safekeeping of
certificates.
JSE Indices: The JSE Index comprises all Ordinary Companies on the Main Market. The JSE Combined Index comprises all Ordinary
Companies on the Main Market and Junior Market. The JSE All Jamaican Composite Index comprises of only Jamaican Companies
on the Main Market. The JSE Select Index comprises the JSE’s 15 most liquid Securities on the Main Market. The JSE Cross Listed
Index is comprised of only foreign companies on the Main Market. The Junior Index comprises all Ordinary Companies on the Junior
Stock Market.
Liquid Asset: An asset is considered liquid if it can be easily and with little or no loss converted to cash. The liquid assets of
commercial banks in Jamaica include notes and coins, short-term deposits at the Bank of Jamaica, GOJ Treasury Bills, Local
Registered Stock maturing within 270 days and any GOJ security designated by the Ministry of Finance.
Money: Anything that is generally accepted in exchange for goods and services and for the payment of debt. (e.g. example, notes
and coins.). Hence money is said to be a medium of exchange. Money also serves as a means of storing wealth as well as a
standard of and unit of accounting for financial values and flows.
Money Multiplier: This defines the relationship between the monetary base (M0) and the money supply and is usually calculated as
the ratio of M3 to M0. It measures the maximum amount of money that can be created by the banking system given the provision of
an additional dollar to the system by the central bank. The money multiplier implies that when the central bank conducts monetary
policy in such a way as to increase the monetary base, the overall expansion in the money supply is a multiple of this initial increase.
This is also true if the central bank reduces the monetary base.
Money Supply: This is the stock of instruments or assets formally designated as money in a particular economy. There are
alternative measures of money supply both within and between countries. In Jamaica, the measurements of money that are

- 62 -
July to September 2015
Quarterly Monetary Policy Report
calculated and published are:
M1: Notes and coins in circulation + Demand Deposits
M2: M1+ Time and savings deposits
M3: M2 + Other Deposits.
A ‘J’ indicates that the components are Jamaican dollar liabilities only and an ‘*’ indicates that the components also include foreign
currency liabilities of the banking system.
Monetary Base: See Base Money
Monetary policy framework: This defines the transmission process through which policy actions taken by the Central Bank make an
impact on the final target - inflation. The components of a monetary policy framework are policy instruments, operating targets,
intermediate targets, and the ultimate goal/objective.
Monetary Policy Instruments: These are instruments used by the Central Bank to influence the money supply and credit. They include
open market operations and the reserve requirement ratio.
Net Domestic Assets: The difference between the monetary base and the NIR. It is comprised of the Bank’s net claims on the public
sector, mainly Central Government, open market operations liabilities and net claims on commercial banks and other financial
institutions.
Open Market Operations (OMO): Money market trading between the Bank of Jamaica and authorized dealers with the intention of
influencing money and credit in the financial system. OMO involves outright sale or purchase of GOJ securities from the stock of
securities held by BOJ, and/or repurchase and reverse repurchase transactions.
Operating Rate: The percentage of total production capacity of some entity, such as a country or a company that is being utilized
at a given time.
Operating Target: An operating target of policy e.g. the monetary base and interest rates, is influenced directly by the Central Bank
and is adjusted by the Bank in order to bring about the desired impact on its policy target.
Primary Dealer (PD): The set of intermediaries through which BOJ conducts open market operations. In developed country markets,
PD’s underwrite government issues as well as participate in block transactions with the central bank.
Public Sector Entities (PSE) Foreign Exchange Facility: A foreign exchange surrender facility for public sector entities which seeks
to centralize foreign currency demand. Under this facility Commercial Banks, Authorized Dealers and Cambios agreed to surrender
amounts in addition to the pre-existing requirements.
Quasi-Fiscal Costs: The cost to the central bank of sterilizing the liquidity effects of capital inflows.
Quasi-money: Savings Deposits plus Time Deposit.
Real Appreciation: An increase in the volume of foreign goods that can be bought with a unit of domestic currency; alternatively
it is a decrease in the volume of domestic goods that can be purchased with a unit of foreign currency. Thus, a real appreciation
makes exports less attractive and imports relatively cheaper. This may ensue from a nominal appreciation, which is the rise in the
unit price of the currency, or a greater increase in domestic prices relative to foreign prices, or both.
Real Exchange Rate: The price of one country’s currency in terms of another, adjusted for the inflation differential between the
countries.

- 63 -
Quarterly Monetary Policy Report July to September 2015
Real interest rate: This represents the rate of return on assets after accounting for the effects of inflation on the purchasing power
of the return. It is calculated by adjusting the nominal interest rate by the inflation rate.
Repurchase Agreement (repo): The purchase of a security from a primary dealer who agrees to repurchase the same at a specified
rate and an agreed future date.
Reserve Requirement: refers to the portion of deposit liabilities that financial institutions may not lend and have to retain either as
liquid assets or on deposit at the Bank of Jamaica.
Reverse Repurchase Agreements: An agreement whereby the Central Bank sells a security that it owns and agrees to buy back same
at a specified rate at an agreed future date.
Securities: Legal documents giving title to property, or claim on income e.g. bonds and stocks.
Signal Rate: Interest rate on Bank of Jamaica’s thirty-day reverse repurchase agreements. This rate provides a benchmark for the
pricing of all open market instruments negotiated between the BOJ and Primary Dealers.
Special Drawing Right: The SDR is an interest-bearing international reserve asset created by the IMF to supplement the official
reserves of member countries.
Statutory Cash Reserves: That portion of deposit liabilities of deposit-taking institution, which by a statutorily based stipulation, must
be held as interest free deposits at the Central Bank.
Sterilization: The use of open market operations to prevent intervention in the foreign exchange market from changing the monetary
base. With sterilization, any purchase of foreign exchange is accompanied by an equal-value sale of domestic bonds and vice
versa.
Time deposit: A bank account based on a contractual arrangement between the deposit taking institution and the depositor where
both parties agree to a pre-determined interest rate and maturity date, on which deposits earn interest and premature withdrawals
from which require advance notice.
Terms of Trade: An index of the ratio of export prices to the index of import prices. An improvement in the terms of trade follows
if export prices rise more quickly than import prices.
Tourism Implicit Price Index: a measure of prices in the tourism industry as reflected by average daily expenditure per tourist.

- 64 -
July to September 2015
Quarterly Monetary Policy Report
Quarterly Monetary Policy Report ` October to December 2014
59
List of Boxes
QMPR ISSUE LIST OF BOXES
Oct – Dec 2000 1 Sovereign Credit Ratings & Outlook
2 E-Gate & The Foreign Exchange Market
3 The International Oil Market: Recent Developments and Outlook
4 Jamaica’s IMF Staff Monitored Programme (SMP)
Jan – Mar 2001 5 Core Inflation in Jamaica – Concept & Measurement
6 Highlights of the IMF 2001 Article IV Consultation
Apr – Jun 2001 7 Jamaica’s Banking Sector Recovery – An Overview
8 Jamaica’s Sovereign Credit Ratings – An Update
9 Highlights of the IMF’s May 2001 Article IV Consultation
Jul – Sep 2001 10 Innovations in Jamaica’s Payment System
11 Expanding the Role of Equity Finance in Jamaica: Some Perspectives
12 The US Economy: Recent Trends and Prospects
Oct – Dec 2001 13 The Performance of Remittances in the Jamaican Economy: 1997 - 2001
14 Tourism and the Jamaican Economy: Pre & Post 11 September 2001
15 World Trade Organization (WTO): Outcome of the Fourth Ministerial Conference in Doha. Qatar
and the Possible Implications for Jamaica
Jan – Mar 2002 16 Commercial Bank Probability: January to December 2001
17 Regional Disparities in Jamaica’s Inflation – 1997/98 to 2001/02
18 The Argentina Debt Crisis & Implications for Jamaica
19 General Data Dissemination Standards
Apr – Jun 2002 20 The Automated Clearing House: Implications for the Payment System
21 Macroeconomic Implications of Cross Border Capital Flows: Some Scenarios
22 Performance of Remittances in the Latin American and Caribbean Region – 1997 to 2001
Jul – Sep 2002 23 Building Societies’ New Mortgage Loans: July 2001 – June 2002
24 An Overview of the CARICOM Single Market and Economy (CSME)
Oct – Dec 2002 25 The Profitability of the Banking System: 1991 - 2002
26 Interest Rates Spreads in Jamaica: 1995 - 2002
27 Implications of the International Accounting Standards (IAS) for Financial Systems and
Financial Stability
Jan – Mar 2003 28 Opportunities for Savings and Investments in Jamaica: Financial Intermediaries and Financial
Instruments
29 The CPI and the GDP Deflator: Concepts and Applications
Apr – Jun 2003 30 The Concept and Measurement of External Competitiveness
31 Exchange Rate Pass-Through in the Jamaican Economy
Jul – Sep 2003 32 The International Investment Position
33 The Fifth WTO Ministerial Conference: Implications for Future Trading Negotiations
Oct – Dec 2003 34 The Monetary Policy Committees: International Precedents and Macroeconomic Context
35 Macroeconomic Determinants of Nominal Interest Rate
Jan – Mar 2004 36 Recent Trends and Prospects in the Balance of Payments

- 65 -
Quarterly Monetary Policy Report July to September 2015
Quarterly Monetary Policy Report ` October to December 2014
60
37 The Exchange Rate Regime and Monetary Policy
Apr – Jun 2004 38 Preserving Financial Stability
39 Financial Sector Assessment Programme
40 Jamaica’s Current Relationship with the IMF
Jul – Sep 2004 41 Recent Developments in Crude Oil Prices
42 Implications of Higher Crude Oil Prices for the Balance of Payments and Inflation
Oct – Dec 2004 43 Recent Trends in Foreign Direct Investment
44 Exploring the Jamaican Foreign Exchange Market Dynamics: 2001 – 2004 (Special Feature)
Jan – Mar 2005 45 The BOJ Macroeconomic Stress Testing Programme and Financial Stability
46 Issues of Foreign Reserve Adequacy
Apr – Jun 2005 47 Credit Bureaux and Financial Market Efficiency
48 Trends in Labour Productivity
Jul – Sep 2005 49 Inflation in Selected Caribbean Countries
50 International Developments (Special Feature)
Oct – Dec 2005 51 Payment Systems Reform
Jan – Mar 2006 52 The IMF’s Code of Good Practices on Transparency on Monetary policy: A Summary of the
IMF’s Assessment Report on Jamaica
Apr – Jun 2006 53 Trends in Private Sector Credit: FY2001/02 to FY2005/06
54 Exploring the Interest Rate Differential between Jamaica Dollar and US Dollar Denominated
Assets: Jan 2001 – June 2006
55 Jamaica Labour Market: Trends and Key Indicators – 1996 to 2005
Jul – Sep 2006 56 Labour Market Update – June 2006
57 The Special (Upper Income) Consumer Price Index
58 Jamaica Interim Staff Report Under Intensified Surveillance: Executive Summary
Oct – Dec 2006 59 Factors Influencing the Demand for Currency Issued by the BOJ & the Impact of Currency
Demand on the Balance Sheet of Financial Institutions
Jan – Mar 2007 60 Jamaica’s Financial Programme
61 Inflation Expectation Survey
62 The Producer’s Price Index
Apr – Jun 2007 63 Measuring Core Inflation: Emerging Issues
Jul – Sep 2007 64 The Turbulence in the US Subprime Mortgage Market
65 The Revised Consumer Price Index
Oct – Dec 2007 66 Trends in Jamaica’s Fuel Demand
67 Trends in Inflation
68 The EU-CARIFORUM Economic Partnership Agreement
Jan – Mar 2008 69 Impact of a Potential US Recession on the Jamaican Economy
70 Recent Trends in International Commodity Prices
Apr – Jun 2008 71 Global Monetary Policy Response to Spiralling Commodity Prices
Jan – Mar 2009 72 BOJ’s Monetary Policy Response to the Global Financial Crisis
73 The Transmission of Monetary Policy in Jamaica
74 Monetary Policy, Economic Growth and Inflation
Apr – Jun 2009 75 The International Monetary Fund (IMF) and Jamaica’s Experience with the IMF
Jul – Sep 2009 76 Fiscal Responsibility Frameworks/Fiscal Rules
Oct – Dec 2009 77 Bank of Jamaica Liquidity Support to the Government: November 2009 – January 2010

- 66 -
July to September 2015
Quarterly Monetary Policy Report
Quarterly Monetary Policy Report ` October to December 2014
61
78 The Dynamics of Jamaica’s Interest Rate
79 Jamaica’s Medium-Term Economic & Financial Programme: FY2009/10 – FY2013/14
Jan – Mar 2010 80 Jamaica’s Inflation: How Much is Enough?
81 The Jamaica Debt Exchange
Apr – Jun 2010 82 Exchange Rates and External Price Competitiveness
83 Adequacy of the BOJ’s Gross International Reserves
Jul – Sep 2010 84 Preserving Financial Stability (revisited)
85 Credit Bureaux and the Efficiency of Credit Markets (updated)
Oct – Dec 2010 86 An Inflation Targeting Framework for Jamaica
Jan – Mar 2011 87 The Middle East and North Africa (MENA) Crisis and its Implication for the Jamaican Economy
Apr – Jun 2011 88 Evolution of the European Debt Crisis & its Impact on Jamaica
Jul – Sep 2011 89 Electronic Small-Value Retail Payments: Recent Trends and the Relationship with Economic
Growth
Oct – Dec 2011 90 Productivity and Growth
Jan – Mar 2012 91 External Competitiveness in Jamaica
Apr – Jun 2012 92 The Importance of Managing Inflation Expectations
Jul – Sep 2012 93 A Preliminary Assessment of the Impact of Hurricane Sandy on Prices – Results from a Field
Survey
Oct – Dec 2012 94 Fiscal Expenditure Multipliers and Economic Growth
Jan – Mar 2013 95 Jamaica’s Medium-Term Economic & Financial Programme: FY2013/14 – FY2017/18
Apr – Jun 2013 96 The Evolution of the Jamaica Dollar Liquidity and its Impact on Money Market Rates: January
to June 2013
97 Recent Trends and Developments in Remittances
Jan – Mar 2014 98 The Bank of Jamaica’s Quarterly Credit Conditions Survey (recurrent)
Apr – Jun 2014 99 Jamaica’s Macroeconomic Programme under the EFF (recurrent)
100 Monetary Policy Transmission Mechanism (recurrent)
Jul – Sept 2014 101 Changes to the Liquidity Management Framework for Deposit-taking Institutions
Oct – Dec 2014 102 Recent Developments in Crude Oil Prices


