
1 1
Banking
For updated information, please visit www.ibef.org
MARCH
2013

2 2
Contents
Advantage India
Market overview and trends
Growth drivers
Success stories: HDFC, Axis Bank
Opportunities
Useful information
For updated information, please visit www.ibef.org
Banking MARCH
2013
3 3
Banking
For updated information, please visit www.ibef.org ADVANTAGE INDIA
Advantage India
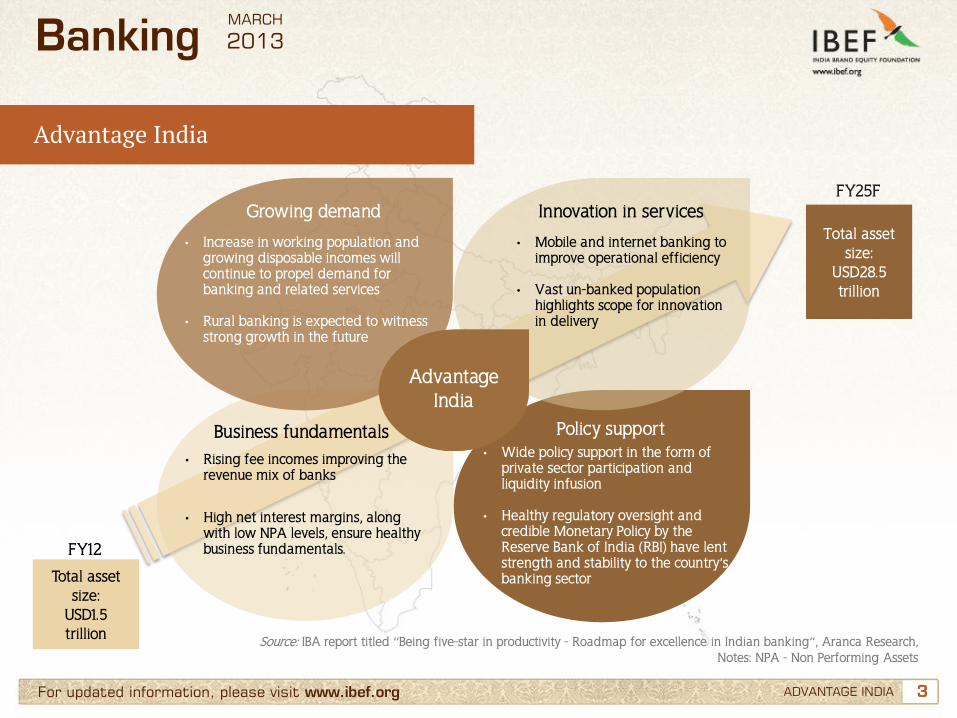
Advantage India
• Increase in working population and growing disposable incomes will continue to propel demand for banking and related services
• Rural banking is expected to witness strong growth in the future
• Mobile and internet banking to improve operational efficiency
• Vast un-banked population highlights scope for innovation in delivery
• Rising fee incomes improving the revenue mix of banks
• High net interest margins, along with low NPA levels, ensure healthy business fundamentals.
• Wide policy support in the form of private sector participation and liquidity infusion
• Healthy regulatory oversight and credible Monetary Policy by the Reserve Bank of India (RBI) have lent strength and stability to the country’s banking sector
Total asset size:
USD28.5 trillion
FY25F
Total asset size:
USD1.5 trillion
FY12
Source: IBA report titled “Being five-star in productivity - Roadmap for excellence in Indian banking”, Aranca Research, Notes: NPA - Non Performing Assets
Growing demand Innovation in services
Business fundamentals Policy support
MARCH
2013

4 4
Contents
Advantage India
Market overview and trends
Growth drivers
Success stories: HDFC, Axis Bank
Opportunities
Useful information
For updated information, please visit www.ibef.org
Banking MARCH
2013

5 5 For updated information, please visit www.ibef.org MARKET OVERVIEW AND TRENDS
Evolution of the Indian banking sector
Source: IBA, Aranca Research, BMI Notes: RBI - Reserve Bank of India, FDI - Foreign Direct Investment
Banking
• Closed market
• State-owned Imperial Bank of India was the only bank existing
• RBI was established as the central bank of country
• Quasi central banking role of Imperial Bank came to an end
• Imperial Bank expanded its network to 480 branches
• In order to increase penetration in rural areas, Imperial Bank was converted into State Bank of India
• Nationalisation of 14 large commercial banks in 1969 and 6 more banks in 1980
• Entry of private players such as ICICI intensifying the competition
• Gradual technology upgradation in PSU banks
1921
1935
1936 -1955
1956-2000 • Number of banks increased to-27 public sector banks, 22 private sector banks and 36 foreign banks
• Advent of mobile and internet banking
• Growing FDI in the Indian banking sector
Post 2000
MARCH
2013

6 6 For updated information, please visit www.ibef.org
The structure of Indian banking sector
Source: RBI, Aranca Research Note: The data on number of banks belongs to FY11
MARKET OVERVIEW AND TRENDS
Banking
Reserve Bank of India
Banks
Scheduled Commercial Banks (SCBs)
Public sector banks (27)
Private sector banks (22)
Foreign banks (36)
Regional Rural Banks (RRB) (82)
Urban cooperative banks (1,674)
Rural cooperative credit institutions (96,751)
Cooperative credit institutions
Financial institutions
All-India financial institutions
State-level institutions
Other institutions
MARCH
2013

7 7
328
418
510 596
695
846
990 1,015
FY06 FY07 FY08 FY09 FY10 FY11 FY12 FY13*
For updated information, please visit www.ibef.org
Indian banking sector has grown at a healthy and steady pace … (1/2)
MARKET OVERVIEW AND TRENDS
→ Credit off-take has been surging ahead over the past decade, aided by strong economic growth, rising disposable incomes, increasing consumerism and easier access to credit
→ Over FY07-12, credit off-take expanded at a CAGR of 18.8 per cent (to USD990.5 billion)
→ Credit off take has grown at 16.7 per cent to USD1,015 billion in August 2012 as compared to USD870 billion in August 2011.
→ Demand has grown for both corporate and retail loans.
Growth in credit off-take over past few years (USD billion)
Source: Reserve Bank of India (RBI), Aranca Research; Note: CAGR: Compounded Annual Growth Rate.
Note: FY13* - Figure mentioned is up to August 2012
Banking MARCH
2013
8 8
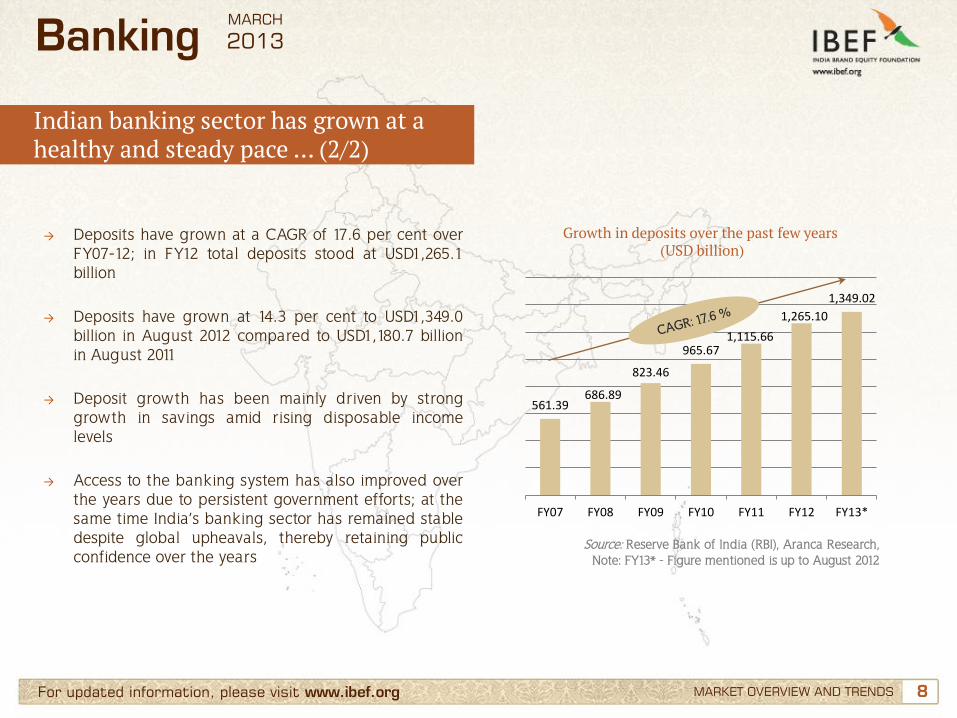
561.39 686.89
823.46
965.67 1,115.66
1,265.10
1,349.02
FY07 FY08 FY09 FY10 FY11 FY12 FY13*
For updated information, please visit www.ibef.org MARKET OVERVIEW AND TRENDS
→ Deposits have grown at a CAGR of 17.6 per cent over FY07-12; in FY12 total deposits stood at USD1,265.1 billion
→ Deposits have grown at 14.3 per cent to USD1,349.0 billion in August 2012 compared to USD1,180.7 billion in August 2011
→ Deposit growth has been mainly driven by strong growth in savings amid rising disposable income levels
→ Access to the banking system has also improved over the years due to persistent government efforts; at the same time India’s banking sector has remained stable despite global upheavals, thereby retaining public confidence over the years
Banking
Indian banking sector has grown at a healthy and steady pace … (2/2)
MARCH
2013
Growth in deposits over the past few years (USD billion)
Source: Reserve Bank of India (RBI), Aranca Research, Note: FY13* - Figure mentioned is up to August 2012
9 9 For updated information, please visit www.ibef.org MARKET OVERVIEW AND TRENDS
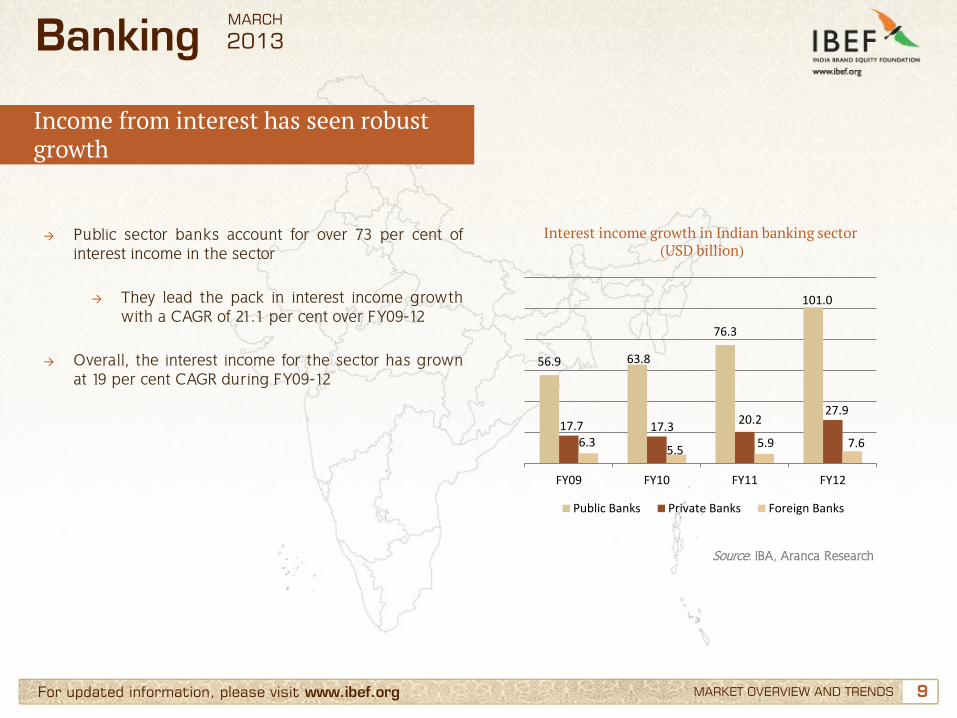
→ Public sector banks account for over 73 per cent of interest income in the sector
→ They lead the pack in interest income growth with a CAGR of 21.1 per cent over FY09-12
→ Overall, the interest income for the sector has grown
at 19 per cent CAGR during FY09-12
Source: IBA, Aranca Research
Banking
56.9 63.8
76.3
101.0
17.7 17.3 20.2
27.9
6.3 5.5
5.9 7.6
FY09 FY10 FY11 FY12
Public Banks Private Banks Foreign Banks
MARCH
2013
Income from interest has seen robust growth
Interest income growth in Indian banking sector (USD billion)

10 10 For updated information, please visit www.ibef.org MARKET OVERVIEW AND TRENDS
→ Public sector banks account for about 59 per cent of income other than from interest (‘other income’)
→ ‘Other income’ for public sector banks has risen at a CAGR of 5.7 per cent during FY09-12
→ Overall, ‘other income’ for the sector has risen at 4.5
per cent CAGR during FY09-12
Source: IBA, Aranca Research
Banking
Growth in ‘other income’ also on a positive trend
8.9
10.2 10.0 10.5
3.7 4.3 4.3 5.1
3.1 2.1 2.3 2.3
FY09 FY10 FY11 FY12
Public Banks Private Banks Foreign Banks
MARCH
2013
‘Other income’ growth in Indian banking sector (USD billion)

11 11 For updated information, please visit www.ibef.org
High NIM, Low NPA place Indian banking among the world’s best … (1/2)
MARKET OVERVIEW AND TRENDS
→ Indian banking sector enjoys healthy net interest margins (NIM) compared with global peers
→ HDFC leads the large banks with a NIM of over 4 per cent
→ Prominent Chinese banks have NIM’s between 2-3 per cent, significantly lower than Indian peers
→ Despite virtually zero cost funds, the banks in the US have NIM’s comparable to Indian peers
Healthy net interest margins (FY12)
Source: Company reports, Aranca Research Note: HDFC - Housing Development Finance Corporation,
ICICI - Industrial Credit and Investment Corporation of India, SBI - State Bank of India
Banking
4.22%
2.73%
3.85% 3.59%
HDFC ICICI SBI Axis
MARCH
2013
12 12 For updated information, please visit www.ibef.org MARKET OVERVIEW AND TRENDS
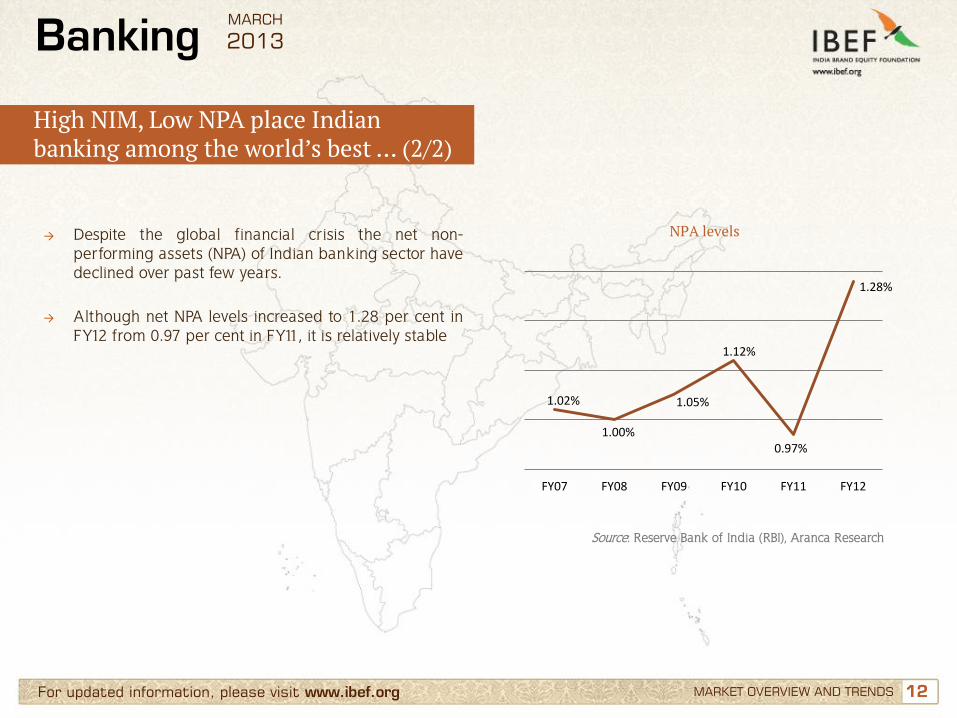
→ Despite the global financial crisis the net non-performing assets (NPA) of Indian banking sector have declined over past few years.
→ Although net NPA levels increased to 1.28 per cent in FY12 from 0.97 per cent in FY11, it is relatively stable
Source: Reserve Bank of India (RBI), Aranca Research
Banking
High NIM, Low NPA place Indian banking among the world’s best … (2/2)
1.02%
1.00%
1.05%
1.12%
0.97%
1.28%
FY07 FY08 FY09 FY10 FY11 FY12
MARCH
2013
NPA levels

13 13 For updated information, please visit www.ibef.org MARKET OVERVIEW AND TRENDS
→ Although public sector banks continue to control majority of the banking assets, their share is gradually declining
→ Share of public sector banks in total assets have declined from 76 per cent in FY05 to 72.8 per cent in FY12
Source: IBA statistics, Aranca Research
Banking
Private/foreign banks are aggressively increasing their presence … (1/2)
76.0% 72.8%
17.0% 20.2%
7.0% 7.0%
FY05 FY12
Public sector Private sector Foreign
MARCH
2013
Market share of bank groups by assets

14 14 For updated information, please visit www.ibef.org MARKET OVERVIEW AND TRENDS
→ Share of public sector banks in total deposits have also declined from 78.2 per cent in FY05 to 77.5 per cent in FY12
→ This is largely due to the fact that foreign and private sector banks are rapidly capturing share in savings deposit
Source: IBA statistics, Aranca Research
Banking
Private/foreign banks are aggressively increasing their presence … (2/2)
78.2% 77.5%
17.1% 18.2%
4.7% 4.3%
0%
20%
40%
60%
80%
100%
FY05 FY12
Public sector Private sector Foreign
MARCH
2013
Market share of bank groups by deposits

15 15 For updated information, please visit www.ibef.org MARKET OVERVIEW AND TRENDS
Notable trends in the Indian banking sector … (1/2)
Improved risk management practices
• Indian banks are increasingly focusing on adopting integrated approach to risk management
• Banks have already embraced the international banking supervision accord of Basel II; interestingly, according to RBI, majority of the banks already meet capital requirements of Basel III
• Most of the banks have put in place the framework for asset-liability match, credit and derivatives risk management.
Diversification of revenue stream
• Banks are laying emphasis on diversifying the source of revenue stream to protect themselves from interest rate cycle and its impact on interest income
• Focusing on increasing fee and fund based income by launching plethora of new asset management, wealth management and treasury products
Technological innovations
• Indian banks, including public sector banks are aggressively improving their technology infrastructure to enhance customer experience and gain competitive advantage
• Internet and mobile banking is gaining rapid foothold
• Customer Relationship Management (CRM) and data warehousing will drive the next wave of technology in banks
Banking
Source: BCG-FICCI-IBA, Indian Banking sector 2020
MARCH
2013

16 16 For updated information, please visit www.ibef.org MARKET OVERVIEW AND TRENDS
Notable trends in the Indian banking sector … (2/2)
Focus on financial inclusion
• RBI has emphasised the need to focus on spreading the reach of banking services to the un-banked population of India
• Indian banks are expanding their branch network in the rural areas to capture the new business opportunity
Derivatives and risk management products
• The increasingly dynamic business scenario and financial sophistication has increased the need for customised exotic financial products
• Banks are developing Innovative financial products and advanced risk management methods to capture the market share
Consolidation
• With entry of foreign banks competition in the Indian banking sector has intensified.
• Banks are increasingly looking at consolidation to derive greater benefits such as enhanced synergy, cost take-outs from economies of scale, organisational efficiency, and diversification of risks
Banking MARCH
2013
17 17 For updated information, please visit www.ibef.org
Banks reaping benefits from increased usage of technology
Banking
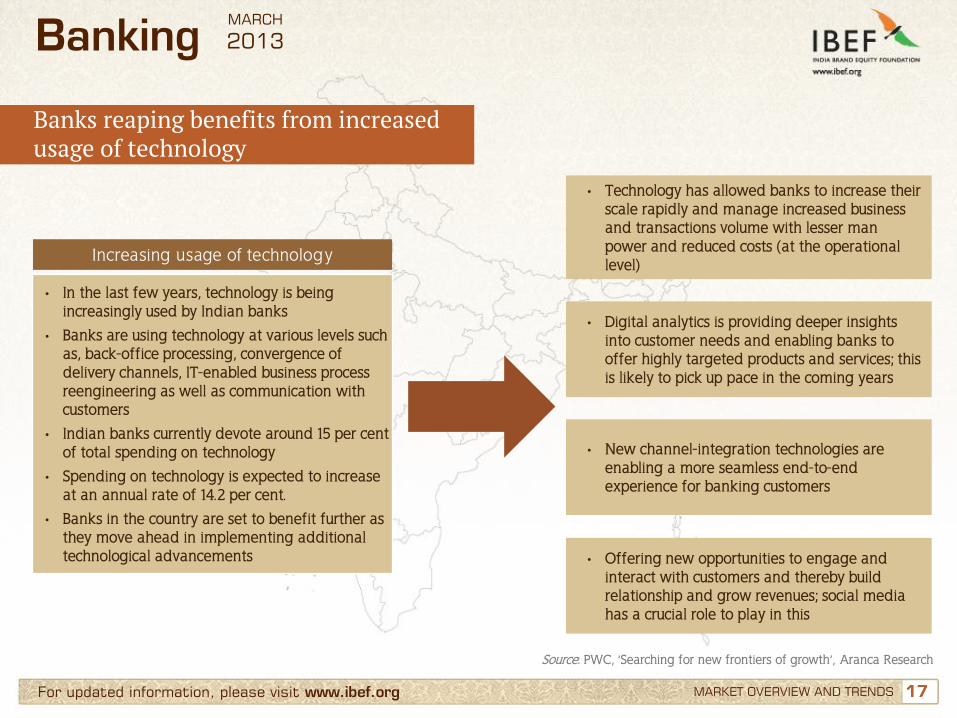
• In the last few years, technology is being increasingly used by Indian banks
• Banks are using technology at various levels such as, back-office processing, convergence of delivery channels, IT-enabled business process reengineering as well as communication with customers
• Indian banks currently devote around 15 per cent of total spending on technology
• Spending on technology is expected to increase at an annual rate of 14.2 per cent.
• Banks in the country are set to benefit further as they move ahead in implementing additional technological advancements
• Technology has allowed banks to increase their scale rapidly and manage increased business and transactions volume with lesser man power and reduced costs (at the operational level)
• Digital analytics is providing deeper insights into customer needs and enabling banks to offer highly targeted products and services; this is likely to pick up pace in the coming years
• New channel-integration technologies are enabling a more seamless end-to-end experience for banking customers
• Offering new opportunities to engage and interact with customers and thereby build relationship and grow revenues; social media has a crucial role to play in this
Increasing usage of technology
Source: PWC, ‘Searching for new frontiers of growth’, Aranca Research
MARCH
2013
MARKET OVERVIEW AND TRENDS

18 18
Contents
Advantage India
Market overview and trends
Growth drivers
Success stories: HDFC, Axis Bank
Opportunities
Useful information
For updated information, please visit www.ibef.org
Banking MARCH
2013

19 19 For updated information, please visit www.ibef.org GROWTH DRIVERS
Growth drivers of Indian banking sector
Banking
Notes: GDP - Gross Domestic Product, KYC - Know Your Customer, RBI - Reserve Bank of India, ATM - Automated Teller Machine
• Favourable demographics and rising income levels
• Strong GDP growth (CAGR of 7.7 per cent expected over 2012-17) to facilitate banking sector expansion
• The sector will benefit from structural economic stability and continued credibility of Monetary Policy
• Extension of interest subsidy to low cost home buyers
• Simplification of KYC norms, introduction of no-frills accounts and Kisan Credit Cards to increase rural banking penetration
• RBI is considering giving more licenses to private sector players to increase banking penetration
• India currently spends 6 per cent of GDP on infrastructure; Planning Commission expects this fraction to grow going ahead
• Banking sector is expected to finance part of the USD1 trillion infrastructure investments in the 12th Five Year Plan, opening a huge opportunity for the sector
Economic and demographic drivers Policy support Infrastructure financing
• Technological innovation will not only help to improve products and services but also to reach out to the masses in cost effective way
• Use of alternate channels like ATM, internet and mobile hold significant potential in India
Technological innovation
MARCH
2013
20 20
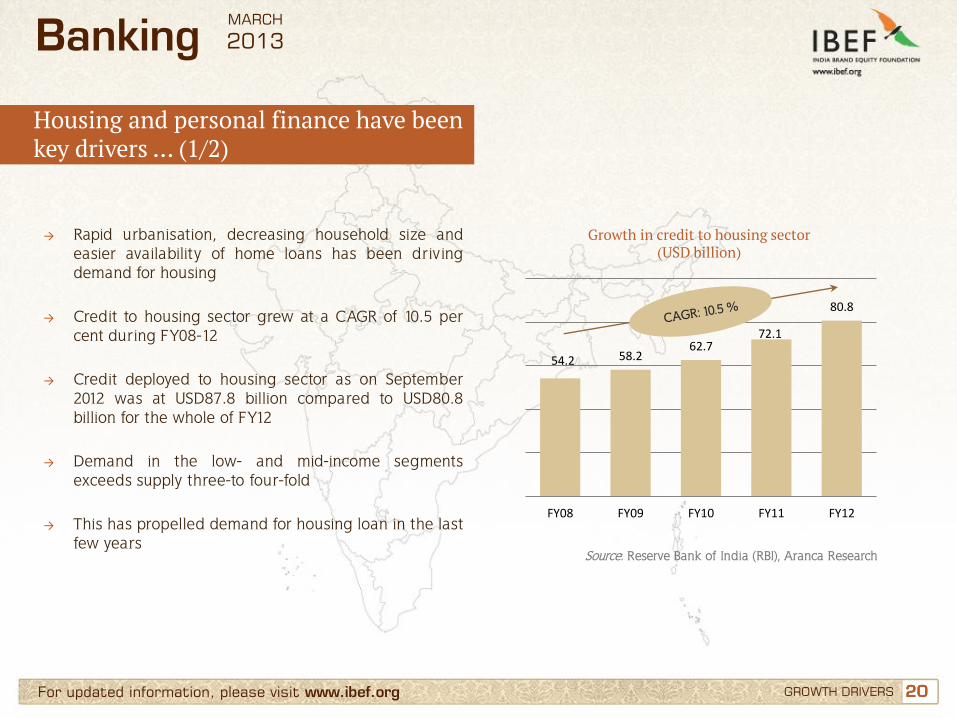
54.2 58.2 62.7
72.1
80.8
FY08 FY09 FY10 FY11 FY12
For updated information, please visit www.ibef.org
→ Rapid urbanisation, decreasing household size and easier availability of home loans has been driving demand for housing
→ Credit to housing sector grew at a CAGR of 10.5 per cent during FY08-12
→ Credit deployed to housing sector as on September 2012 was at USD87.8 billion compared to USD80.8 billion for the whole of FY12
→ Demand in the low- and mid-income segments exceeds supply three-to four-fold
→ This has propelled demand for housing loan in the last
few years
Growth in credit to housing sector (USD billion)
Source: Reserve Bank of India (RBI), Aranca Research
Banking
Housing and personal finance have been key drivers … (1/2)
GROWTH DRIVERS
MARCH
2013
21 21 For updated information, please visit www.ibef.org
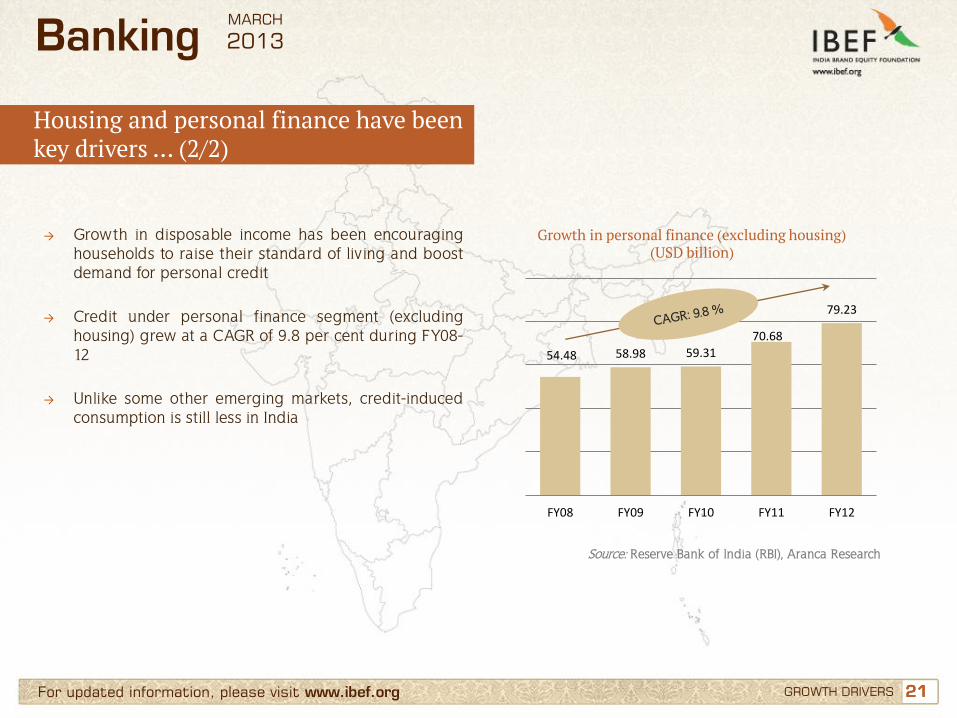
→ Growth in disposable income has been encouraging households to raise their standard of living and boost demand for personal credit
→ Credit under personal finance segment (excluding housing) grew at a CAGR of 9.8 per cent during FY08-12
→ Unlike some other emerging markets, credit-induced consumption is still less in India
Growth in personal finance (excluding housing) (USD billion)
Source: Reserve Bank of India (RBI), Aranca Research
Banking
Housing and personal finance have been key drivers … (2/2)
GROWTH DRIVERS
54.48 58.98 59.31
70.68
79.23
FY08 FY09 FY10 FY11 FY12
MARCH
2013
22 22
0
500
1,000
1,500
2,000
2,500
0
100
200
300
400
500
600
700
2001 2006 2011E 2016F
Population GDP per capita (USD)
For updated information, please visit www.ibef.org
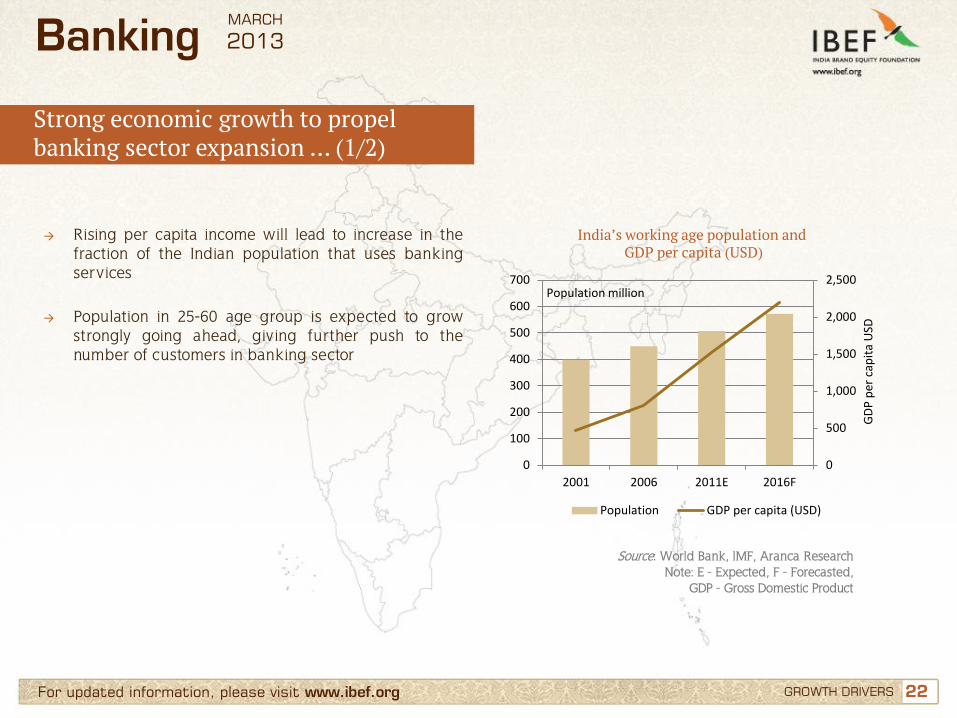
→ Rising per capita income will lead to increase in the fraction of the Indian population that uses banking services
→ Population in 25-60 age group is expected to grow strongly going ahead, giving further push to the number of customers in banking sector
India’s working age population and GDP per capita (USD)
Source: World Bank, IMF, Aranca Research Note: E - Expected, F - Forecasted,
GDP - Gross Domestic Product
Banking
Strong economic growth to propel banking sector expansion … (1/2)
GROWTH DRIVERS
Population million
MARCH
2013
GD
P p
er c
apit
a U
SD

23 23
858
978
1,173 1,431
1,775 2,218
-
500
1,000
1,500
2,000
2,500
2011E 2012F 2013F 2014F 2015F 2016F
For updated information, please visit www.ibef.org
→ India’s GDP is forecasted to grow at a healthy CAGR of 7.7 per cent during 2012-17 to USD2,218 billion
→ Strong GDP growth will facilitate banking sector expansion
→ The sector will also benefit from economic stability and credibility of Monetary Policy
Total loans: growth forecast over 2011-16
Source: Business Monitor International Ltd (BMI), Aranca Research
Banking
Strong economic growth to propel banking sector expansion … (2/2)
GROWTH DRIVERS
USD billion
MARCH
2013
24 24 For updated information, please visit www.ibef.org
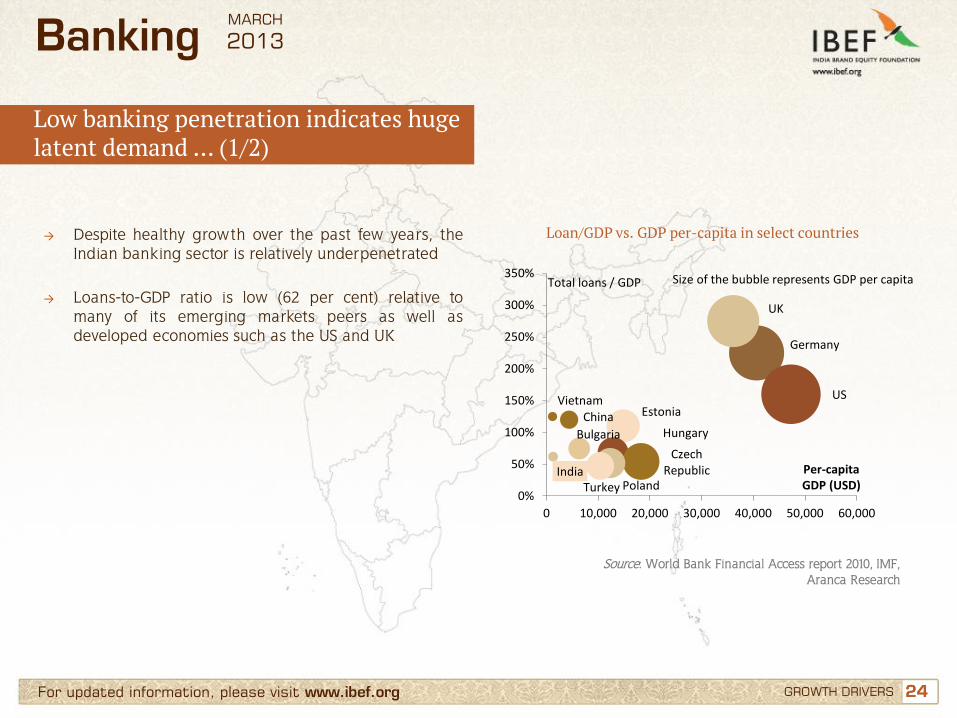
→ Despite healthy growth over the past few years, the Indian banking sector is relatively underpenetrated
→ Loans-to-GDP ratio is low (62 per cent) relative to
many of its emerging markets peers as well as developed economies such as the US and UK
Loan/GDP vs. GDP per-capita in select countries
Source: World Bank Financial Access report 2010, IMF, Aranca Research
Banking
Low banking penetration indicates huge latent demand … (1/2)
Estonia
Bulgaria Hungary
Czech Republic
Poland Turkey
Vietnam
India
China
Germany
UK
US
0%
50%
100%
150%
200%
250%
300%
350%
0 10,000 20,000 30,000 40,000 50,000 60,000
Total loans / GDP
Per-capita GDP (USD)
GROWTH DRIVERS
Size of the bubble represents GDP per capita
MARCH
2013
25 25 For updated information, please visit www.ibef.org
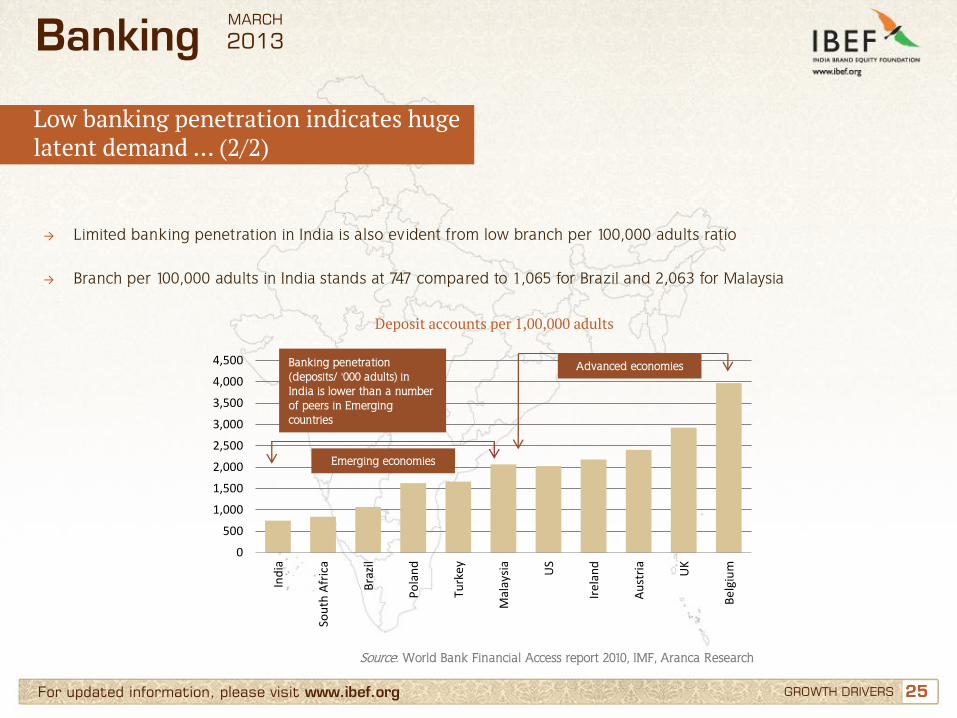
→ Limited banking penetration in India is also evident from low branch per 100,000 adults ratio
→ Branch per 100,000 adults in India stands at 747 compared to 1,065 for Brazil and 2,063 for Malaysia
Deposit accounts per 1,00,000 adults
Source: World Bank Financial Access report 2010, IMF, Aranca Research
Banking
Low banking penetration indicates huge latent demand … (2/2)
GROWTH DRIVERS
0
500
1,000
1,500
2,000
2,500
3,000
3,500
4,000
4,500
Ind
ia
Sou
th A
fric
a
Bra
zil
Po
lan
d
Turk
ey
Mal
aysi
a
US
Ire
lan
d
Au
stri
a
UK
Be
lgiu
m
Banking penetration (deposits/ '000 adults) in India is lower than a number of peers in Emerging countries
Advanced economies
Emerging economies
MARCH
2013
26 26
Contents
Advantage India
Market overview and trends
Growth drivers
Success stories: HDFC, Axis Bank
Opportunities
Useful information
For updated information, please visit www.ibef.org
Banking MARCH
2013
27 27 For updated information, please visit www.ibef.org SUCCESS STORIES: HDFC, AXIS BANK
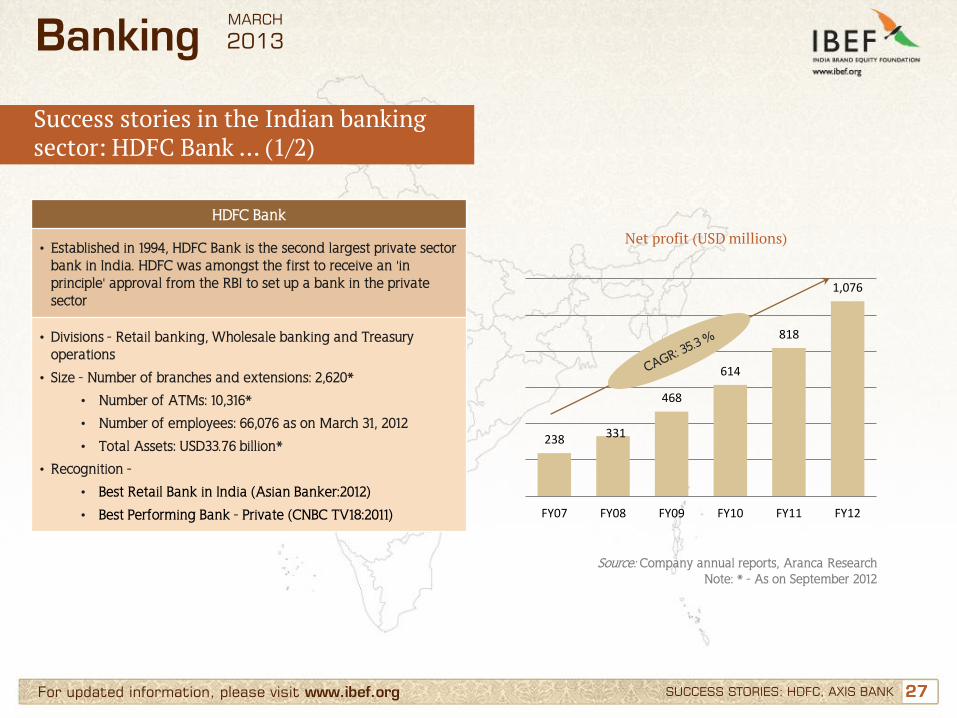
Success stories in the Indian banking sector: HDFC Bank … (1/2)
Banking
HDFC Bank
• Established in 1994, HDFC Bank is the second largest private sector bank in India. HDFC was amongst the first to receive an 'in principle' approval from the RBI to set up a bank in the private sector
• Divisions - Retail banking, Wholesale banking and Treasury operations
• Size - Number of branches and extensions: 2,620*
• Number of ATMs: 10,316*
• Number of employees: 66,076 as on March 31, 2012
• Total Assets: USD33.76 billion*
• Recognition -
• Best Retail Bank in India (Asian Banker:2012)
• Best Performing Bank - Private (CNBC TV18:2011)
Net profit (USD millions)
Source: Company annual reports, Aranca Research Note: * - As on September 2012
238 331
468
614
818
1,076
FY07 FY08 FY09 FY10 FY11 FY12
MARCH
2013

28 28
13
21 26
33
41
21
30 35
43
51
FY08 FY09 FY10 FY11 FY12
Advances Deposits
USD billion
For updated information, please visit www.ibef.org SUCCESS STORIES: HDFC, AXIS BANK
Success stories in the Indian banking sector: HDFC Bank … (2/2)
Source: Company annual reports, Aranca Research
Banking
Advances and deposits Income break-up (FY12)
70%
24%
6%
Net Interest Income
Fee Income
Other Income
MARCH
2013
29 29 For updated information, please visit www.ibef.org SUCCESS STORIES: HDFC, AXIS BANK
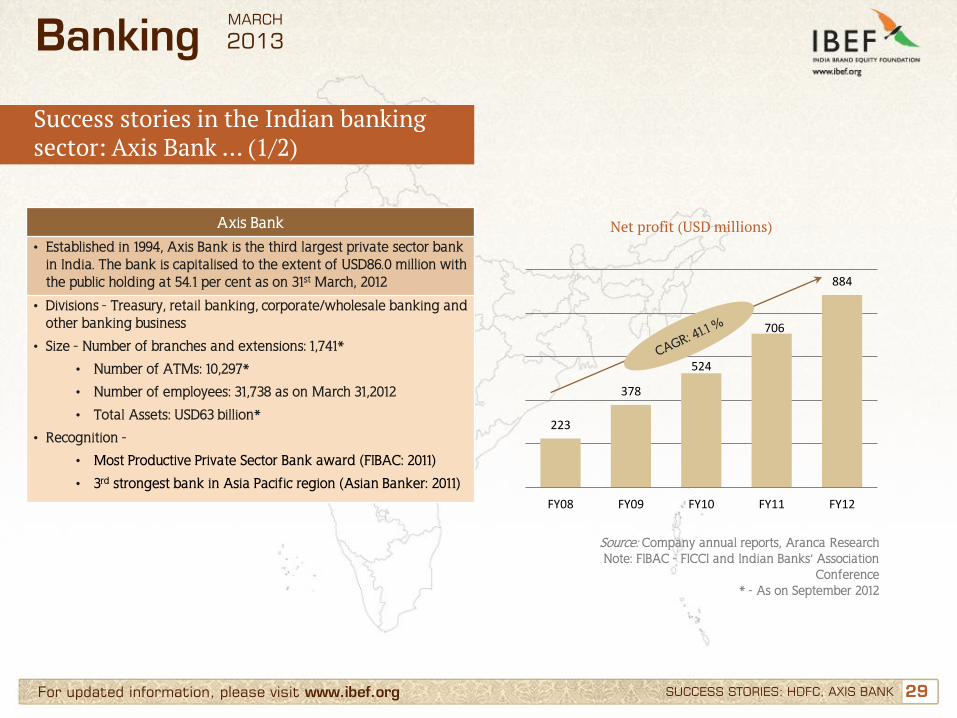
Success stories in the Indian banking sector: Axis Bank … (1/2)
Banking
Axis Bank
• Established in 1994, Axis Bank is the third largest private sector bank in India. The bank is capitalised to the extent of USD86.0 million with the public holding at 54.1 per cent as on 31st March, 2012
• Divisions - Treasury, retail banking, corporate/wholesale banking and other banking business
• Size - Number of branches and extensions: 1,741*
• Number of ATMs: 10,297*
• Number of employees: 31,738 as on March 31,2012
• Total Assets: USD63 billion*
• Recognition -
• Most Productive Private Sector Bank award (FIBAC: 2011)
• 3rd strongest bank in Asia Pacific region (Asian Banker: 2011)
Net profit (USD millions)
Source: Company annual reports, Aranca Research Note: FIBAC - FICCI and Indian Banks’ Association
Conference * - As on September 2012
223
378
524
706
884
FY08 FY09 FY10 FY11 FY12
MARCH
2013

30 30
12
17 22
30 35
18
24
29
39 46
FY08 FY09 FY10 FY11 FY12
Advances Deposits
USD billion
For updated information, please visit www.ibef.org SUCCESS STORIES: HDFC, AXIS BANK
Success stories in the Indian banking sector: Axis Bank … (2/2)
Source: Company annual reports, Aranca Research
Banking
Advances and deposits Income break-up
60%
37%
3%
Net Interest income
Fee Income
Other Income
MARCH
2013

31 31
Contents
Advantage India
Market overview and trends
Growth drivers
Success stories: HDFC, Axis Bank
Opportunities
Useful information
For updated information, please visit www.ibef.org
Banking MARCH
2013
32 32
133 151
174 194
225 265
295
FY06 FY07 FY08 FY09 FY10 FY11QE
FY12RE
For updated information, please visit www.ibef.org OPPORTUNITIES
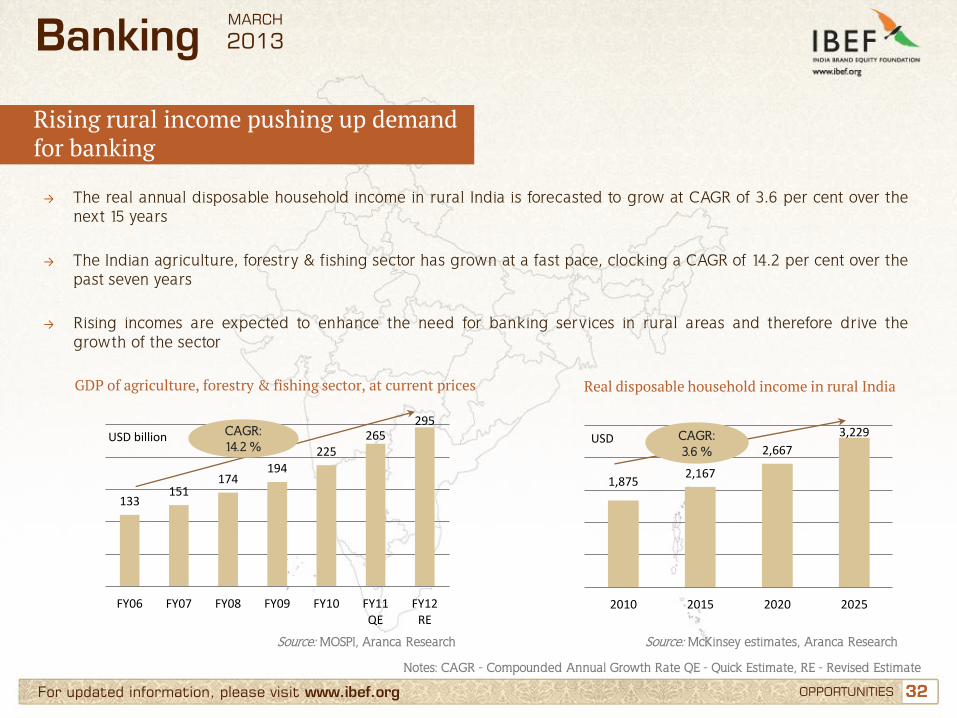
Rising rural income pushing up demand for banking
Notes: CAGR - Compounded Annual Growth Rate QE - Quick Estimate, RE - Revised Estimate
Banking
→ The real annual disposable household income in rural India is forecasted to grow at CAGR of 3.6 per cent over the next 15 years
→ The Indian agriculture, forestry & fishing sector has grown at a fast pace, clocking a CAGR of 14.2 per cent over the past seven years
→ Rising incomes are expected to enhance the need for banking services in rural areas and therefore drive the growth of the sector
GDP of agriculture, forestry & fishing sector, at current prices
Source: MOSPI, Aranca Research
Real disposable household income in rural India
Source: McKinsey estimates, Aranca Research
1,875 2,167
2,667
3,229
2010 2015 2020 2025
USD billion USD CAGR: 14.2 %
CAGR: 3.6 %
MARCH
2013

33 33
0.4 9.2
15.2
24.29
37.48
40.36
2007 2008 2009 2010 2011 2012*
For updated information, please visit www.ibef.org
Mobile banking to provide a cost effective solution
Source: TRAI, Aranca Research Note: * - As on September 2012
Banking
Banking penetration is low in rural India
• Of the 600,000 village habitations in India only 5 per cent have a
commercial bank branch
• Only 40 per cent of the adult population has bank accounts
• Debit card holders constitute only 13 per cent of the population and
only 2 per cent have a credit card
• 51.4 per cent of nearly 89.3 million farm households do not have
access to any credit either from institutional or non-institutional
sources
• Only 13 per cent of farm households are availing loans from the
banks in the income bracket of < USD1000
Soaring rural teledensity opens avenue of mobile banking
→ Agriculture requires timely credit to enable smooth functioning. However, only one-eighth of farm households avail bank credit
→ Local money-lending practices involve interest rates well above 30 per cent, therefore making bank credit a compelling alternative
→ Tele-density in rural India soared to nearly 40.4 per cent in 2012* from less than 1 per cent in 2007
→ Banks, telecom providers and RBI are making efforts to make inroads into the un-banked rural India through mobile banking solutions
OPPORTUNITIES
%
MARCH
2013

34 34
Mobile commerce
Payment of bills
Mobile banking (fund transfers,
etc.)
Mobile recharge
Mobile remittances
For updated information, please visit www.ibef.org
Mobile banking to transform the banking space
Banking
OPPORTUNITIES
• Mobile banking allows customers to avail banking services on the move through their mobile phones. The growth of mobile banking could impact the banking sector significantly
• Mobile banking across the world is still at a primitive stage with countries like China, India and UAE taking the lead
• Mobile banking is especially critical for countries like India, as it promises to provide an opportunity to provide banking facilities to a previously under-banked market
• RBI has taken several steps to enable mobile payments, which forms an important part of mobile banking; the central bank has recently removed the transaction limit of INR50,000 and allowed banks to set their own limits
• Mobile banking transactions in India will cross 340 million by 2015 and would result in cost savings of approximately INR11 billion (USD230 million)
Evolution of mobile banking
Key services provided through mobile banking
Source: PWC, ‘Searching for new frontiers of growth’, Aranca Research
MARCH
2013

35 35
Contents
Advantage India
Market overview and trends
Growth drivers
Success stories: HDFC, Axis Bank
Opportunities
Useful information
For updated information, please visit www.ibef.org
Banking MARCH
2013

36 36 For updated information, please visit www.ibef.org USEFUL INFORMATION
Industry Associations
Indian Banks' Association World Trade Centre, 6th Floor Centre 1 Building, World Trade Centre Complex, Cuff Parade, Mumbai - 400 005 India E-mail: [email protected]
Banking MARCH
2013

37 37 For updated information, please visit www.ibef.org
Glossary
→ ATM: Automated Teller Machines
→ CAGR: Compound Annual Growth Rate
→ FY: Indian financial year (April to March)
→ GDP: Gross Domestic Product
→ INR: Indian Rupee
→ KYC: Know Your Customer
→ NIM: Net interest margin
→ NPA: Non-performing assets
→ RBI: Reserve Bank of India
→ USD: US Dollar → Conversion rate used: USD1=INR 48
→ Wherever applicable, numbers have been rounded off to the nearest whole number
USEFUL INFORMATION
Banking MARCH
2013
38
India Brand Equity Foundation (IBEF) engaged Aranca to prepare this presentation and the same has been prepared by Aranca in consultation with IBEF. All rights reserved. All copyright in this presentation and related works is solely and exclusively owned by IBEF. The same may not be reproduced, wholly or in part in any material form (including photocopying or storing it in any medium by electronic means and whether or not transiently or incidentally to some other use of this presentation), modified or in any manner communicated to any third party except with the written approval of IBEF. This presentation is for information purposes only. While due care has been taken during the compilation of this
presentation to ensure that the information is accurate to the best of Aranca and IBEF’s knowledge and belief, the content is not to be construed in any manner whatsoever as a substitute for professional advice. Aranca and IBEF neither recommend nor endorse any specific products or services that may have been mentioned in this presentation and nor do they assume any liability or responsibility for the outcome of decisions taken as a result of any reliance placed on this presentation. Neither Aranca nor IBEF shall be liable for any direct or indirect damages that may arise due to any act or omission on the part of the user due to any reliance placed or guidance taken from any portion of this presentation.
For updated information, please visit www.ibef.org DISCLAIMER
Banking MARCH
2013
Disclaimer


