

BASEL II and its implications
May 2008Hazel Taylor David Robertson Alan Smith
Head of Regulatory Reporting
Head of Programme Delivery
Head of Risk Strategy

2
Forward-looking statements
This presentation and subsequent discussion may contain certain forward-looking statements with respect to the financial condition, results of operations and business of the Group.
These forward-looking statements represent the Group’s expectations or beliefs concerning future events
and involve known and unknown risks and uncertainty that could cause actual results, performance or
events to differ materially from those expressed or implied in such statements.
Additional detailed information concerning important factors that could cause actual results to differ
materially is available in our Annual Report.

3
Content
• The journey to Basel II (David Robertson)
• HSBC Basel II analysis and disclosure (Hazel Taylor)
• Pillar 2 and stress testing in a Basel II environment (Alan Smith)

The journey to Basel II

5
The journey to Basel II
Major five-year infrastructure programme
• Development of Group and local models for PD, LGD and EAD
• Central system to capture granular data from 83 countries and generate RWA calculations
• Contrast with relative simplicity of Basel I process
• FSA approval given for majority IRBA approach for credit risk
6
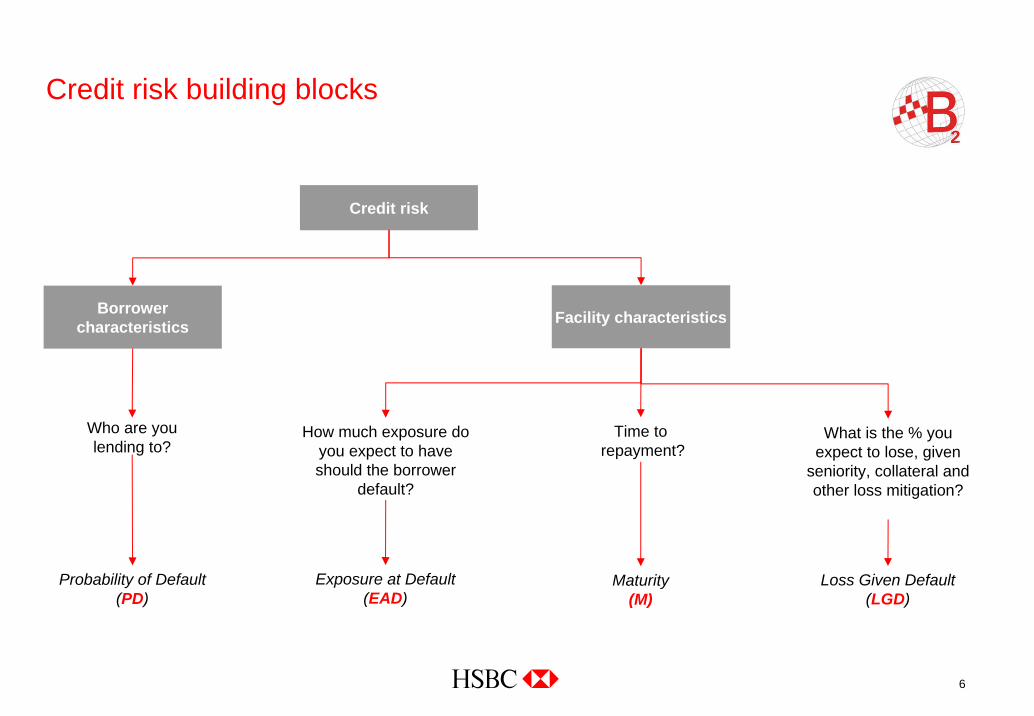
Credit risk building blocks
Credit risk
Borrower characteristics
Who are you lending to?
Probability of Default (PD)
Facility characteristics
How much exposure do you expect to have should the borrower
default?
Exposure at Default (EAD)
Time torepayment?
Maturity(M)
What is the % you expect to lose, given
seniority, collateral and other loss mitigation?
Loss Given Default (LGD)

7
Basel II capital calculations
Expected Loss (EL)
• PD x LGD x EAD
• Excess of EL over impairment allowances is a deduction from capital
Unexpected Loss (UL)
• Capital requirement (K) determined by regulatory formulae for each asset type
• PD, LGD and Maturity are factors
• RWA = K x 12.5 x EAD x 1.06 (scaling factor)

8
Generic example 1Corporate: Unexpected and Expected Loss
PD floor (0.03%)
0
5
10
15
20
25
30
35
AAA AA+ AA AA- A+ A A- BBB+ BBB BBB- BB+ BB BB- B+ B B- CCC
Implied external rating equivalent PDs
Reg
ulat
ory
capi
tal r
equi
rem
ent a
nd E
L (%
of E
AD
)
Unexpected LossExpected Loss
Unexpected Loss
Expected Loss
PD = 0.1%
PD = 10.0%
PD = 1.0%
M = 2.5 years; LGD = 45%
9
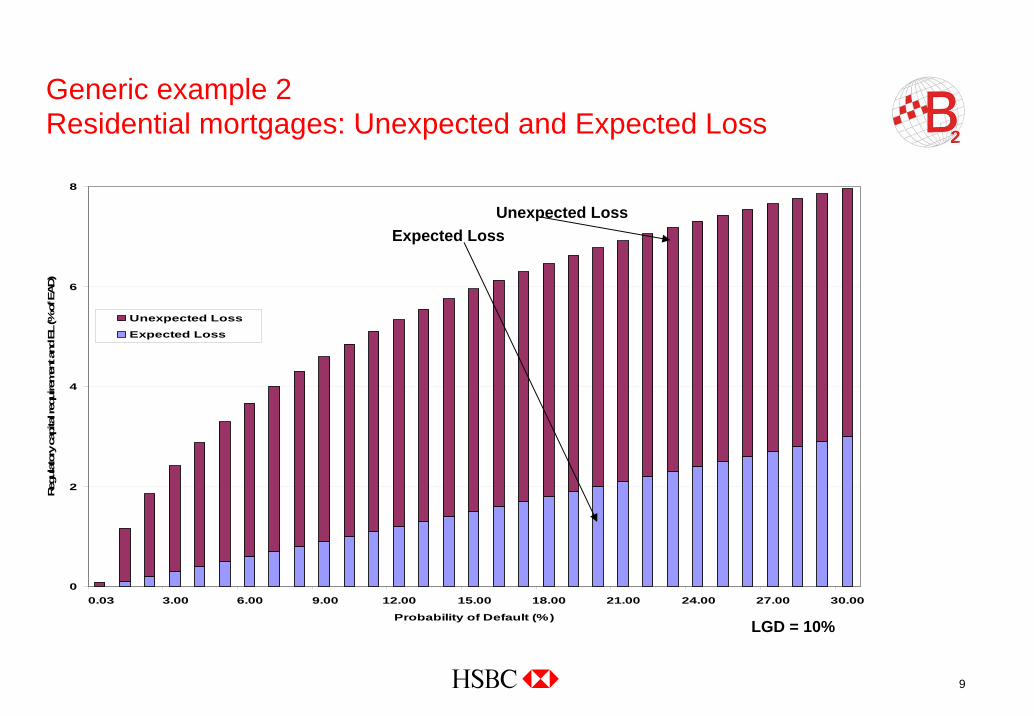
Generic example 2Residential mortgages: Unexpected and Expected Loss
0
2
4
6
8
0.03 3.00 6.00 9.00 12.00 15.00 18.00 21.00 24.00 27.00 30.00
Probability of Default (%)
Reg
ulat
ory
capi
tal r
equi
rem
ent a
nd E
L (%
of E
AD)
Unexpected Loss
Expected Loss
LGD = 10%
Unexpected LossExpected Loss

10
Generic example 3Corporate: impact of increasing LGDs
0
10
20
30
40
50
AAA AA+ AA AA- A+ A A- BBB+ BBB BBB- BB+ BB BB- B+ B B- CCC
Implied external rating equivalent PD
Reg
ulat
ory
capi
tal a
nd E
L (%
of E
AD)
PD = 0.1%
PD = 10.0%
PD = 1.0%
LGD = 65%
LGD = 45%
M = 2.5 years

11
Generic example 4Residential mortgages: impact of increasing LGDs
0
5
10
15
20
25
0.03 3.00 6.00 9.00 12.00 15.00 18.00 21.00 24.00 27.00 30.00
Probability of Default (%)
Reg
ulat
ory
capi
tal a
nd E
L (%
of E
AD)
LGD = 25%
LGD = 10%
HSBC Basel II analysis and disclosure

13
Disclosures
Narrative disclosures:
• Capital management and allocation
• Capital measurement– What the FSA requires– Local requirements may differ
– Not all on Basel II locally– But must do Basel II for Group reporting

14
Disclosures
Narrative disclosures (cont’d)
• IRBA for majority of businesses wef 1 January 2008
• IRBA is more risk-sensitive and relies on the bank’s own assessment of risk
• There is no going back! (from IRBA to STDA)
• Operational risk – using standardised approach for Group
• Capital base impacts– Collective impairment allowances– Expected losses less impairment allowances
• Pillar 2 – linked to capital management framework
• Pillar 3 – first disclosures qualitative during 2008, quantitative during first half of 2009 as at 31 December 2008

15
Analysis
Basel I versus Basel II (as at 31Dec07)
• Capital base reduced by USD20 billion due to collective impairment allowances removed and EL adjustment
• RWAs at a similar level to Basel I (less than 1% difference)
• Overall impact was to reduce the tier 1 ratio from 9.3% to 9.0%
• And total capital ratio from 13.6% to 11.8%

16
Disclosures
Numerical disclosures on a pro-forma Basel II basis (as at 31Dec07):
15313.6%
1059.3%
948.4%
13311.8%
1029.0
918.1%
0
20
40
60
80
100
120
140
160
Core Tier 1 Total Tier 1 Total Capital
USD
bn
0
2
4
6
8
10
12
14
Rat
io (%
)
Basel I Basel II
• Composition of regulatory capital table– Core tier 1 USD91 billion, ratio 8.1%
– After 50% of EL adjustment USD4.5 billion
• Total tier 1 USD102 billion, ratio 9.0%
• Total capital USD133 billion, ratio 11.8%– After total EL adjustment of USD9 billion– After removal of collective impairment allowances of
USD11 billion
• Target– Tier 1 target range: 7.5% to 9.0%

17
Analysis
Basel II pro-forma RWAs of USD1,129 billion (as at 31Dec07)
• Analysis by risk type:– Credit risk USD976 billion (86%)– Market risk USD46 billion (4%)– Operational risk USD107 billion (10%)
• Basel I RWAs of USD1,124 billion– Analysis by type of book:– Banking book USD1,021 billion (91%)
– Trading book USD103 billion (9%)– Includes counterparty credit risk and market risk
Credit risk Market risk Operational risk
Banking book Trading book
Pillar 2 and stress testing in a Basel II environment

19
Market disciplineMinimum capital Supervisory review
Basel Pillar 2, HSBC ICAAP and Stress Testing
Pillar 1 Pillar 3Pillar 2Pillar 2
Regulatory requirements for external disclosure of risk
information
Minimum regulatory capital requirements for credit, market and
operational risk
Internal capital adequacy assessment process and
supervisory review
CAPITAL: Relationship between Pillar 1, Pillar 2 and the ICAAP
Pillar 1 ICAAPPillar 2• Minimum capital requirement
• Calculated using prescribed parameters (advanced or standardised)
• Point-in-time assessment
• Supervisory assessment – via the Individual Capital Guidance (ICG) – of amount of regulatory capital considered necessary to cover:
– Pillar 1 risks (including any uncertainties in their calculation); and
– Risks not included in Pillar 1
• Capital planning and stress testing is an important part of the assessment
• Firm's own assessment of its capital needs
• Economic capital is an important part of the framework to supplement the Pillar 1 regulatory capital analysis
• Stress analysis is carried out for the ‘1 in 25’ scenario

20
HSBC capital principles and stress testing
• Embodied in HSBC Capital Management Principles approved by the Group Management Board
• Capital – “the resources necessary to cover unexpected losses arising from the risk which HSBC accepts in the form of discretionary risk or runs in the form of non-discretionary risk”

21
HSBC stress testing framework and principles
• Stress testing covers the techniques used to assess all facets of risk vulnerability facing the HSBC Group and its operations
• HSBC stress testing approaches fall into two categories:– Sensitivity analysis (where the impact of a single factor is considered with all others being held unchanged); and – Scenario analysis (where the impact of changing multiple simultaneous factors are considered)
• Stress testing allows HSBC senior management to:– Build an understanding of the sensitivities around the core assumptions in the strategic and capital plans, allowing
senior management to formulate proactive mitigating management action should actual conditions start to reflect the stress scenario conditions
– Ensure that HSBC can meet its financial obligations across an economic cycle and it has sufficient capital to withstand a severe correction and/or a period of prolonged negative trading conditions
• Stress testing scenarios consider the full range of risks within the HSBC risk framework

22
Scenario stress testing process – critical features
ScenarioDefinitionDefine macro stress scenario
TranslationTranslate stress scenario into risk factors
CalculationCalculate Impact on drivers within risk categories
AggregationAggregate results
Analysis and ReportingAnalyse reports to highlight significant results
FeedbackGet feedback on results and concerns for new scenario definition
Stress scenario lifecycle

23
Stress testing governance
• Global stress testing oversight forum – group and regional level
• Scenarios – mandatory and optional
• Pillar 1 versus Pillar 2
• Mitigating actions and early warning indicators
• Benchmarks/Tolerance

Question & Answer


