
Anna Allen USDA-ARS-SJVASC | 9611 E. RIVERBEND AVE. PARLIER, CA 93648
Can Sugar Beet Juice Effluent Be Used as a Biofertilizer? WRPI/USDA WATERSHED MANAGEMENT PROJECT REPORT

1
Table of Contents
Acknowledgements ................................................................................................................................. 2
Executive Summary ................................................................................................................................. 2
Project Objectives ................................................................................................................................... 2
Project Approach ..................................................................................................................................... 3
Project Outcomes .................................................................................................................................... 4
Conclusions ............................................................................................................................................. 5
Tables and Figures ................................................................................................................................... 6

2
Acknowledgements
This project was supported by Hispanic-Serving Institution’s Education Program Grant no. 2015-
38422-24058 from the USDA National Institute of Food and Agriculture.
I would like to thank Dr. Gary Bañuelos for his guidance and support, and for his
encouragement to pursue this project. I would also like to thank the USDA-ARS facility in
Parlier, CA, for allowing me the use of the premises for the project. Lastly, I would like to thank
CSU Fresno and CSU San Bernardino for providing the opportunity for this WRPI/USDA
Watershed Management internship.
Executive Summary
When using sugar beets to produce ethanol, a waste byproduct is produced; this byproduct is beet
juice effluent (BJ). In this project, we attempted to determine whether or not this effluent would
be a feasible material for use as a soil biofertilizer to different crops. The three plant species
tested in this experiment were tomato, alfalfa, and tall wheat grass. Results obtained with this
project would provide information on the recycling and utilization of beet juice effluent as a
biofertilizer, rather than simply disposing of it as an undesired waste material. If successful, this
sugar beet byproduct from bioethanol production can be an added environmentally-friendly
bonus to the new green technology associated with ethanol production. Our results showed that
we can safely use beet juice effluent as a bioamendment for eight weeks with no significant
effects on the plants.
Project Objectives
The primary objective of this project was to determine the feasibility of applying sugar beet
juice effluent (Figure 1) as a soil biofertilizer to crops. Sugar beet effluent is a by-product of the
bio-ethanol process technology that uses sugar beet as a plant source for making ethanol. This
Commented [AA1]: (Brief overview of entire project)
Commented [AA2]: (This section should be an
introduction to the project, discuss your potential career
pathway as it pertains to the USDA, and convey what your
original goals were on this project. If your goals changed
over the course of the internship, mention the revised goals
and the reason for the change. You also should discuss the
specific project tasks you originally set out. If your tasks
varied from the original ones, discuss the changes and the
need for the changes.)

3
project aims at identifying recycling options for using residual sugar beet effluent as a
biofertilizer for agricultural production in Central California where sugar beet bioethanol is being
produced. The specific aim was to evaluate sugar beet effluent as a biofertilizer for growing
tomato, alfalfa, and tall wheatgrass. These plants were grown and irrigated with different
amounts of sugar beet effluent added as a fertilizer treatment (fertigation) to two different types
of soil under controlled environmental conditions. After eight weeks, plant growth and
nutritional quality were evaluated after the shoots were harvested, oven-dried, and acid digested.
Samples were analyzed for macro and micro-nutrients using inductively coupled plasma mass
spectrometry (ICPMS), according to Agilent manufacture protocol.
Project Approach
In this project, seeds from the following three plant species were germinated in promix soil:
tomato, alfalfa, and tall wheat grass. After 50 days, these plants were then transferred into two
soils; a low saline (LS) clay loam soil (EC of 2-4 dS/m) collected from Red Rock Ranch in Five
Points, CA, and a non-saline (NS) sandy loam soil (EC of <1 dS/m) collected from Parlier, CA
(Figure 2); these two soil types were chosen to help determine whether the effluent would have a
different effect on a crop depending on the soil type in which it was grown, i.e. LS clay loam soil
versus NS sandy loam soil. Once the plants were transplanted, they were grown under
greenhouse conditions in a completely randomized block. In the two soil types, we used the
following three fertigation treatments (BJ mixed with DI water and applied as irrigation water):
A) control (irrigated with DI water and Miracle Grow® fertilizer in a NS sandy loam soil); B)
soil application of 100% BJ effluent; and C) soil application of 100% effluent and ½ strength
Miracle Gro®. These respective treatments were applied in the afternoon for eight weeks, once
weekly on all plants (except for the controls, which received Miracle Gro® at the same rate as
Commented [AA3]: (Discuss what methods or steps you
took to achieve your goals and your tasks from the above
section. If your approach changed over the course of the
internship, discuss the changes and the reasons for the
changes.)

4
beet juice treatments once every two weeks). On days where the treatments were not applied, the
plants were irrigated daily with 50 mL DI water per pot in the afternoon.
After the treatment period was concluded, plants were all harvested from their pots, and
soil samples were collected. Fresh plant weights were taken immediately after harvest, and dry
weights were recorded after the plant and soil samples were oven-dried for 3 days at 60ºC. Plant
samples for the tomato, alfalfa, and tall wheat grass were then ground and extracted for chloride,
and then acid digested and analyzed for all nutrients by ICP analysis. Soil samples were ground
and then tested for pH, electrical conductivity (EC), chloride, and analyzed for all nutrients by
ICP analysis.
The main obstacle encountered during this trial was that the alfalfa inexplicably did not
grow well in the clay loam soil. Hence, alfalfa was only grown and treated in the sandy loam
soil.
Project Outcomes
The biomass of the tomato plants was reduced when treated with BJ effluent, especially with
Treatment C (100% BJ effluent and ½ strength Miracle Gro®) in the NS sandy loam soil. In tall
wheatgrass grown in NS sandy loam soil, Treatment B (100% BJ effluent applied to the soil)
slightly increased the biomass of the plants. However, the opposite effect was observed in
alfalfa (grown in NS sandy loam soil) with Treatment B; they experienced a decrease in biomass.
Between the two soil types, it was clear that the LS clay loam soil from the west side had
higher concentrations of chlorine, boron, calcium, selenium, manganese, potassium, and,
especially, sodium than the NS sandy loam soil from Parlier. In contrast, the NS sandy loam soil
consistently had higher levels of phosphorus.
Commented [AA4]: (This section should discuss your
results and an analysis of your results, if applicable. If your
results were unexpected or negative, try to explain the
reasons and what could have been done differently. If any
lessons were learned during the course of the internship,
mention them in this section.)
5
Among the plants, the tall wheatgrass, tomato, and alfalfa grown in LS clay loam had
exceptionally high concentrations of tissue boron, chlorine, sodium, and selenium, calcium,
manganese, magnesium, and sulfur. The soil type seemed to vastly influence the levels of the
above listed elements for all tested crops, while the BJ effluent treatments seemed to have no
significant impact on the elemental content in plants.
Conclusions
In this project, beet juice effluent was tested as a biofertilizer on three different plant species in
two different soils under greenhouse conditions: tomato, alfalfa, and tall wheat grass. After 8
weeks of applying the biofertilizer treatments to the soil via fertigation, it was apparent that plant
growth was affected by the BJ treatments, albeit in different ways. At this point, it is clear from
the data that plants of different types have different reactions to treatment BJ effluent. More
studies would be necessary to determine which plants could plausibly be treated with the BJ
effluent to experience a positive effect. However, it is clear that there were no obvious adverse
effects on the plants over during the eight weeks with the tested BJ treatments. Thus, it appears
in this study that the soil type has significantly more influence on the nutrient levels in the plants
than the BJ effluent.
Future studies should focus on increased duration of application of the BJ effluent, since
we only know BJ effluent is not harmful to alfalfa, tomato, and tall wheatgrass for eight weeks.
However, more extensive testing is required to know if this is the case for longer periods of BJ
effluent disposal on plant species. Studies should also focus on selecting other crops to test, and
at different concentrations of BJ effluent.

6
Tables and Figures
Figure 1. Beet Juice Effluent
Figure 2. Sandy loam soil from Parlier (left) and clay loam soil from Red Rock Ranch (right)
7
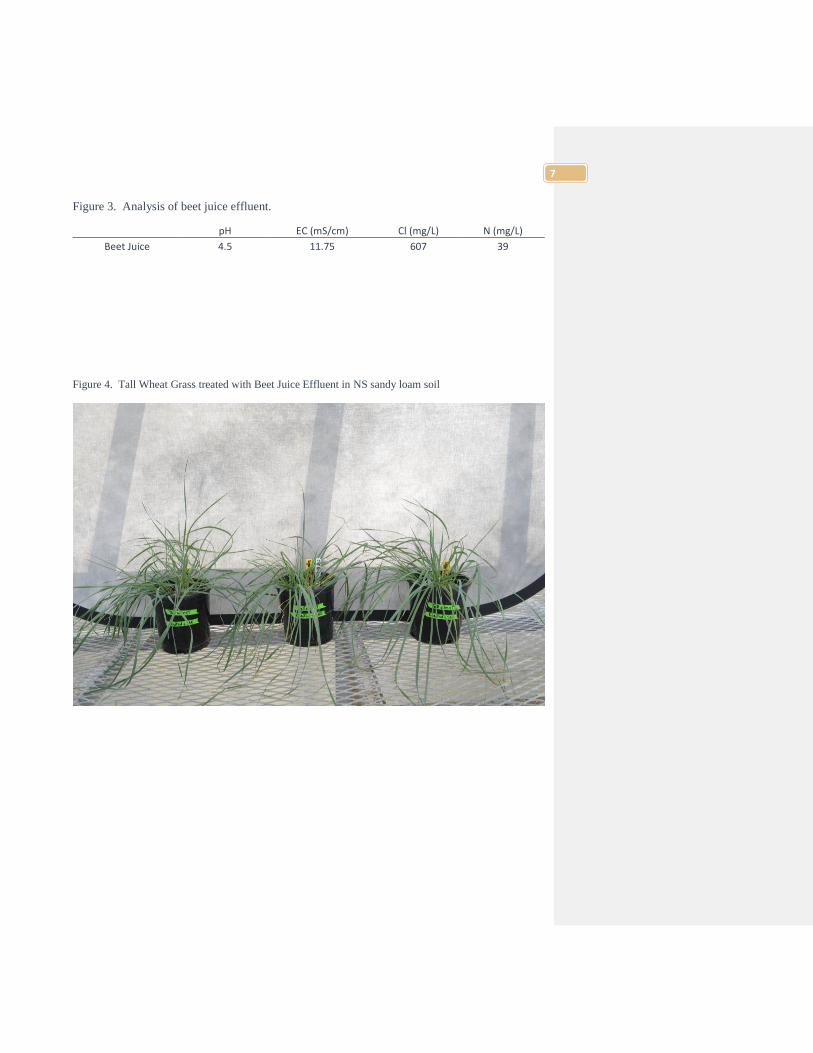
Figure 3. Analysis of beet juice effluent.
pH EC (mS/cm) Cl (mg/L) N (mg/L)
Beet Juice 4.5 11.75 607 39
Figure 4. Tall Wheat Grass treated with Beet Juice Effluent in NS sandy loam soil
8
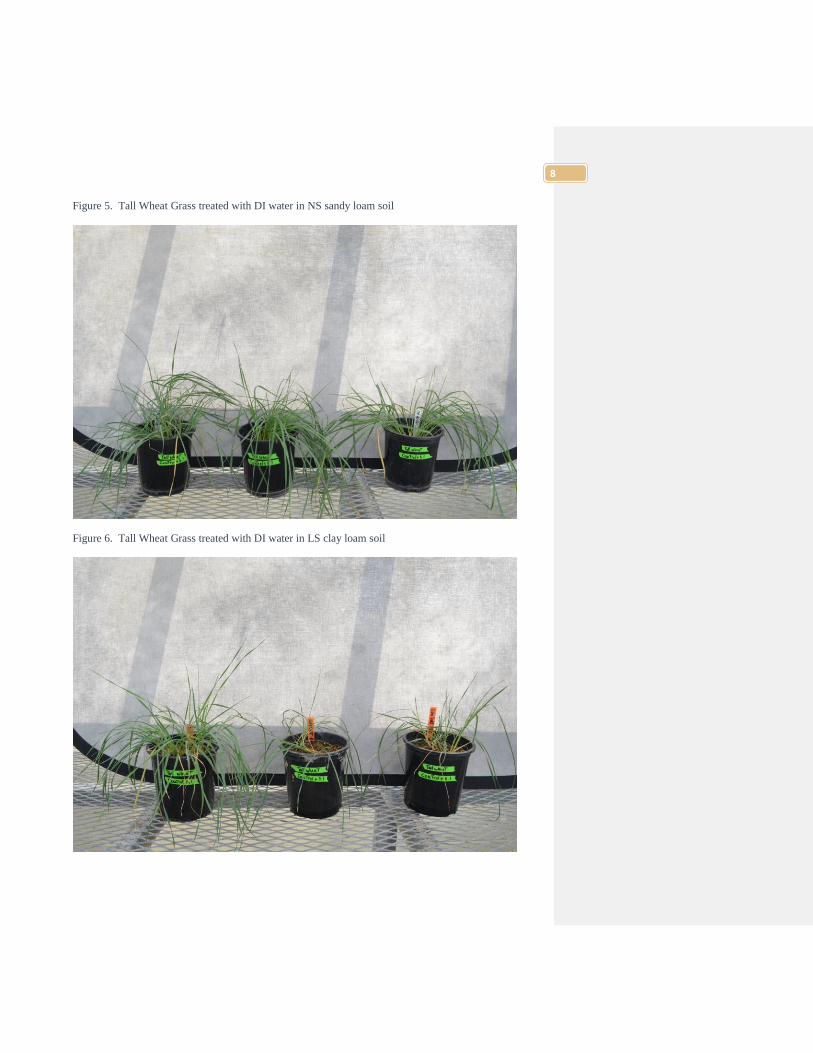
Figure 5. Tall Wheat Grass treated with DI water in NS sandy loam soil
Figure 6. Tall Wheat Grass treated with DI water in LS clay loam soil
9
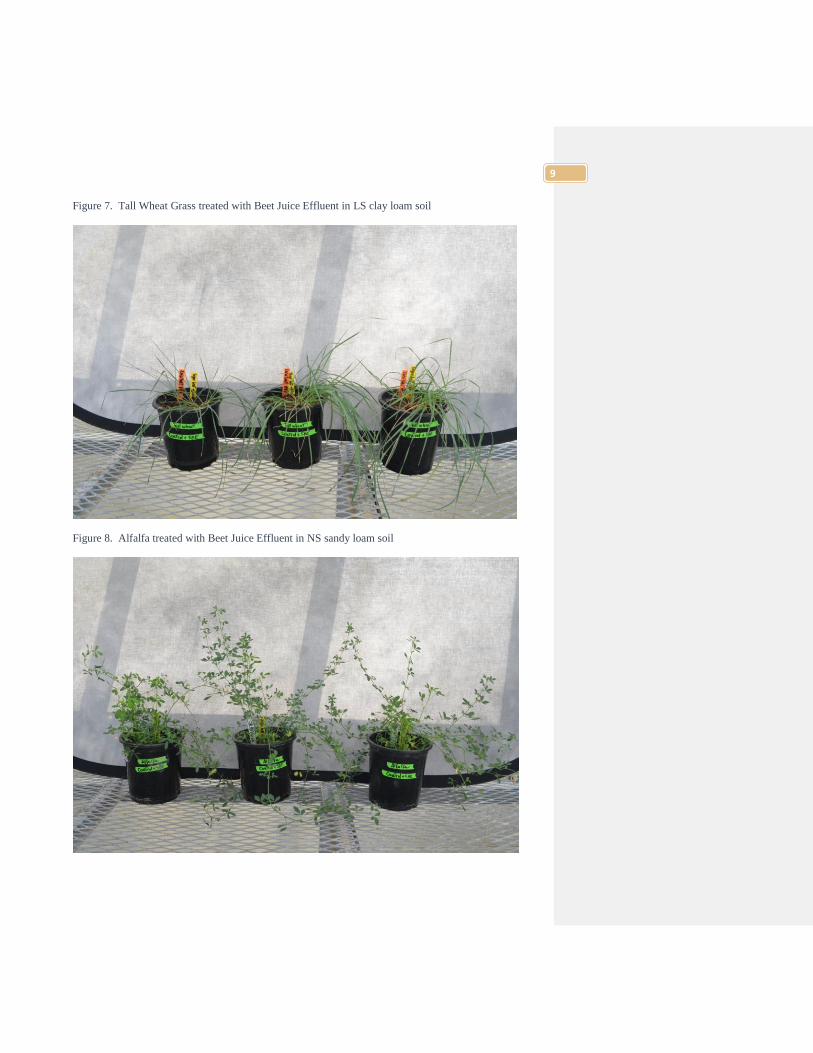
Figure 7. Tall Wheat Grass treated with Beet Juice Effluent in LS clay loam soil
Figure 8. Alfalfa treated with Beet Juice Effluent in NS sandy loam soil

10
Figure 9. Alfalfa treated with DI water in NS sandy loam soil
Figure 10. Tomato treated with DI water in NS sandy loam soil
11
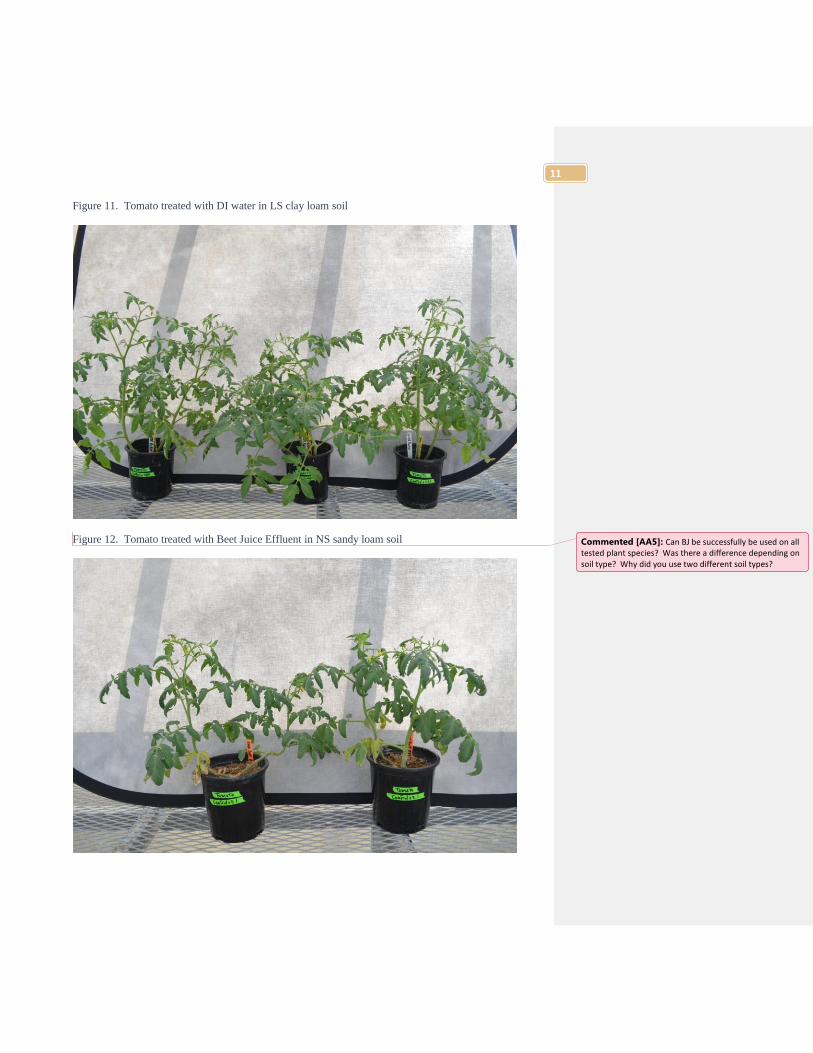
Figure 11. Tomato treated with DI water in LS clay loam soil
Figure 12. Tomato treated with Beet Juice Effluent in NS sandy loam soil
Commented [AA5]: Can BJ be successfully be used on all tested plant species? Was there a difference depending on soil type? Why did you use two different soil types?

12
Figure 13. Boron concentrations (mg/kg) in plants treated with BJ treatments
Figure 14. Calcium concentrations (mg/kg) in plants treated with BJ treatments
0
20
40
60
80
100
120
140
160
180
Alfalfa (NS sandyloam)
Tomato (LS clay loam) Tomato (NS sandyloam)
Tall Wheatgrass (LSclay loam)
Tall Wheatgrass (NSsandy loam)
B C
ON
CEN
TRA
TIO
NS
(MG
/KG
)
PLANT AND SOIL TYPE
Treatment A (DI water + fertilizer)
Treatment B (100% BJ effluent)
Treatment C (100% BJ effluent + 1/2 strength fertilizer)
0
5000
10000
15000
20000
25000
30000
35000
Alfalfa (NS sandyloam)
Tomato (LS clayloam)
Tomato (NS sandyloam)
Tall Wheatgrass (LSclay loam)
Tall Wheatgrass (NSsandy loam)
CA
CO
NC
ENTR
ATI
ON
S (M
G/K
G)
PLANT AND SOIL TYPE
Treatment A (DI water + fertilizer)
Treatment B (100% BJ effluent)
Treatment C (100% BJ effluent + 1/2 strength fertilizer)

13
Figure 15. Chlorine concentrations (mg/kg) in plants treated with BJ treatments
Figure 16. Copper concentrations (mg/kg) in plants treated with BJ treatments
0
5000
10000
15000
20000
25000
Alfalfa (NS sandyloam)
Tomato (LS clayloam)
Tomato (NS sandyloam)
Tall Wheatgrass (LSclay loam)
Tall Wheatgrass (NSsandy loam)
CL
CO
NC
ENTR
ATI
ON
S (M
G/K
G)
PLANT AND SOIL TYPE
Treatment A (DI water + fertilizer)
Treatment B (100% BJ effluent)
Treatment C (100% BJ effluent + 1/2 strength fertilizer)
0.0
5.0
10.0
15.0
20.0
25.0
30.0
35.0
40.0
Alfalfa (NS sandyloam)
Tomato (LS clay loam) Tomato (NS sandyloam)
Tall Wheatgrass (LSclay loam)
Tall Wheatgrass (NSsandy loam)
CU
CO
NC
ENTR
ATI
ON
S (M
G/K
G)
PLANT AND SOIL TYPE
Treatment A (DI water + fertilizer)
Treatment B (100% BJ effluent)
Treatment C (100% BJ effluent + 1/2 strength fertilizer)

14
Figure 17. Iron concentrations (mg/kg) in plants treated with BJ treatments
Figure 18. Potassium concentrations (mg/kg) in plants treated with BJ treatments
0
20
40
60
80
100
120
140
160
180
200
Alfalfa (NS sandyloam)
Tomato (LS clay loam) Tomato (NS sandyloam)
Tall Wheatgrass (LSclay loam)
Tall Wheatgrass (NSsandy loam)
FE C
ON
CN
TRA
TIO
NS
(MG
/KG
)
PLANT AND SOIL TYPE
Treatment A (DI water + fertilizer)
Treatment B (100% BJ effluent)
Treatment C (100% BJ effluent + 1/2 strength fertilizer)
0
5000
10000
15000
20000
25000
30000
35000
40000
Alfalfa (NS sandyloam)
Tomato (LS clayloam)
Tomato (NS sandyloam)
Tall Wheatgrass (LSclay loam)
Tall Wheatgrass (NSsandy loam)
K C
ON
CEN
TRA
TIO
NS
(MG
/KG
)
PLANT AND SOIL TYPE
Treatment A (DI water + fertilizer)
Treatment B (100% BJ effluent)
Treatment C (100% BJ effluent + 1/2 strength fertilizer)

15
Figure 19. Magnesium concentrations (mg/kg) in plants treated with BJ treatments
Figure 20. Manganese concentrations (mg/kg) in plants treated with BJ treatments
0
1000
2000
3000
4000
5000
6000
7000
Alfalfa (NS sandyloam)
Tomato (LS clay loam) Tomato (NS sandyloam)
Tall Wheatgrass (LSclay loam)
Tall Wheatgrass (NSsandy loam)
MG
CO
NC
ENTR
ATI
ON
S (M
G/K
G)
PLANT AND SOIL TYPE
Treatment A (DI water + fertilizer)
Treatment B (100% BJ effluent)
Treatment C (100% BJ effluent + 1/2 strength fertilizer)
0
20
40
60
80
100
120
Alfalfa (NS sandyloam)
Tomato (LS clay loam) Tomato (NS sandyloam)
Tall Wheatgrass (LSclay loam)
Tall Wheatgrass (NSsandy loam)
MN
CO
NC
ENTR
ATI
ON
S (M
G/K
G)
PLANT AND SOIL TYPE
Treatment A (DI water + fertilizer)
Treatment B (100% BJ effluent)
Treatment C (100% BJ effluent + 1/2 strength fertilizer)

16
Figure 21. Molybdenum concentrations (mg/kg) in plants treated with BJ treatments
Figure 22. Sodium concentrations (mg/kg) in plants treated with BJ treatments
0.0
1.0
2.0
3.0
4.0
5.0
6.0
7.0
8.0
9.0
10.0
Alfalfa (NS sandyloam)
Tomato (LS clay loam) Tomato (NS sandyloam)
Tall Wheatgrass (LSclay loam)
Tall Wheatgrass (NSsandy loam)
MO
CO
NC
ENTR
ATI
ON
S (M
G/K
G)
PLANT AND SOIL TYPE
Treatment A (DI water + fertilizer)
Treatment B (100% BJ effluent)
Treatment C (100% BJ effluent + 1/2 strength fertilizer)
0
1000
2000
3000
4000
5000
6000
7000
Alfalfa (NS sandyloam)
Tomato (LS clay loam) Tomato (NS sandyloam)
Tall Wheatgrass (LSclay loam)
Tall Wheatgrass (NSsandy loam)
NA
CO
NC
ENTR
ATI
ON
S (M
G/K
G)
PLANT AND SOIL TYPE
Treatment A (DI water + fertilizer)
Treatment B (100% BJ effluent)
Treatment C (100% BJ effluent + 1/2 strength fertilizer)

17
Figure 23. Phosphorus concentrations (mg/kg) in plants treated with BJ treatments
Figure 24. Sulfur concentrations (mg/kg) in plants treated with BJ treatments
0
1000
2000
3000
4000
5000
6000
7000
8000
Alfalfa (NS sandyloam)
Tomato (LS clay loam) Tomato (NS sandyloam)
Tall Wheatgrass (LSclay loam)
Tall Wheatgrass (NSsandy loam)
P C
ON
CEN
TRA
TIO
NS
(MG
/KG
)
PLANT AND SOIL TYPE
Treatment A (DI water + fertilizer)
Treatment B (100% BJ effluent)
Treatment C (100% BJ effluent + 1/2 strength fertilizer)
0
1000
2000
3000
4000
5000
6000
7000
8000
Alfalfa (NS sandyloam)
Tomato (LS clay loam) Tomato (NS sandyloam)
Tall Wheatgrass (LSclay loam)
Tall Wheatgrass (NSsandy loam)
S C
ON
CEN
TRA
TIO
NS
(MG
/KG
)
PLANT AND SOIL TYPE
Treatment A (DI water + fertilizer)
Treatment B (100% BJ effluent)
Treatment C (100% BJ effluent + 1/2 strength fertilizer)

18
Figure 25. Selenium concentrations (mg/kg) in plants treated with BJ treatments
Figure 26. Zinc concentrations (mg/kg) in plants treated with BJ treatments
0.0
0.5
1.0
1.5
2.0
2.5
3.0
3.5
4.0
Alfalfa (NS sandyloam)
Tomato (LS clay loam) Tomato (NS sandyloam)
Tall Wheatgrass (LSclay loam)
Tall Wheatgrass (NSsandy loam)
SE C
ON
CEN
TRA
TIO
NS
(MG
/KG
)
PLANT AND SOIL TYPE
Treatment A (DI water + fertilizer)
Treatment B (100% BJ effluent)
Treatment C (100% BJ effluent + 1/2 strength fertilizer)
0
10
20
30
40
50
60
70
Alfalfa (NS sandyloam)
Tomato (LS clay loam) Tomato (NS sandyloam)
Tall Wheatgrass (LSclay loam)
Tall Wheatgrass (NSsandy loam)
ZN C
ON
CEN
TRA
TIO
NS
(MG
/KG
)
PLANT AND SOIL TYPE
Treatment A (DI water + fertilizer)
Treatment B (100% BJ effluent)
Treatment C (100% BJ effluent + 1/2 strength fertilizer)

19
Table 1. Fresh and dry weights of tomato, alfalfa, and tall wheatgrass irrigated with BJ treatments.
Plant Soil: Treated with: Rep:
Plant Fresh
Weight (g)
Plant Dried
Weight (g)
Plant Fresh
Mean and Std.
Dev.
Plant Dry
Mean and
Std. Dev.
Tomato LS Clay Loam Beet Effluent 1 0.96 0.82
Tomato LS Clay Loam Beet Effluent 2 6.68 1.68
Tomato LS Clay Loam Beet Effluent 3 2.34 0.99
Mean 3.33 1.17
Std. Deviation 2.99 0.46
Tomato LS Clay Loam DI Water 1 1.28 0.88
Mean 1.28 0.88
Std. Deviation 0.00 0.00
Tomato NS Sandy Loam DI Water 1 124.46 20.30
Tomato NS Sandy Loam DI Water 2 110.67 17.95
Tomato NS Sandy Loam DI Water 3 133.72 20.76
Mean 122.95 19.67
Std. Deviation 11.60 1.51
Tomato NS Sandy Loam Beet Effluent 1 130.78 16.24
Tomato NS Sandy Loam Beet Effluent 2 133.24 20.33
Tomato NS Sandy Loam Beet Effluent 3 137.86 19.73
Mean 133.96 18.77
Std. Deviation 3.59 2.21
Tomato LS Clay Loam DI Water 2 61.45 7.94
Tomato LS Clay Loam DI Water 3 62.47 8.45
Mean 61.96 8.20
Std. Deviation 0.72 0.36
Alfalfa NS Sandy Loam DI Water 1 17.46 4.48
Alfalfa NS Sandy Loam DI Water 2 22.21 5.22
Alfalfa NS Sandy Loam DI Water 3 19.49 5.29
Mean 19.72 5.00
Std. Deviation 2.38 0.45
Alfalfa NS Sandy Loam Beet Effluent 1 16.60 4.29
Alfalfa NS Sandy Loam Beet Effluent 2 16.64 3.91
Alfalfa NS Sandy Loam Beet Effluent 3 19.93 4.91
Mean 17.72 4.37
Std. Deviation 1.91 0.50
Tall Wheatgrass NS Sandy Loam DI Water 1 22.50 5.65
Tall Wheatgrass NS Sandy Loam DI Water 2 24.84 5.26
Tall Wheatgrass NS Sandy Loam DI Water 3 21.01 4.47
Mean 22.78 5.13
Std. Deviation 1.93 0.60
Tall Wheatgrass NS Sandy Loam Beet Effluent 1 30.52 6.85
Tall Wheatgrass NS Sandy Loam Beet Effluent 2 20.42 4.48
Tall Wheatgrass NS Sandy Loam Beet Effluent 3 31.15 7.23
Mean 27.36 6.19
Std. Deviation 6.02 1.49
Tall Wheatgrass LS Clay Loam DI Water 1 5.24 1.28
Tall Wheatgrass LS Clay Loam DI Water 2 15.87 3.28
Tall Wheatgrass LS Clay Loam DI Water 3 4.05 0.94
Mean 8.39 1.83
Std. Deviation 6.51 1.26
Tall Wheatgrass LS Clay Loam Beet Effluent 1 10.56 2.49
Tall Wheatgrass LS Clay Loam Beet Effluent 2 4.43 1.06
Tall Wheatgrass LS Clay Loam Beet Effluent 3 8.63 1.93
Mean 7.87 1.83
Std. Deviation 3.13 0.72


