1 icfi.com |
Benchmark development: UK and EU experience
Workshop on ‘Experience with Emission Benchmarks – Options for International Coordination’ October 1, 2015 Koreana Hotel, Seoul, South Korea Alistair Ritchie ICF International

2 icfi.com |
Agenda
• EU ETS Phases 1 & 2 (2005 to 2012) – UK Phase 2 BMs for new entrants – EU BMs for N2O for nitric acid plants
• EU ETS Phase 3 (2013 to 2020) – UK research for cement & steel sectors – UK & NL research for upstream oil & gas sectors – EC Phase 3 BM impact assessment – Phase 3 BM process, principles, BMs & allocation – Industry examples
• EU ETS Phase 4 (2021 to 2030) – EC Phase 4 impact assessment & proposals

3 icfi.com |
UK Phase 2 BMs for new entrants
EU ETS PHASES 1 & 2
• Sectors – Power & energy (combustion, other generation, LNG imports, gas
compressors, onshore terminals, gas storage) – Industry (refineries, integrated steelworks, electric arc steelmaking,
pulp & paper, cement, lime, gypsum, ceramics, glass) • Process
– Review of Phase 1 BMs, data sources & proposals for Phase 2: – Emission factors – Load factor (capacity utilisation factor) and capacity
– Stakeholder engagement & peer review • Evaluation
– Feasibility: input data verifiable? best practice for NEs? replicability? – Incentives for clean technology: differentiation avoided? – Competitiveness & impact on innovation: extent of NE needs met &
financial impacts – Consistency with incumbent allocation

4 icfi.com |
EU Phase 2 BMs for N2O from nitric acid plants (1)
EU ETS PHASES 1 & 2
• Process • Review of production processes, production levels &
GHG emissions; existing policies; abatement techs • Economic modelling of BM options • Evaluation (feasibility, env effectiveness, economic
impacts)
Current (2008) technology No of EU prod lines
Current EF (kgN2O/t HNO3)
None 28 3.7 to 12.8
Improved oxidation catalysts 14 3.6 to 9.7
Secondary catalysts 8 0.9 to 2.5
Both of above 4 1.5 to 1.9
Tertiary abatement 7 0.01 to 0.2
Overall 61 4.4

5 icfi.com |
EU Phase 2 BMs for N2O from nitric acid plants (2)
EU ETS PHASES 1 & 2
-60
-40
-20
0
20
40
60
80
100
120
kgN2O/tHNO3
M€
-3
-2
-1
0
1
2
3
4
5
6
MtC
O2e
Net Economic Impact, M€ 63 49 31 8 -15
Net Econ Impact 2.5 72 59 40 17 -6
Net Econ Impact 1.85 74.0 60.2 41.9 19.0 -3.9
Excess to market, MtCO2e 3.82 3.13 2.22 1.07 -0.08
1.85 1.7 1.5 1.3 1
Summary of economic impacts Benchmarks (kg N2O/t HNO3)
• Phase 2 (UK, NL, AT): 1.5 (2011), 1.3 (2012) • Phase 3 (EU): 1.0

6 icfi.com |
UK research on suitability of cement & steel Phase 2 New Entrant BMs for Phase 3 (1)
EU ETS PHASE 3
NE BM: no differentiation
Production, Tclinker
Process EF (standardised)
EF, tCO2/t clinker
times
Combustion EF
BAT Energy Consumption (standardised)
Average UK fuel mix EF
Production, Tclinker
Process EF (standardised)
EFtCO2/t clinker
times
Combustion EF
Installation Specific Kiln
Energy
Average UK fuel mix EF
Lepol
or
Precalciner
or
Preheater
or
Kiln Bypass Energy
Non-Carbonate Carbon Process
Emissions
+
times
+
Raw Material Moisture related
Energy
Wet
or
+
A3-4T: 4 technology differentiation plus non-carbonate C, moisture, kiln by-pass
A1-0T: differentiation for non-carbonate C; moisture A2-3T: 3 technology differentiation plus non-carbonate C, moisture, kiln bypass
7 icfi.com |
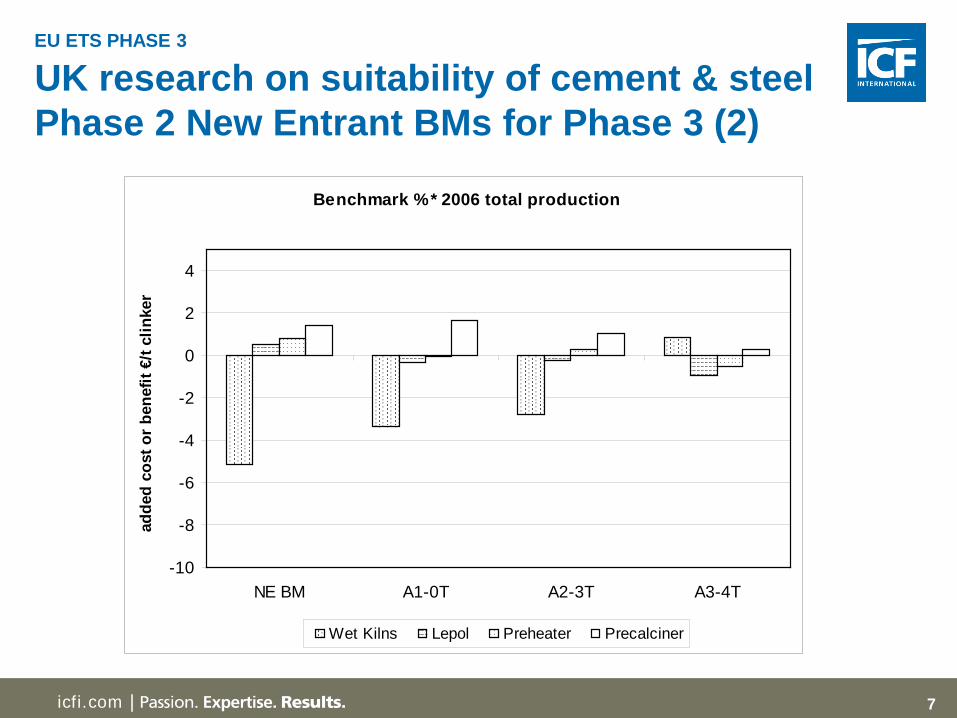
UK research on suitability of cement & steel Phase 2 New Entrant BMs for Phase 3 (2)
EU ETS PHASE 3
Benchmark % * 2006 total production
-10
-8
-6
-4
-2
0
2
4
NE BM A1-0T A2-3T A3-4T
adde
d co
st o
r ben
efit
€/t c
linke
r
Wet Kilns Lepol Preheater Precalciner

8 icfi.com |
UK & NL funded research on BM options for upstream oil & gas sector
EU ETS PHASE 3
• Objective
– Assess feasibility of developing product BMs for upstream oil & gas sector & review options
• Data collection – 182 EU installations in top 6 MSs; 67% provided usable data, 4 wks
Option Conclusions
1. Single product BM Simplest but does not correct for significant reservoir specific factors (properties, fluids, location)
2. Single product BM with some site specific factors
No single factor responsible for differences in emissions intensity
3. Differentiated product BM Inconsistent with approach for other sectors
4. Modular product BM for specific processes
Promising but further data / time required
5. Fallback approaches Selected option (heat and fuel BMs)

9 icfi.com |
EC Phase 3 BM impact assessment - options EU ETS PHASE 3
• Historic activity level (HAL)
– 2005-2007 (av) – 2007-2008 (av) – 2005-2008 (av) – 2005-2008 (drop min av) – 2005-2009 (drop min av)
• Heat production BM value – Nat gas & 93% efficiency – Nat gas & 90% efficiency – Biomass – Av fuel mix & efficiency (all
installations or FB installations; or sectoral)
– Av of top 10%
• Fuel BM value
– Natural gas – Biomass – Av fuel mix (all installations or FB
installations; or sectoral) – Av of top 10%
• Waste gases – No allocation for waste gases – Full allocation to producer or user – Partial allocation to user – Allocation to both (nat gas or coal)
• Effort sharing factors – None, installation specific, sector
specific, harmonised • Cement sector
– clinker, cement, hybrid

10 icfi.com |
EC Phase 3 BM impact assessment - impacts EU ETS PHASE 3
• Allowance allocations vs emissions • Production cost increases, accounting for assumed cost pass through • Trade and investment • GDP • Industry and consumer prices • Employment impacts • Administrative costs

11 icfi.com |
Overall Phase 3 BM development process EU ETS PHASE 3
• BM development
– Development of BM principles, including ambition level – Assessment and selection of BM products and methodology per product – Industry engagement – Development of BM data collection, QA/QC & verification procedures – Data collection by industry, applying the above rules and requirements – Data analysis & development of BMs per product and per fallback option – Verification of BMs – Impact assessment (cost-benefit analysis) of BM proposals – Adoption of BMs
• BM allocation implementation – Capacity building processes on BMs and data collection with Member
States – Implementation of BM allocations (development of National
Implementation Measures (NIMs), verification of NIMs) – Evaluation of BMs

12 icfi.com |
BM principles and types EU ETS PHASE 3
• Principles
– One benchmark for one product – No corrections for type of
technology, fuel, raw material etc
– Possible where products can be defined & enough installations
– BM level set at average of top decile performance per product
• Types
Takes into account Final energy consumption
Energy conversion efficiency
Fuel choice
Product benchmark
Heat benchmark Х
Fuel benchmark Х Х
Historical emissions Х Х Х

13 icfi.com |
Product benchmarks under EU ETS EU ETS PHASE 3

14 icfi.com |
Sub-installations EU ETS PHASE 3
15 icfi.com |
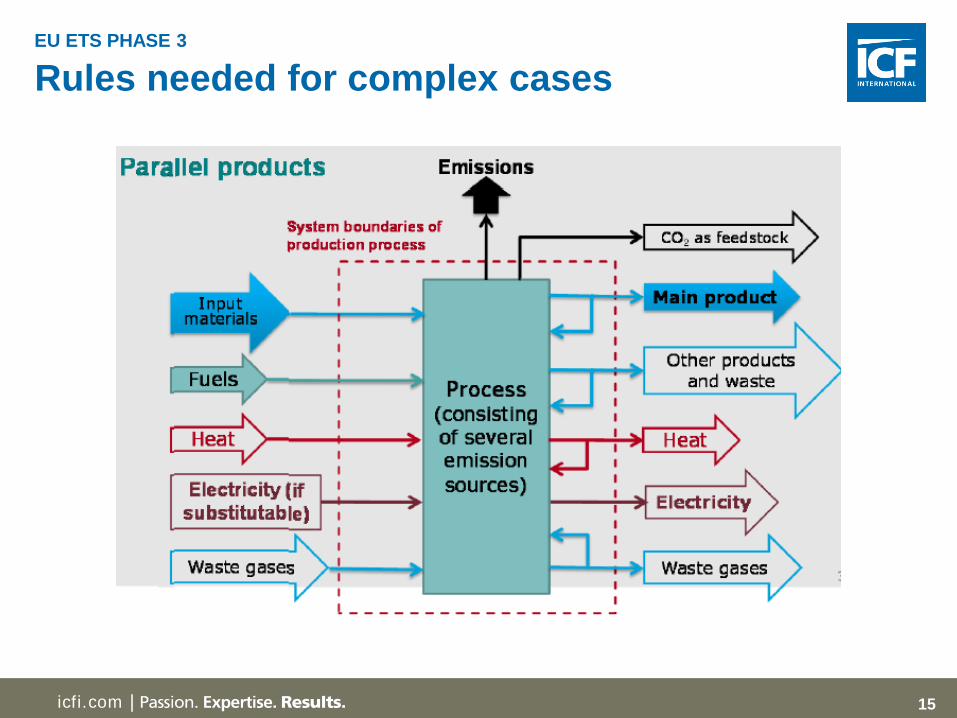
Rules needed for complex cases EU ETS PHASE 3
16 icfi.com |
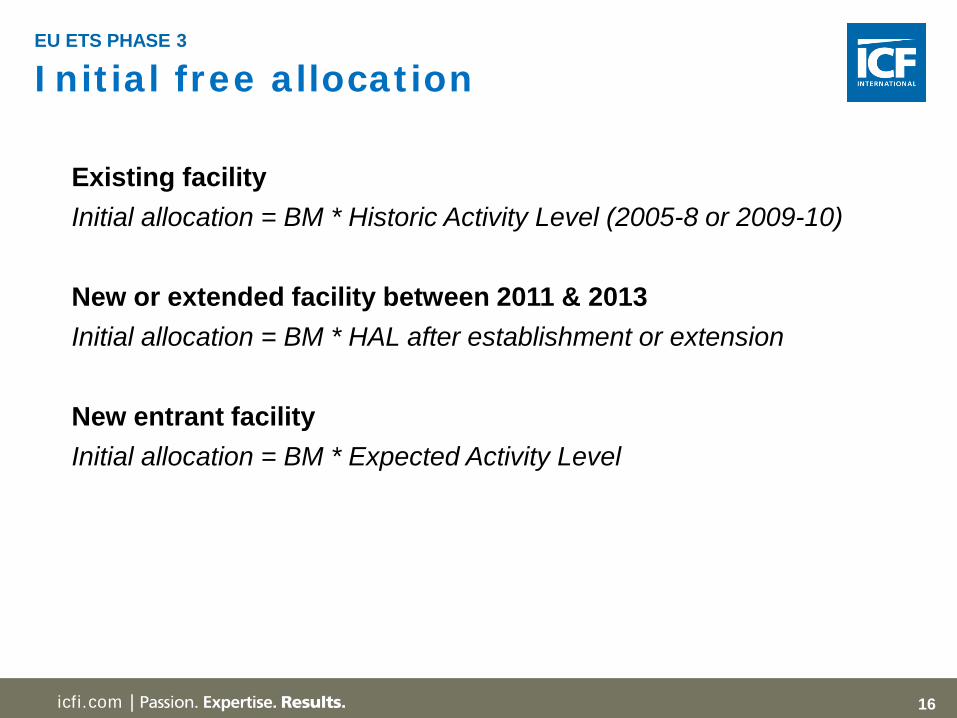
Initial free allocation
EU ETS PHASE 3
Existing facility Initial allocation = BM * Historic Activity Level (2005-8 or 2009-10) New or extended facility between 2011 & 2013 Initial allocation = BM * HAL after establishment or extension New entrant facility Initial allocation = BM * Expected Activity Level
17 icfi.com |
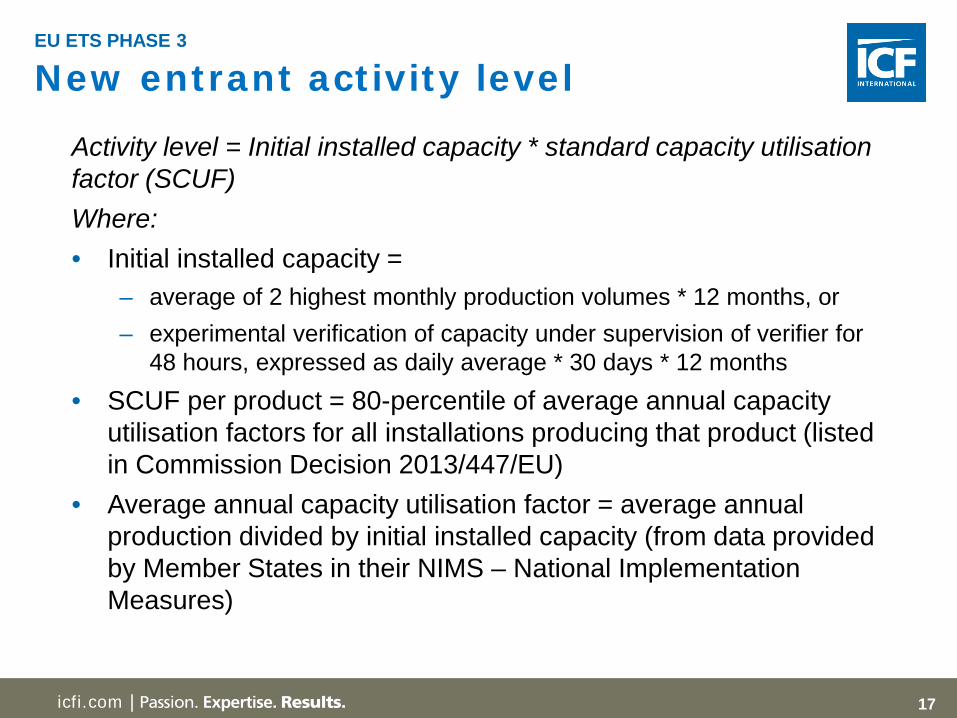
New entrant activity level EU ETS PHASE 3
Activity level = Initial installed capacity * standard capacity utilisation factor (SCUF) Where: • Initial installed capacity =
– average of 2 highest monthly production volumes * 12 months, or – experimental verification of capacity under supervision of verifier for
48 hours, expressed as daily average * 30 days * 12 months • SCUF per product = 80-percentile of average annual capacity
utilisation factors for all installations producing that product (listed in Commission Decision 2013/447/EU)
• Average annual capacity utilisation factor = average annual production divided by initial installed capacity (from data provided by Member States in their NIMS – National Implementation Measures)
18 icfi.com |
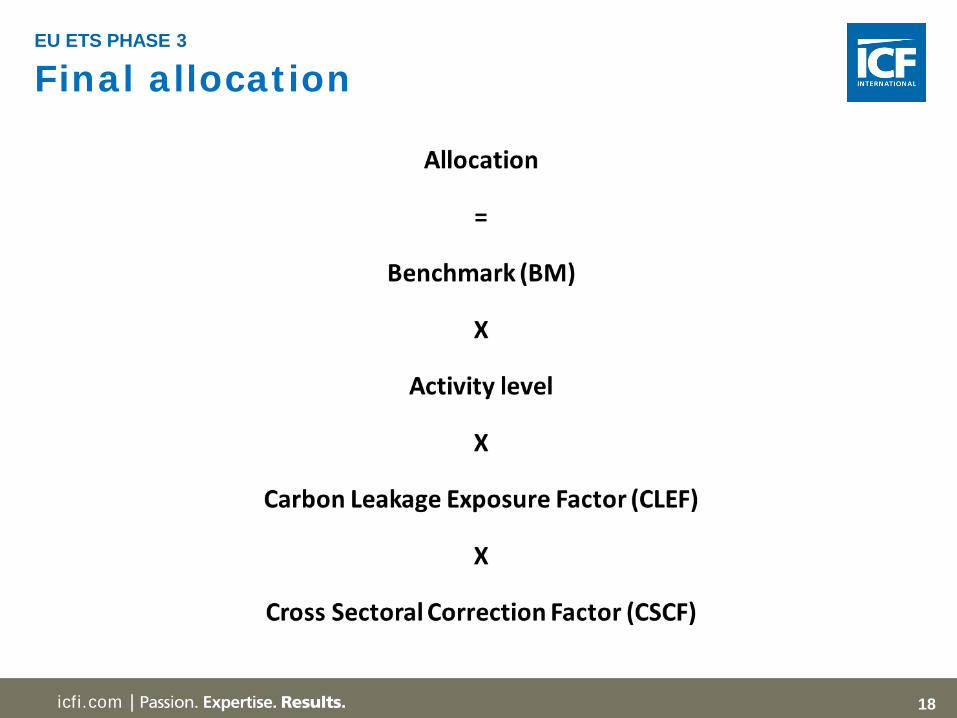
Final allocation
EU ETS PHASE 3

19 icfi.com |
Cross Sectoral Correction Factor EU ETS PHASE 3
Cross sectoral correction factor (CSCF)

20 icfi.com | 20
EU ETS PHASE 3
Example - Major EU refinery company • Continuously improving refinery company can
gain advantage with BM based allocation • 15% reduction achieved since 2010 through:
– Heat integration to reduce steam consumption – Improve heater efficiency, operation of
equipment – Replacement of old steam turbines by new
engine – Switching to less CO2 intensive fuels
21 icfi.com | 21
EU ETS PHASE 3
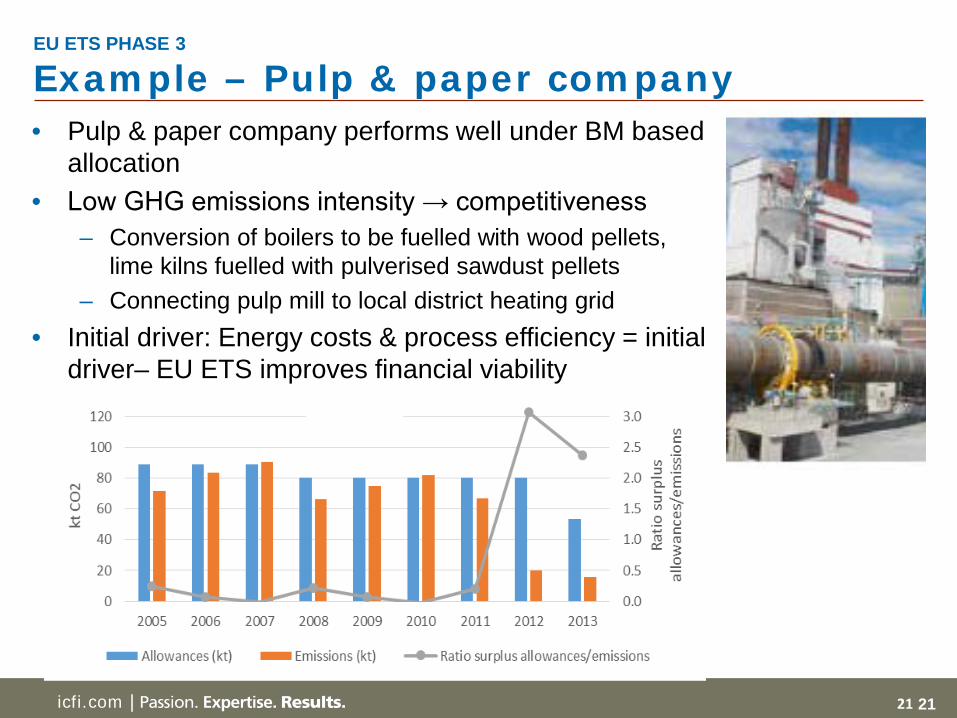
Example – Pulp & paper company • Pulp & paper company performs well under BM based
allocation • Low GHG emissions intensity → competitiveness
– Conversion of boilers to be fuelled with wood pellets, lime kilns fuelled with pulverised sawdust pellets
– Connecting pulp mill to local district heating grid • Initial driver: Energy costs & process efficiency = initial
driver– EU ETS improves financial viability
.
22 icfi.com | 22
EU ETS PHASE 3
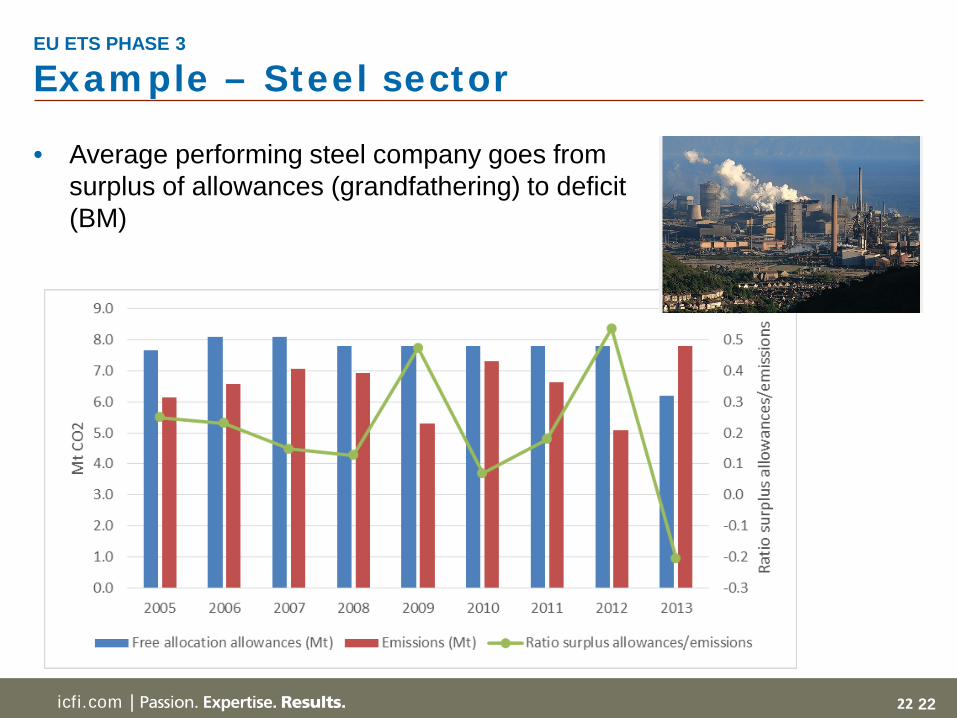
Example – Steel sector
• Average performing steel company goes from surplus of allowances (grandfathering) to deficit (BM)

23 icfi.com |
Example – Cement sector EU ETS PHASE 3

24 icfi.com |
EC Phase 4 allocation objectives EU ETS PHASE 4
• Auctioning of allowances remains the general rule, with the share of allowances to be auctioned at least 57% (the 2013-2020 share)
• Free allocation should continue to installations in sectors and sub-sectors at genuine risk of carbon leakage
• Operational objectives of Phase 4 benchmark design: – Reflect technological progress in industry sectors – Fully preserve incentives for industry to innovate – Most efficient installations do not face undue carbon costs leading to
carbon leakage – Better alignment with production levels – Avoid windfall profits – No increased administrative complexity
25 icfi.com |
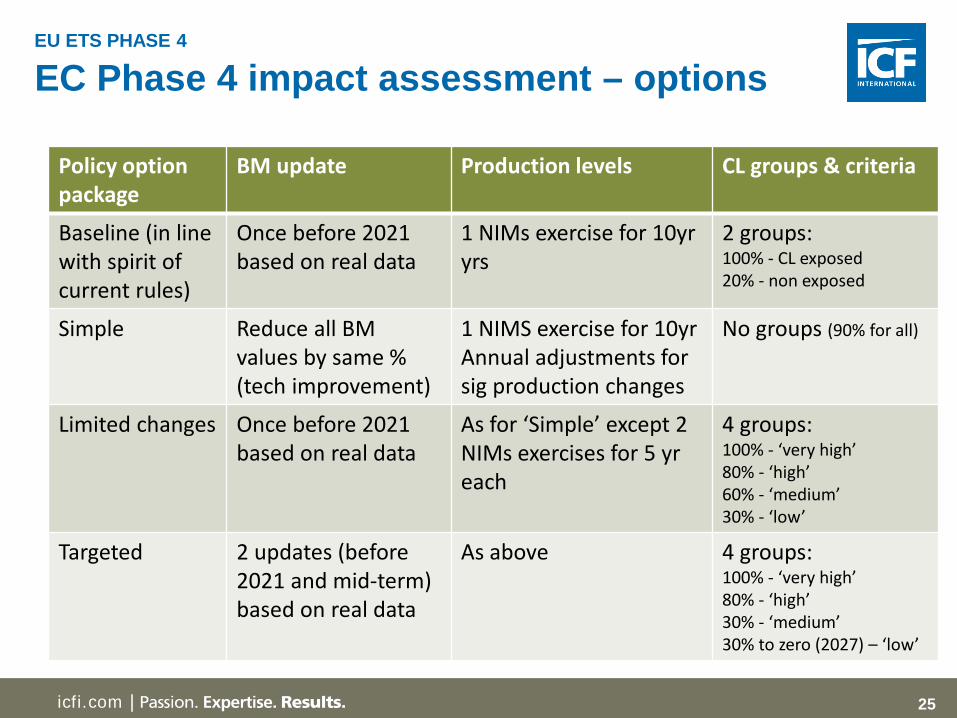
EC Phase 4 impact assessment – options EU ETS PHASE 4
Policy option package
BM update Production levels CL groups & criteria
Baseline (in line with spirit of current rules)
Once before 2021 based on real data
1 NIMs exercise for 10yr yrs
2 groups: 100% - CL exposed 20% - non exposed
Simple Reduce all BM values by same % (tech improvement)
1 NIMS exercise for 10yr Annual adjustments for sig production changes
No groups (90% for all)
Limited changes Once before 2021 based on real data
As for ‘Simple’ except 2 NIMs exercises for 5 yr each
4 groups: 100% - ‘very high’ 80% - ‘high’ 60% - ‘medium’ 30% - ‘low’
Targeted 2 updates (before 2021 and mid-term) based on real data
As above 4 groups: 100% - ‘very high’ 80% - ‘high’ 30% - ‘medium’ 30% to zero (2027) – ‘low’
26 icfi.com |
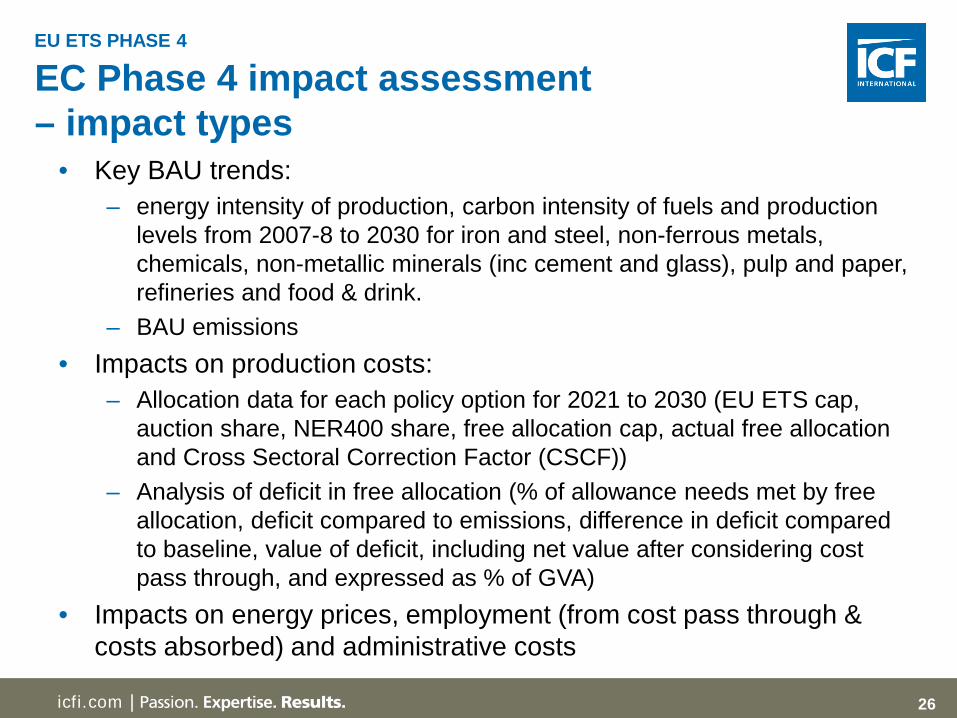
EC Phase 4 impact assessment – impact types
EU ETS PHASE 4
• Key BAU trends:
– energy intensity of production, carbon intensity of fuels and production levels from 2007-8 to 2030 for iron and steel, non-ferrous metals, chemicals, non-metallic minerals (inc cement and glass), pulp and paper, refineries and food & drink.
– BAU emissions • Impacts on production costs:
– Allocation data for each policy option for 2021 to 2030 (EU ETS cap, auction share, NER400 share, free allocation cap, actual free allocation and Cross Sectoral Correction Factor (CSCF))
– Analysis of deficit in free allocation (% of allowance needs met by free allocation, deficit compared to emissions, difference in deficit compared to baseline, value of deficit, including net value after considering cost pass through, and expressed as % of GVA)
• Impacts on energy prices, employment (from cost pass through & costs absorbed) and administrative costs

27 icfi.com |
EC Phase 4 impact assessment – Administrative cost template
EU ETS PHASE 3
Action Type of actor No of actors
Cost per actor Total annual-ised cost (€m/yr)
Measurement unit
Cost per unit (€k)
No of units Cost per actor (€k)
BM data collection
Develop rules, co-ordination & management
EC 1 FTE
Co-ordinate & collate with installations
EU Industry Association
20 Hour
Data collection & reporting Installations 10000 Hour
BM development
Review BM method Consultants 1 Project
BM development EU Industry Associations
20 Hour
BM verification EC 1 Project
NIMS exercise
Develop rules, co-ordination & management
EC 1 FTE
Data collection & reporting Installations 10000 Hour
Data verification Consultants 1 Project
Develop BM based allocations
MS Competent Authority
28+ Day

28 icfi.com |
EC Phase 4 impact assessment – overall EU ETS PHASE 4
Operational objectives Baseline Simple Limited changes
Targeted
Technological progress reflected
0 - 0 ++
Incentives to innovate fully preserved
0 + 0 -
No undue costs for most efficient installations
0 - ++ ++
Better alignment with production levels
0 + ++ ++
Avoid windfall profits 0 - + ++ No increased administrative complexity
0 ++ - --
29 icfi.com |
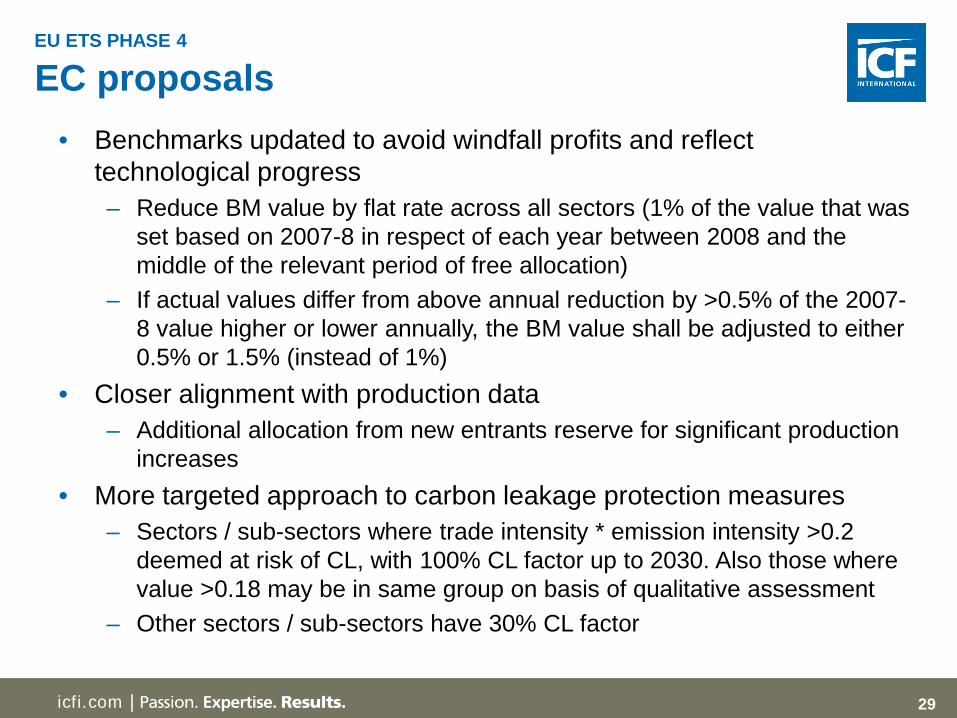
EC proposals EU ETS PHASE 4
• Benchmarks updated to avoid windfall profits and reflect
technological progress – Reduce BM value by flat rate across all sectors (1% of the value that was
set based on 2007-8 in respect of each year between 2008 and the middle of the relevant period of free allocation)
– If actual values differ from above annual reduction by >0.5% of the 2007-8 value higher or lower annually, the BM value shall be adjusted to either 0.5% or 1.5% (instead of 1%)
• Closer alignment with production data – Additional allocation from new entrants reserve for significant production
increases • More targeted approach to carbon leakage protection measures
– Sectors / sub-sectors where trade intensity * emission intensity >0.2 deemed at risk of CL, with 100% CL factor up to 2030. Also those where value >0.18 may be in same group on basis of qualitative assessment
– Other sectors / sub-sectors have 30% CL factor
30 icfi.com |
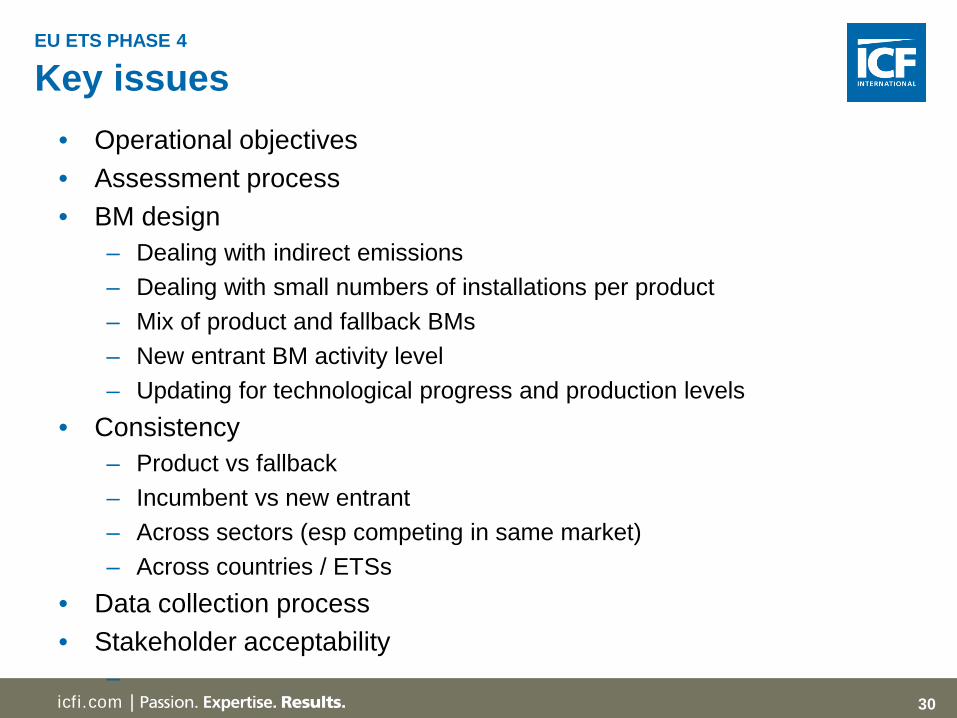
Key issues EU ETS PHASE 4
• Operational objectives • Assessment process • BM design
– Dealing with indirect emissions – Dealing with small numbers of installations per product – Mix of product and fallback BMs – New entrant BM activity level – Updating for technological progress and production levels
• Consistency – Product vs fallback – Incumbent vs new entrant – Across sectors (esp competing in same market) – Across countries / ETSs
• Data collection process • Stakeholder acceptability
–

31 icfi.com |
Questions?