

Copyright © 2012 Information Services Group, Inc. All Rights Reserved
Benchmarking Market Pricing
Rawdon Simon - ISG 31st May 2012

Copyright © 2012 Information Services Group, Inc. All Rights Reserved
Benchmarking Market Pricing
Why Benchmark? Uncover opportunities for improved efficiency
Determine a sourcing strategy
Sole Sourcing – don’t leave money on the table!
Ensure you are paying the right amount for your outsourced services

Copyright © 2012 Information Services Group, Inc. All Rights Reserved
Benchmarking Market Pricing
• Looked at from the perspective of your costs in providing the IT service
• Addresses all costs, both in-house and outsourced
• Typically used to uncover efficiency opportunities across in-house operations
• Uses costs data for comparison
Cost Benchmark
• Analyses the price you are paying your service provider for services received
• Typically used to analyse fees paid for already outsourced services or to determine fees for proposed outsourced services
• Only looks at outsourced fees for a specific set of services
• Uses price data for comparison
Price Benchmark
Types of Benchmark
Copyright © 2012 Information Services Group, Inc. All Rights Reserved
Benchmarking Market Pricing
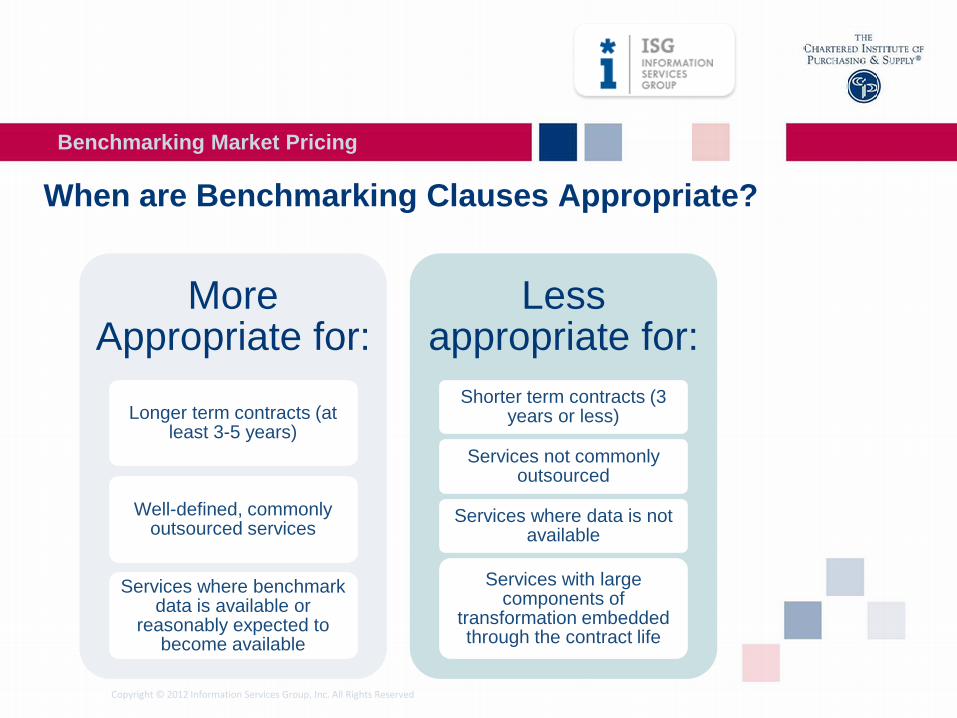
When are Benchmarking Clauses Appropriate?
More Appropriate for:
Longer term contracts (at least 3-5 years)
Well-defined, commonly outsourced services
Services where benchmark data is available or
reasonably expected to become available
Less appropriate for:
Shorter term contracts (3 years or less)
Services not commonly outsourced
Services where data is not available
Services with large components of
transformation embedded through the contract life

Copyright © 2012 Information Services Group, Inc. All Rights Reserved
Benchmarking Market Pricing
The Importance of Scope Application Development & Maintenance
(AD)P0/P8 Development Q0/Q6/QW Maintenance ZF Management & Tools
Mainframe (MF) Storage (ES) Servers (SP) Desktop (DT) Network (NW) Service Desk (SD)D1 Mainframe
Processors
B1 Transaction Processing
B2 Interactive Processing
B3 Batch ProcessingB4 VM ProcessingBF Mainframe
Databases
G3 Mainframe Planning
L5 Production ControlL6 Mainframe
OperationsLB Mainframe SupportM5 Mainframe Change
ZA Mainframe Management and Tools
E1 Disk StorageE2 Automatic Tape
Retrieval SystemsE3 Manual Tape StorageE4 Optical StorageM1 Backup and Restore
ZD Storage Management and Tools
DA Server ProcessorsDB Server FunctionBA Server Batch
Processing and Job Scheduling
BB Server Transaction Processing
BD Server DatabasesG5 Server Planning and
DesignK5 Server Hardware MACK6 Server Software
DistributionL8 Server SupportL9 Server Hardware
MaintenanceLA Server Monitoring and
SupervisionM7 Server System
Administration
ZG Server Management and Tools
B8 Common Office Applications
BC EmailD6 Personal ComputersD7 Infrastructure ServersD8 Thin Clients F9 Distributed Printers
G1 Desktop Planning and Design
K1 Desktop MACK2 Desktop Software
DistributionL1 Common Software
SupportL3 Desktop Hardware
MaintenanceM8 Infrastructure Server
AdministrationN3 Desktop Training
ZJ Desktop Management and Tools
A1 LAN ArchitectureA2 LAN SwitchingA3 LAN RoutingAA LAN Planning &
DesignAB LAN ChangesAC LAN SupportAD LAN Operations
W1 WAN ArchitectureW2 WAN SwitchingW3 WAN RoutingWA WAN Planning &
DesignWB WAN ChangesWCWAN SupportWDWAN Operations
V1 Voice ArchitectureV2 Voice PBX/CentrexV4 VoIPVA Voice Planning &
DesignVB Voice ChangesVC Voice SupportVD Voice Operations
X1 Contact CentreX2 Network SecurityX3 Remote Network
AccessX4 CablingX5 Internet Connectivity
YP Network total HW and SW costs
ZP Network Line Management and Tools
C3 Central Service DeskC4 Local Service DeskC5 Incident Management
& Problem Management
ZM Service Desk Management and Tools
Central Printing (CP) Surveys (SU)
F1 Laser PrintingF2 Impact PrintingF3 COM ProductionF7 Post ProcessingF8 Enveloping
ZV Central Printing Management and Tools
UA User ProfileUB User Problem SolvingUC Support SatisfactionUD Office Technology
SatisfactionUE Business Systems
SatisfactionUF Overall SatisfactionUP Employee
QuestionnaireUZ User Population
Management Services (MS) Telecoms (TC) Middleware & Applications (MA)I4 Executive
ManagementI3 Central
ServicesI7 Outsourcer
Management
M4 IT Service ContinuityM6 IT SecurityN2 Service and Account
ManagementZ2 PremisesZS Management Services Tools
S1 Private CircuitsS3 Public Frame Relay
Virtual CircuitsS4 IP VPN ConnectionsS6 Call Volumes and
ChargesS8 Access ConnectionsS9 Internet Circuits
T1 International Leased Circuits
T3 International Public Frame Relay Virtual Circuits
T6 International Call Volumes and Charges
T7 Calling CardsT8 International ATM CircuitsV3 Telecommunications
InformationYT Telecoms total costs
B6 MiddlewareB9 Business ApplicationsBE Internet ApplicationsER SAP Applications
ZB Middleware and Applications Management and Tools
General Information
(GI)
H1 Budget AnalysisH2 Business VolumesZ1 Study Related InformationZ6 Additional ServicesZ9 Data Quality

Copyright © 2012 Information Services Group, Inc. All Rights Reserved
Benchmarking Market Pricing
Methodology Services Mapping
Scope Adjustment
Services Model
Analysis
Rates
$ Charges
Mainframe (MF) Servers (SP) Storage (ES) Desktop (DT) Service Desk (SD) Telecoms (TC) Network (NW)
D1 Mainframe Processors
B1 Transaction Processing
B2 Interactive Processing
B3 Batch ProcessingB4 VM ProcessingBF Mainframe
DatabasesG3 Mainframe
PlanningL5 Production ControlL6 Mainframe
OperationsLB Mainframe
SupportM5 Mainframe
Change
ZA Mainframe Management & Tools
DA Server ProcessorsDB Server FunctionBA Server Batch
Processing and Job Scheduling
BB Server Transaction Processing
BD Server DatabasesG5 Server Planning and
DesignK5 Server Hardware
MACK6 Server Software
DistributionL8 Server SupportL9 Server Hardware
MaintenanceLA Server Monitoring
and SupervisionM7 Server System
Administration
ZG Server Management & Tools
E1 Storage ArchitectureE2 SAN InfrastructureE3 Tiered DiskE4 Virtual Tape StorageE5 Automatic Tape
Storage & Legacy ATL
E6 Manual Tape Storage
E7 Optical Disk StorageEA Storage Planning
and DesignEB Storage ChangeEC Storage SupportEE Storage OperationsM1 Backup & RestoreM2 Centralised Archive
SolutionsM3 Disaster Recovery
ZD Storage Management &Tools
B8 Common Office Applications
BC EmailD6 Personal ComputersD7 Infrastructure ServersD8 Thin Clients F9 Distributed PrintersG1 Desktop Planning
and DesignK1 Desktop MACK2 Desktop Software
DistributionL1 Common Software
SupportL3 Desktop Hardware
MaintenanceM8 Infrastructure Server
AdministrationMB Desktop Backup and
RestoreN3 Desktop Training
ZJ Desktop Management & Tools
C3 Central Service Desk
C4 Local Service DeskC5 Incident & Problem
Management
ZM Service Desk Management & Tools
S1 Private CircuitsS3 Public Frame Relay
Virtual CircuitsS4 IP VPN ConnectionsS6 Call Volumes and
ChargesS8 Access ConnectionsS9 Internet CircuitsT1 International Leased
CircuitsT3 International Public
Frame Relay Virtual Circuits
T6 International Call Volumes and Charges
T7 Calling CardsT8 International ATM
CircuitsV3 Telecommunications
InformationYT Telecoms total
costs
A1 LAN ArchitectureA2 LAN Switching /
RoutingA4 Wireless LANsAA LAN Planning &
DesignAB LAN ChangesAC LAN SupportAD LAN Operations
W1 WAN ArchitectureW2 WAN Switching /
RoutingWA WAN Planning &
DesignWB WAN ChangesWCWAN SupportWDWAN Operations
V1 Voice ArchitectureV2 Voice PBX / CentrexV4 VoIP / IP Telephony VA Voice Planning &
DesignVB Voice ChangesVC Voice SupportVD Voice Operations
X1 Contact CentreX2 Network Perimeter
ControlX3 Remote Network
AccessX4 CablingX6 Conferencing /
Telepresence
YP Network total HW and SW costs
ZP Network Line Management & Tools
Middleware and Applications (MA)
B6 MiddlewareB9 Business
ApplicationsBE Internet ApplicationsER SAP Applications
ZB Middleware and Applications Management &Tools
Management Services (MS)
Application Development and Maintenance (AD)
Central Printing (CP)
General Information (GI)
Surveys(SU)
I4 Executive MgmtI3 Central ServicesI7 Outsourcer MgmtM4 IT Service
ContinuityM6 IT SecurityN2 Service and
Account MgmtZ2 PremisesZS Management
Services Tools
P0 Project Characteristics
P8 Source CodeQ0 Application
CharacteristicsQ6 Source CodeQWCore Business
RelationZU Development
SoftwareZF Management &
Tools
F1 Laser PrintingF2 Impact PrintingF3 COM ProductionF7 Post ProcessingF8 Enveloping
ZV Central Printing Management & Tools
H1 Budget AnalysisH2 Business VolumesZ1 Study Related
InformationZ6 Additional ServicesZ9 Data Quality
UA User ProfileUB User Problem
SolvingUC Support SatisfactionUD Office Technology
SatisfactionUE Business Systems
SatisfactionUF Overall SatisfactionUP Employee
QuestionnaireUZ User Population
ISG Database
ISG ModelService definitions

Copyright © 2012 Information Services Group, Inc. All Rights Reserved
Benchmarking Market Pricing
Process Overview Planning
Fact Finding
Assurance
Analysis
Reporting
Understand customer organisation
Collect data and interview key stakeholders
Calculate performance indicators
Comparison and analysis
Documented findings
Charter Document

Copyright © 2012 Information Services Group, Inc. All Rights Reserved
Benchmarking Market Pricing
Quality Benchmark • Relationship between cost and quality • Most organisations achieve a similar level of quality though • Guaranteed 100% availability is a special case
• Level of Service makes a big difference • E.g. 24X7 vs. 12X5
• Benchmark Target (contractual) and Achievement (performance)
ACME RG min RG mean RG max
Target 7.0 6.0 7.0 8.0Actual 8.0 2.4 8.2 14.2
0.0
2.0
4.0
6.0
8.0
10.0
12.0
14.0
16.0
%
Abandonment rate for Central Service Desk calls

Copyright © 2012 Information Services Group, Inc. All Rights Reserved
Benchmarking Market Pricing
Level of Detail • Tower level • Rough indication of market price • Typically used as part of a sourcing
strategy determination • Determine if a detailed benchmark is
warranted
High Level
• Sub Process Level • Fairly accurate assessment • Can be used to negotiate with suppliers • Often used to decide on going to the market
or a sole sourcing option
Intermediate
• Highly detailed forensic review • High degree of accuracy • Used to effect a price change as per the
benchmarking clauses in a contract • Will stand up to scrutiny
Detailed

Copyright © 2012 Information Services Group, Inc. All Rights Reserved
SAMPLE ONLY
The total annual expenditure analysed for the Type A application servers is $x.xx million . It includes annual hardware, software, support costs (internal and outsourced). It also includes an allocation of management services ($xxxK), Premises costs ($xxxK) and FTE related overheads ($xxxK).
x.xx FTEs have been allocated to the Type A server service tower.
xxx physical servers, xxx logical servers reported for Client.
Infrastructure availability of 336 hours, 99.99%.
Comparison Group profile:
− Number of physical servers, xxx – xxx severs
− Number of logical servers, xxx – xxx logical servers
− Availability 168 hours, 98.4 – 99.9%.
Client’s annual cost per logical server is within the market range and is in-line with the market average.
This result indicates that this is an area where Client has an opportunity to potentially save costs through a competitive bidding and negotiation process.
$
$
$
$
$ - $,000 $,000 $,000 $,000 $,000 $,000 $,000 $,000 $,000 $,000
Client
Market Min Market Avg Market Max
Annu
al p
er S
erve
r ($)
Midrange Server - Type A
Benchmarking Market Pricing

Copyright © 2012 Information Services Group, Inc. All Rights Reserved
Benchmarking Market Pricing
High Level
Service Tower Client Expenditure ($000's)
Minimum Savings $(000's)
Maximum Savings Opportunity $(000's)
Server – Type A $ x,xxx $ - $ x,xxx
Server – Type B $ x,xxx $ - $ -
Server – Type C $ x,xxx $ - $ xxx
Desktop $ x,xxx $ xxx $ x,xxx
E-Mail $ xxx $ - $ x
Infrastructure Servers $ x,xxx $ - $ xxx
Storage $ x,xxx $ - $ xxx
Network - LAN $ x,xxx $ - $ xxx
Network - Voice $ xxx $ - $ xxx
Network - Contact Centre $ x,xxx $ - $ -
Total Savings Opportunity $ xx,xxx $ xxx $ x,xxx
Sample Results

Copyright © 2012 Information Services Group, Inc. All Rights Reserved
Benchmarking Market Pricing
Tower ACME Monthly Total
Peer Group Monthly Total
Unix Servers $2,015,971 $1,938,900
Wintel Servers $2,055,425 $2,002,300
Linux Servers $133,103 $130,900
HP Non Stop Servers $265,210 $300,000
Teradata $6,647 -
Batch $217,668 $200,118
Migration $24,617 -
Middleware $364,021 $344,200
Midrange Hardware $1,169,690 $1,096,795 Out of Scope – Adjustments not applied to Resource Units
Total $6,252,353 $6,013,213
ACME total as a percentage of Peer Group total 103.98% Percentage Delta for Monthly Total 3.82%
Intermediate
Sample Results

Copyright © 2012 Information Services Group, Inc. All Rights Reserved
The Role of Contractual Benchmarking
Benchmarking Market Pricing
Traditional view is changing…
An accepted management
tool for clients to gauge the cost-
and quality-competitiveness
of service delivery…
…to the Transformational
view
…but also a strategic tool for
clients and service providers
to mutually enhance the
sourcing relationship

Copyright © 2012 Information Services Group, Inc. All Rights Reserved
Win-win situations occur when all parties work together transparently and coherently.
Must ensure they obtain a holistic view of the services they receive, and
understand the root causes of any gaps
identified
Must demonstrate to their client the full value of their services and quantify opportunities where changes to technology, processes or business requirements would enhance the value they deliver, or allow the service provider to deliver more profitably
Need to have a detailed methodology, broad reference data and experience to analyse complex environments and handle unique features
Benchmarking Market Pricing

Copyright © 2012 Information Services Group, Inc. All Rights Reserved
Using Benchmarks to Drive Change
► A standard services-based transformation model is characterised by “pay-as-you-go” utility computing, transparency into billing and consumption, and effective demand management.
► Service providers leverage the ability to deliver economies of scale.
Efficiency and effectiveness savings
Efficiency improvements Effectiveness
improvements
Benchmarking Market Pricing
Copyright © 2012 Information Services Group, Inc. All Rights Reserved
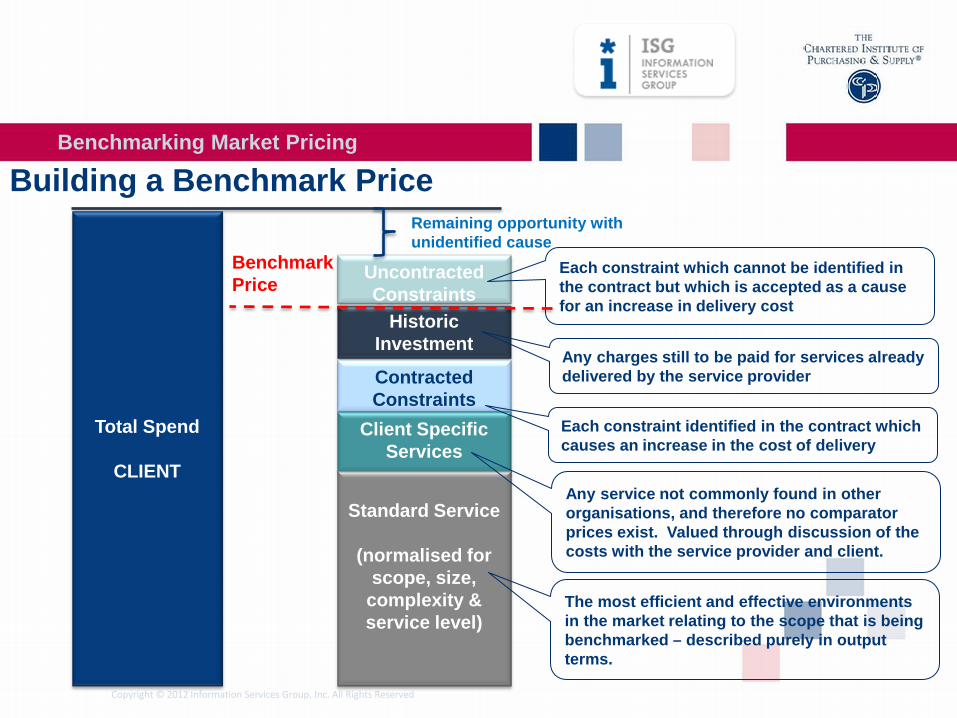
Building a Benchmark Price
Total Spend
CLIENT
Uncontracted Constraints
Historic Investment
Contracted Constraints
Client Specific Services
Standard Service
(normalised for
scope, size, complexity & service level)
Remaining opportunity with unidentified cause
Benchmark Price
The most efficient and effective environments in the market relating to the scope that is being benchmarked – described purely in output terms.
Any service not commonly found in other organisations, and therefore no comparator prices exist. Valued through discussion of the costs with the service provider and client.
Each constraint identified in the contract which causes an increase in the cost of delivery
Any charges still to be paid for services already delivered by the service provider
Each constraint which cannot be identified in the contract but which is accepted as a cause for an increase in delivery cost
Benchmarking Market Pricing
Copyright © 2012 Information Services Group, Inc. All Rights Reserved
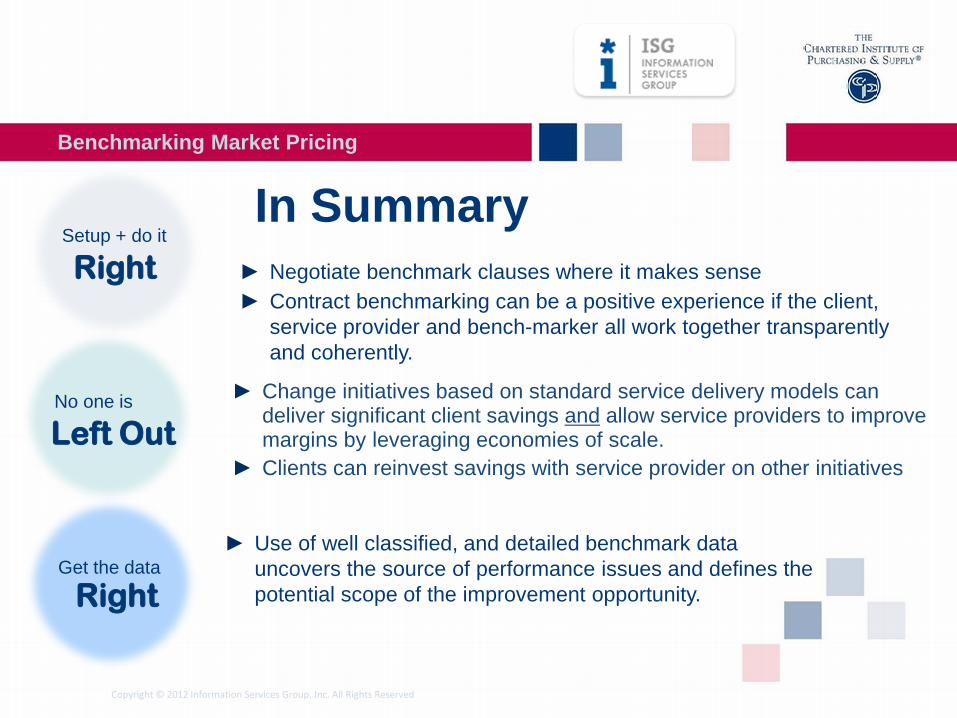
Setup + do it
Benchmarking Market Pricing
► Change initiatives based on standard service delivery models can deliver significant client savings and allow service providers to improve margins by leveraging economies of scale.
► Clients can reinvest savings with service provider on other initiatives
Right
No one is
Left Out
Get the data
Right
► Negotiate benchmark clauses where it makes sense ► Contract benchmarking can be a positive experience if the client,
service provider and bench-marker all work together transparently and coherently.
► Use of well classified, and detailed benchmark data uncovers the source of performance issues and defines the potential scope of the improvement opportunity.
In Summary

Copyright © 2012 Information Services Group, Inc. All Rights Reserved
Discussion
Questions?
Benchmarking Market Pricing

![Super Market Pricing Stretegy[1]](https://static.documents.pub/doc/80x56/577d36461a28ab3a6b92ad9c/super-market-pricing-stretegy1.jpg)


