
www.pwc.com/ambenchmarking
PwC’s Asset Management Benchmarking Study for Traditional Asset Managers
Spring 2014
Benchmarking InsightsPwC’s asset management perspectives and analysis
Dear clients and friends,
PwC’s asset management practice is delighted to publish the results of our
Traditional Asset Management benchmarking survey designed to gather,
analyze, and share information about key industry trends and metrics. In
the fall of 2013, we gathered data covering industry practices related to
fund boards and governance, business resource models, product
development, NAV calculation, valuation, corporate action processing,
financial reporting, shareholder transaction processing and tax
compliance. This document represents the summarization of that data and
includes key takeaways by area to assist you with your review.
The need for such information is clear and present. While 2013 was a
successful year for many asset management firms with assets under
management eclipsing pre-crisis levels for some, asset management firms
continue to face a challenging environment amidst pressure from the
competition, regulators and investors.
To help asset managers respond effectively to these demands, PwC
conducted this survey to explore trends that would help asset management
executives and management teams benchmark their practices against the
asset management industry as a whole. We hope that you find our the
results and analysis helpful.
Yours sincerely,
PwC
Barry BenjaminUS & Global Asset Management Leader
Gary MeltzerUS & Global Asset ManagementAdvisory Leader
Peter FinnertyUS Asset Management Traditional Funds Assurance Leader
Shawn BakerUS Asset Management Traditional Funds Tax Leader
Julien CourbeUS Asset Management Advisory Leader
PwC
Spring 2014
3
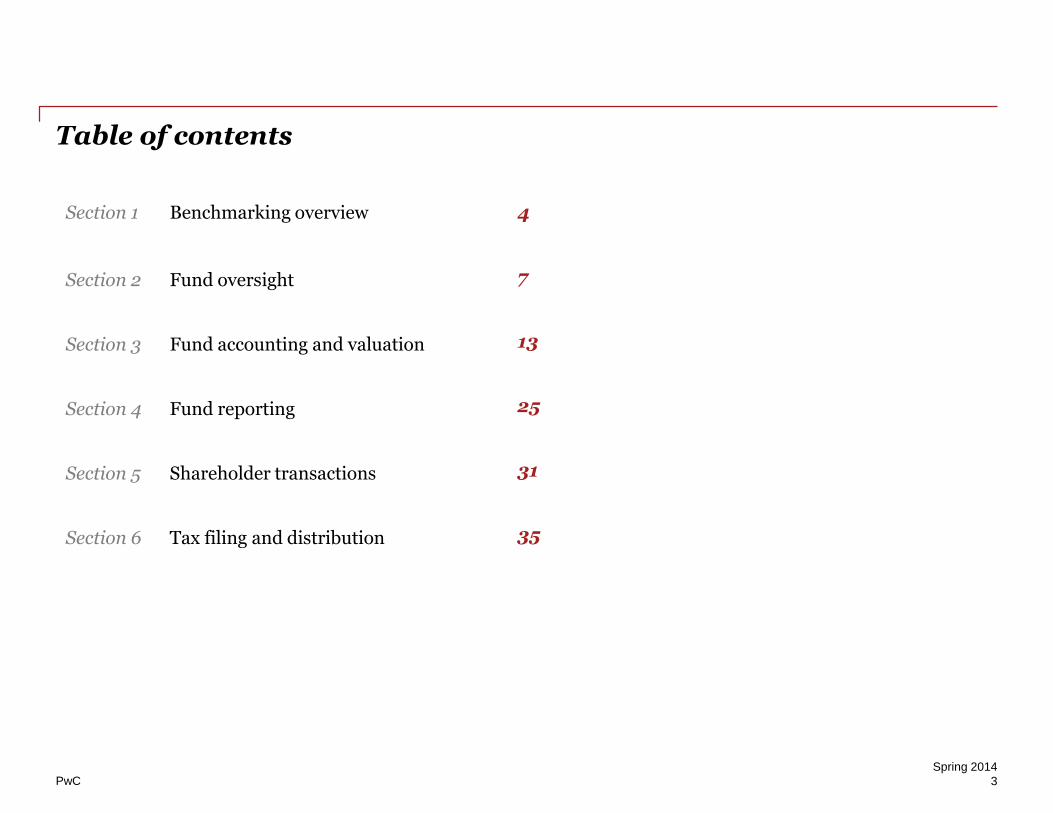
Table of contents
Section 1 Benchmarking overview 4
Section 2 Fund oversight 7
Section 3 Fund accounting and valuation 13
Section 4 Fund reporting 25
Section 5 Shareholder transactions 31
Section 6 Tax filing and distribution 35
PwC
Spring 2014
4
Benchmarking overviewSection 1
PwC
Spring 2014
5
Benchmarking highlights and objectives
Objective
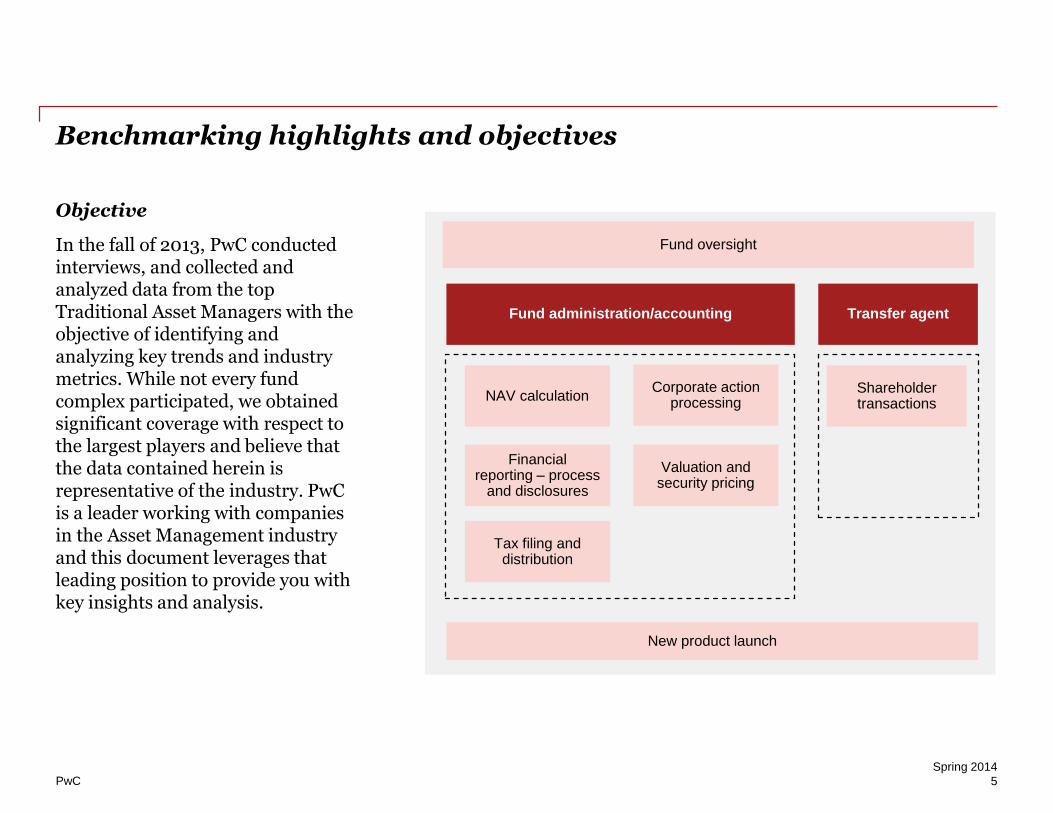
In the fall of 2013, PwC conducted interviews, and collected and analyzed data from the top Traditional Asset Managers with the objective of identifying and analyzing key trends and industry metrics. While not every fund complex participated, we obtained significant coverage with respect to the largest players and believe that the data contained herein is representative of the industry. PwC is a leader working with companies in the Asset Management industry and this document leverages that leading position to provide you with key insights and analysis.
Tax filing and distribution
Shareholder transactions
Transfer agent
Corporate action processing
NAV calculation
Fund administration/accounting
New product launch
Financial reporting – process
and disclosures
Valuation and security pricing
Fund oversight
PwC
Spring 2014
6
Benchmarking highlights and objectives (cont’d)
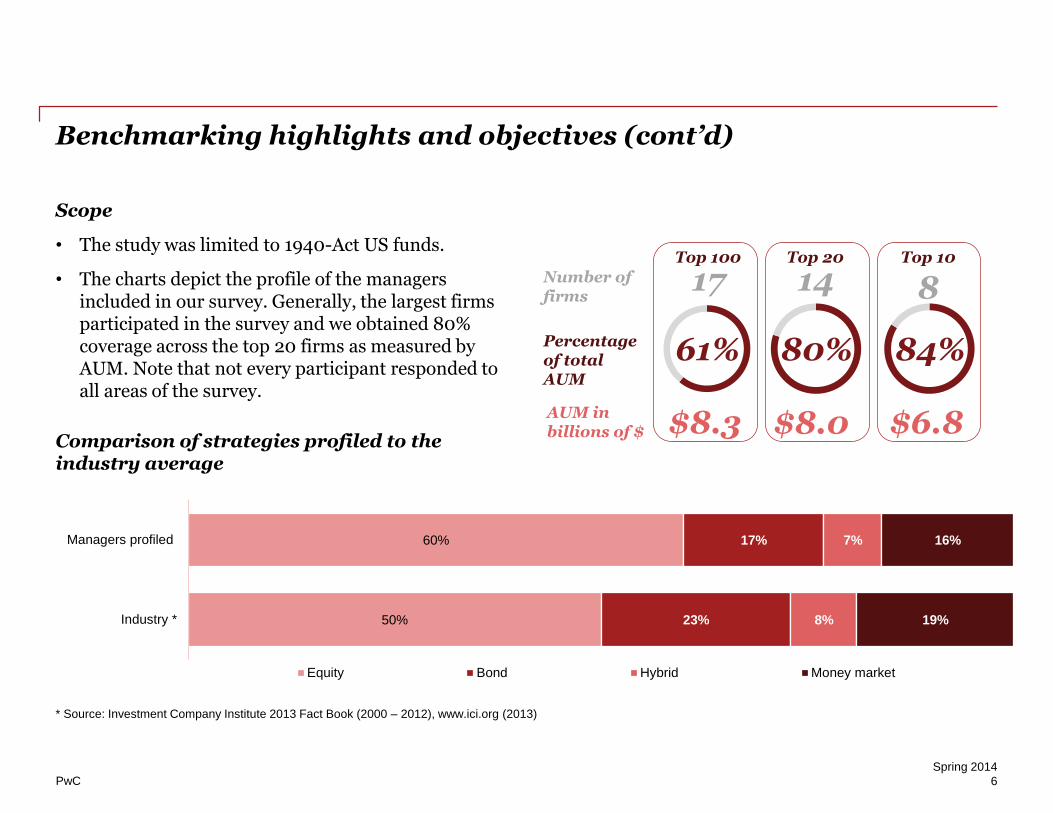
Scope
• The study was limited to 1940-Act US funds.
• The charts depict the profile of the managers included in our survey. Generally, the largest firms participated in the survey and we obtained 80% coverage across the top 20 firms as measured by AUM. Note that not every participant responded to all areas of the survey.
Comparison of strategies profiled to the industry average
61% 80% 84%
17 14 8Top 20 Top 10Top 100
Number of firms
Percentage of total AUM
AUM in billions of $ $8.3 $8.0 $6.8
* Source: Investment Company Institute 2013 Fact Book (2000 – 2012), www.ici.org (2013)
60%
50%
17%
23%
7%
8%
16%
19%
Managers profiled
Industry *
Equity Bond Hybrid Money market
PwC
Spring 2014
7
Fund oversightSection 2
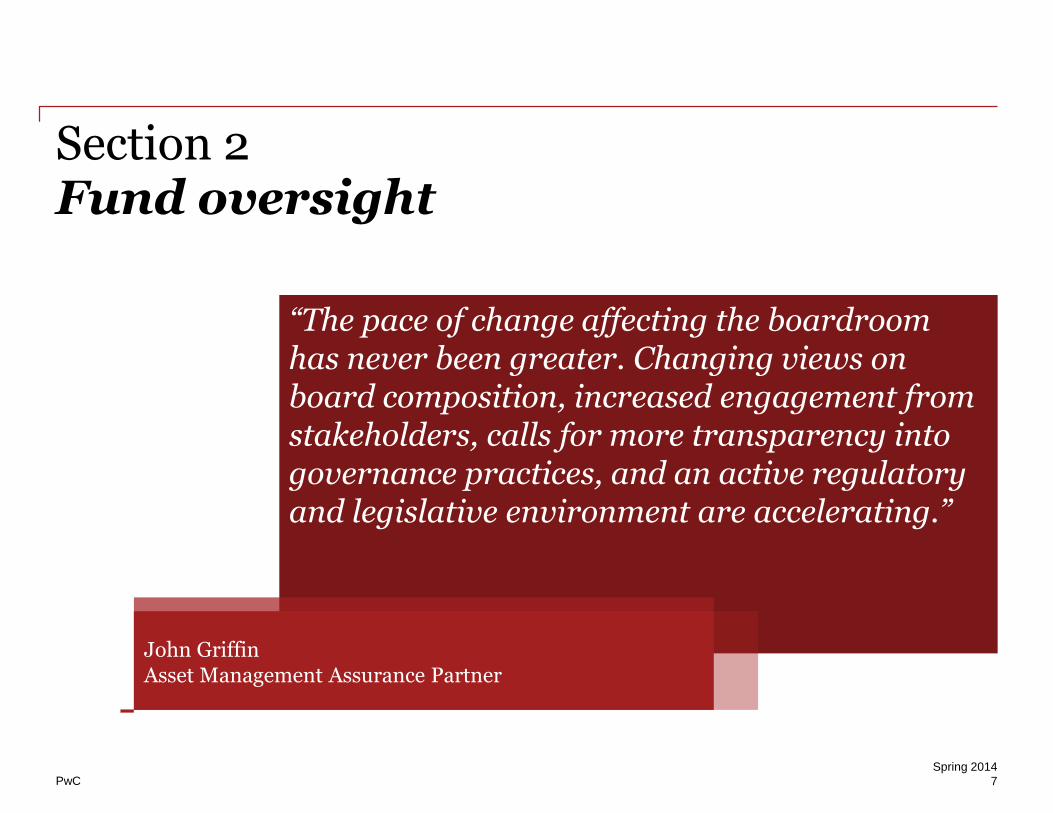
“The pace of change affecting the boardroom has never been greater. Changing views on board composition, increased engagement from stakeholders, calls for more transparency into governance practices, and an active regulatory and legislative environment are accelerating.”
John Griffin Asset Management Assurance Partner
PwC
Spring 2014
8
Summary of findings – Fund oversight
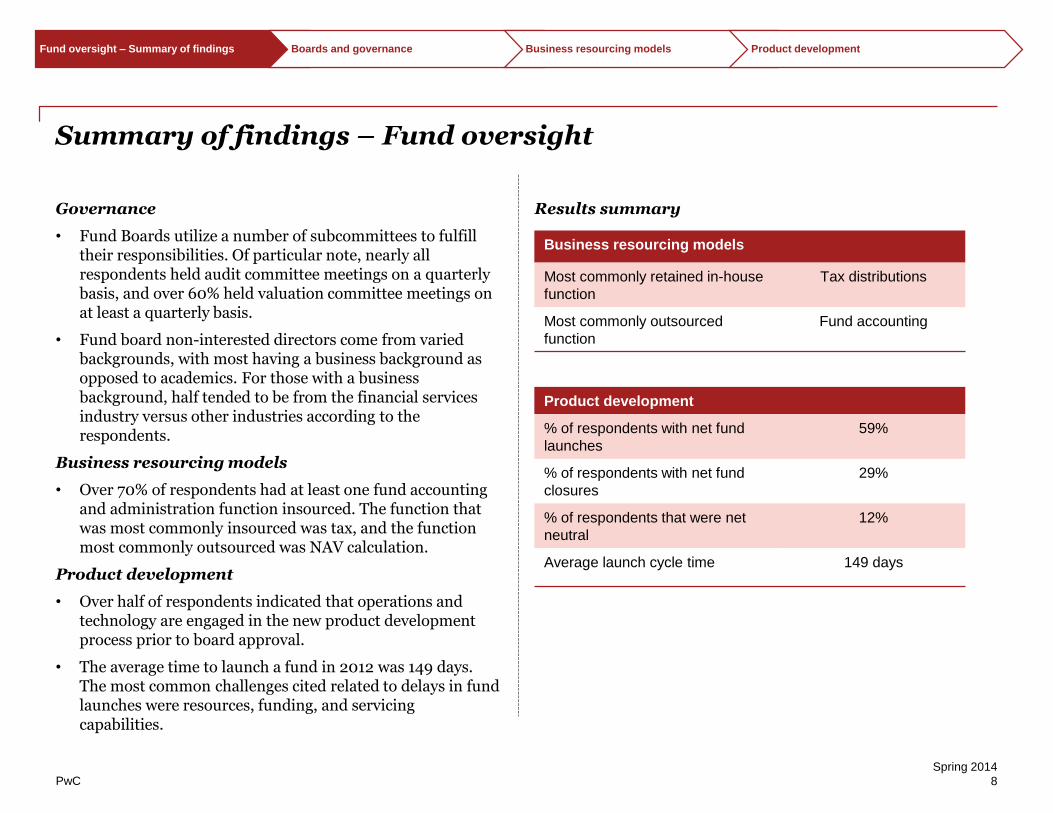
Governance
• Fund Boards utilize a number of subcommittees to fulfill their responsibilities. Of particular note, nearly all respondents held audit committee meetings on a quarterly basis, and over 60% held valuation committee meetings on at least a quarterly basis.
• Fund board non-interested directors come from varied backgrounds, with most having a business background as opposed to academics. For those with a business background, half tended to be from the financial services industry versus other industries according to the respondents.
Business resourcing models
• Over 70% of respondents had at least one fund accounting and administration function insourced. The function that was most commonly insourced was tax, and the function most commonly outsourced was NAV calculation.
Product development
• Over half of respondents indicated that operations and technology are engaged in the new product development process prior to board approval.
• The average time to launch a fund in 2012 was 149 days. The most common challenges cited related to delays in fund launches were resources, funding, and servicing capabilities.
Results summary
Business resourcing models
Most commonly retained in-house
function
Tax distributions
Most commonly outsourced
function
Fund accounting
Product development
% of respondents with net fund
launches
59%
% of respondents with net fund
closures
29%
% of respondents that were net
neutral
12%
Average launch cycle time 149 days
Fund oversight – Summary of findings Boards and governance Business resourcing models Product development
PwC
Spring 2014
9
Committee meeting frequency
Fund oversight – Summary of findings Boards and governance Business resourcing models Product development
100%
38%
29%
20%
17%
11%
11%
25%
14%
40%
75%
67%
56%
67%
40%
40%
29%
8%
11%
11%
17%
20%
20%
20%
20%
10%
37%
28%
20%
11%
22%
16%
20%
30%
0% 25% 50% 75% 100%
Operations
Valuation
Executive
Contract review
Audit
Governance
Regulatory and compliance
Investment
Compensation and benefits
Nominating
Monthly Quarterly Semi-annually Annually Ad-hoc
Key takeaways
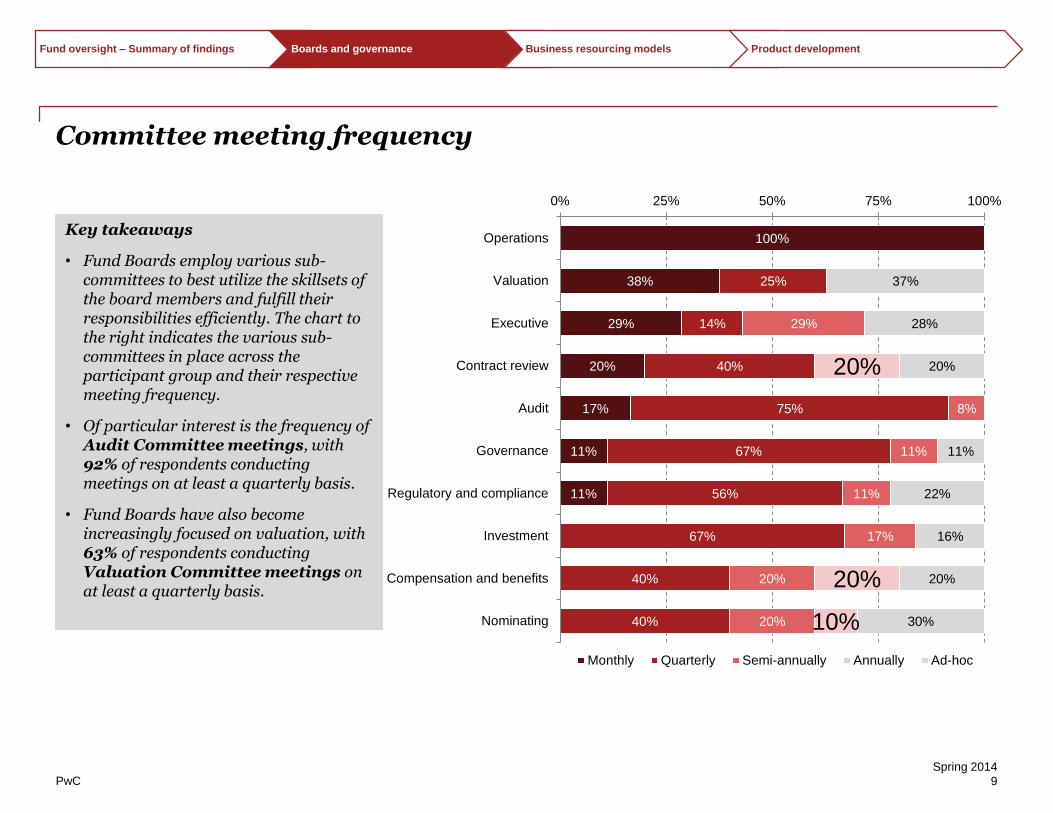
• Fund Boards employ various sub-committees to best utilize the skillsets of the board members and fulfill their responsibilities efficiently. The chart to the right indicates the various sub-committees in place across the participant group and their respective meeting frequency.
• Of particular interest is the frequency of Audit Committee meetings, with 92% of respondents conducting meetings on at least a quarterly basis.
• Fund Boards have also become increasingly focused on valuation, with 63% of respondents conducting Valuation Committee meetings on at least a quarterly basis.
PwC
Spring 2014
10
Composition and management style
Average board composition
Number of directors on each fund board
Board management style
Representative from the advisor17.8%
Non-interested directors (general
business)34.2%
Non-interested directors (financial
backgrounds)30.2%
Non-interested directors
(academics)10.9%
Consultants1.3%
Legal advisors4.3%
Others1.3%
10.9 7.2
Directors Non-associated directors
Detailed management
of all decisions
10%
High-level oversight
90%
Key takeaway
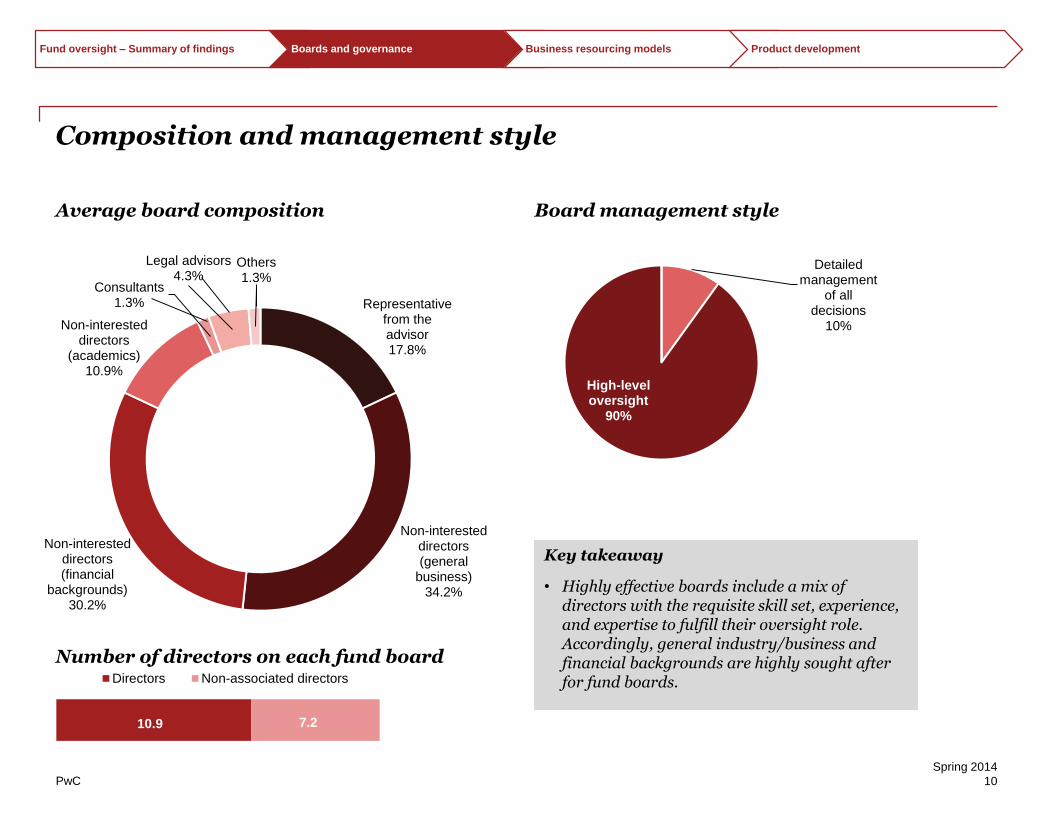
• Highly effective boards include a mix of directors with the requisite skill set, experience, and expertise to fulfill their oversight role. Accordingly, general industry/business and financial backgrounds are highly sought after for fund boards.
Fund oversight – Summary of findings Boards and governance Business resourcing models Product development
PwC
Spring 2014
11
Business resourcing models
Key takeaways
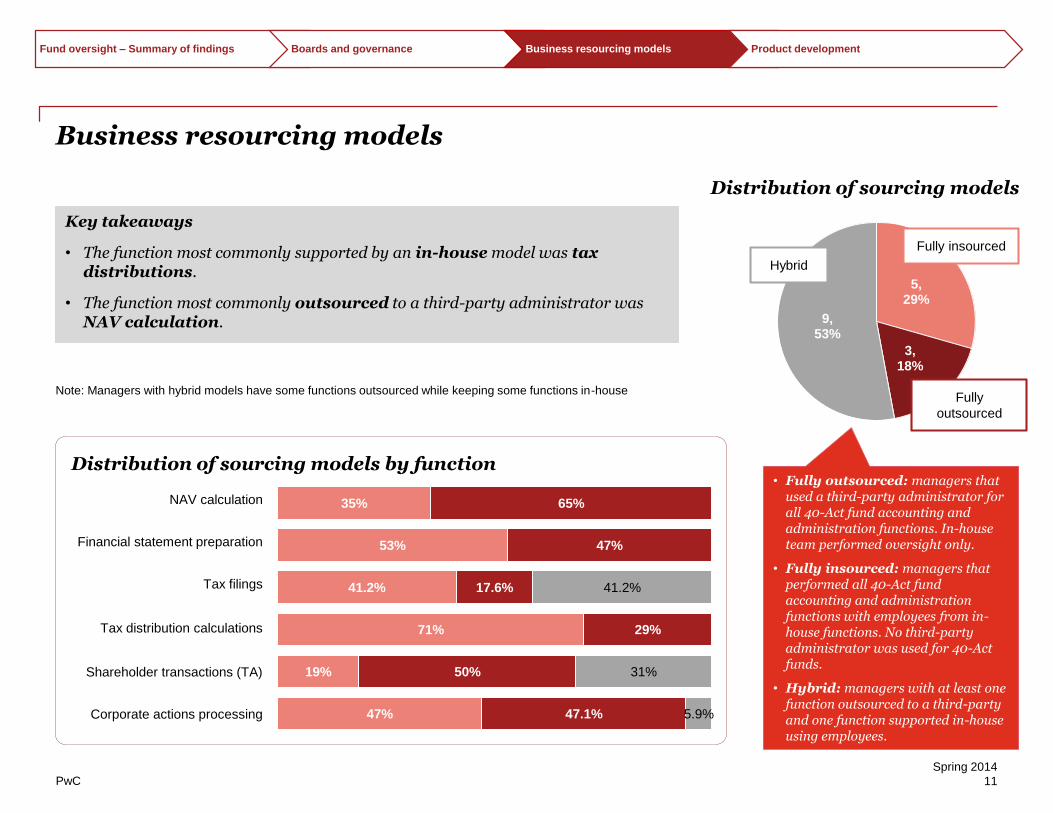
• The function most commonly supported by an in-house model was tax distributions.
• The function most commonly outsourced to a third-party administrator was NAV calculation.
Distribution of sourcing models
Distribution of sourcing models by function
35%
53%
41.2%
71%
19%
47%
65%
47%
17.6%
29%
50%
47.1%
41.2%
31%
5.9%Corporate actions processing
Shareholder transactions (TA)
Tax distribution calculations
Tax filings
NAV calculation
Financial statement preparation
Note: Managers with hybrid models have some functions outsourced while keeping some functions in-house
Fund oversight – Summary of findings Boards and governance Business resourcing models Product development
5, 29%
3, 18%
9, 53%
Hybrid
Fully insourced
Fully
outsourced
• Fully outsourced: managers that used a third-party administrator for all 40-Act fund accounting and administration functions. In-house team performed oversight only.
• Fully insourced: managers that performed all 40-Act fund accounting and administration functions with employees from in-house functions. No third-party administrator was used for 40-Act funds.
• Hybrid: managers with at least one function outsourced to a third-party and one function supported in-house using employees.
PwC
Spring 2014
12
Time to launch a new fund
Average days needed to launch a new fund
Note: Multiple responses were permitted
What are some of the top reasons for delays in fund launches
17%
33%
42%
50%
Lack of familiarity with strategy or product type
Product complexity
Timing of internal/external approvals
Resource/funding/capability
29%
53%
12%6%
0%
25%
50%
75%
100%
0-100 101-200 201-300 301-400
# of days
Fund oversight – Summary of findings Boards and governance Business resourcing models Product development
Key takeaway
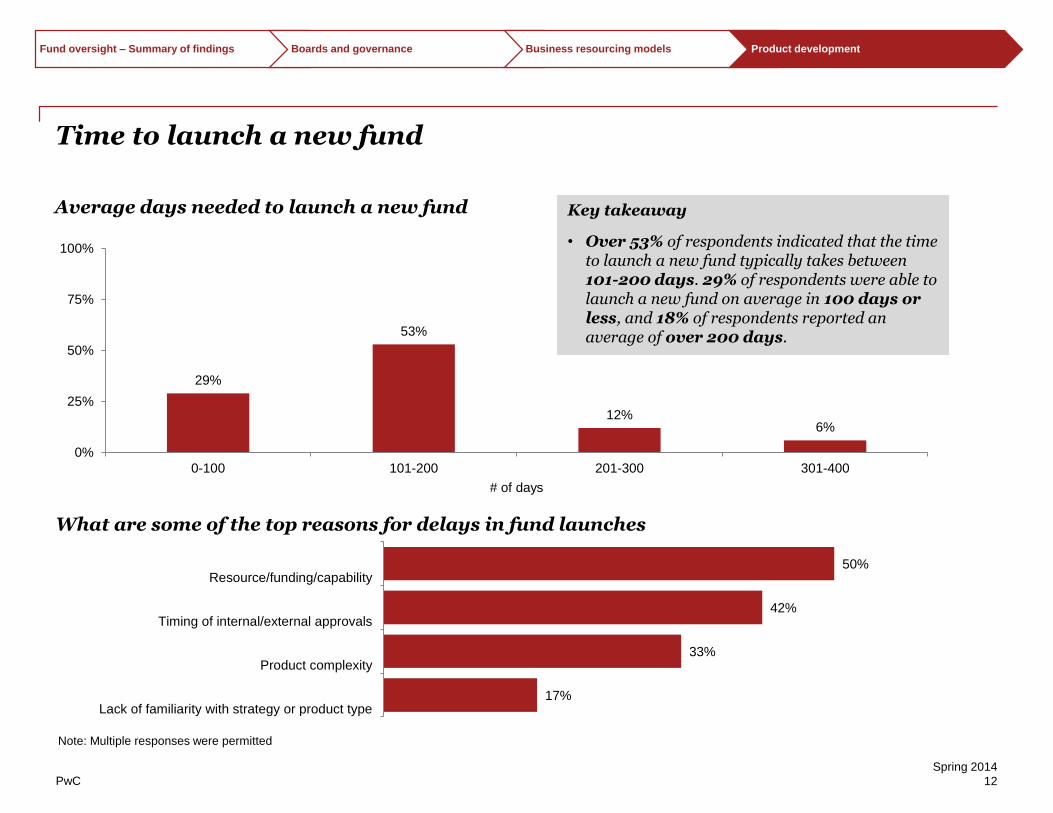
• Over 53% of respondents indicated that the time to launch a new fund typically takes between 101-200 days. 29% of respondents were able to launch a new fund on average in 100 days or less, and 18% of respondents reported an average of over 200 days.
PwC
Spring 2014
13
Fund accounting and valuationSection 3
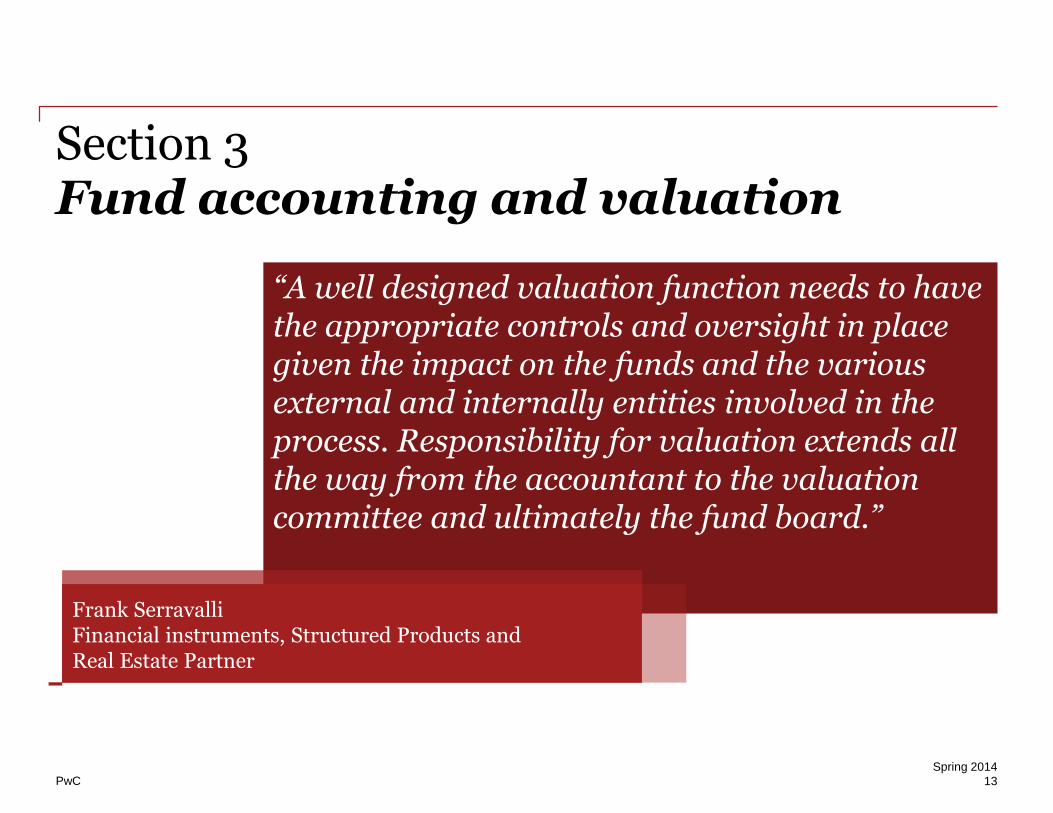
“A well designed valuation function needs to have the appropriate controls and oversight in place given the impact on the funds and the various external and internally entities involved in the process. Responsibility for valuation extends all the way from the accountant to the valuation committee and ultimately the fund board.”
Frank Serravalli Financial instruments, Structured Products and Real Estate Partner
PwC
Spring 2014
14
Summary of findings – Fund accounting and valuation
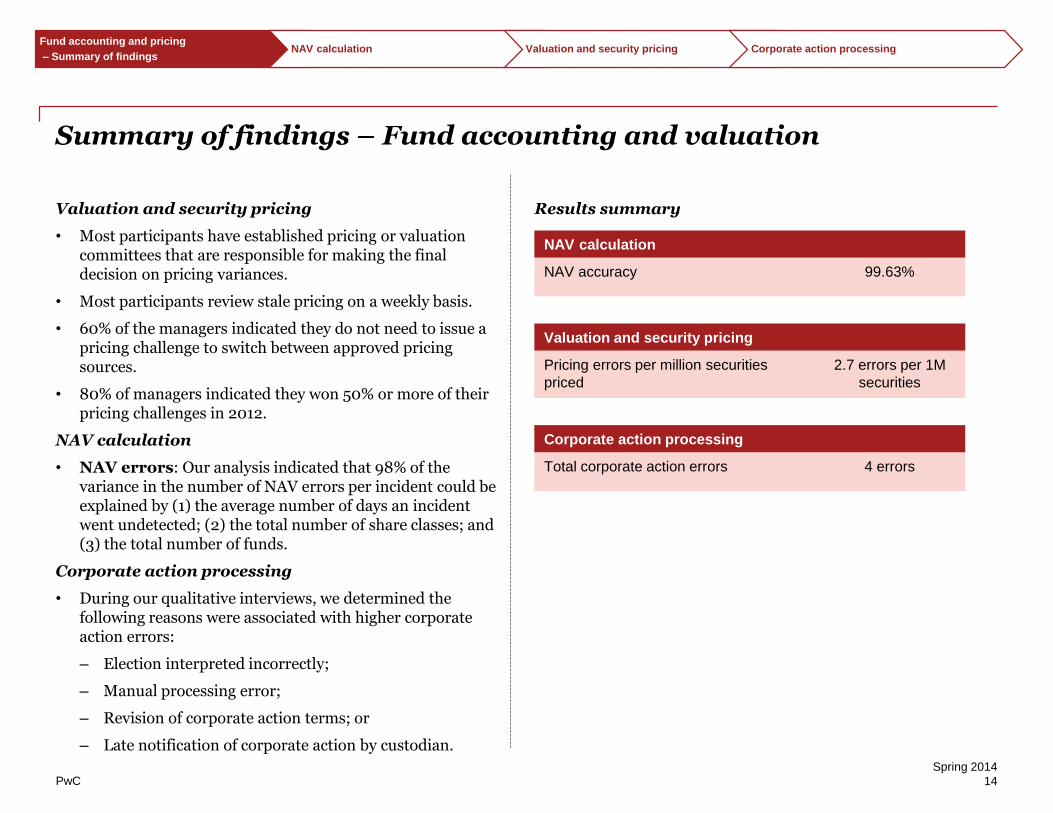
Valuation and security pricing
• Most participants have established pricing or valuation committees that are responsible for making the final decision on pricing variances.
• Most participants review stale pricing on a weekly basis.
• 60% of the managers indicated they do not need to issue a pricing challenge to switch between approved pricing sources.
• 80% of managers indicated they won 50% or more of their pricing challenges in 2012.
NAV calculation
• NAV errors: Our analysis indicated that 98% of the variance in the number of NAV errors per incident could be explained by (1) the average number of days an incident went undetected; (2) the total number of share classes; and (3) the total number of funds.
Corporate action processing
• During our qualitative interviews, we determined the following reasons were associated with higher corporate action errors:
‒ Election interpreted incorrectly;
‒ Manual processing error;
‒ Revision of corporate action terms; or
‒ Late notification of corporate action by custodian.
Results summary
NAV calculation
NAV accuracy 99.63%
Valuation and security pricing
Pricing errors per million securities
priced
2.7 errors per 1M
securities
Corporate action processing
Total corporate action errors 4 errors
Fund accounting and pricing
– Summary of findingsNAV calculation Valuation and security pricing Corporate action processing
PwC
Spring 2014
15
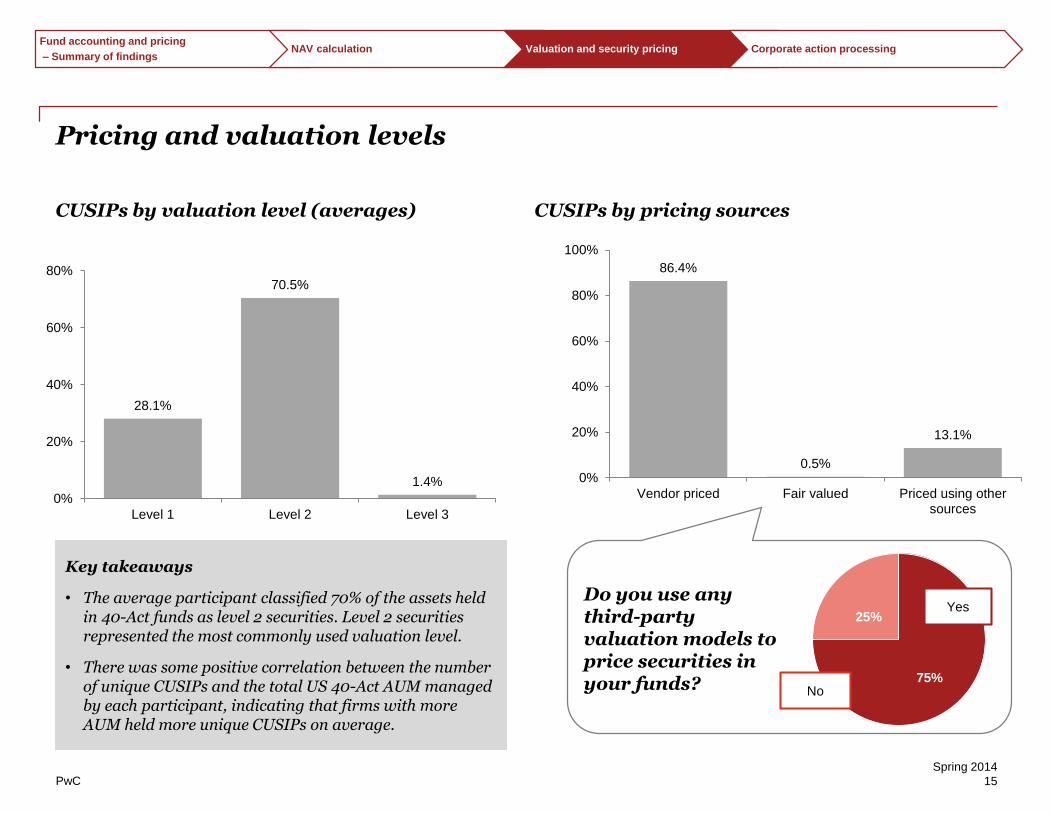
75%
25%
Pricing and valuation levels
CUSIPs by valuation level (averages) CUSIPs by pricing sources
Do you use any third-party valuation models to price securities in your funds?
Yes
No
Key takeaways
• The average participant classified 70% of the assets held in 40-Act funds as level 2 securities. Level 2 securities represented the most commonly used valuation level.
• There was some positive correlation between the number of unique CUSIPs and the total US 40-Act AUM managed by each participant, indicating that firms with more AUM held more unique CUSIPs on average.
86.4%
0.5%
13.1%
0%
20%
40%
60%
80%
100%
Vendor priced Fair valued Priced using othersources
28.1%
70.5%
1.4%
0%
20%
40%
60%
80%
Level 1 Level 2 Level 3
Fund accounting and pricing
– Summary of findingsNAV calculation Valuation and security pricing Corporate action processing
PwC
Spring 2014
16
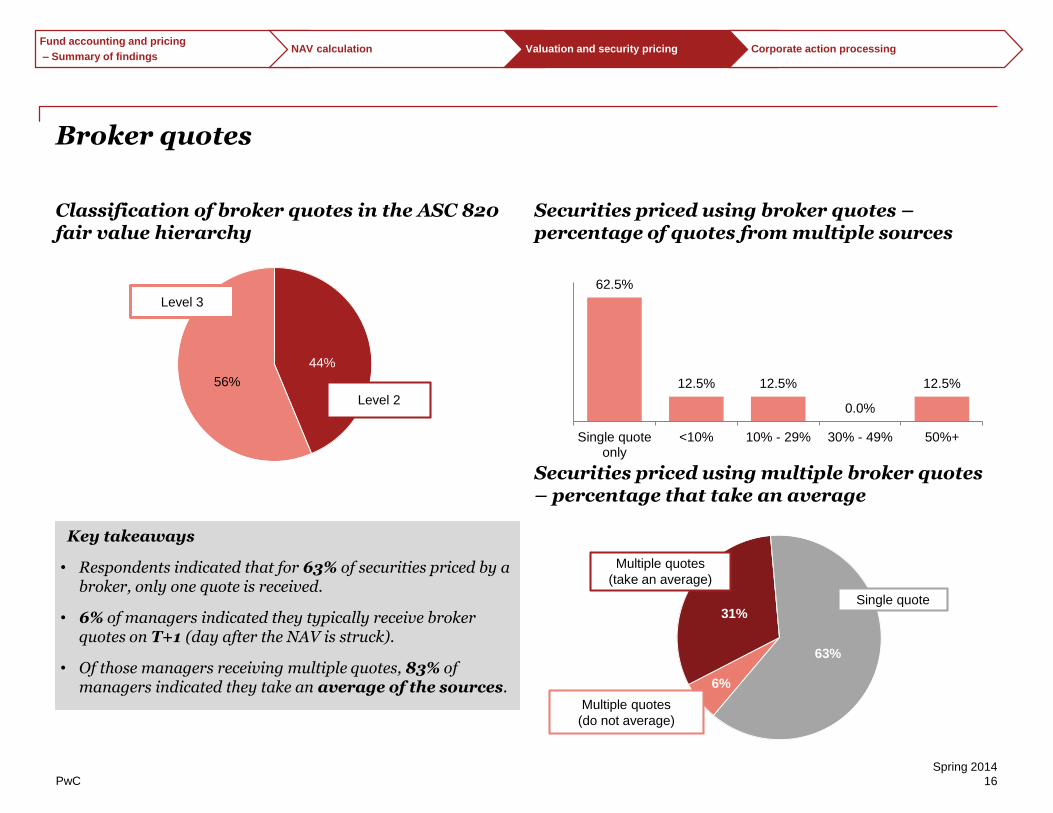
44%
56%
Broker quotes
Classification of broker quotes in the ASC 820 fair value hierarchy
Securities priced using broker quotes –percentage of quotes from multiple sources
Securities priced using multiple broker quotes – percentage that take an average
Level 2
Level 3
62.5%
12.5% 12.5%
0.0%
12.5%
Single quoteonly
<10% 10% - 29% 30% - 49% 50%+
6%
31%
63%
Multiple quotes
(take an average)
Multiple quotes
(do not average)
Single quote
Key takeaways
• Respondents indicated that for 63% of securities priced by a broker, only one quote is received.
• 6% of managers indicated they typically receive broker quotes on T+1 (day after the NAV is struck).
• Of those managers receiving multiple quotes, 83% of managers indicated they take an average of the sources.
Fund accounting and pricing
– Summary of findingsNAV calculation Valuation and security pricing Corporate action processing

PwC
Spring 2014
17
Valuation and security pricing controls
How often do you review stale pricing? What types of controls are in place for pricing?
100%
100%
100%
94%
59%
100%
6%
41%
Reconciliation of primary andsecondary vendor
Review to market trade data
Unchanged price reviews
Multiple levels of QA pre and postproduction
Sampling methodologies
High standard of authorizationrequired for price overrides
Yes No
18%
5%
72%
5%
Daily Twice weekly Weekly Twice monthly
Fund accounting and pricing
– Summary of findingsNAV calculation Valuation and security pricing Corporate action processing
PwC
Spring 2014
18
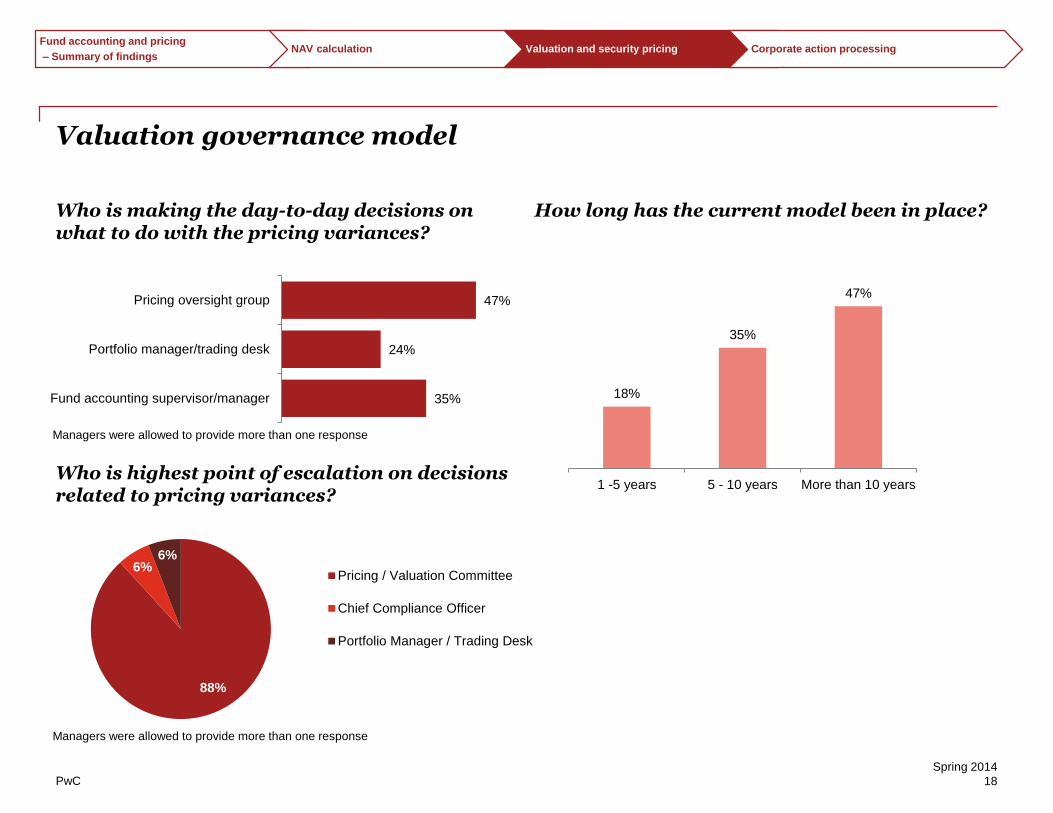
Valuation governance model
Who is making the day-to-day decisions on what to do with the pricing variances?
Who is highest point of escalation on decisions related to pricing variances?
How long has the current model been in place?
Managers were allowed to provide more than one response
18%
35%
47%
1 -5 years 5 - 10 years More than 10 years
35%
24%
47%
Fund accounting supervisor/manager
Portfolio manager/trading desk
Pricing oversight group
88%
6%6%
Pricing / Valuation Committee
Chief Compliance Officer
Portfolio Manager / Trading Desk
Managers were allowed to provide more than one response
Fund accounting and pricing
– Summary of findingsNAV calculation Valuation and security pricing Corporate action processing
PwC
Spring 2014
19
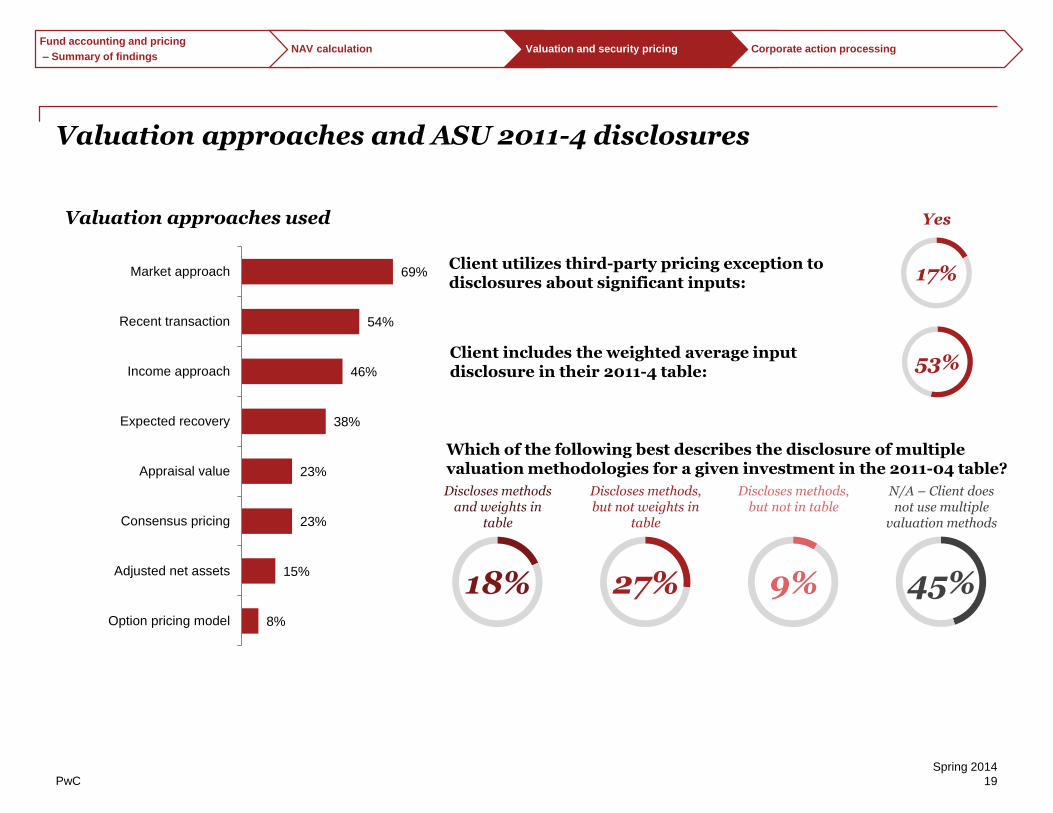
Valuation approaches and ASU 2011-4 disclosures
Client utilizes third-party pricing exception to disclosures about significant inputs: 17%
Yes
Client includes the weighted average input disclosure in their 2011-4 table: 53%
Which of the following best describes the disclosure of multiple valuation methodologies for a given investment in the 2011-04 table?
18%
Discloses methods and weights in
table
27%
Discloses methods, but not weights in
table
9%
Discloses methods, but not in table
45%
N/A – Client does not use multiple
valuation methods
69%
54%
46%
38%
23%
23%
15%
8%
Market approach
Recent transaction
Income approach
Expected recovery
Appraisal value
Consensus pricing
Adjusted net assets
Option pricing model
Valuation approaches used
Fund accounting and pricing
– Summary of findingsNAV calculation Valuation and security pricing Corporate action processing
PwC
Spring 2014
20
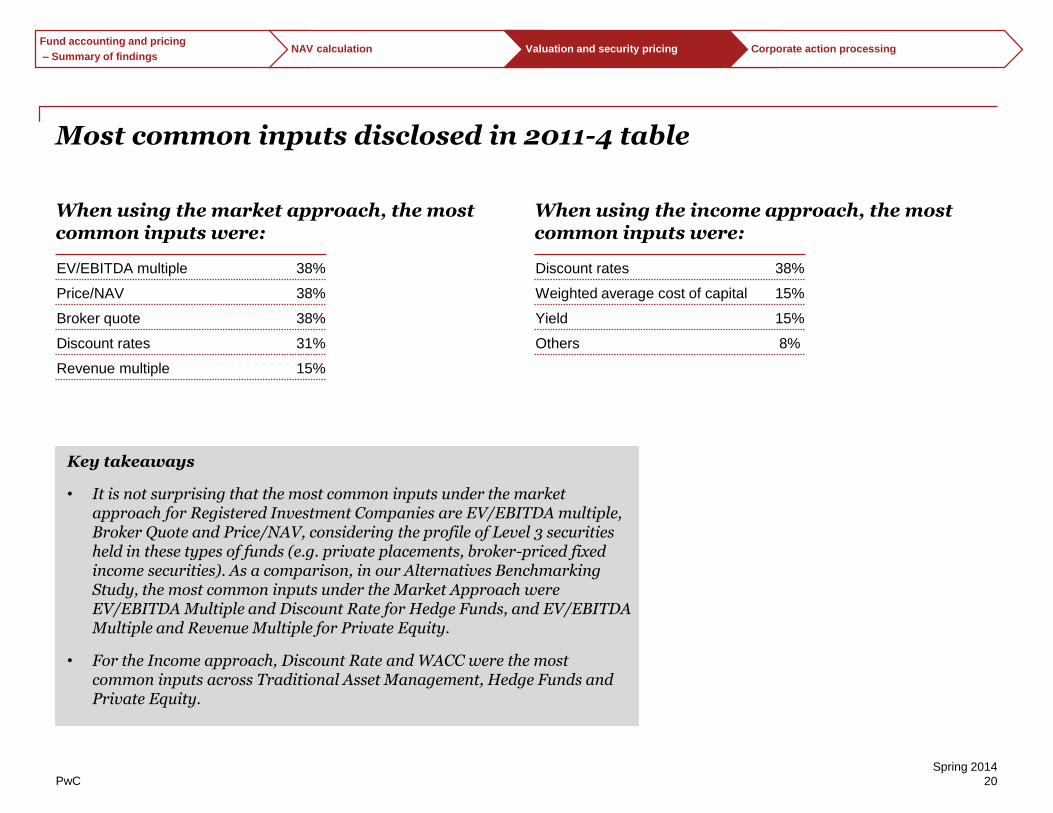
Most common inputs disclosed in 2011-4 table
When using the market approach, the most common inputs were:
When using the income approach, the most common inputs were:
EV/EBITDA multiple 38%
Price/NAV 38%
Broker quote 38%
Discount rates 31%
Revenue multiple 15%
Discount rates 38%
Weighted average cost of capital 15%
Yield 15%
Others 8%
Key takeaways
• It is not surprising that the most common inputs under the market approach for Registered Investment Companies are EV/EBITDA multiple, Broker Quote and Price/NAV, considering the profile of Level 3 securities held in these types of funds (e.g. private placements, broker-priced fixed income securities). As a comparison, in our Alternatives Benchmarking Study, the most common inputs under the Market Approach were EV/EBITDA Multiple and Discount Rate for Hedge Funds, and EV/EBITDA Multiple and Revenue Multiple for Private Equity.
• For the Income approach, Discount Rate and WACC were the most common inputs across Traditional Asset Management, Hedge Funds and Private Equity.
Fund accounting and pricing
– Summary of findingsNAV calculation Valuation and security pricing Corporate action processing
PwC
Spring 2014
21
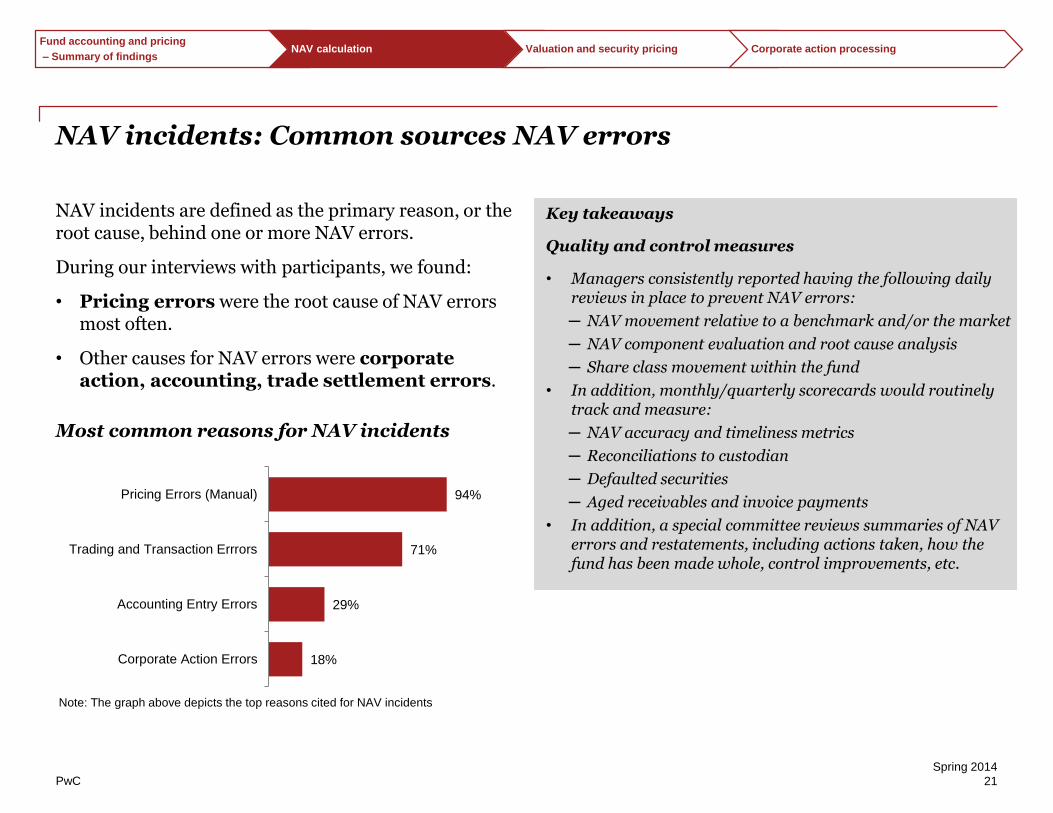
NAV incidents: Common sources NAV errors
NAV incidents are defined as the primary reason, or the root cause, behind one or more NAV errors.
During our interviews with participants, we found:
• Pricing errors were the root cause of NAV errors most often.
• Other causes for NAV errors were corporate action, accounting, trade settlement errors.
Most common reasons for NAV incidents
Key takeaways
Quality and control measures
• Managers consistently reported having the following daily reviews in place to prevent NAV errors:
─ NAV movement relative to a benchmark and/or the market
─ NAV component evaluation and root cause analysis
─ Share class movement within the fund
• In addition, monthly/quarterly scorecards would routinely track and measure:
─ NAV accuracy and timeliness metrics
─ Reconciliations to custodian
─ Defaulted securities
─ Aged receivables and invoice payments
• In addition, a special committee reviews summaries of NAV errors and restatements, including actions taken, how the fund has been made whole, control improvements, etc.
18%
29%
71%
94%
Corporate Action Errors
Accounting Entry Errors
Trading and Transaction Errrors
Pricing Errors (Manual)
Note: The graph above depicts the top reasons cited for NAV incidents
Fund accounting and pricing
– Summary of findingsNAV calculation Valuation and security pricing Corporate action processing
PwC
Spring 2014
22
Drivers of NAV incidents and NAV errors
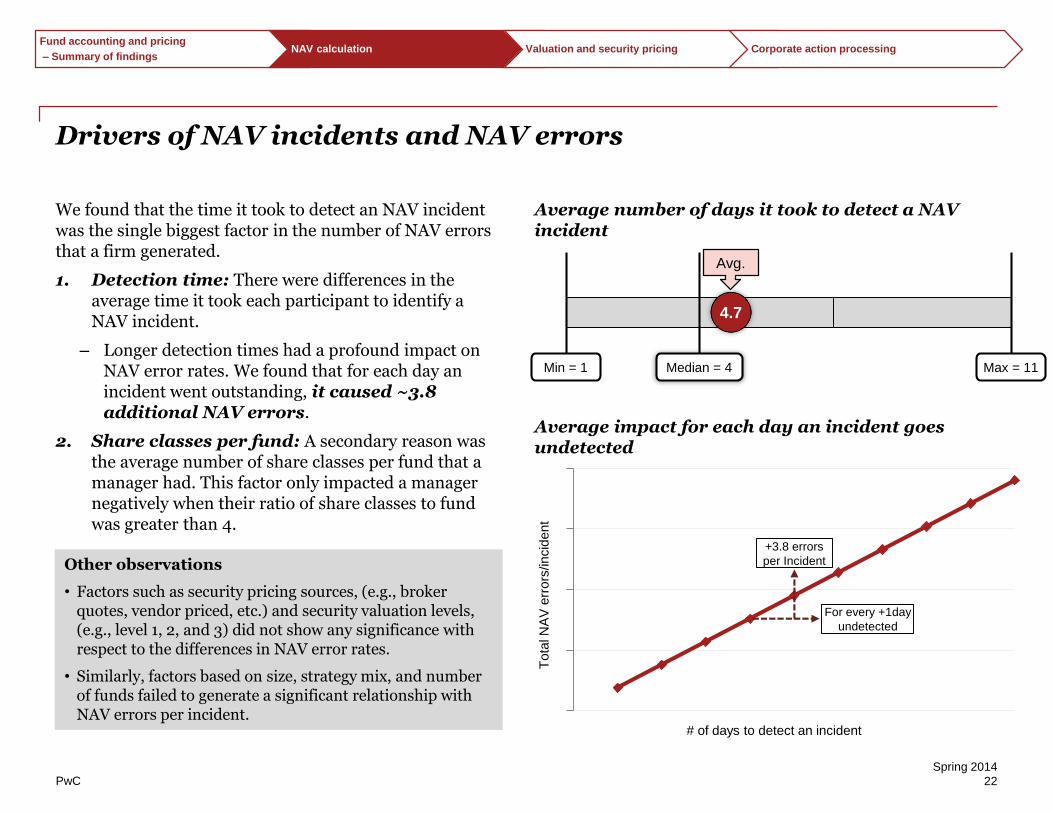
We found that the time it took to detect an NAV incident was the single biggest factor in the number of NAV errors that a firm generated.
1. Detection time: There were differences in the average time it took each participant to identify a NAV incident.
‒ Longer detection times had a profound impact on NAV error rates. We found that for each day an incident went outstanding, it caused ~3.8 additional NAV errors.
2. Share classes per fund: A secondary reason was the average number of share classes per fund that a manager had. This factor only impacted a manager negatively when their ratio of share classes to fund was greater than 4.
Average number of days it took to detect a NAV incident
Average impact for each day an incident goes undetected
Other observations
• Factors such as security pricing sources, (e.g., broker quotes, vendor priced, etc.) and security valuation levels, (e.g., level 1, 2, and 3) did not show any significance with respect to the differences in NAV error rates.
• Similarly, factors based on size, strategy mix, and number of funds failed to generate a significant relationship with NAV errors per incident.
4.7
Median = 4 Max = 11Min = 1
Avg.
For every +1day
undetected
+3.8 errors
per Incident
# of days to detect an incident
Tota
l N
AV
err
ors
/incid
ent
Fund accounting and pricing
– Summary of findingsNAV calculation Valuation and security pricing Corporate action processing
PwC
Spring 2014
23
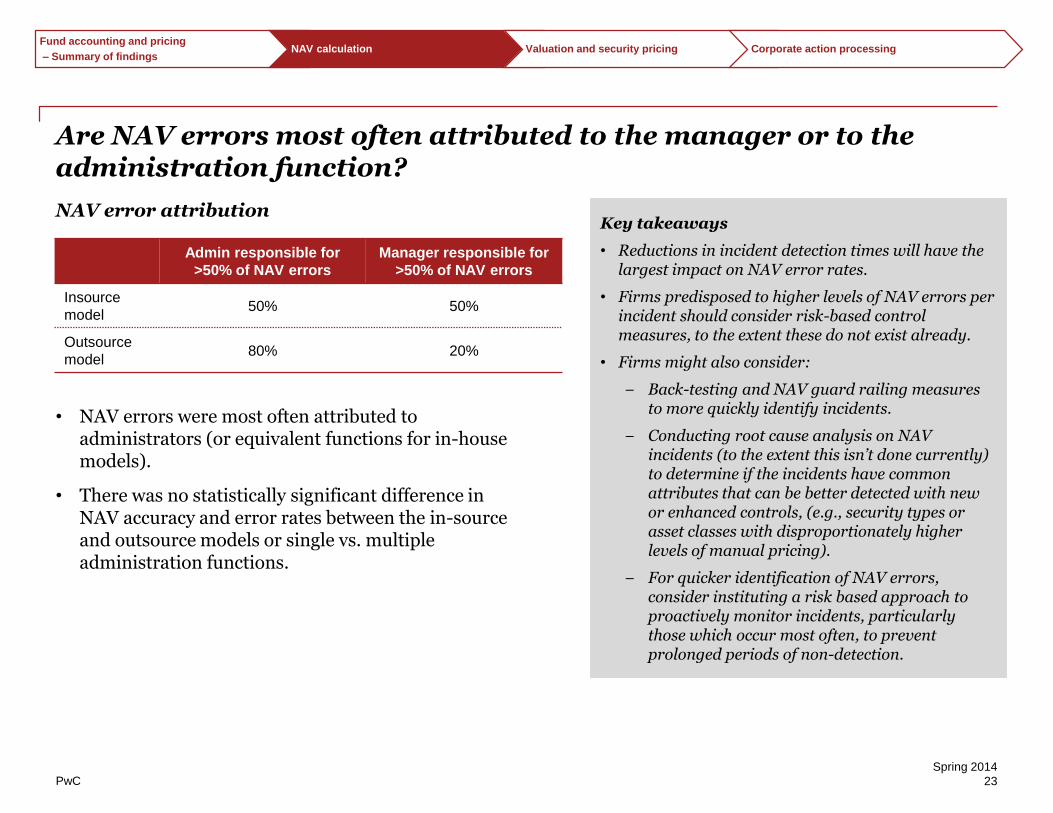
Are NAV errors most often attributed to the manager or to the administration function?
NAV error attribution
• NAV errors were most often attributed to administrators (or equivalent functions for in-house models).
• There was no statistically significant difference in NAV accuracy and error rates between the in-source and outsource models or single vs. multiple administration functions.
Admin responsible for
>50% of NAV errors
Manager responsible for
>50% of NAV errors
Insource
model50% 50%
Outsource
model80% 20%
Key takeaways
• Reductions in incident detection times will have the largest impact on NAV error rates.
• Firms predisposed to higher levels of NAV errors per incident should consider risk-based control measures, to the extent these do not exist already.
• Firms might also consider:
− Back-testing and NAV guard railing measures to more quickly identify incidents.
− Conducting root cause analysis on NAV incidents (to the extent this isn’t done currently) to determine if the incidents have common attributes that can be better detected with new or enhanced controls, (e.g., security types or asset classes with disproportionately higher levels of manual pricing).
− For quicker identification of NAV errors, consider instituting a risk based approach to proactively monitor incidents, particularly those which occur most often, to prevent prolonged periods of non-detection.
Fund accounting and pricing
– Summary of findingsNAV calculation Valuation and security pricing Corporate action processing
PwC
Spring 2014
24
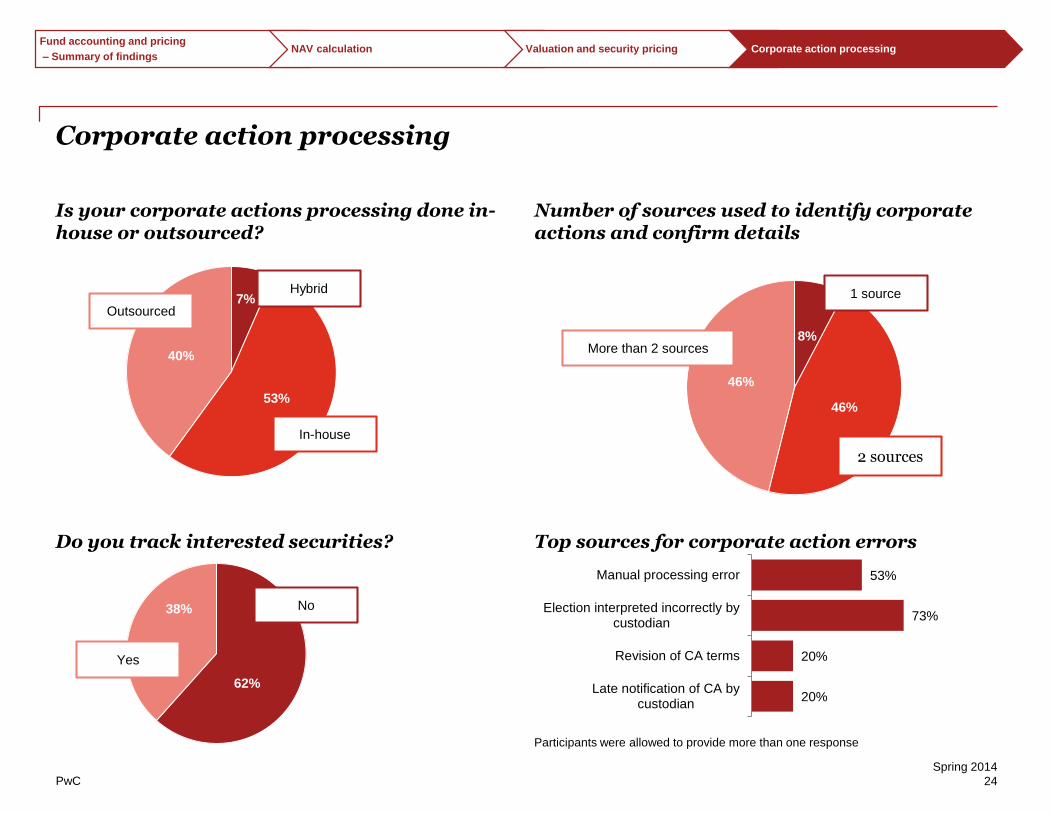
Number of sources used to identify corporate actions and confirm details
Top sources for corporate action errors
8%
46%
46%
62%
38%
Corporate action processing
Is your corporate actions processing done in-house or outsourced?
Do you track interested securities?
Yes
No
7%
53%
40%
1 source
2 sources
More than 2 sources
In-house
Outsourced
Hybrid
Participants were allowed to provide more than one response
20%
20%
73%
53%
Late notification of CA bycustodian
Revision of CA terms
Election interpreted incorrectly bycustodian
Manual processing error
Fund accounting and pricing
– Summary of findingsNAV calculation Valuation and security pricing Corporate action processing

PwC
Spring 2014
25
Fund reportingSection 4
PwC
Spring 2014
26
Summary of findings – Fund reporting
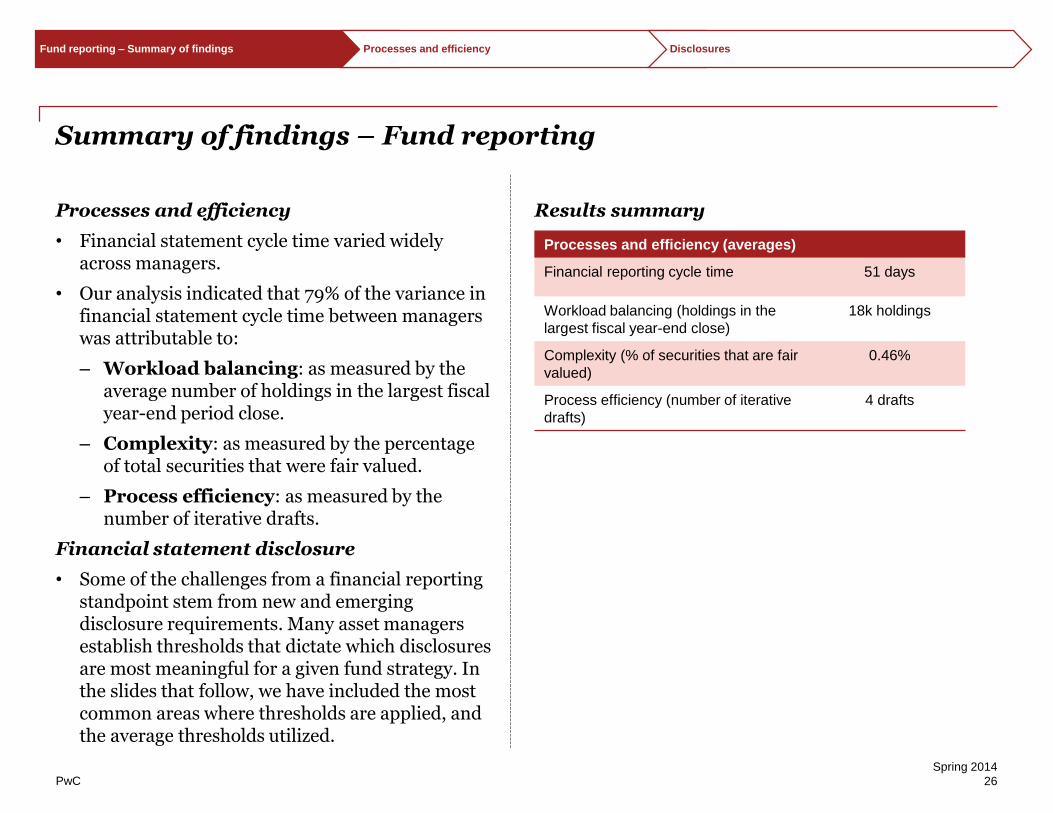
Processes and efficiency
• Financial statement cycle time varied widely across managers.
• Our analysis indicated that 79% of the variance in financial statement cycle time between managers was attributable to:
‒ Workload balancing: as measured by the average number of holdings in the largest fiscal year-end period close.
‒ Complexity: as measured by the percentage of total securities that were fair valued.
‒ Process efficiency: as measured by the number of iterative drafts.
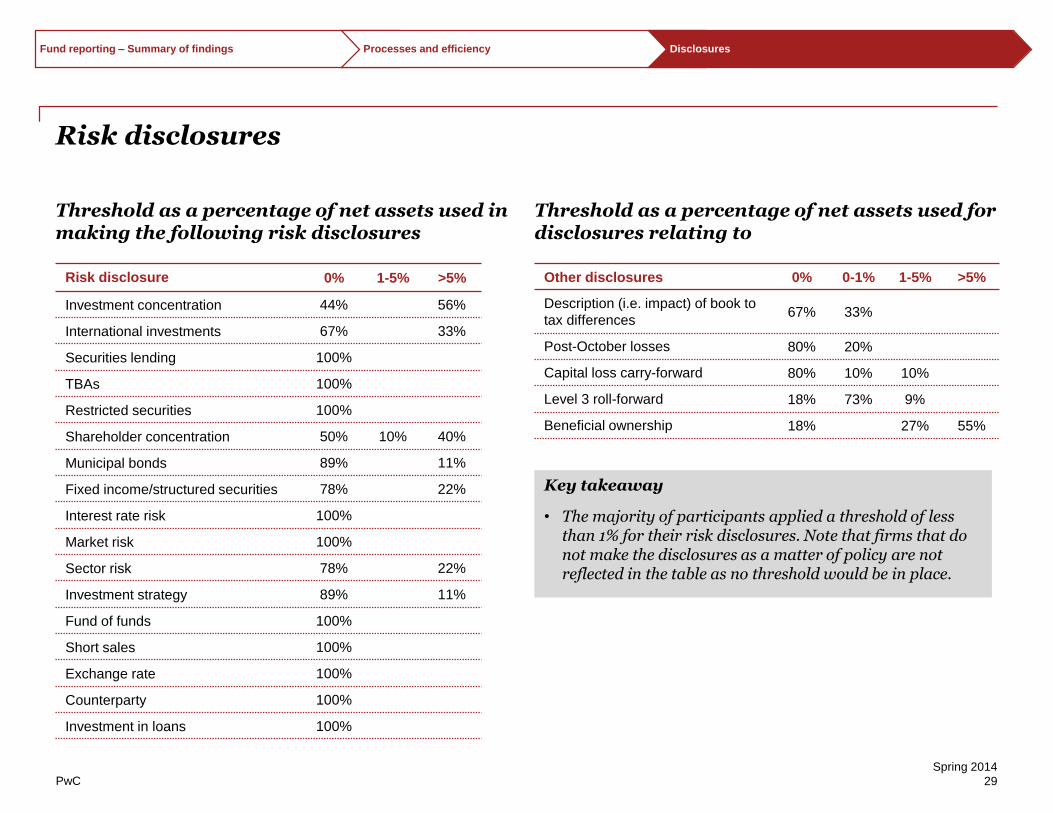
Financial statement disclosure
• Some of the challenges from a financial reporting standpoint stem from new and emerging disclosure requirements. Many asset managers establish thresholds that dictate which disclosures are most meaningful for a given fund strategy. In the slides that follow, we have included the most common areas where thresholds are applied, and the average thresholds utilized.
Results summary
Processes and efficiency (averages)
Financial reporting cycle time 51 days
Workload balancing (holdings in the
largest fiscal year-end close)
18k holdings
Complexity (% of securities that are fair
valued)
0.46%
Process efficiency (number of iterative
drafts)
4 drafts
Fund reporting – Summary of findings Processes and efficiency Disclosures
PwC
Spring 2014
27
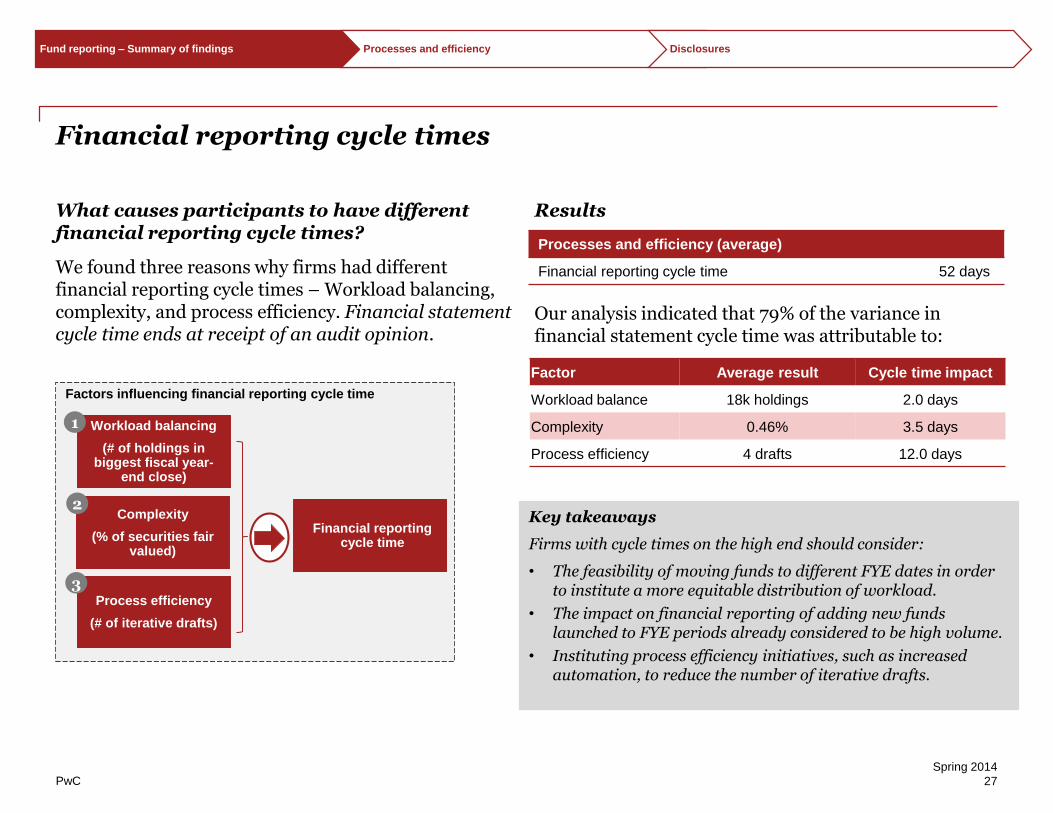
Financial reporting cycle times
What causes participants to have different financial reporting cycle times?
We found three reasons why firms had different financial reporting cycle times – Workload balancing, complexity, and process efficiency. Financial statement cycle time ends at receipt of an audit opinion.
Results
Our analysis indicated that 79% of the variance in financial statement cycle time was attributable to:
Factor Average result Cycle time impact
Workload balance 18k holdings 2.0 days
Complexity 0.46% 3.5 days
Process efficiency 4 drafts 12.0 days
Key takeaways
Firms with cycle times on the high end should consider:
• The feasibility of moving funds to different FYE dates in order to institute a more equitable distribution of workload.
• The impact on financial reporting of adding new funds launched to FYE periods already considered to be high volume.
• Instituting process efficiency initiatives, such as increased automation, to reduce the number of iterative drafts.
Factors influencing financial reporting cycle time
Workload balancing
(# of holdings in biggest fiscal year-
end close)
Complexity
(% of securities fair valued)
Process efficiency
(# of iterative drafts)
Financial reporting cycle time
1
2
3
Processes and efficiency (average)
Financial reporting cycle time 52 days
Fund reporting – Summary of findings Processes and efficiency Disclosures
PwC
Spring 2014
28
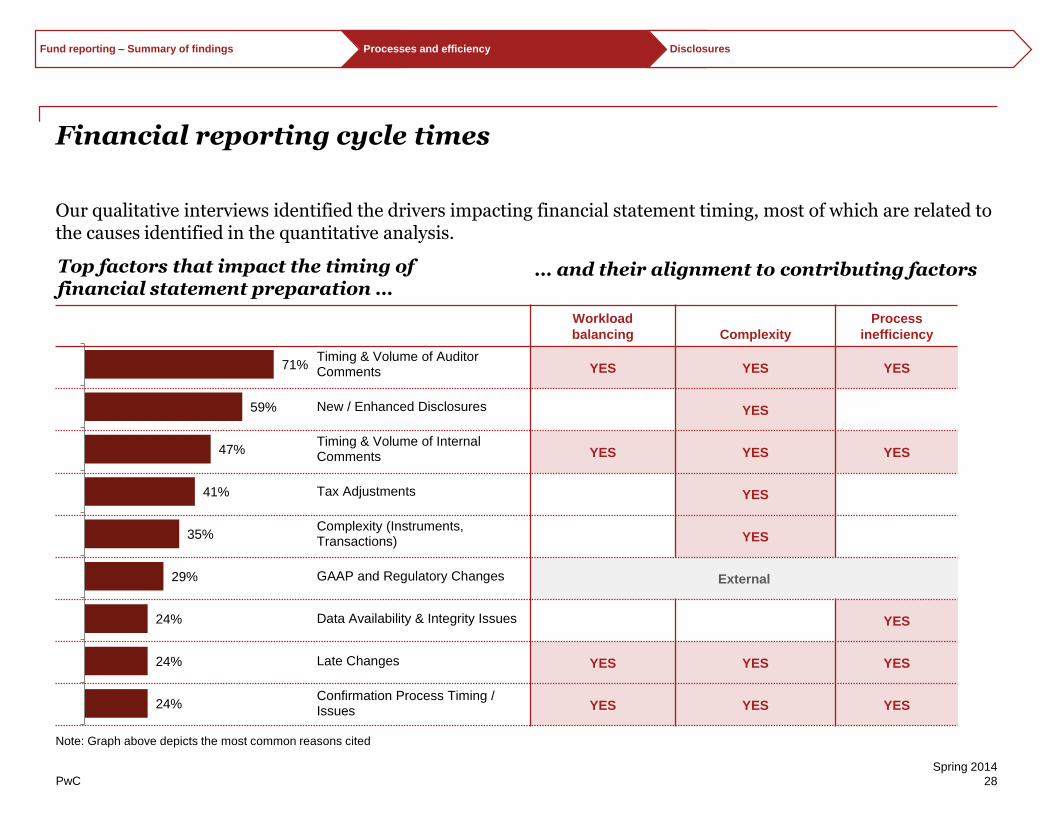
Top factors that impact the timing of financial statement preparation …
Note: Graph above depicts the most common reasons cited
… and their alignment to contributing factors
24%
24%
24%
29%
35%
41%
47%
59%
71%
Confirmation Process Timing /Issues
Late Changes
Data Availability & Integrity Issues
GAAP and Regulatory Changes
Complexity (Instruments,Transactions)
Tax Adjustments
Timing & Volume of InternalComments
New / Enhanced Disclosures
Timing & Volume of AuditorComments
Financial reporting cycle times
Our qualitative interviews identified the drivers impacting financial statement timing, most of which are related to the causes identified in the quantitative analysis.
Workload
balancing Complexity
Process
inefficiency
YES YES YES
YES
YES YES YES
YES
YES
External
YES
YES YES YES
YES YES YES
Fund reporting – Summary of findings Processes and efficiency Disclosures
PwC
Spring 2014
29
Risk disclosures
Threshold as a percentage of net assets used in making the following risk disclosures
Threshold as a percentage of net assets used for disclosures relating to
Risk disclosure 0% 1-5% >5%
Investment concentration 44% 56%
International investments 67% 33%
Securities lending 100%
TBAs 100%
Restricted securities 100%
Shareholder concentration 50% 10% 40%
Municipal bonds 89% 11%
Fixed income/structured securities 78% 22%
Interest rate risk 100%
Market risk 100%
Sector risk 78% 22%
Investment strategy 89% 11%
Fund of funds 100%
Short sales 100%
Exchange rate 100%
Counterparty 100%
Investment in loans 100%
Key takeaway
• The majority of participants applied a threshold of less than 1% for their risk disclosures. Note that firms that do not make the disclosures as a matter of policy are not reflected in the table as no threshold would be in place.
Other disclosures 0% 0-1% 1-5% >5%
Description (i.e. impact) of book to
tax differences 67% 33%
Post-October losses 80% 20%
Capital loss carry-forward 80% 10% 10%
Level 3 roll-forward 18% 73% 9%
Beneficial ownership 18% 27% 55%
Fund reporting – Summary of findings Processes and efficiency Disclosures
PwC
Spring 2014
30
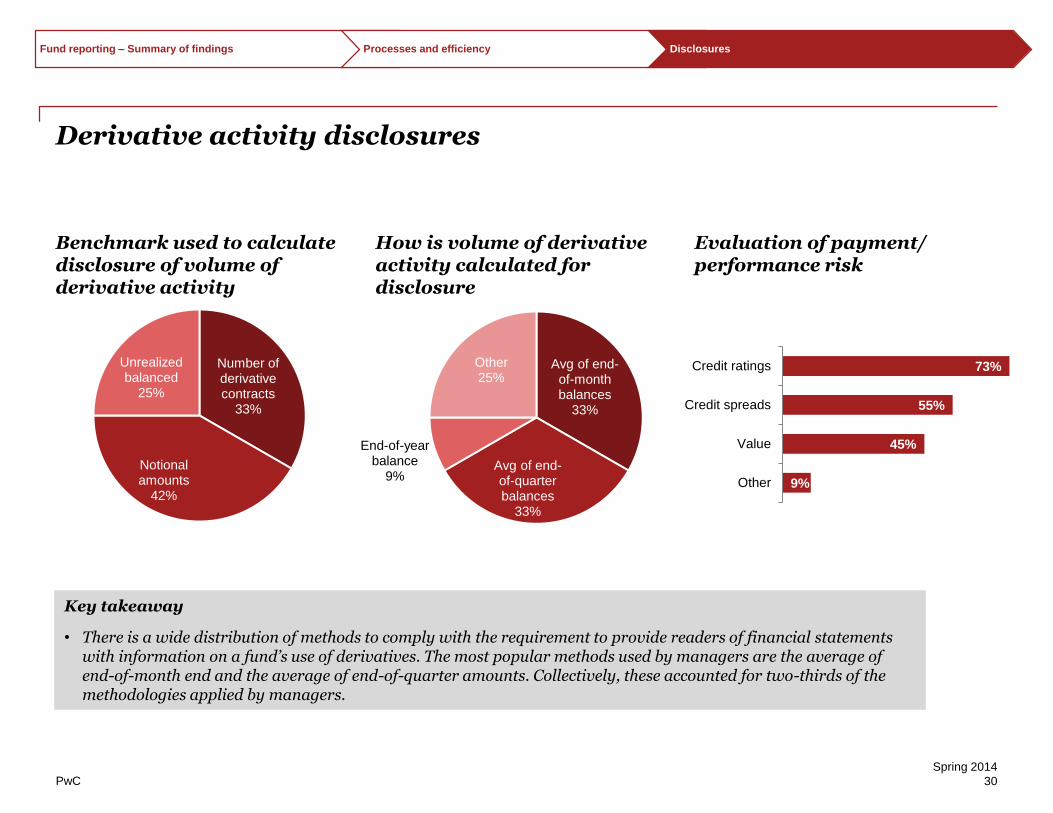
Derivative activity disclosures
Benchmark used to calculate disclosure of volume of derivative activity
How is volume of derivative activity calculated for disclosure
Evaluation of payment/performance risk
Number of derivative contracts
33%
Notional amounts
42%
Unrealized balanced
25%
Avg of end-of-month balances
33%
Avg of end-of-quarter balances
33%
End-of-year balance
9%
Other25%
Key takeaway
• There is a wide distribution of methods to comply with the requirement to provide readers of financial statements with information on a fund’s use of derivatives. The most popular methods used by managers are the average of end-of-month end and the average of end-of-quarter amounts. Collectively, these accounted for two-thirds of the methodologies applied by managers.
73%
55%
45%
9%
Credit ratings
Credit spreads
Value
Other
Fund reporting – Summary of findings Processes and efficiency Disclosures
PwC
Spring 2014
31
Shareholder transactions Section 5
“Straight through processing is no longer an option – it’s a necessity. The ability to process transactions across multiple entities and organizations in a timely and effective manner is critical for mutual funds.”
Kevin O’Connell Asset Management Risk Assurance Partner
PwC
Spring 2014
32
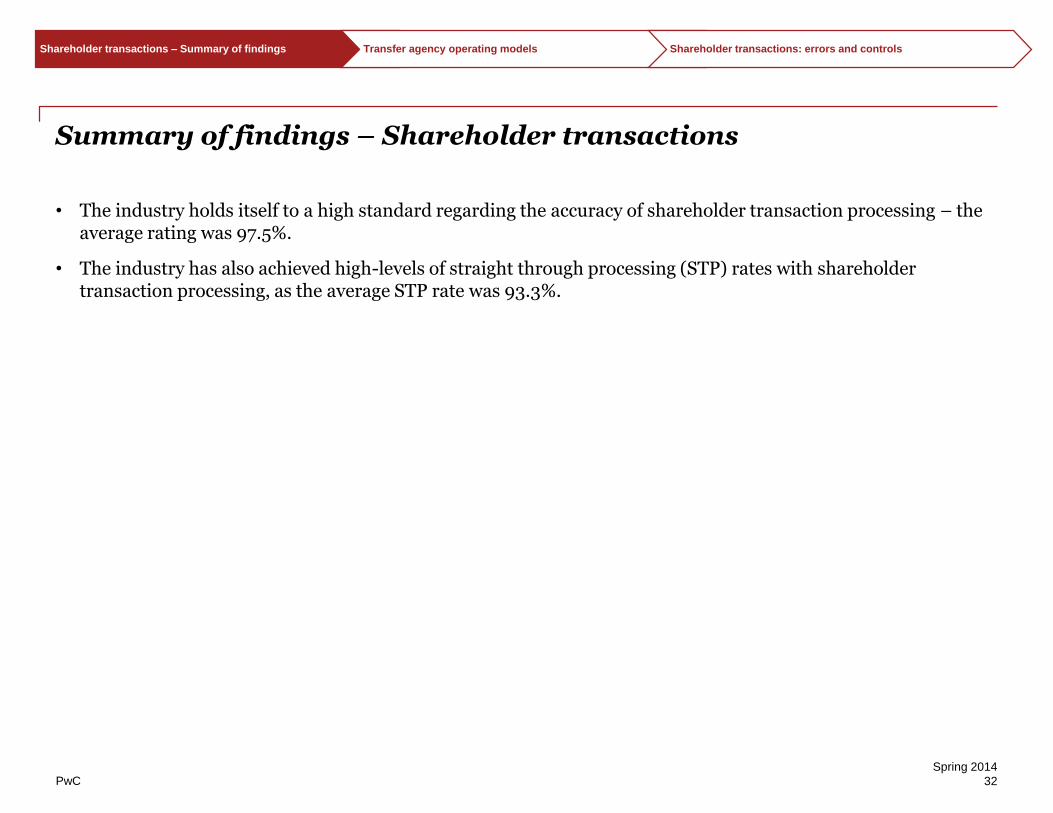
Summary of findings – Shareholder transactions
• The industry holds itself to a high standard regarding the accuracy of shareholder transaction processing – the average rating was 97.5%.
• The industry has also achieved high-levels of straight through processing (STP) rates with shareholder transaction processing, as the average STP rate was 93.3%.
Shareholder transactions – Summary of findings Transfer agency operating models Shareholder transactions: errors and controls
PwC
Spring 2014
33
31%
19%
50%
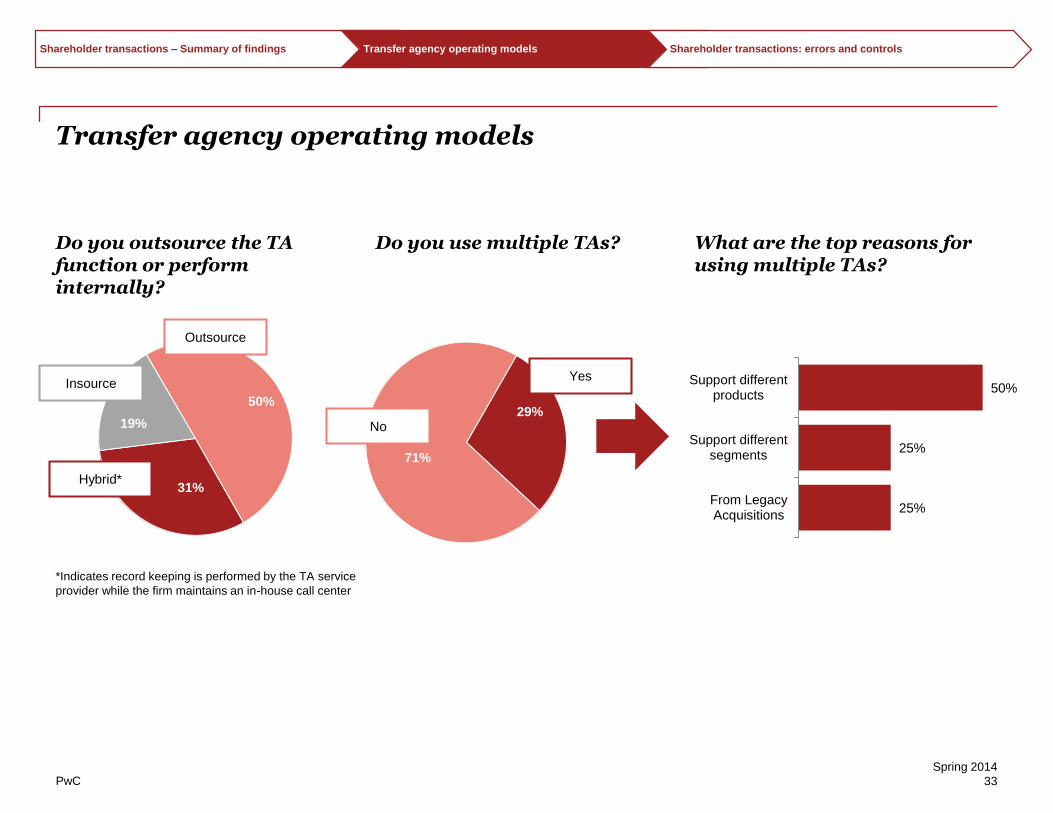
Transfer agency operating models
Do you outsource the TA function or perform internally?
Do you use multiple TAs? What are the top reasons for using multiple TAs?
Hybrid*
Outsource
*Indicates record keeping is performed by the TA service
provider while the firm maintains an in-house call center
Insource
29%
71%
No
Yes
25%
25%
50%
From LegacyAcquisitions
Support differentsegments
Support differentproducts
Shareholder transactions – Summary of findings Transfer agency operating models Shareholder transactions: errors and controls
PwC
Spring 2014
34
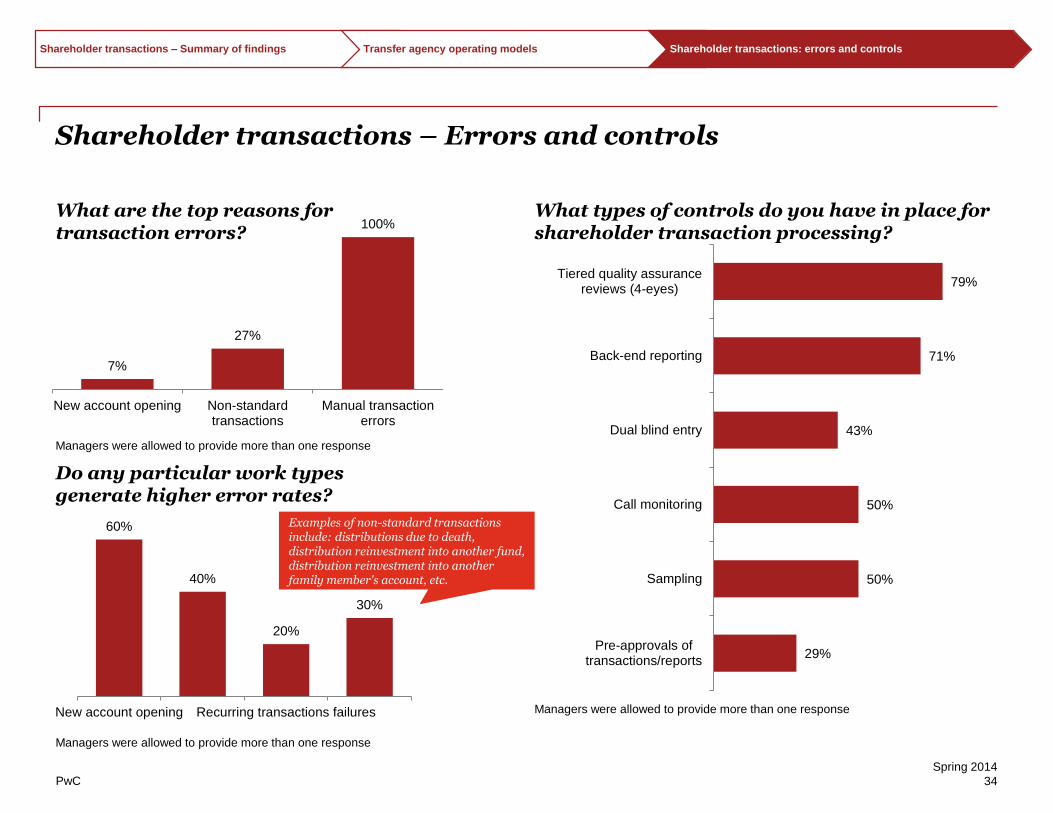
7%
27%
100%
New account opening Non-standardtransactions
Manual transactionerrors
60%
40%
20%
30%
New account opening Recurring transactions failures
Examples of non-standard transactions include: distributions due to death, distribution reinvestment into another fund, distribution reinvestment into another family member's account, etc.
29%
50%
50%
43%
71%
79%
Pre-approvals oftransactions/reports
Sampling
Call monitoring
Dual blind entry
Back-end reporting
Tiered quality assurancereviews (4-eyes)
Shareholder transactions – Errors and controls
What are the top reasons for transaction errors?
Do any particular work types generate higher error rates?
What types of controls do you have in place for shareholder transaction processing?
Managers were allowed to provide more than one response
Managers were allowed to provide more than one response
Managers were allowed to provide more than one response
Shareholder transactions – Summary of findings Transfer agency operating models Shareholder transactions: errors and controls
PwC
Spring 2014
35
Tax filing and distributionSection 6
“Tax function effectiveness continues to be a hot topic in client conversations. The level of automation in place, the type of operational model employed, and the unique challenges facing mutual funds are all items that should be considered in designing a more efficient tax function.”
Shawn Baker US Asset Management Traditional Funds Tax Leader
PwC
Spring 2014
36
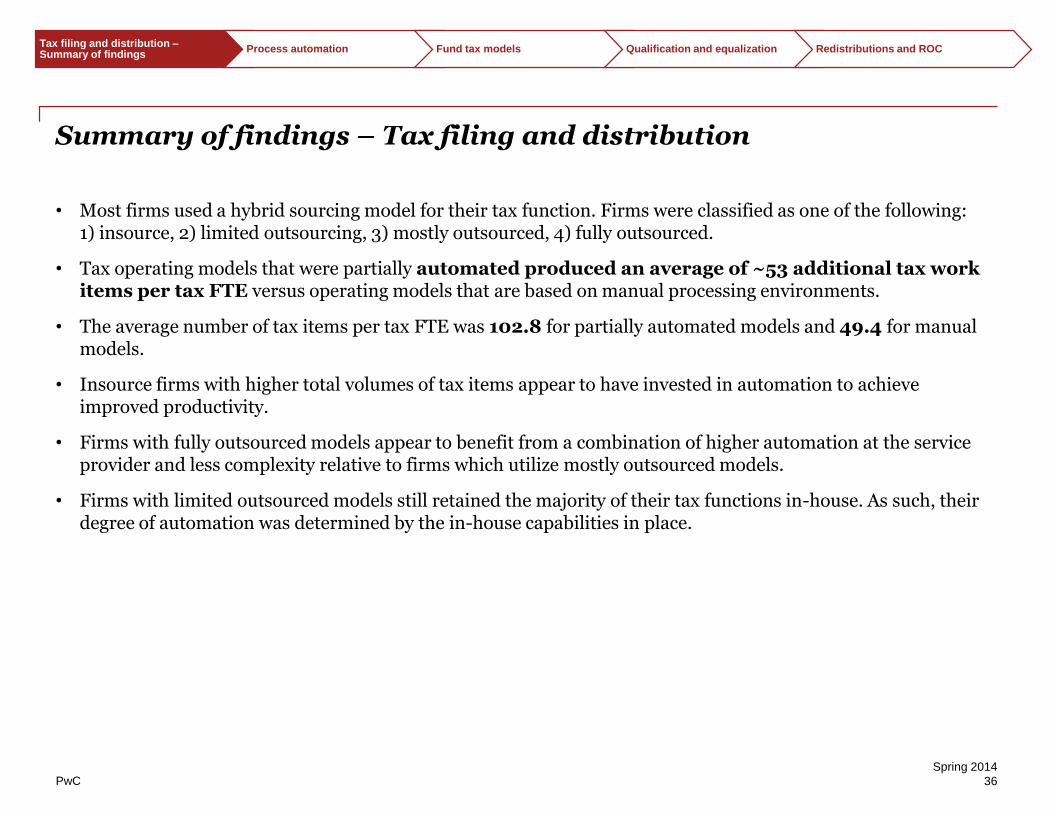
Summary of findings – Tax filing and distribution
• Most firms used a hybrid sourcing model for their tax function. Firms were classified as one of the following: 1) insource, 2) limited outsourcing, 3) mostly outsourced, 4) fully outsourced.
• Tax operating models that were partially automated produced an average of ~53 additional tax work items per tax FTE versus operating models that are based on manual processing environments.
• The average number of tax items per tax FTE was 102.8 for partially automated models and 49.4 for manual models.
• Insource firms with higher total volumes of tax items appear to have invested in automation to achieve improved productivity.
• Firms with fully outsourced models appear to benefit from a combination of higher automation at the service provider and less complexity relative to firms which utilize mostly outsourced models.
• Firms with limited outsourced models still retained the majority of their tax functions in-house. As such, their degree of automation was determined by the in-house capabilities in place.
Tax filing and distribution –Summary of findings
Process automation Fund tax models Qualification and equalization Redistributions and ROC
PwC
Spring 2014
37
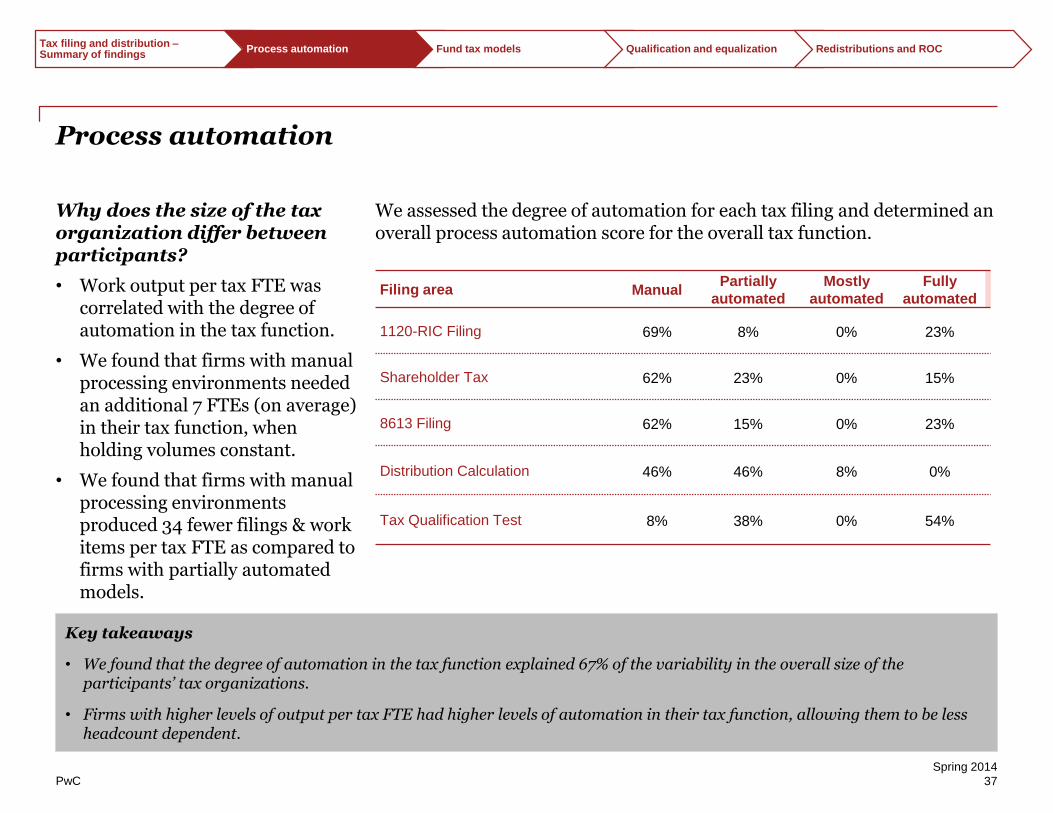
Process automation
Why does the size of the tax organization differ between participants?
• Work output per tax FTE was correlated with the degree of automation in the tax function.
• We found that firms with manual processing environments needed an additional 7 FTEs (on average) in their tax function, when holding volumes constant.
• We found that firms with manual processing environments produced 34 fewer filings & work items per tax FTE as compared to firms with partially automated models.
We assessed the degree of automation for each tax filing and determined an overall process automation score for the overall tax function.
Key takeaways
• We found that the degree of automation in the tax function explained 67% of the variability in the overall size of the participants’ tax organizations.
• Firms with higher levels of output per tax FTE had higher levels of automation in their tax function, allowing them to be less headcount dependent.
Filing area ManualPartially
automated
Mostly
automated
Fully
automated
1120-RIC Filing 69% 8% 0% 23%
Shareholder Tax 62% 23% 0% 15%
8613 Filing 62% 15% 0% 23%
Distribution Calculation 46% 46% 8% 0%
Tax Qualification Test 8% 38% 0% 54%
Tax filing and distribution –Summary of findings
Process automation Fund tax models Qualification and equalization Redistributions and ROC

PwC
Spring 2014
38
69%
23%
8% Insourced
38%
62%
23%
77%
Qualification and equalization
Who reviews qualification testing?
Compliance
Tax
Different function Same function
Is the review performed by a different functional group?
Who performs qualification testing?
60%
30%
10%
Both
Outsourced
Tax
Compliance
Fund accounting
If performed internally, what function is running the test
Review the test
Run the test
Tax filing and distribution –Summary of findings
Process automation Fund tax models Qualification and equalization Redistributions and ROC
PwC
Spring 2014
39
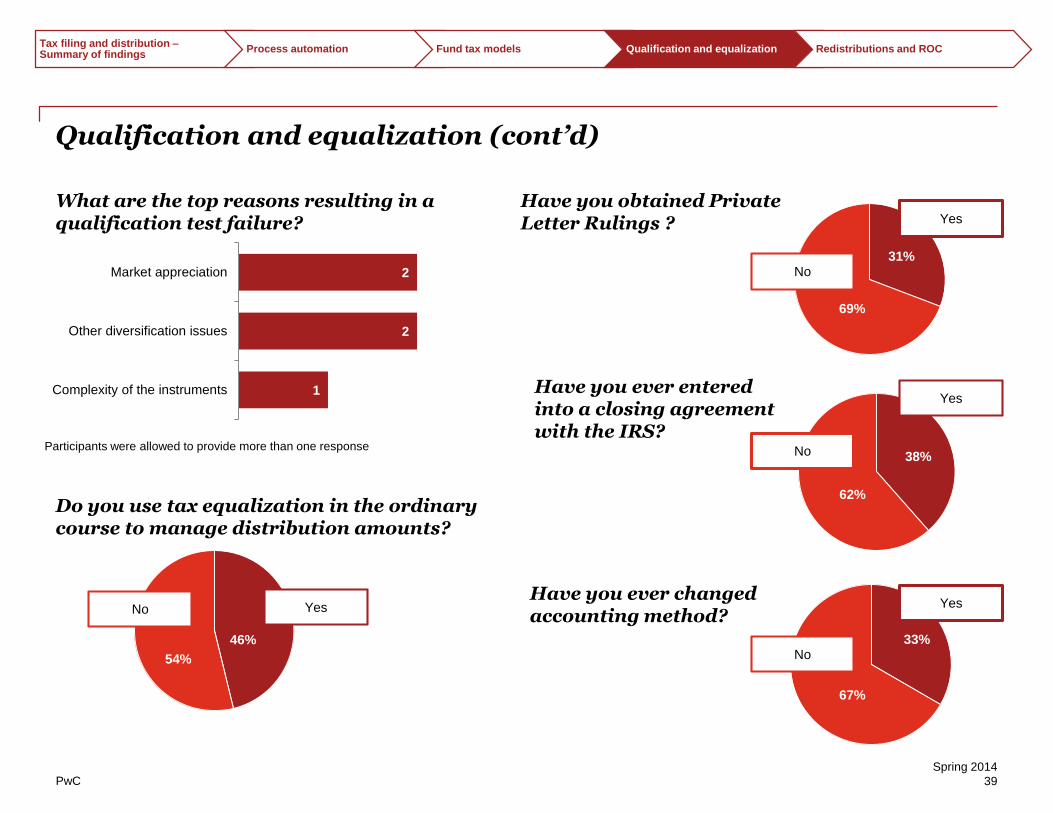
Qualification and equalization (cont’d)
31%
69%
Yes
No
Have you obtained Private Letter Rulings ?
38%
62%
Yes
No
Have you ever entered into a closing agreement with the IRS?
33%
67%
Have you ever changed accounting method?
Yes
No
1
2
2
Complexity of the instruments
Other diversification issues
Market appreciation
What are the top reasons resulting in a qualification test failure?
Participants were allowed to provide more than one response
Do you use tax equalization in the ordinary course to manage distribution amounts?
46%
54%
YesNo
Tax filing and distribution –Summary of findings
Process automation Fund tax models Qualification and equalization Redistributions and ROC
PwC
Spring 2014
40
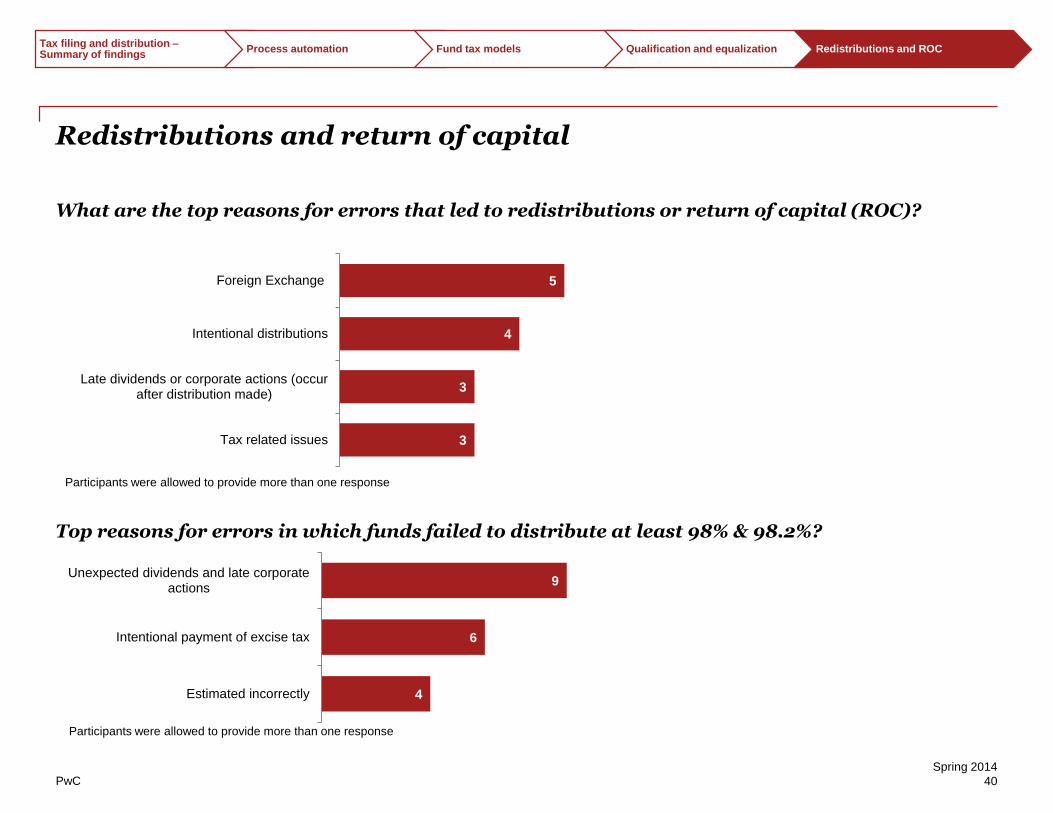
Redistributions and return of capital
What are the top reasons for errors that led to redistributions or return of capital (ROC)?
Top reasons for errors in which funds failed to distribute at least 98% & 98.2%?
3
3
4
5
Tax related issues
Late dividends or corporate actions (occurafter distribution made)
Intentional distributions
Foreign Exchange
4
6
9
Estimated incorrectly
Intentional payment of excise tax
Unexpected dividends and late corporateactions
Participants were allowed to provide more than one response
Participants were allowed to provide more than one response
Tax filing and distribution –Summary of findings
Process automation Fund tax models Qualification and equalization Redistributions and ROC

PwC
Spring 2014
41
Contacts
Barry BenjaminUS & Global Asset Management Leader410 659 [email protected]
Gary MeltzerGlobal and US Asset Management Advisory Leader646 471 [email protected]
Julien CourbeUS Asset Management Advisory Leader646 471 [email protected]
Peter FinnertyUS Asset Management Traditional Funds Assurance Leader617 530 [email protected]
John GriffinGovernance 617 530 [email protected]
Shawn BakerUS Asset Management Traditional Funds Tax Leader617 530 [email protected]
Kevin O’ConnellRisk Assurance617 530 [email protected]
Frank SerravalliValuation 646 471 [email protected]
Lead contributors
Debasis Sahu646 471 [email protected]
Erich Butters646 471 [email protected]

www.pwc.com
© 2014 PricewaterhouseCoopers LLP, a Delaware limited liability partnership. All rights
reserved. PwC refers to the US member firm, and may sometimes refer to the PwC network.
Each member firm is a separate legal entity. Please see www.pwc.com/structure for further
details. This content is for general information purposes only, and should not be used as a
substitute for consultation with professional advisors.
Solicitation


