
1Grant 5R01HD057839-04 from the National Institute of Child Health & Human Development, National Institutes of Health.
Report published 2013, Oregon Research Institute, Eugene, Oregon.
Bethel School District Report: Grocery Store Food Environment
A Report from the Communities and Schools Together (CAST) Project1
Geraldine Moreno-Black, PhD, CNS, Deb Johnson-Shelton, PhD, and Shawn Boles, PhD
Oregon Research Institute
Introduction and Background
CAST was a 5-year project examining built and social environments for improving child health
in the Bethel School District. As part of the project, local food resources were assessed by both
mapping and describing selected food access locations in the district. This report explicitly
focuses on the assessment and evaluation of large grocery stores located in the CAST study area.
There is a growing recognition that food environments can influence individual and community
health (Chaloupka & Powell, 2009; Holsten, 2008; Larson, Story, & Nelson, 2009). Describing
what constitutes food environments is not altogether clear and a number of conceptual models
have been proposed (Ahern, Brown, & Dukas, 2011; Booth et al., 2001; Giskes et al., 2007;
Story, Kaphingst, Robinson-O’Brien, & Glanz, 2008). Glanz and colleagues argued a model for
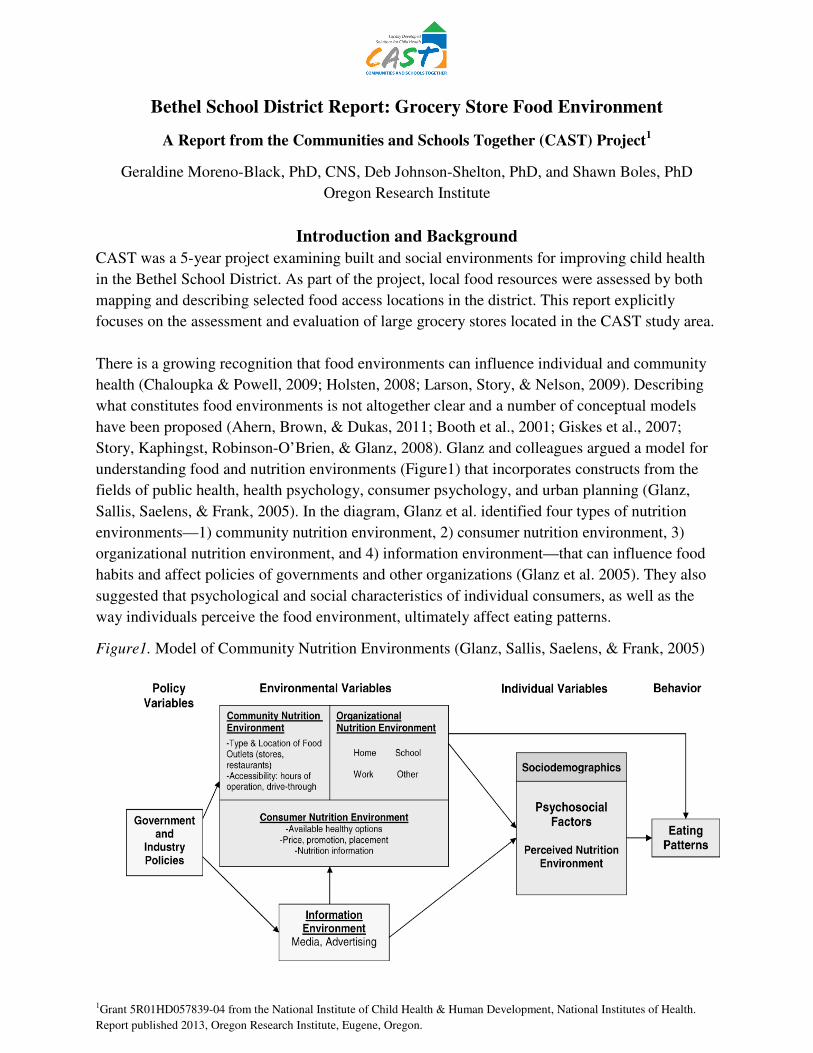
understanding food and nutrition environments (Figure1) that incorporates constructs from the
fields of public health, health psychology, consumer psychology, and urban planning (Glanz,
Sallis, Saelens, & Frank, 2005). In the diagram, Glanz et al. identified four types of nutrition
environments—1) community nutrition environment, 2) consumer nutrition environment, 3)
organizational nutrition environment, and 4) information environment—that can influence food
habits and affect policies of governments and other organizations (Glanz et al. 2005). They also
suggested that psychological and social characteristics of individual consumers, as well as the
way individuals perceive the food environment, ultimately affect eating patterns.
Figure1. Model of Community Nutrition Environments (Glanz, Sallis, Saelens, & Frank, 2005)
2
The CAST Project focused on the consumer environment (Figure1) because it is of particular
interest when trying to identify factors that can influence how people aquire food. The consumer
food environment reflects what consumers encounter within and around retail food outlets
(stores, restaurants, farmers markets, etc.) and includes the availability and price of healthful
food choices (French, 2003; Giskes et al., 2007; Glanz et al., 2005; Kamphuis et al. 2006).
Aspects that can influence food choices include price, promotions, placement of products, range
of choices, freshness, and nutritional information. A growing body of research has begun
examining the relationship between access and availability of food (e.g., food store type,
restaurant type, distance, food prices, etc.) and dietary and health outcomes. Findings related to
food access and availability in the consumer environment include:
1. Larger food store size is associated with better access to fresh fruits and vegetables
and other nutrient-dense food (Horowitz, Colson, Hebert, & Lancaster, 2004; Jetter &
Cassady, 2006; Laraia, Siega-Riz, Kaufman, & Jones, 2004; Wang et al., 2007).
2. The availability of supermarkets is associated with healthier diets, lower rates of
obesity, and a longer life span (Cummins & Macintyre, 2006; Larson et al, 2009; Liu,
Wilson, Qi, & Ling, 2007; Morland, Diez Roux, & Wing, 2006; Morland & Evenson,
2009).
3. Individuals who live in neighborhoods with access to food stores and restaurants that
carry healthier choices are more likely to consume better quality diets, including
greater consumption of fruits and vegetables (Morland, Wing, & Diaz Roux, 2002;
Rose & Richards, 2004; Zenk et al., 2009).
4. Availability and access to healthy food outlets are associated with improved
diet-related health outcomes, such as lower rates of overweight, obesity, and diabetes
(Ahern et al., 2011; Ohri-Vachaspati, Martinez, Yedidia, & Petlick, 2011).
In order to understand the consumer nutrition environment in the Bethel School District and
evaluate the availability of resources where residents can access healthful, affordable food,
members of the CAST Food Assessment Workgroup conducted an evaluation of the two largest
grocery stores in the school district.
Methods
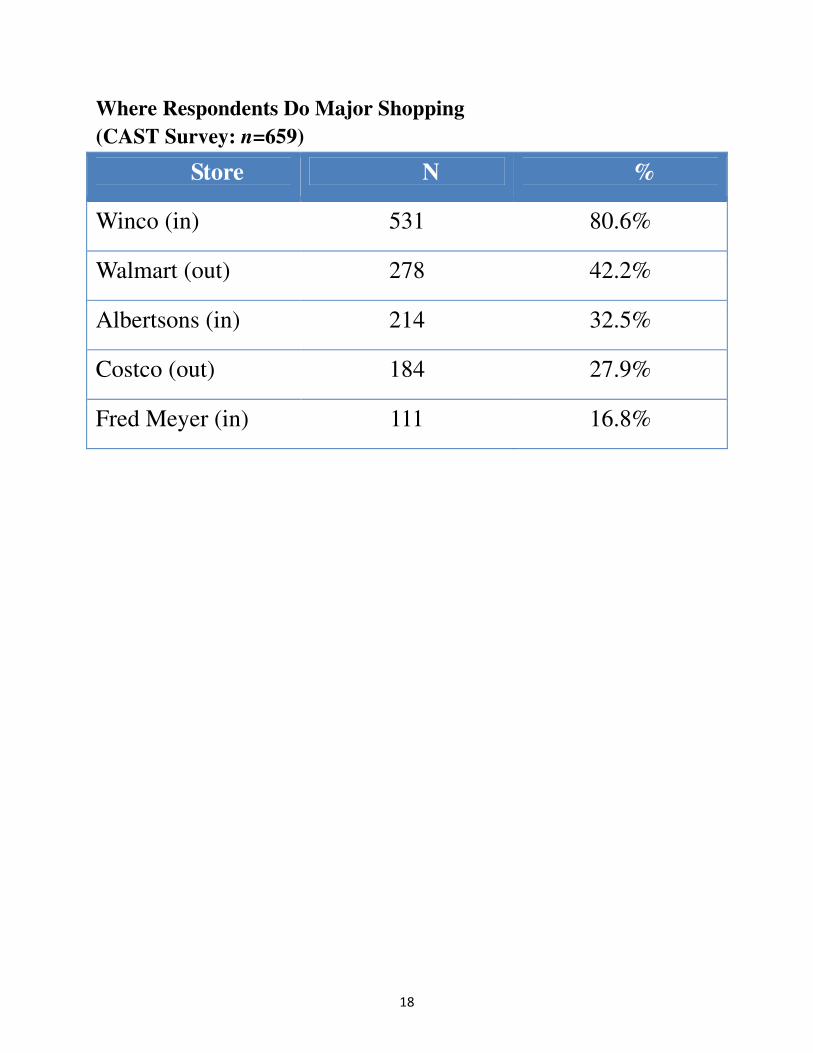
Two full-scale grocery stores were identified in the CAST Study area. Surveys conducted with a
random sample of CAST participants indicated that the majority of CAST families (80.6%)
shopped at WinCo for their main weekly shopping. Respondents also indicated Albertsons
(32.5%) and Wal-Mart (42.2%) were utilized for major shopping (see Appendix A). However,
Wal-Mart was not included in the survey because it is located outside of the school district and
because it carries a large variety of nonfood items and is therefore classified as a super store
rather than a grocery store.

3
The specific aims of the evaluation were to:
1. Examine the availability and pricing differences of healthy foods in grocery stores using
the Nutrition Environment Measures Survey in Stores (NEMS-S) (Glanz, Sallis, Saelens,
& Frank, 2007).
2. Evaluate the availability of healthy foods using the Healthy Food Availability Index
(HFAI).
3. Examine the physical store environment by determining the store floor plan and layout.
The physical environment in the store can influence shopping patterns and emphasize the
purchase of some foods/goods over others.
4. Determine if stores promote healthy eating patterns and provide information about
nutritional content of food.
The three data collection approaches used in this study included the assessment of the Nutrition
Environment Measures Survey in Stores (NEMS-S), the Healthy Food Availability Index
(HFAI), and a qualitative examination of grocery store layout design of products and signage for
consumer marketing. These approaches are briefly described next.
A. NEMS-S
The quality and availability of healthy foods in the identified food outlets were evaluated by two
trained data collectors using the Nutrition Environment Measures Survey in Stores (NEMS-S).
The NEMS-S was developed to measure the availability and pricing of healthy and less-healthy
options among 10 food categories (fresh fruit, fresh vegetables, milk, ground beef, hot dogs,
frozen dinners, soda and juice, baked goods, bread, and snack chips). These categories were
chosen by the developers of the NEMS-S tool because they were determined to represent foods
found in a typical American diet and included food options for consumers that are recommended
for a healthy eating pattern (Glanz et al., 2007). The instrument’s reliability was previously
tested in 85 stores located in Atlanta and both interrater reliability and test–retest reliability were
high (Glanz et al., 2007). The NEMS-S consists of three subscales: availability of healthy foods
(range 0 to 30), price of healthier options (range -9 to 18), and quality of produce (range 0 to 6),
with higher scores indicating better options. The total score for NEMS-S is a composite of the
availability, price, and quality subscales (range -9 to 54) (Bertoni, Foy, Hunter, & Quandt, 2011;
Glanz et al., 2007) (See Appendix B). The number of cash registers, including self-checkout
style checkout registers, was used to approximate store size.
B. Healthy Food Availability Evaluation (HFAI)
Using a method proposed by Franco and colleagues (2008), each store was also evaluated using a
Healthy Food Availability Index (HFAI). These researchers followed procedures developed as
part of the NEMS-S (Glanz et al., 2007) with some modifications, which include the addition of
some healthier food item options and information. In particular the HFAI includes: low-sodium
tuna and soup, proportion of shelf space for frozen vegetables to ice cream, and availability of
boneless chicken. The availability of boneless and skinless chicken breasts was added since it is
considered a healthier protein choice compared to beef or pork. The low sodium soup and tuna
4
were added because of the association of dietary salt with high blood pressure and other health
issues. The HFAI ranges from 0 to 27 points, with a higher score indicating a greater availability
of healthy foods. Points were assigned as in Appendix C. Franco et al. (2008) defined low
availability of healthy foods as the lowest tertile of food availability scores and high availability
of healthy foods as being in the highest tertile.
C. Floor Plan
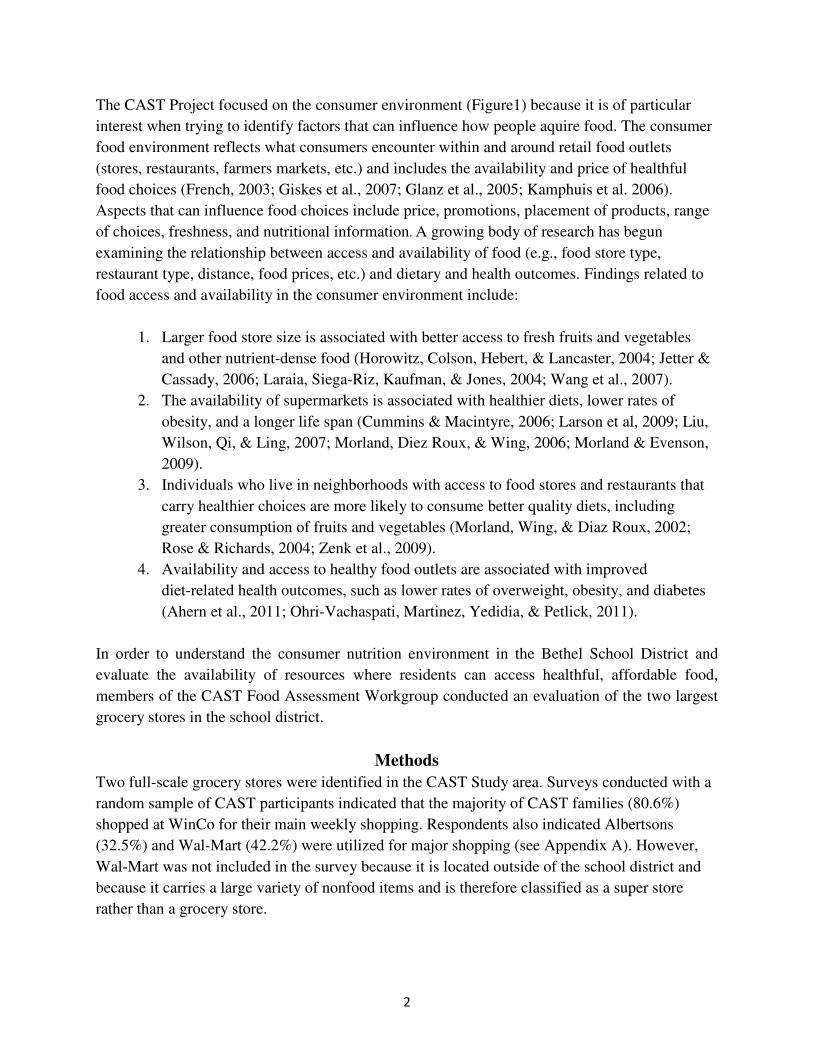
Floor Plan/Zone and layout mapping is used to illustrate where products are placed within the
retail environment. A typical grocery store (Figure 2) usually follows a specific floor plan. The
whole food, produce, meat, and milk, etc., are typically found on the perimeter while the more
heavily processed and packaged food is dispersed throughout the core. The evaluation and
comparison of the store’s floor plan compared the specific layout of the stores. Investigators
walked through the store and compared the floor plan to the published floor plan for each store
and made appropriate adjustments to the diagrams.
Figure 2. A Typical Store Floor Plan. Available from EZblueprint, Sample floor plan drawings:
http://www.ezblueprint.com/examples.html
Fresh & whole food Processed/packaged/canned food Endcap displays/checkout
5
D. Promotion of Healthful Eating and Nutrition Information
Signs and promotional strategies have been used not only as tools to direct customers to food or
reinforce “store image,” but also as part of a marketing plan to increase profit, cross-reference
products, provide information, and spark interest. Signage in grocery stores usually focuses on
impulse buys and high commodity items. Other strategies employing signage often focus on
pseudo foods (i.e., “junk food”) and promotions. These items add calories and fat, but do little to
maintain health. They provide few nutrients, too much salt or sugar, and are not healthy to
consume in large quantities.
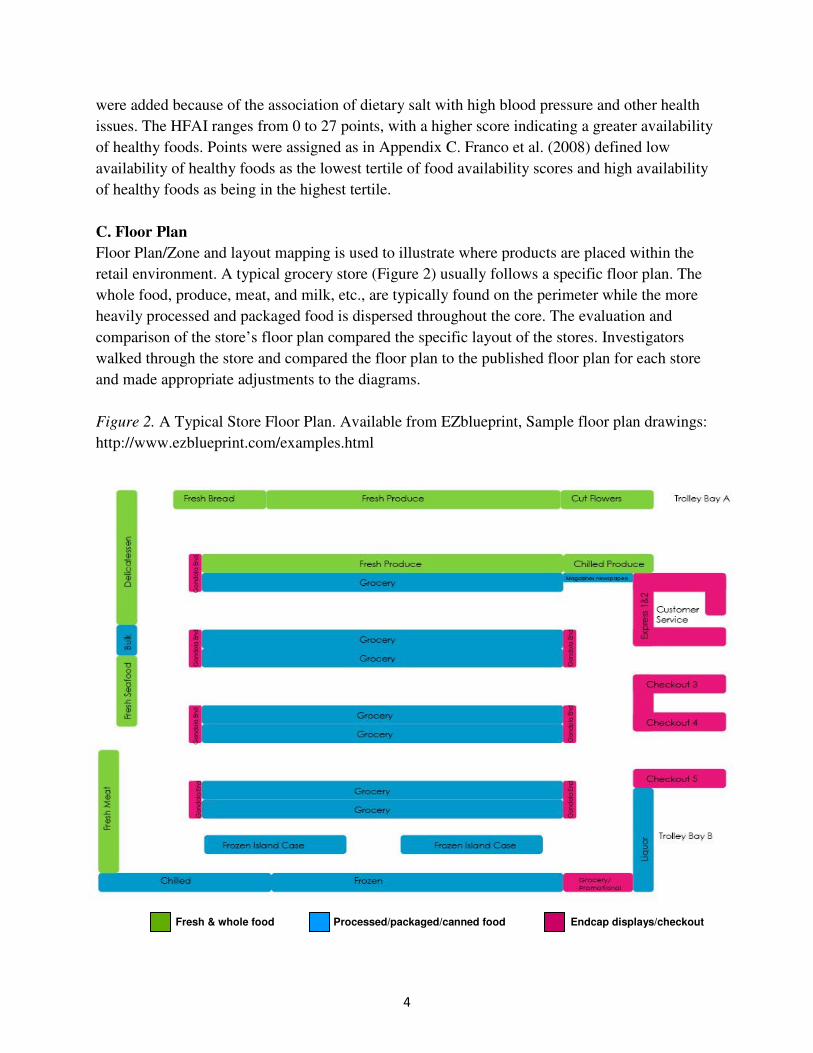
The evaluation of promotion of healthful food and nutrition information was accomplished
through surveying each store and locating and photographing signage related to sales,
promotions, “impulse purchase” displays such as endcap promotions (Figure 3), and nutrition/
healthy food signage and information.
Figure 3. Typical “Endcap” Promotions
Results
A. NEMS-S Score
The details of the NEMS-S scores for the stores in the survey are shown in Appendix A. There
was very little difference across the stores in their scores. Both the regular and healthier food
options were widely available in both of the stores and approached the measure’s maximum
number (or more) of varieties for whole wheat bread (6+) and low sugar cereal (3+). Both stores
had more than half of shelf space containing reduced-fat frozen dinners. There were, however,
some differences in the individual components. The four healthier items on NEMS-S (e.g., 100%
juice, lean hot dogs, lean ground beef, and whole wheat bread) were offered at higher prices than
the regular options. Therefore, the stores scored poorly in this category. However, baked chips
and healthier cereals had lower prices than their less healthy alternatives.
Shelf space for low-fat milk varied somewhat between the stores, with more shelf space allotted
to lowfat milk in the Albertson’s. However, both stores priced the low-fat/skim milk at the same
price or less than the whole milk. Generally, purchasing the 10 nonproduce healthier items would
6
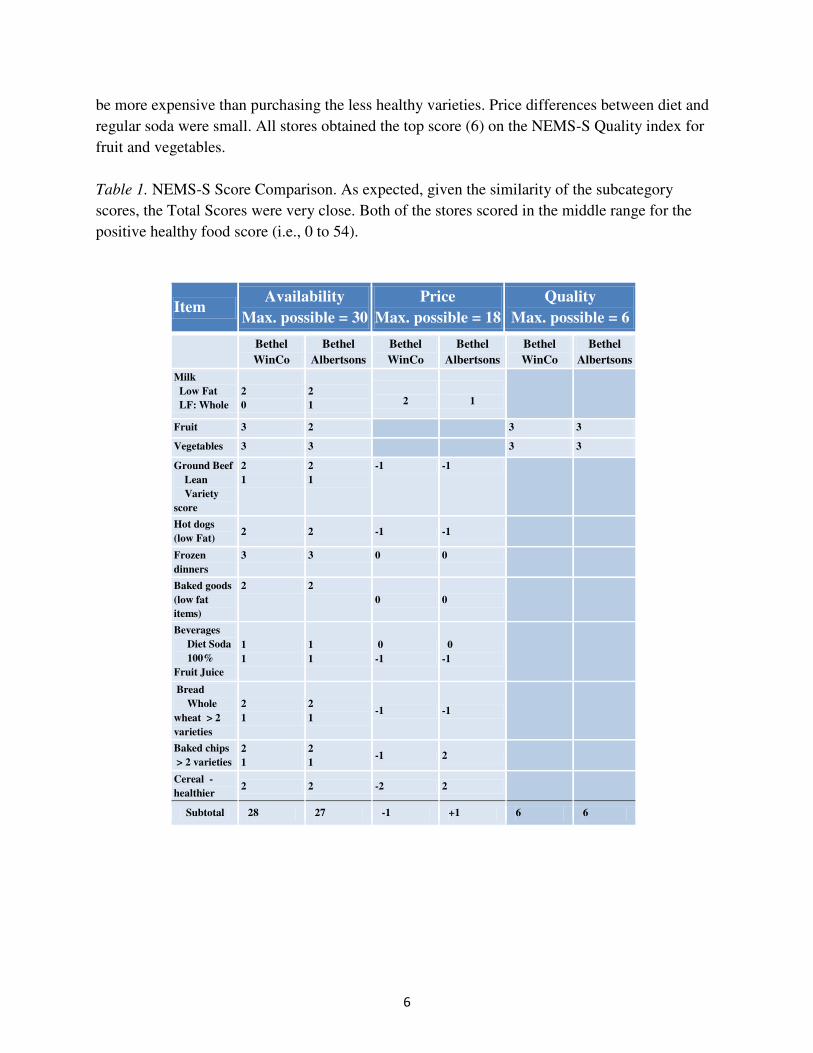
be more expensive than purchasing the less healthy varieties. Price differences between diet and
regular soda were small. All stores obtained the top score (6) on the NEMS-S Quality index for
fruit and vegetables.
Table 1. NEMS-S Score Comparison. As expected, given the similarity of the subcategory
scores, the Total Scores were very close. Both of the stores scored in the middle range for the
positive healthy food score (i.e., 0 to 54).
Item Availability
Max. possible = 30
Price
Max. possible = 18
Quality
Max. possible = 6
Bethel
WinCo
Bethel
Albertsons
Bethel
WinCo
Bethel
Albertsons
Bethel
WinCo
Bethel
Albertsons
Milk
Low Fat
LF: Whole
2
0
2
1
2
1
Fruit 3 2 3 3
Vegetables 3 3 3 3
Ground Beef
Lean
Variety
score
2
1
2
1
-1 -1
Hot dogs
(low Fat) 2 2 -1 -1
Frozen
dinners
3 3 0 0
Baked goods
(low fat
items)
2 2
0 0
Beverages
Diet Soda
100%
Fruit Juice
1
1
1
1
0
-1
0
-1
Bread
Whole
wheat > 2
varieties
2
1
2
1 -1 -1
Baked chips
> 2 varieties
2
1
2
1 -1 2
Cereal -
healthier 2 2 -2 2
Subtotal 28 27 -1 +1 6 6
7
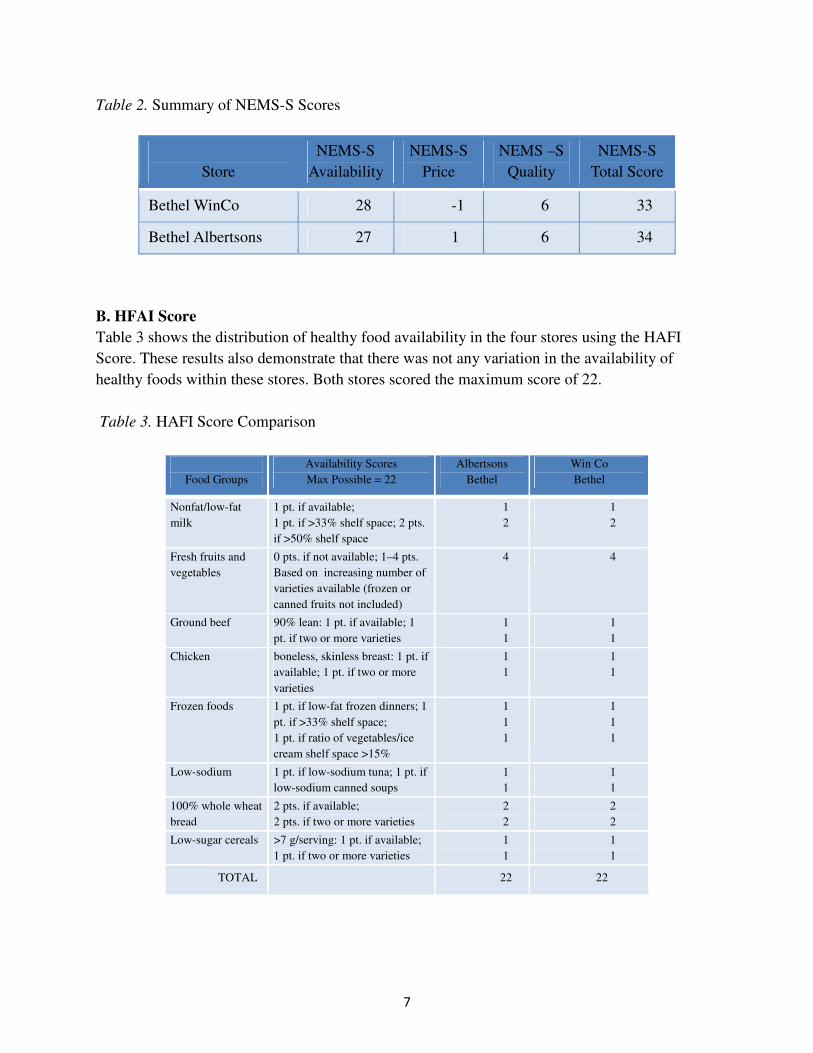
Table 2. Summary of NEMS-S Scores
B. HFAI Score
Table 3 shows the distribution of healthy food availability in the four stores using the HAFI
Score. These results also demonstrate that there was not any variation in the availability of
healthy foods within these stores. Both stores scored the maximum score of 22.
Table 3. HAFI Score Comparison
Food Groups
Availability Scores
Max Possible = 22
Albertsons
Bethel
Win Co
Bethel
Nonfat/low-fat
milk
1 pt. if available;
1 pt. if >33% shelf space; 2 pts.
if >50% shelf space
1
2
1
2
Fresh fruits and
vegetables
0 pts. if not available; 1–4 pts.
Based on increasing number of
varieties available (frozen or
canned fruits not included)
4 4
Ground beef 90% lean: 1 pt. if available; 1
pt. if two or more varieties
1
1
1
1
Chicken boneless, skinless breast: 1 pt. if
available; 1 pt. if two or more
varieties
1
1
1
1
Frozen foods 1 pt. if low-fat frozen dinners; 1
pt. if >33% shelf space;
1 pt. if ratio of vegetables/ice
cream shelf space >15%
1
1
1
1
1
1
Low-sodium 1 pt. if low-sodium tuna; 1 pt. if
low-sodium canned soups
1
1
1
1
100% whole wheat
bread
2 pts. if available;
2 pts. if two or more varieties
2
2
2
2
Low-sugar cereals >7 g/serving: 1 pt. if available;
1 pt. if two or more varieties
1
1
1
1
TOTAL 22 22
Store
NEMS-S
Availability
NEMS-S
Price
NEMS –S
Quality
NEMS-S
Total Score
Bethel WinCo 28 -1 6 33
Bethel Albertsons 27 1 6 34
8
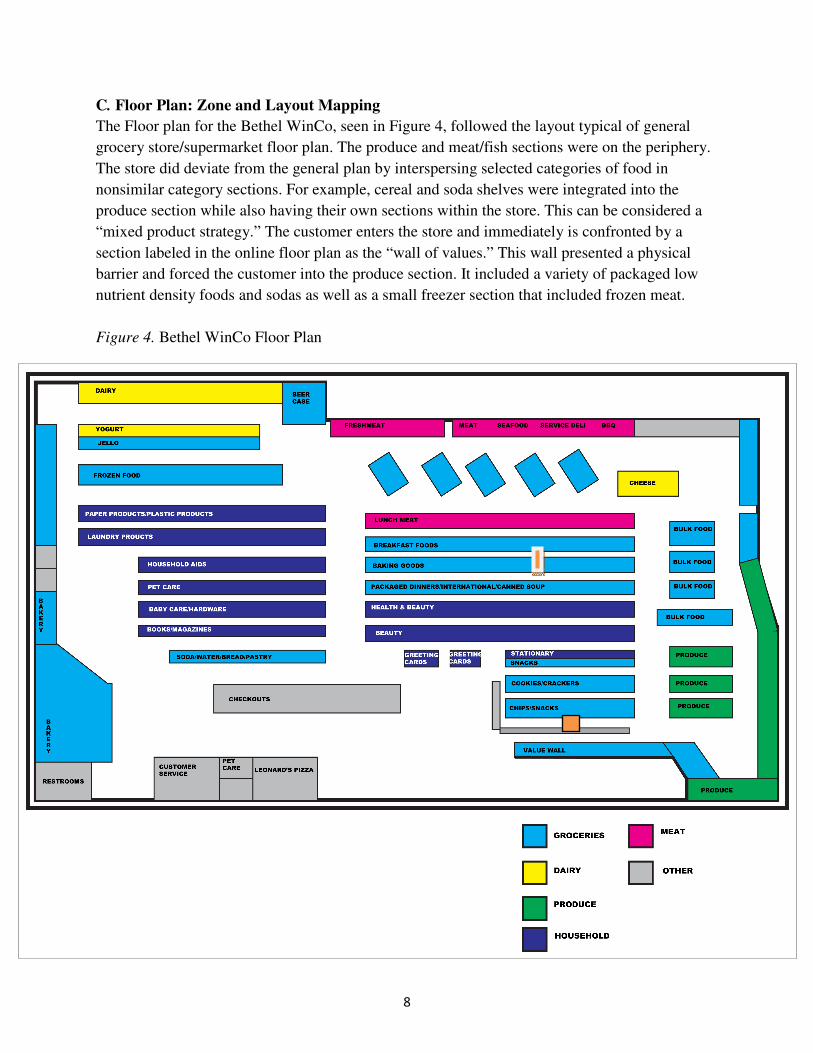
C. Floor Plan: Zone and Layout Mapping
The Floor plan for the Bethel WinCo, seen in Figure 4, followed the layout typical of general
grocery store/supermarket floor plan. The produce and meat/fish sections were on the periphery.
The store did deviate from the general plan by interspersing selected categories of food in
nonsimilar category sections. For example, cereal and soda shelves were integrated into the
produce section while also having their own sections within the store. This can be considered a
“mixed product strategy.” The customer enters the store and immediately is confronted by a
section labeled in the online floor plan as the “wall of values.” This wall presented a physical
barrier and forced the customer into the produce section. It included a variety of packaged low
nutrient density foods and sodas as well as a small freezer section that included frozen meat.
Figure 4. Bethel WinCo Floor Plan
9
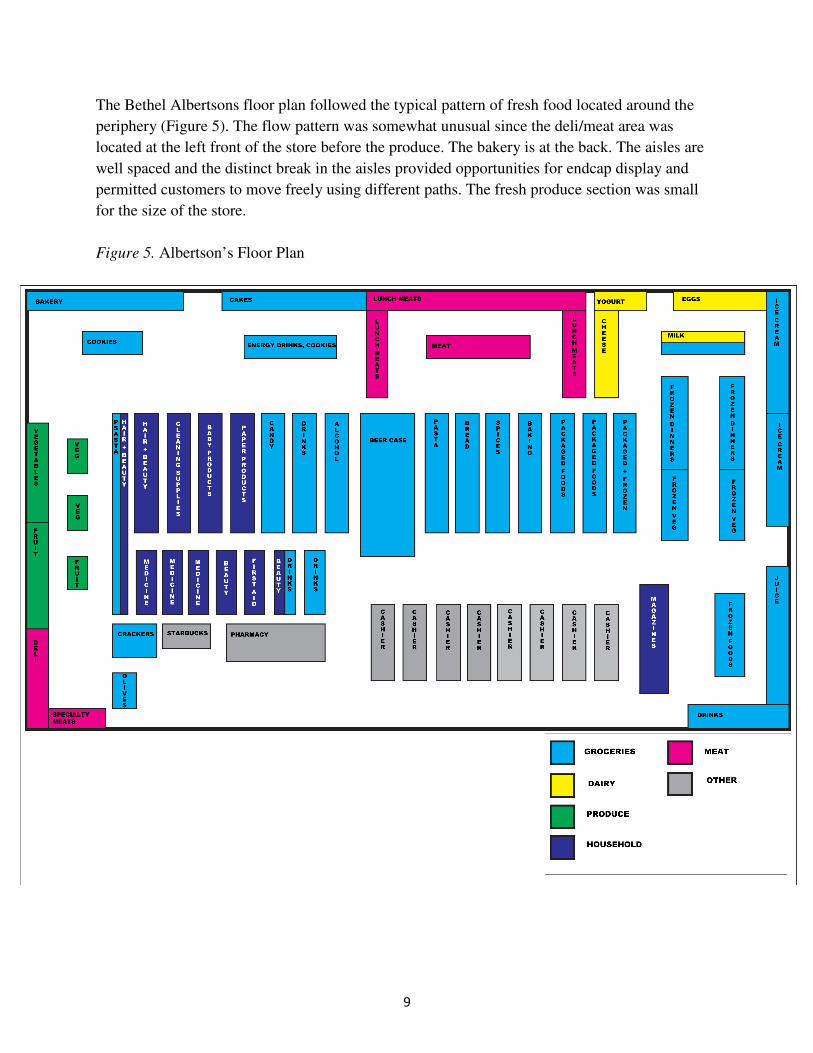
The Bethel Albertsons floor plan followed the typical pattern of fresh food located around the
periphery (Figure 5). The flow pattern was somewhat unusual since the deli/meat area was
located at the left front of the store before the produce. The bakery is at the back. The aisles are
well spaced and the distinct break in the aisles provided opportunities for endcap display and
permitted customers to move freely using different paths. The fresh produce section was small
for the size of the store.
Figure 5. Albertson’s Floor Plan
10
D. Promotion of Healthful Eating and Nutrition Information
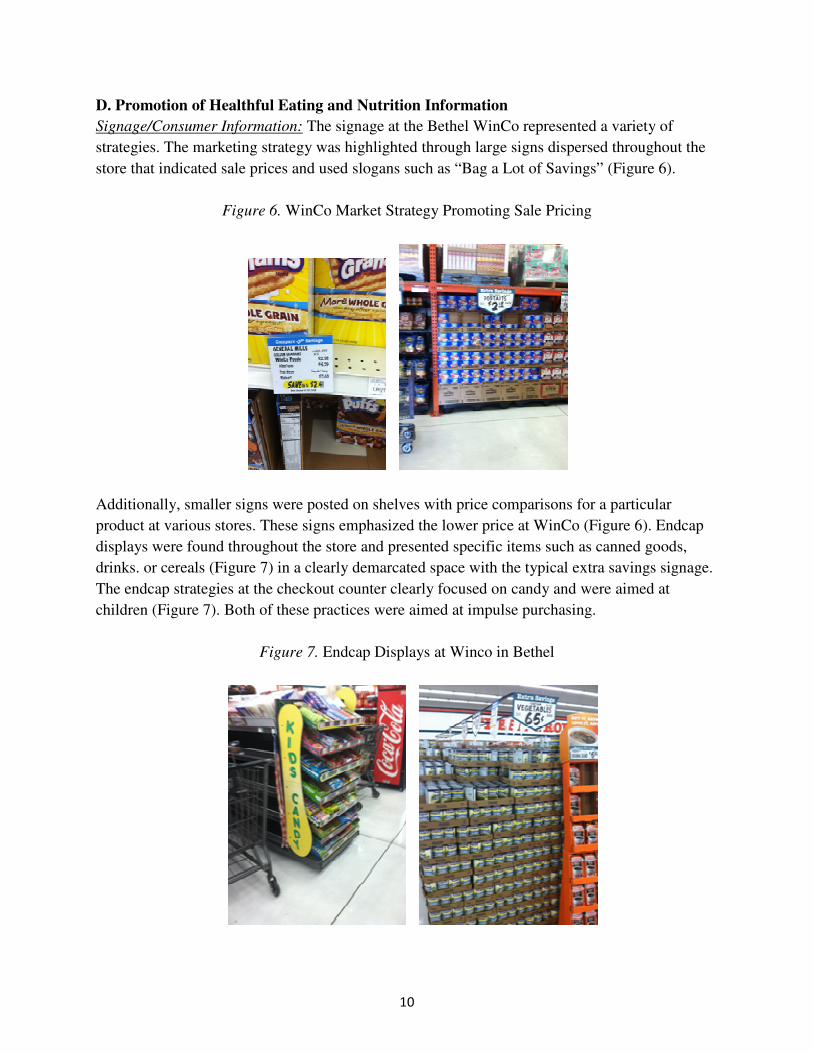
Signage/Consumer Information: The signage at the Bethel WinCo represented a variety of
strategies. The marketing strategy was highlighted through large signs dispersed throughout the
store that indicated sale prices and used slogans such as “Bag a Lot of Savings” (Figure 6).
Figure 6. WinCo Market Strategy Promoting Sale Pricing
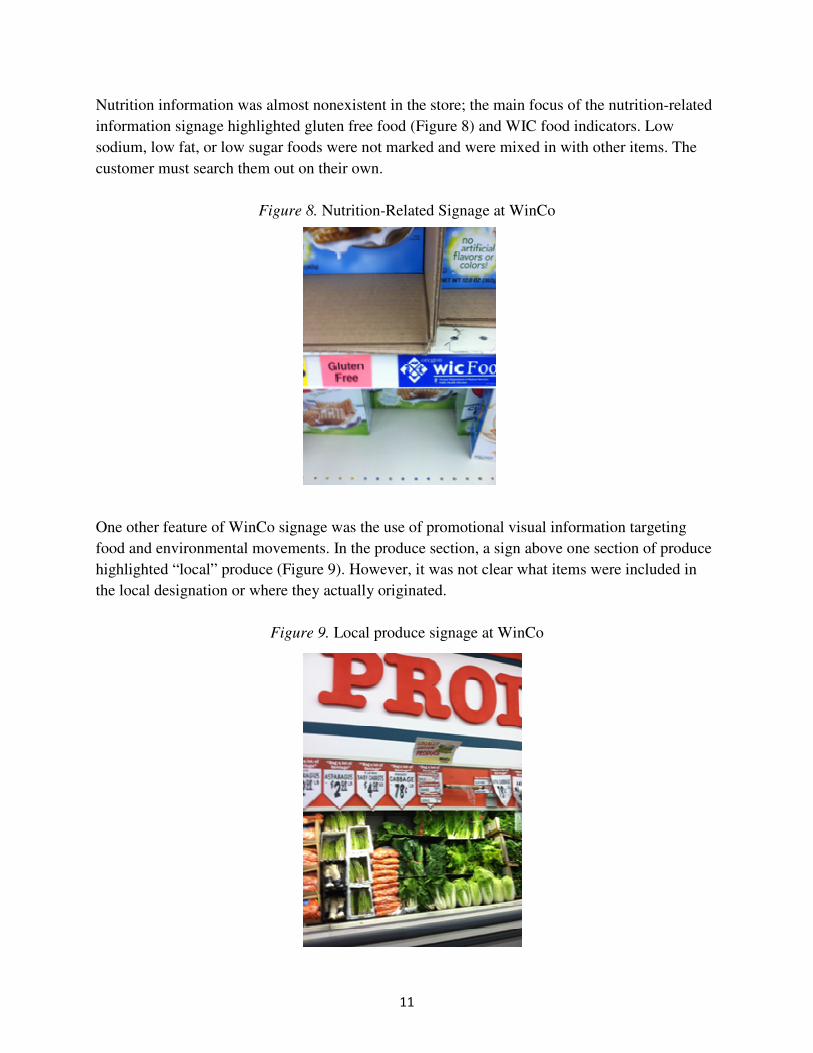
Additionally, smaller signs were posted on shelves with price comparisons for a particular
product at various stores. These signs emphasized the lower price at WinCo (Figure 6). Endcap
displays were found throughout the store and presented specific items such as canned goods,
drinks. or cereals (Figure 7) in a clearly demarcated space with the typical extra savings signage.
The endcap strategies at the checkout counter clearly focused on candy and were aimed at
children (Figure 7). Both of these practices were aimed at impulse purchasing.
Figure 7. Endcap Displays at Winco in Bethel
11
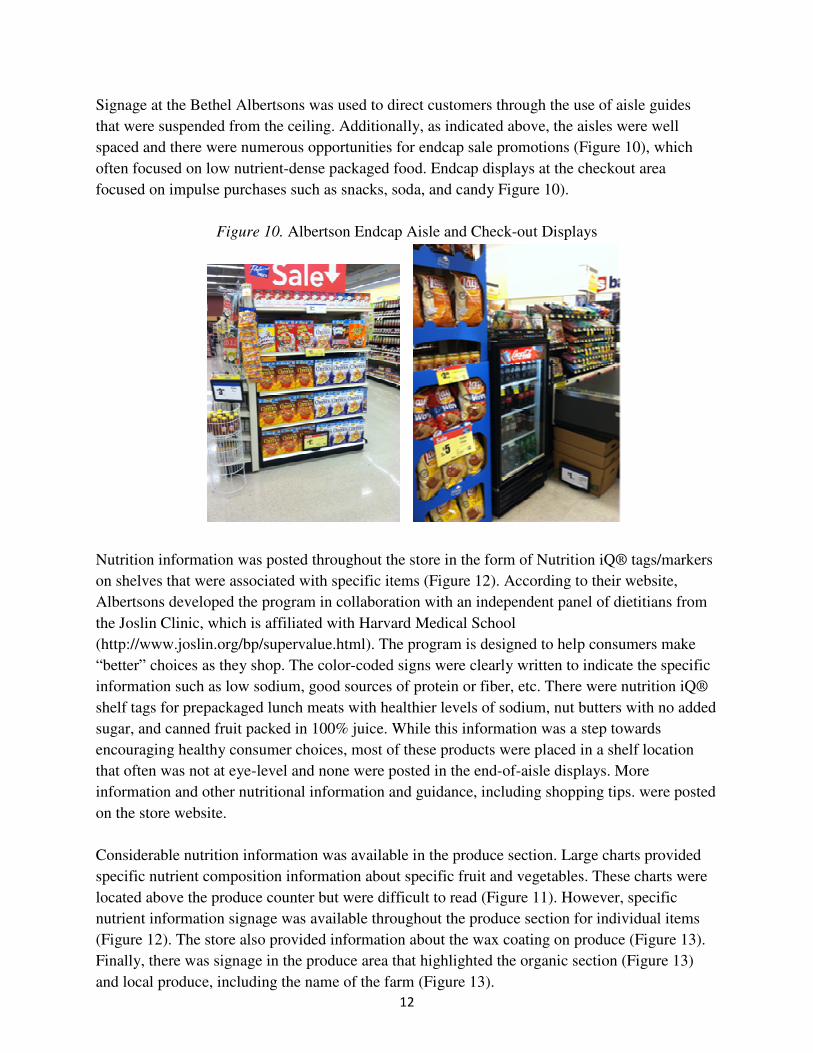
Nutrition information was almost nonexistent in the store; the main focus of the nutrition-related
information signage highlighted gluten free food (Figure 8) and WIC food indicators. Low
sodium, low fat, or low sugar foods were not marked and were mixed in with other items. The
customer must search them out on their own.
Figure 8. Nutrition-Related Signage at WinCo
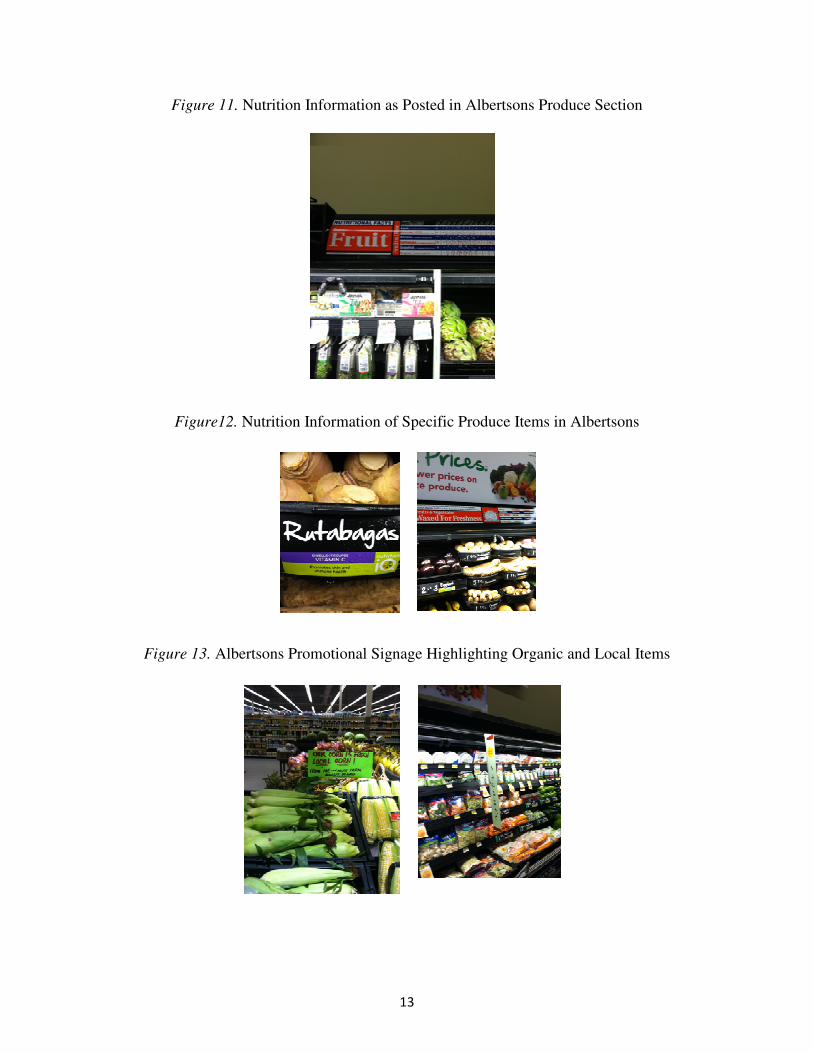
One other feature of WinCo signage was the use of promotional visual information targeting
food and environmental movements. In the produce section, a sign above one section of produce
highlighted “local” produce (Figure 9). However, it was not clear what items were included in
the local designation or where they actually originated.
Figure 9. Local produce signage at WinCo
12
Signage at the Bethel Albertsons was used to direct customers through the use of aisle guides
that were suspended from the ceiling. Additionally, as indicated above, the aisles were well
spaced and there were numerous opportunities for endcap sale promotions (Figure 10), which
often focused on low nutrient-dense packaged food. Endcap displays at the checkout area
focused on impulse purchases such as snacks, soda, and candy Figure 10).
Figure 10. Albertson Endcap Aisle and Check-out Displays
Nutrition information was posted throughout the store in the form of Nutrition iQ® tags/markers
on shelves that were associated with specific items (Figure 12). According to their website,
Albertsons developed the program in collaboration with an independent panel of dietitians from
the Joslin Clinic, which is affiliated with Harvard Medical School
(http://www.joslin.org/bp/supervalue.html). The program is designed to help consumers make
“better” choices as they shop. The color-coded signs were clearly written to indicate the specific
information such as low sodium, good sources of protein or fiber, etc. There were nutrition iQ®
shelf tags for prepackaged lunch meats with healthier levels of sodium, nut butters with no added
sugar, and canned fruit packed in 100% juice. While this information was a step towards
encouraging healthy consumer choices, most of these products were placed in a shelf location
that often was not at eye-level and none were posted in the end-of-aisle displays. More
information and other nutritional information and guidance, including shopping tips. were posted
on the store website.
Considerable nutrition information was available in the produce section. Large charts provided
specific nutrient composition information about specific fruit and vegetables. These charts were
located above the produce counter but were difficult to read (Figure 11). However, specific
nutrient information signage was available throughout the produce section for individual items
(Figure 12). The store also provided information about the wax coating on produce (Figure 13).
Finally, there was signage in the produce area that highlighted the organic section (Figure 13)
and local produce, including the name of the farm (Figure 13).
13
Figure 11. Nutrition Information as Posted in Albertsons Produce Section
Figure12. Nutrition Information of Specific Produce Items in Albertsons
Figure 13. Albertsons Promotional Signage Highlighting Organic and Local Items
14
Discussion
Recent research has begun to provide insight about the relationship between the food consumer
environment and both dietary preferences and diet-related health issues such as obesity, diabetes,
and hypertension (Glanz et al., 2005). The Grocery Store Assessment provided information that
contributes to a clearer picture of the food resources available to the Bethel community. The
results of the assessment indicate that the food consumer environment that is utilized by the
majority of the CAST survey respondents appeared adequate but not especially supportive of a
healthy diet. One store, Albertsons, exhibited progressive marketing by focusing on providing
healthy eating information.
While there was a good variety of healthy options as determined by the NEMS-S survey, the
actual NEMS-S scores for the stores were not outstanding. The survey was based on 10 food
categories that represent foods of a typical American diet, as well as those that are recommended
for a healthy eating pattern (Glanz et al 2007). Indeed, the scores, ranging from 33 to 34, are in
the lower range of scores reported by researchers in other areas of the country (Bertoni et al.
2011). Scores rating availability were very similar to those reported by Krukowski, West,
Harvey-Berino, & Prewitt, 2010, in their study of stores in Arkansas and Vermont. They reported
aggregate data so it is not possible to make specific comparison.
Scores assessing prices of food in Bethel were comparable to those of the White population in
the Bertoni et al. sample and slightly better than the score for their African American population
(Bertoni et al., 2011). Given the highest possible score was18, Bethel scores are quite low and
highlight the fact that the healthier options cost more money. Higher prices for healthful options
may present an obstacle for consumers who want to purchase healthier options but cannot afford
them. Reducing the price of lower fat foods as well as fruits and vegetables has been found to be
effective in increasing healthier food purchases (French, 2003).
Conclusion
Changing dietary practices is difficult since eating behavior is affected by so many factors.
However, such changes will be much more difficult in the absence of supportive environments.
Changing the food environment will require efforts of public health researchers in collaboration
with community groups and policymakers. Interventions or programs that address consumption
of healthful food and availability of affordable healthful food in food outlets are important means
to achieve these changes. Research from projects such as CAST provides important first steps for
achieving these changes. The NEMS-S survey provided information that allowed stores in Bethel
to be compared with each other and with other studies. However, the NEMS-S survey did not
permit a fine-grained comparison among the stores in the community, especially since the stores
were quite similar in size and structure. The qualitative assessment of each store revealed at least
one important difference between the two stores that was not captured in either NEMS-S or
HFAI. The use of signage and promotional information as a means of providing important
nutrition information distinguished one store from the other and is a beginning step that can
assist the consumer in making healthful choices.
15
References
Ahern, M., Brown, C., & Dukas, S. (2011). A national study of the association between food
environments and county-level health outcomes. Journal of Rural Health, 27, 367–379.
Albertsons Nutrition IQ® 2012. Available at http://www.joslin.org/bp/supervalue.html
Bertoni, A., Foy, C., Hunter, J., & Quandt, S. (2011). A multilevel assessment of barriers to
adoption of dietary approaches to stop hypertension (DASH) among African Americans
of low socioeconomic status. Journal of Health Care for the Poor and Underserved, 22,
1205–1220.
Booth, S. L., Sallis, J. F., C Ritenbaugh, J.O., Hill, L. L., Birch, L. D. Frank, K., … Hays, N. P.
(2001). Environmental and societal factors affect food choice and physical activity:
Rationale, influences, and leverage points. Nutrition Reviews, 59, S21–39.
Chaloupka, F. J., & Powell, L. M. (2009). Price, availability, and youth obesity: evidence from
Bridging the Gap. Preventing Chronic Disease 6(3), A93. Retrieved from journal
website: http://www.cdc.gov/pcd/issues/2009/jul/08_0261.htm
Cummins, S., & Macintyre, S. (2006). Food environments and obesity: neighborhood or nation?
International Journal of Epidemiology, 35(1), 100–104.
Franco, M., Diez Roux, A. V., Glass, T. A., Caballero, B., & Brancati, F. L. (2008).
Neighborhood characteristics and availability of healthy foods in Baltimore. American
Journal of Preventive Medicine, 35, 561–567.
French, S. (2003). Pricing effects on food choices. Journal of Nutrition, 133, S841–S843.
Giskes, K., Kamphuis, C., Kremers, S., Droomers, M., Brug, J., & van Lenthe, F. (2007). A
systematic review of associations between environmental factors, energy and fat intakes
among adults: is there evidence for environments that encourage obesogenic dietary
intakes. Public Health Nutrition, 10, 1005–1017.
Glanz, K., Sallis, J. F., Saelens, B. E., & Frank, L. D. (2005). Healthy nutrition environments:
Concepts and measures. American Journal of Health Promotion, 19, 330–333.
Glanz, K., Sallis, J. F., Saelens, B. E., & Frank, L. D. (2007). Nutrition Environment Measures
Survey in Stores (NEMS-S): Development and evaluation. American Journal of
Preventive Medicine, 32, 282–289.
Holsten, J. E. (2008). Obesity and the community food environment: a systematic review. Public
Health Nutrition, 12, 397–405.
Horowitz, C. R., Colson, K. A., Hebert, P. L., & Lancaster, K. (2004). Barriers to buying healthy
foods for people with diabetes: evidence of environmental disparities. American Journal
of Public Health, 94, 1549–1554.
Jetter, K. M., & Cassady, D. L. (2006). The availability and cost of healthier food alternatives.
American Journal of Preventive Medicine, 30, 38–44.
Kamphuis, C. B. M., Giskes, K., de Bruijn, G.-J., Wendel-Vos, W., Brug, J., & van Lenthe, F. J.
(2006). Environmental determinants of fruit and vegetable consumption among adults: a
systematic review. British Journal of Nutrition, 096(004), 620–635.
Krukowski, R., West, D. S., Harvey-Berino, J., & Prewitt, T. E. (2010). Neighborhood impact on
healthy food availability and pricing in food stores. Journal of Community Health, 35,
16
315–320.
Laraia, B. A., Siega-Riz, A. M., Kaufman, J. S., & Jones, S. J. (2004). Proximity of supermarkets
is positively associated with diet quality index for pregnancy. Preventive Medicine, 39,
869–875.
Larson, N. I., Story, M. T., & Nelson, M. C. (2009). Neighborhood environments: disparities in
access to healthy foods in the US. American Journal of Preventive Medicine, 36, 74–81.
Liu, G. C., Wilson, J. S., Qi, R., & Ying, J. (2007). Green neighborhoods, food retail and
childhood overweight: differences by population density. American Journal of Health
Promotion, 21, 317–325.
Morland, K. B., Diez Roux, A. V., & Wing, S. (2006). Supermarkets, other food stores, and
obesity: the atherosclerosis risk in communities study. American Journal of Preventive
Medicine, 30, 333–339.
Morland, K. B., & Evenson, K. R. (2009). Obesity prevalence and the local food environment.
Health & Place, 15, 491–495.
Morland, K. B., Wing, S., & Diez Roux, A. (2002). The contextual effect of the local food
environment on residents' diets: the atherosclerosis risk in communities study. American
Journal of Public Health, 92, 1761–1767.
Ohri-Vachaspati, P., Martinez, D., Yedidia, M., & Petlick, N. (2011). Improving data accuracy
of commercial food outlet databases. American Journal of Health Promotion, 26, 116–
122.
Rose, D., & Richards, R. (2004). Food store access and household fruit and vegetable use among
participants in the US Food Stamp Program. Public Health Nutrition, 7, 1081–1088.
Story, M., Kaphingst, K.M., Robinson-O'Brien, R., & Glanz, K. (2008). Creating healthy food
and eating environments: Policy and environmental approaches. Annual Review of Public
Health, 29, 253–272.
Wang, M. C., Kim, S., Gonzales, A. A., MacLeod, K. E., & Winkleby, M. A. (2007).
Socioeconomic and food-related physical characteristics of the neighborhood
environment are associated with body mass index. Journao of Epidemiology &
Community Health, 61, 491–498.
Zenk, S. N., Schulz, A. J., Kannan, S., Lachance, L. L., Mentz, G., & Ridella, W. (2009).
Neighborhood retail food environment and fruit and vegetable intake in a multiethnic
urban population. American Journal of Health Promotion, 23, 255–264.

17
Appendix A
Data from project surveys conducted with a random sample of participating CAST
families ( https://cast.ori.org/files/CASTFamilySurvey_FirstYearReport.pdf)
Demographics of Parent Respondents
(CAST Survey: n=659)
Gender Male Female
72 577
11.1% 88.9%
Age (range 20-74) 20-30 years 31-40 years 41-50 years >50 years
145 355 126 27
22.4% 54.4% 19.3% 4.4%
Marital Status Married Not married
476 182
72.3% 27.7%
Annual Household Income <$20,000 $20,000-$39,999 $40,000-$59,999 $60,000 or more
83 213 154 201
12.8% 32.6% 23.7% 30.9%
Education < High school High school/GED Some College College Graduate
49 132 235 240
7.5% 20.2% 35.7% 36.6%
Employment Not employed Employed part-time Employed full-time
262 146 251
39.8% 22.2% 38.1%
18
Where Respondents Do Major Shopping
(CAST Survey: n=659)
Store N %
Winco (in) 531 80.6%
Walmart (out) 278 42.2%
Albertsons (in) 214 32.5%
Costco (out) 184 27.9%
Fred Meyer (in) 111 16.8%
19
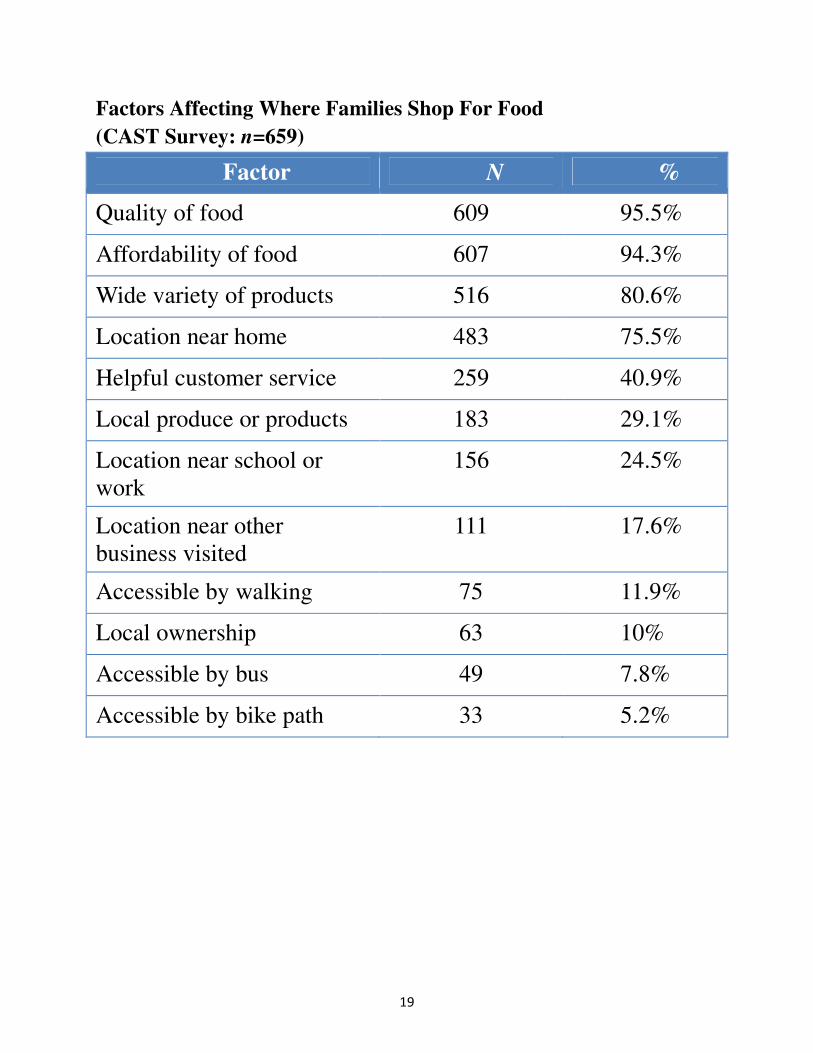
Factors Affecting Where Families Shop For Food
(CAST Survey: n=659)
Factor N %
Quality of food 609 95.5%
Affordability of food 607 94.3%
Wide variety of products 516 80.6%
Location near home 483 75.5%
Helpful customer service 259 40.9%
Local produce or products 183 29.1%
Location near school or
work 156 24.5%
Location near other
business visited 111 17.6%
Accessible by walking 75 11.9%
Local ownership 63 10%
Accessible by bus 49 7.8%
Accessible by bike path 33 5.2%
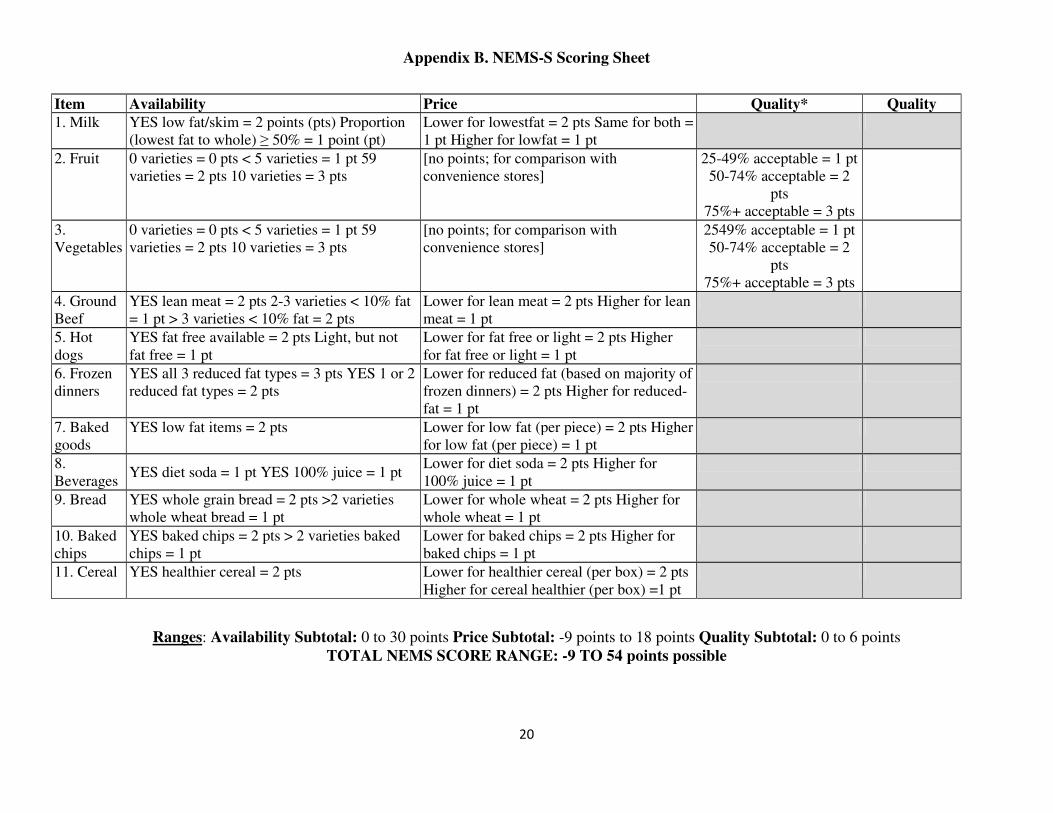
Appendix B. NEMS-S Scoring Sheet
20
Ranges: Availability Subtotal: 0 to 30 points Price Subtotal: -9 points to 18 points Quality Subtotal: 0 to 6 points
TOTAL NEMS SCORE RANGE: -9 TO 54 points possible
Item Availability Price Quality* Quality 1. Milk YES low fat/skim = 2 points (pts) Proportion
(lowest fat to whole) ≥ 50% = 1 point (pt)
Lower for lowestfat = 2 pts Same for both =
1 pt Higher for lowfat = 1 pt
2. Fruit 0 varieties = 0 pts < 5 varieties = 1 pt 59
varieties = 2 pts 10 varieties = 3 pts
[no points; for comparison with
convenience stores]
25-49% acceptable = 1 pt
50-74% acceptable = 2
pts
75%+ acceptable = 3 pts
3.
Vegetables
0 varieties = 0 pts < 5 varieties = 1 pt 59
varieties = 2 pts 10 varieties = 3 pts
[no points; for comparison with
convenience stores]
2549% acceptable = 1 pt
50-74% acceptable = 2
pts
75%+ acceptable = 3 pts
4. Ground
Beef
YES lean meat = 2 pts 2-3 varieties < 10% fat
= 1 pt > 3 varieties < 10% fat = 2 pts
Lower for lean meat = 2 pts Higher for lean
meat = 1 pt
5. Hot
dogs
YES fat free available = 2 pts Light, but not
fat free = 1 pt
Lower for fat free or light = 2 pts Higher
for fat free or light = 1 pt
6. Frozen
dinners
YES all 3 reduced fat types = 3 pts YES 1 or 2
reduced fat types = 2 pts
Lower for reduced fat (based on majority of
frozen dinners) = 2 pts Higher for reduced-
fat = 1 pt
7. Baked
goods
YES low fat items = 2 pts Lower for low fat (per piece) = 2 pts Higher
for low fat (per piece) = 1 pt
8.
Beverages YES diet soda = 1 pt YES 100% juice = 1 pt
Lower for diet soda = 2 pts Higher for
100% juice = 1 pt
9. Bread YES whole grain bread = 2 pts >2 varieties
whole wheat bread = 1 pt
Lower for whole wheat = 2 pts Higher for
whole wheat = 1 pt
10. Baked
chips
YES baked chips = 2 pts > 2 varieties baked
chips = 1 pt
Lower for baked chips = 2 pts Higher for
baked chips = 1 pt
11. Cereal YES healthier cereal = 2 pts Lower for healthier cereal (per box) = 2 pts
Higher for cereal healthier (per box) =1 pt
21
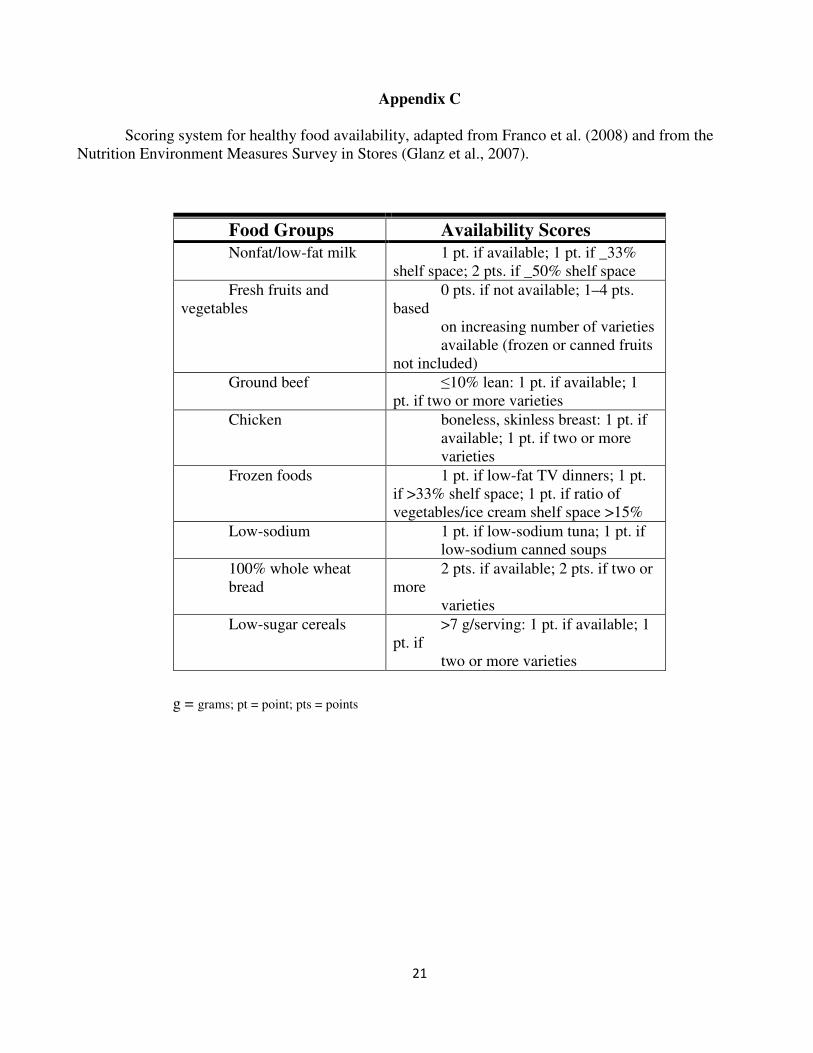
Appendix C Scoring system for healthy food availability, adapted from Franco et al. (2008) and from the
Nutrition Environment Measures Survey in Stores (Glanz et al., 2007).
g = grams; pt = point; pts = points
Food Groups Availability Scores Nonfat/low-fat milk 1 pt. if available; 1 pt. if _33%
shelf space; 2 pts. if _50% shelf space
Fresh fruits and
vegetables
0 pts. if not available; 1–4 pts.
based
on increasing number of varieties
available (frozen or canned fruits
not included)
Ground beef ≤10% lean: 1 pt. if available; 1
pt. if two or more varieties
Chicken boneless, skinless breast: 1 pt. if
available; 1 pt. if two or more
varieties
Frozen foods 1 pt. if low-fat TV dinners; 1 pt.
if >33% shelf space; 1 pt. if ratio of
vegetables/ice cream shelf space >15%
Low-sodium 1 pt. if low-sodium tuna; 1 pt. if
low-sodium canned soups
100% whole wheat
bread
2 pts. if available; 2 pts. if two or
more
varieties
Low-sugar cereals >7 g/serving: 1 pt. if available; 1
pt. if
two or more varieties


