
Beyond Carb
Counting:
Dietary Fat &
Protein in T1D
Dr Kirstie Bell
APD/CDE, PhD
University of Sydney

Carb Counting
• Carb Counting is gold standard method for adjustingmealtime insulin doses
• Carbohydrates don’t affect blood glucose levels equally (Glycemic Index)
• Evidence for the efficacy of carbohydrate counting is limited
• Treating symptoms vs. cause
• Lots of factors stimulate insulin production

Carbohydrate Counting Does Not
Significantly Improve HbA1c
Overall change in HbA1c: -0.35% points (p = 0.096)
Bell et al, Lancet Diab & Endo 2014; 2(2): 133-140

Dietary Fat, Protein & BGL
• Dietary fat & protein are insulin secretagogues
• In healthy individuals, minimal impact on BGL but significant insulin response
• In T1D, insufficient mealtime insulin = substantial postprandial hyperglycaemia
High BGL
Meal
Insulin
Normal BGL
Insulin Meal

Dietary Fat
• Seven studies (103 patients)
– All studies showed dietary fat influenced glycaemia
– Reduces early postprandial glucose rise (first 2-3h)
– Delays peak glucose level
– Leads to late postprandial
hyperglycaemia (≥ 3h)
– High fat meals (≥ 35g of fat)
requires insulin adjustment
Bell et al. Diabetes Care 2015; 38:1008-1015

Dietary Protein
Bell et al. Diabetes Care 2015; 38:1008-1015
• Seven studies (125 patients)
– All studies showed dietary protein influenced glycaemia
– Delayed effect on glycaemia (>100 mins)
– Different effect with and without carbohydrate
– Insulin adjustment needed for:
≥ 30g protein with carbs
≥ 75g protein alone
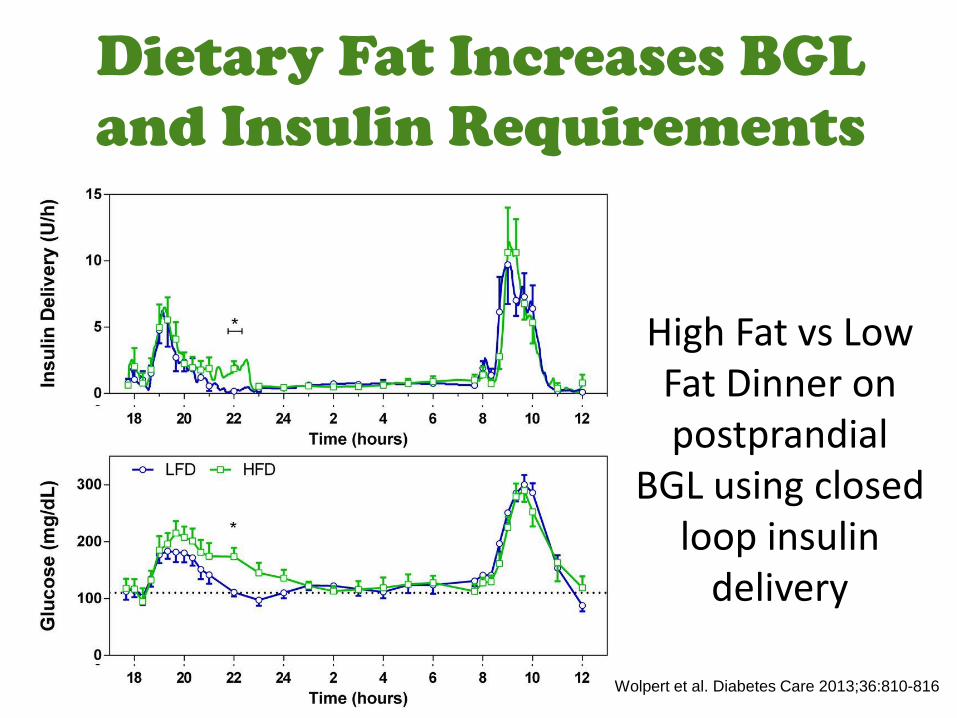
High Fat vs Low Fat Dinner on postprandial
BGL using closed loop insulin
delivery
Dietary Fat Increases BGL
and Insulin Requirements
Wolpert et al. Diabetes Care 2013;36:810-816

Fat and Protein Increase
Insulin Requirements
Smart et al. Diabetes Care 2013; 36: 3897-
3902
CHO (LF/LP)
Protein (LF/HP)
Fat (HF/LP)
Fat & Protein (HF/HP)

-2.0
-1.0
0.0
1.0
2.0
3.0
4.0
5.0
6.0
7.0
0 30 60 90 120 150 180 210 240 270 300 330 360
Ch
ange
in B
GL
(mm
ol/
L)
Time (Minutes)
Low Fat, Low Protein High Fat, High Protein
5.5 mmol/L
Bell (2016) Diabetes Care 39(9):1631-1634
Dietary Fat & Protein Raise BGL

Pure Protein Raises BGL
Paterson et al. Diabetic Medicine 2016;33(5)

How should Insulin
Doses be Adjusted for
Protein/Fat?

Warsaw Insulin Pump
Therapy (Pankowska)
Method

• Warsaw School of Insulin Pump Therapy have developed
a novel algorithm to calculate the total insulin dose
needed to cover carbohydrate plus protein & fat.
• Fat and Protein is counted together as a ‘Fat and Protein
Unit (FPU)’, where 1 FPU = 100kCal of fat and/or protein.
• How to dose insulin:
1. Normal wave bolus for carbohydrate using usual ICR
2. Dual or square wave bolus for FPU using same ICR
and run over 3-8hr depending on number of FPU
Fat/Protein Unit (FPU) Counting
Pankowska et al Pediatric Diabetes 2009; 10(5): 298-303.

Example: Cheese Pizza
• 2 Slices = 45g Carbs= 9g Fat (81Kcal)
= 20g Protein (80Kcal)
If ICR is 1u:1x 15g Carb Exchange Then need 3 units for Carbs
161 Kcal = 1 FPU = +1 unit of insulinDelivered as Dual Wave – 3u upfront (75%), 1u (25%) over 3h
Pankowska et al Pediatric Diabetes 2009; 10(5): 298-303.

Model Predicted Boluses

• Optimised insulin dose is determined through mathematical modelling
• Observe the effect of insulin dose & nutrients on glycaemia
• Predict insulin dose needed to optimise blood glucose level
• Trial the predicted insulin dose to see if accurate
Model Predicted Boluses
Bell (2016) Diabetes Care 39(9):1631-1634

To optimally define:
•What insulin DOSE is needed?
•What percentage should be
given immediately (Split)?
•How long to extend the
remaining portion (Duration)?
Objective
Bell (2016) Diabetes Care 39(9):1631-1634

• 10 adults with type 1 diabetes using insulin pump therapy & CGM
• Admitted to the Joslin Diabetes CRC on 3 to 7 occasions
• On the first 2 occasions, subjects were given a Low Fat and a High
Fat meal with the insulin dose calculated using
Carbohydrate: Insulin Ratio (CIR) with dual wave
50/50% over 2 hrs
• 6 hour postprandial venous BGL
monitoring
Methods
Bell (2016) Diabetes Care 39(9):1631-1634

Low Fat MealPizza & Tomato Paste
50g Carbohydrate9g Protein
4g Fat
Test Meals
High Fat MealPizza, Tomato Paste & Cheese50g Carbohydrate (equal)36g Protein (+27g)44g Fat (+40g)
Bell (2016) Diabetes Care 39(9):1631-1634

• Subsequent sessions, subjects were given the same high
fat/high protein meal with insulin dose, split and duration
calculated using Model Predicted Bolus (MPB)
• For safety, insulin dose was limited
to a 75% increase per session
• High fat/high protein meal repeated
with new MPB until BG response
optimised
Methods
Bell (2016) Diabetes Care 39(9):1631-1634

Adding 40g Fat & 27g Protein
Increases Postprandial Glycaemia
No Patients had Hypo
-2.0
-1.0
0.0
1.0
2.0
3.0
4.0
5.0
6.0
7.0
0 30 60 90 120 150 180 210 240 270 300 330 360
Blo
od
Glu
cose
Le
vel
(mm
ol/
L)
Time (Minutes)
LFLP HFHP
5.5 mmol/L
Bell (2016) Diabetes Care 39(9):1631-1634

75% More Insulin Required
Dual Wave: 30/70% over 2.5hr
-2.0
-1.0
0.0
1.0
2.0
3.0
4.0
5.0
6.0
7.0
0 30 60 90 120 150 180 210 240 270 300 330 360Blo
od
Glu
cose
Le
vel
(mm
ol/
L)
Time (Minutes)
LFLP HFHP HFHP - Optimised
No Patients had Hypo
Bell (2016) Diabetes Care 39(9):1631-1634

Food Insulin Index (FII)

Estimating Mealtime Insulin
Dose in Type 1 Diabetes
Current Thinking Novel Thinking
Carbohydrate Counting
Glycaemic Response
Bolus Insulin Dose
Insulin Response in Healthy Individuals
Insulin Demand
Bolus Insulin Dose

• Relative measure of the normal insulin demand of a food
• Insulin response measured in healthy adults
• Foods measured in 1000kJ portions
• Relative to a reference food
FII = 120min AUCInsulin for 1000kJ of test food x 100
120min AUCInsulin for 1000kJ of ref. food
Food Insulin Index (FII)
Bao et al. Am J Clin Nutr 2011; 93:984–96.
• Published FII represents the average of 10 subjects
• Developed a FII database of 147 foods

FII Varies Over A Wide Range
0
20
40
60
80
100
120
Jelly
bea
ns
Swee
t P
ota
to, s
team
ed
Ori
gin
al S
hre
dd
ed W
hea
t
Bak
ed
Bea
ns
Low
-fat
Str
awb
erry
Yo
ghu
rt
Wh
eati
es
97
% F
at-f
ree
Pre
tze
ls
Wh
ole
-mea
l Bre
ad
Luck
y C
har
ms
Low
-fat
Van
illa
Ice-
Cre
am
Van
illa
Ice
-Cre
am
Ch
eer
ios
Cau
liflo
we
r, s
team
ed
Skim
Milk
Wh
ite
Ric
e (c
oo
ked
)
Fre
nch
Fri
es
Ora
nge
Ju
ice
Fat-
fre
e O
atm
eal
Rai
sin
Co
oki
e
Do
nu
t w
ith
Cin
nam
on
Su
gar
Car
rot,
ste
ame
d
Low
-fat
Co
ttag
e C
hee
se
Ho
ney
smac
ks
Spe
cial
K
Ap
ple
Pie
Ch
oco
late
Milk
Jatz
Cra
cker
Ora
nge
Cin
nam
on
Sw
irl P
astr
y
Car
rot
Juic
e (F
resh
)
We
etb
ix
Ch
icke
n N
ugg
ets
Fro
zen
Co
rn
Snic
kers
Bar
Fro
zen
Pe
as
Mu
esl
i Bar
1%
Fat
Milk
Seed
less
Rai
sin
s
Po
rrid
ge
Full
Cre
am M
ilk
Can
ned
Nav
y B
ean
s
Tofu
Be
er (
4.9
%)
Ch
icke
n, p
anfr
ied
wit
h s
kin
Cre
am C
he
ese
Fran
kfu
rte
r/H
ot
Do
g
Pe
anu
t B
utt
er
Cre
am
Wal
nu
ts
Wh
ite
Win
e (
11
%)

0 20 40 60 80 100 120
GrapenutsSpecial K
White BreadLucky Charms
Honey Bunches of OatsCornflakes
SustainSpecial K
Grain BreadAll-Bran Original
Cous cousLentils with Tomato Sauce
Hokkien NoodlesHoneydew Melon
BananaApple JuicePeach, raw
Potato (peeled, boiled)Cauliflower, steamedTomato Pasta Sauce
Mixed BeansColeslaw
Low-fat Strawberry YoghurtPeach-Mango Frozen Yoghurt
Low-fat Cottage CheeseLow-fat Processed Cheese Slice
Cheddar CheeseCream Cheese
Mars Bar97% Fat-free Pretzels
Raspberry Jam40% Reduced-fat Potato Chips
Potato ChipsSnickers Bar
Blueberry Streusel MuffinChocolate Cake Brownie & Frosting
Donut with Cinnamon SugarReduced-fat Chocolate Chip Cookie
Cinnamon Swirl PastryChocolate Chip Cookie
Sushi (Chicken Roll)Chicken Nuggets
Butter Chicken SauceBattered Fish Fillet
Tuna in waterPrawns
HamFrankfurter/Hot Dog
BolognaBeef Sausage
Gin (40%)Olive Oil
Food Insulin Index (%)
Breads & Cereals
Fruit & Fruit Juice
Dairy Products
Rice, Pasta & Noodles
Vegetables & Legumes
Baked Goods
Mixed Meals
Meat & Protein
Alternatives
Alcohol
Fats & Oils
Snack foods &
Confectionary

Food Examples1000kJ (240kcal) Portions
Boiled Potato
Carbohydrate: 49g
FII: 88
Grain Bread
Carbohydrate: 40g
FII: 41
Mars Bar
Carbohydrate: 38g
FII: 89
Apple
Carbohydrate: 58g
FII: 43
Low Fat Yoghurt
Carbohydrate: 38g
FII: 84
White Bread
Carbohydrate: 44g
FII: 73

Beef Steak
Carbohydrate: 0g
FII: 37
Poached Eggs
Carbohydrate: 1g
FII: 23
Chicken
Carbohydrate: 0g
FII: 19
Bao et al. Am J Clin Nutr 2011; 93: 984–96
Food Examples1000kJ (240kcal) Portions

Can the Food Insulin Index be
used to Predict Mealtime
Insulin Requirements in
Type 1 Diabetes?

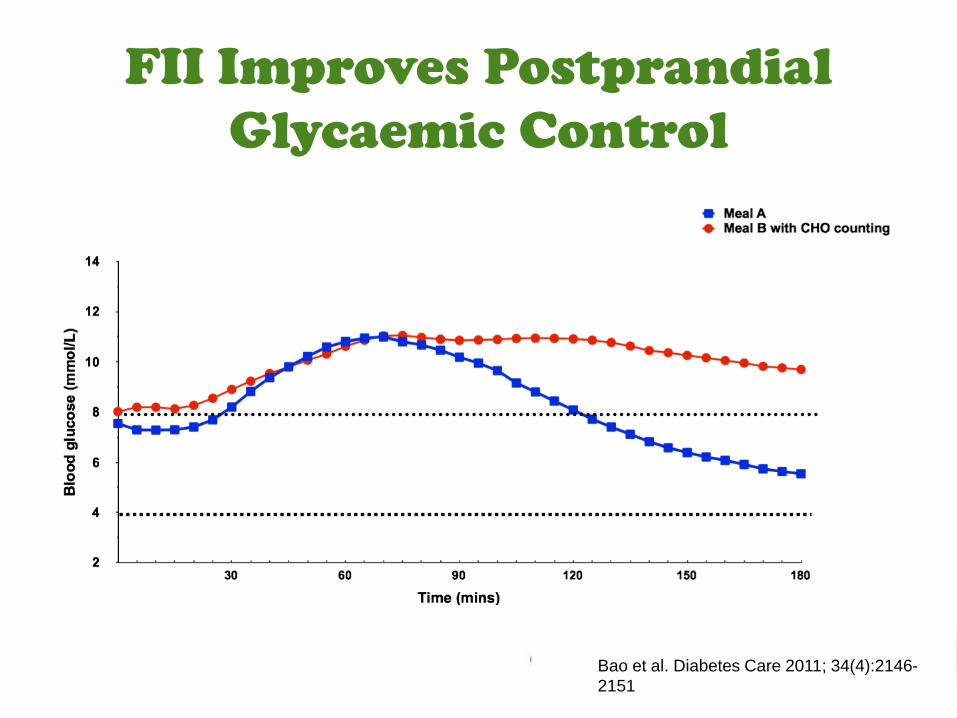
FII Improves Postprandial
Glycaemic Control
Bao et al. Diabetes Care 2011; 34(4):2146-
2151
FII Improves Postprandial
Glycaemic Control
Bao et al. Diabetes Care 2011; 34(4):2146-
2151

FII Improves Postprandial
Glycaemic Control
Bao et al. Diabetes Care 2011; 34(4):2146-
2151

FII improved acute postprandial glycaemia
compared to carbohydrate counting without
increasing the risk of hypo’s
Conclusion

How Would We Use The
FII in Practice?

Food Insulin Index (FII) is a measure of a food’s relative insulin demand compared with other foods
– I.e. The FII is a fixed value that doesn’t change as the food portion size changes.
FII vs FID
Food Insulin Demand (FID) combines a food’s FII with the kJ in the portion size
• I.e. The FID changes as the food portion size changes and can therefore be used to determine the mealtime insulin dose.
Apple
FII: 43
White Bread, 1 Slice
FII: 73
FID: 26

FID = Energy (kJ) x Food Insulin Index (FII)1,000
e.g. 200g low-fat strawberry yoghurt (FII = 84)
FID = 770kJ x 841,000
FID = 65
Food Insulin Demand

• Jane eats 200g of her low-fat
strawberry yoghurt
• Insulin Demand (FID) = 65
• Jane’s ‘Insulin: FID’ ratio is 1:16
• Therefore, Jane needs 4 units
of insulin to cover her yoghurt
Using FID in Practice

Pictorial Resources
FOOD INSULIN DEMA ND
(FID) COUNTING
FO O D REFEREN CE G UIDE FO R PEO PLE
W ITH TYPE 1 D IA BETES

Pocket-Sized Guides
The$FOODII$Study$
$FID$Counter:$
$Pocket6Sized$
Guide$
$$$
The$FOODII$Study$
$FID$Counter:$
$Pocket6Sized$
Guide$
!
Cereals !
Food Serve Size FID
All-Bran Original 1 Cup (60g) 19
All-Bran Wheat Flakes 1 Cup (40g) 29
Cheerios 1 Cup (30g) 29
Cornflakes 1 Cup (30g) 26
Honey Weets 1 Cup (30g) 23
Porridge (Oats cooked with water)
1 Cup (30g Raw Oats)
15
Rice Bubbles 1 Cup (30g) 27
Special K 1 Cup (40g) 30
Sultana Bran 1 Cup (60g) 56
Sustain 1 Cup (60g) 50
!
5!
!!!!!!!
Confectionary!
Food Serve Size FID
Mars Bar 1 Regular Bar
(53g) 87
Snickers Bar 1 Regular Bar
(60g) 44
Milk Chocolate 6 Squares (30g) 23
Jellybeans 10 Small
Jellybeans 33
Sherbet 1 Sachet (12.5g) 4
!
14!
!!
Dairy Products !
Food Serve Size FID
Skim Milk 250mL 23
Full Cream Milk 250mL 17
Low Fat Fruit Yoghurt 175g Tub 57
Vanilla Ice-Cream 1 Scoop (50g) 27
Low Fat Vanilla Ice-Cream
1 Scoop (50g) 19
Fruit Frozen Yoghurt 1 Scoop (50g) 18
Chedar Cheese 1 Slice (25g) 14
Low Fat Cheddar Cheese
1 Slice (21g) 4
Low Fat Processed Cheese
1 Slice (20.5g) 6
Cream Cheese 1 Tablespoon
(20g) 5
Reduced Fat Cottage Cheese
½ Cup (120g) 21
Low Fat Cottage Cheese
½ Cup (120g) 24
!
9!
!!!!!!!
Meat, Chicken & Seafood !
Food Serve Size FID
Beef Steak 130g Cooked 30
Panfried Chicken 130g Cooked 26
Roast Chicken 130g Cooked 20
Short-Cut Bacon 2 Rashers 6
Frankfurter (Hot Dog) 1 Thin 12
White Fish Fillet 130g Cooked 17
Battered Fish Fillet 1 Fillet (70g) 34
Prawns 7 Shelled (50g) 4
Tuna in Olive Oil 95g Tin, Drained
9
Tuna in Springwater 95g Tin, Drained
9
!
12!
!
Cereals !
Food Serve Size Carb (g)
All-Bran Original 1 Cup (60g) 35
All-Bran Wheat Flakes 1 Cup (40g) 25
Cheerios 1 Cup (30g) 20
Cornflakes 1 Cup (30g) 25
Honey Weets 1 Cup (30g) 23
Porridge (Oats cooked with water)
1 Cup (30g Raw Oats)
19
Rice Bubbles 1 Cup (30g) 26
Special K 1 Cup (40g) 26
Sultana Bran 1 Cup (60g) 40
Sustain 1 Cup (60g) 41
!
5!
!!!!!!!
Confectionary !
Food Serve Size Carb (g)
Mars Bar 1 Regular Bar
(53g) 37
Snickers Bar 1 Regular Bar
(60g) 35
Milk Chocolate 6 Squares (30g) 17
Jellybeans 10 Small
Jellybeans 16
Sherbet 1 Sachet (12.5g) 3
!
14!
!!
Dairy Products !
Food Serve Size Carbs (g)
Skim Milk 250mL 13
Full Cream Milk 250mL 13
Low Fat Fruit Yoghurt 175g Tub 26
Vanilla Ice-Cream 1 Scoop (50g) 11
Low Fat Vanilla Ice-Cream
1 Scoop (50g) 12
Fruit Frozen Yoghurt 1 Scoop (50g) 11
Chedar Cheese 1 Slice (25g) 0
Low Fat Cheddar Cheese
1 Slice (21g) 0
Low Fat Processed Cheese
1 Slice (20.5g) 2
Cream Cheese 1 Tablespoon
(20g) 1
Reduced Fat Cottage Cheese
½ Cup (120g) 4
Low Fat Cottage Cheese
½ Cup (120g) 7
!
9!
!!!!!!!
Meat, Chicken & Seafood !
Food Serve Size Carbs (g)
Beef Steak 130g Cooked 0
Panfried Chicken 130g Cooked 0
Roast Chicken 130g Cooked 0
Short-Cut Bacon 2 Rashers 1
Frankfurter (Hot Dog) 1 Thin 2
White Fish Fillet 130g Cooked 0
Battered Fish Fillet 1 Fillet (70g) 9
Prawns 7 Shelled (50g) 1
Tuna in Olive Oil 95g Tin, Drained
0
Tuna in Springwater 95g Tin, Drained
0
!
12!
The$FOODII$Study$
$Carb$Counter:$
$Pocket8Sized$
Guide$
$$$
The$FOODII$Study$
$Carb$Counter:$
$Pocket8Sized$
Guide$

iPhone Apps Calculate
FID & Carb Contents
5
7

SubjectObserved Insulin
RequirementCHO Counting FII Warsaw/Pankowska
1 7.9 4.5 7.8 5.8
2 5.5 3.8 6.6 4.9
3 11.9 5.3 9.1 6.8
4 8.8 5.0 8.5 6.4
5 4.2 3.6 6.1 4.6
6 5.2 4.2 7.1 5.3
7 5.8 3.3 5.7 4.3
8 5.7 3.3 5.7 4.3
9 7.4 4.2 7.1 5.3
10 17.5 10.0 17.1 12.8
Mean Difference (units of insulin)
-3.3 0.1 -1.9
Comparing Accuracy of
Methods

ADA Guidelines
“Selected individuals who have mastered carbohydrate counting should be educated
on fat and protein gram estimation”
ADA Standards of Medical Care, 2017

Dose
Adjustment
Guidelines
• Healthy eating
• Optimise conventional
insulin therapy
• Identify target meals
• Start small, monitor
closely, review
frequently
Bell et al. Diabetes Care 2015; 38:1008-1015

Key Clinical Questions
1. What is the threshold for fat & protein?
2. What is the dose-response relationship between fat/protein and BGL?
3. What affect does the type of fat or protein have?
4. How do insulin doses need to be adjusted for fat and/or protein?

iBolus:
Study Update
• Recruitment Complete
• End of Trial: May 2018


