

BI360 for Salesforce.com
Enabling World-class Reporting for Salesforce Customers
A Solver White Paper
Document Version 4.0

Copyright Solver, Inc., 2017 BI360 White Paper | Page 1
Table of Contents
Introduction ......................................................................................... 2
Advantages of BI360 Reporting for Salesforce .......................................... 2
Salesforce Integration to BI360 .............................................................. 3
Salesforce API and Connection Information .............................................. 4
Frequently Asked Questions about the Integration .................................... 5
Options for Reporting, Budgeting and Dashboards .................................... 6
BI360 for Salesforce - Report Examples .................................................. 7
Copyright Solver, Inc., 2017 BI360 White Paper | Page 2
Introduction The purpose of this document is to describe the integration between
Salesforce.com and BI360, as well as to provide examples BI360 report
templates that show some of the output capabilities.
Note 1: There was also an older BI360 (for BI360 4.x on-premise)
integration tool with a Salesforce connector. This document describes the
new BI360 integration tool that is a native part of the BI360 Web portal
and available for BI360 cloud and BI360 5.0 (and later) on premise.
Note 2: Although this document is focused on the Salesforce integration
and related BI360 sales report examples, please note that this is just one
capability of BI360. Please see www.solverglobal.com for more
information.
Advantages of BI360 Reporting for Salesforce BI360 is a modern, self-service CPM Suite for Cloud and on-premise use
that can extended beyond just the reporting covered in the white paper, to
include forecasting/budgeting, consolidations, dashboards, and full data
warehousing. With the BI360 report writer module, you will get the most
extensive, modern Excel- and web-based report writer available for
Salesforce customers. This gives you several benefits:
Excel-based report writer provides features and formulas not
available in the native Salesforce reporting tool or in the many 3rd
party dashboard solutions.
If you have ever exported Salesforce data to Excel, imagine that you
with BI360 now get all the power and familiar environment of Excel,
but with completely automated, fully formatted reports.
Run reports on demand from Excel, web or auto-distribute reports by
e-mail.
Automatically scheduled or on demand refresh of data from
Salesforce to BI360’s data warehouse.
Install BI360, use the easy integration wizard, download pre-built
report templates and in less than 15 minutes start seeing your
Salesforce data in ways you have never been able to before.
Integration is out-of-the-box, plus you can add custom Salesforce
fields should that be needed.

Copyright Solver, Inc., 2017 BI360 White Paper | Page 3
Pre-joined tables (e.g. Owner, Contact, Account, etc.)
Pre-defined period logic (Salesforce date fields linked to
weeks/months/etc. for easy reporting on e.g. trends, month-to-date,
year-to-date, etc.)
Get increased visibility and control of your Salesforce data and at the
same time watch the sales team quickly become motivated to
capture updated data in Salesforce due to vastly improved reporting
output.
Salesforce Integration to BI360 Like many other cloud-based systems, Salesforce offers web services
connectors that outside systems can integrate with. Using the BI360
Integration tool (see images below), you can typically download Salesforce
data and automatically configure the BI360 web portal in less than an hour
and with no technical skills required.
You will find the Salesforce connector in the Marketplace, accessed from
within the Integrations menu in the BI360 Web Portal:
Copyright Solver, Inc., 2017 BI360 White Paper | Page 4
Salesforce API and Connection Information BI360 includes a robust connector to Salesforce data based on best
practices recommendations from Salesforce. The BI360 data connector use
Salesforce’s REST API to connect to all of the objects configured by
Salesforce. This allows for an organization with an active Salesforce
account, to enable the REST API and quickly import their Salesforce data
into the the BI360 Cloud or, for on-premise, BI360 version 5 and later.
BI360’s Salesforce connector utilizes the following technologies provided by
Salesforce.
1. TLS 1.2
2. OAuth 2.0
Copyright Solver, Inc., 2017 BI360 White Paper | Page 5
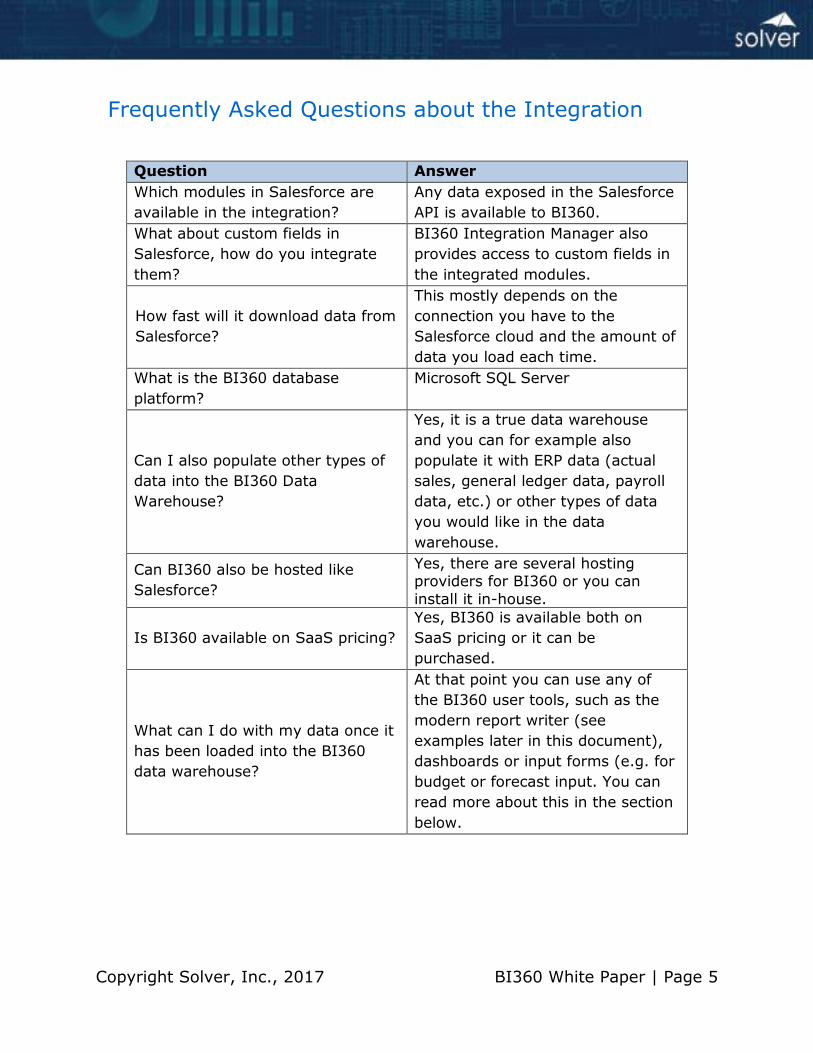
Frequently Asked Questions about the Integration
Question Answer
Which modules in Salesforce are
available in the integration?
Any data exposed in the Salesforce
API is available to BI360.
What about custom fields in
Salesforce, how do you integrate
them?
BI360 Integration Manager also
provides access to custom fields in
the integrated modules.
How fast will it download data from
Salesforce?
This mostly depends on the
connection you have to the
Salesforce cloud and the amount of
data you load each time.
What is the BI360 database
platform?
Microsoft SQL Server
Can I also populate other types of
data into the BI360 Data
Warehouse?
Yes, it is a true data warehouse
and you can for example also
populate it with ERP data (actual
sales, general ledger data, payroll
data, etc.) or other types of data
you would like in the data
warehouse.
Can BI360 also be hosted like
Salesforce?
Yes, there are several hosting providers for BI360 or you can
install it in-house.
Is BI360 available on SaaS pricing?
Yes, BI360 is available both on
SaaS pricing or it can be
purchased.
What can I do with my data once it
has been loaded into the BI360
data warehouse?
At that point you can use any of
the BI360 user tools, such as the
modern report writer (see
examples later in this document),
dashboards or input forms (e.g. for
budget or forecast input. You can
read more about this in the section
below.

Copyright Solver, Inc., 2017 BI360 White Paper | Page 6
Options for Reporting, Budgeting and Dashboards Once the BI360 data warehouse has been populated with Salesforce (and
any other data source) data, any of the BI360 front-end modules can be used:
1) Reporting
a. Formatted reports (see examples later in this document) b. Ad-hoc reports
c. Report scheduling and distribution d. Web-based reporting
2) Budgeting a. Budget input (e.g. a revenue budget)
b. Forecast input (e.g. a sales forecasts)
c. Any other manual data entry form 3) Dashboard
a. Sales dashboards b. Financial dashboards
c. Other dashboards
Please see www.solverglobal.com for more detailed BI360 product
information.

Copyright Solver, Inc., 2017 BI360 White Paper | Page 7
BI360 for Salesforce - Report Examples The following reports in this document are examples as well as out-of-the-
box BI360 Excel- and web-based report templates you can download and use with the BI360 Web Portal as soon as you have populated it with your
Salesforce data. Of course, you can also use the BI360 Excel-based Reporting module to design your own reports any way you would like them.
Keep in mind that once reports have been designed (or you use the pre-
defined reports) you have many deployment options:
Build and run reports with BI360’s Excel-based reporting tool. Run reports with BI360’s web portal.
Use the BI360 Report Publisher for automatic scheduling and distribution to your team. Recipients (e.g. your sales team) of reports
do NOT need a BI360 license.

Copyright Solver, Inc., 2017 BI360 White Paper | Page 8
Comment: Top Opportunities above 20% probability and ranked by
Weighted Revenue. The report also includes traffic lights, in cell charts and user-driven column sorting.
Comment: Sales person focused report showing key metrics per sales person, such as: Estimated Revenue, Weighted Revenue, # of Opportunities
and Average Estimated Revenue per Opportunity.
Copyright Solver, Inc., 2017 BI360 White Paper | Page 9
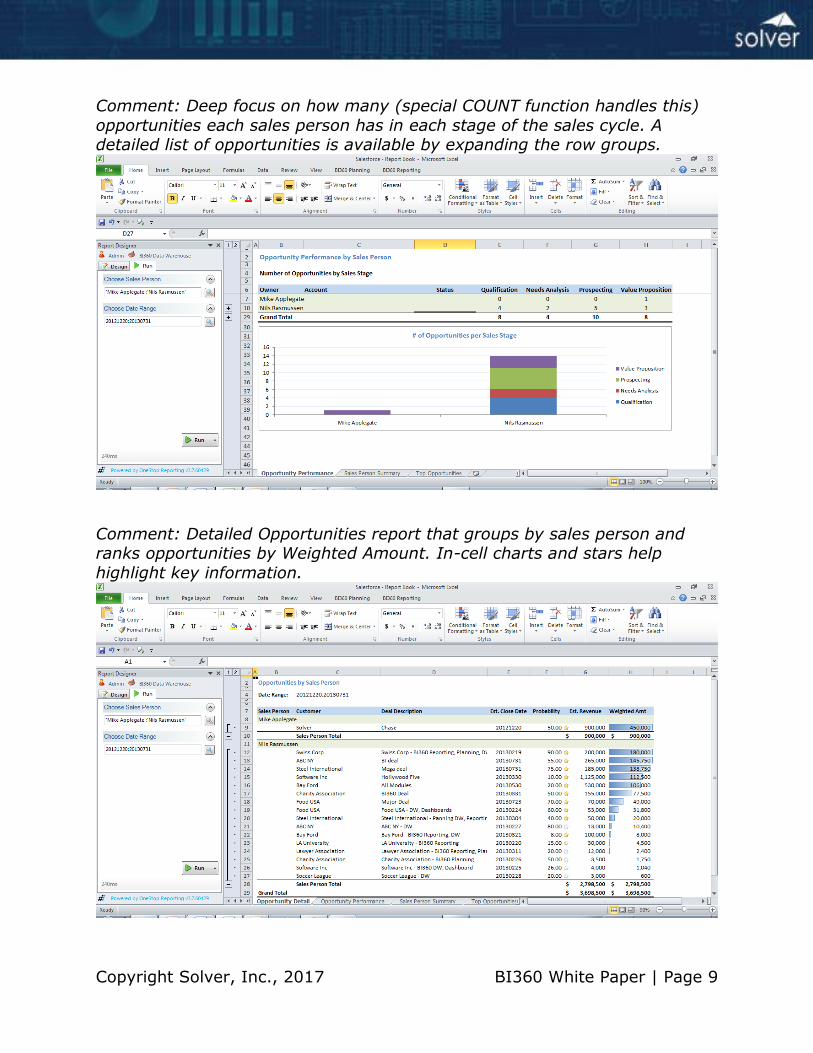
Comment: Deep focus on how many (special COUNT function handles this)
opportunities each sales person has in each stage of the sales cycle. A detailed list of opportunities is available by expanding the row groups.
Comment: Detailed Opportunities report that groups by sales person and ranks opportunities by Weighted Amount. In-cell charts and stars help
highlight key information.
Copyright Solver, Inc., 2017 BI360 White Paper | Page 10
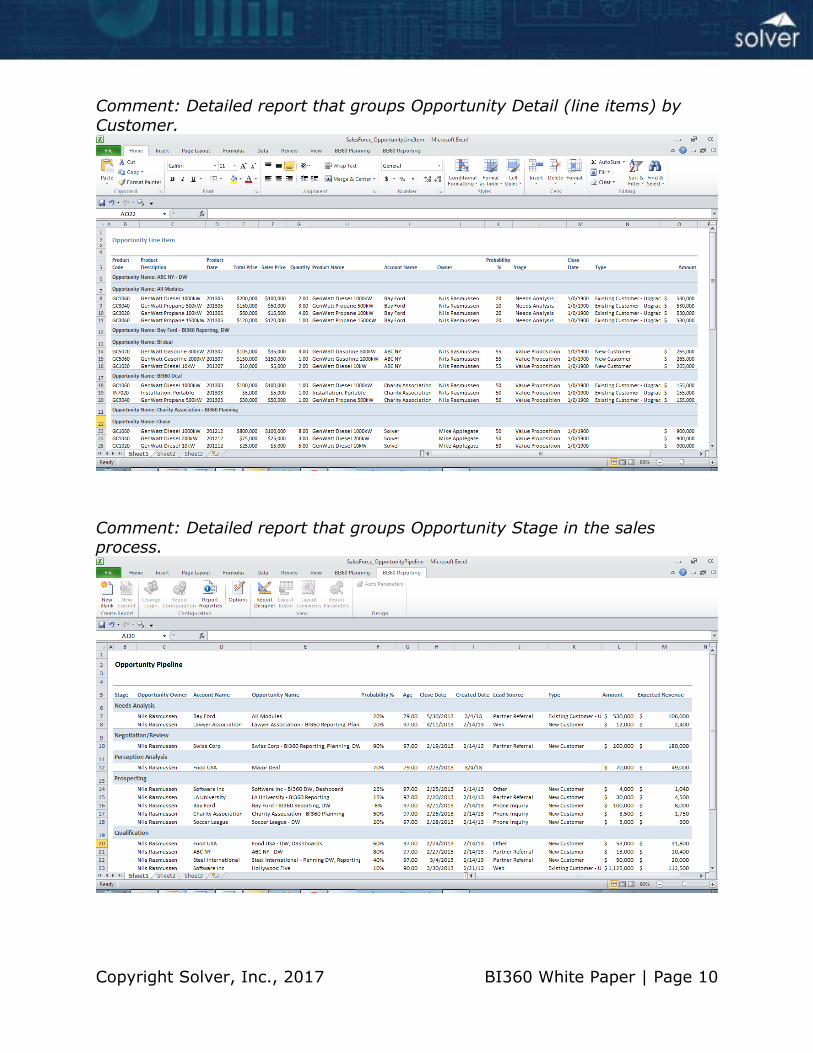
Comment: Detailed report that groups Opportunity Detail (line items) by
Customer.
Comment: Detailed report that groups Opportunity Stage in the sales process.


