The Magazine for ENERGY EFFICIENCY in Compressed Air, Pneumatics, Blower and Vacuum Systems
Biogas Purification
Apri
l 201
5
32 A VI
EW FR
OM AUST
RALIA
ON COMPR
ESSO
R EFFIC
IENCY
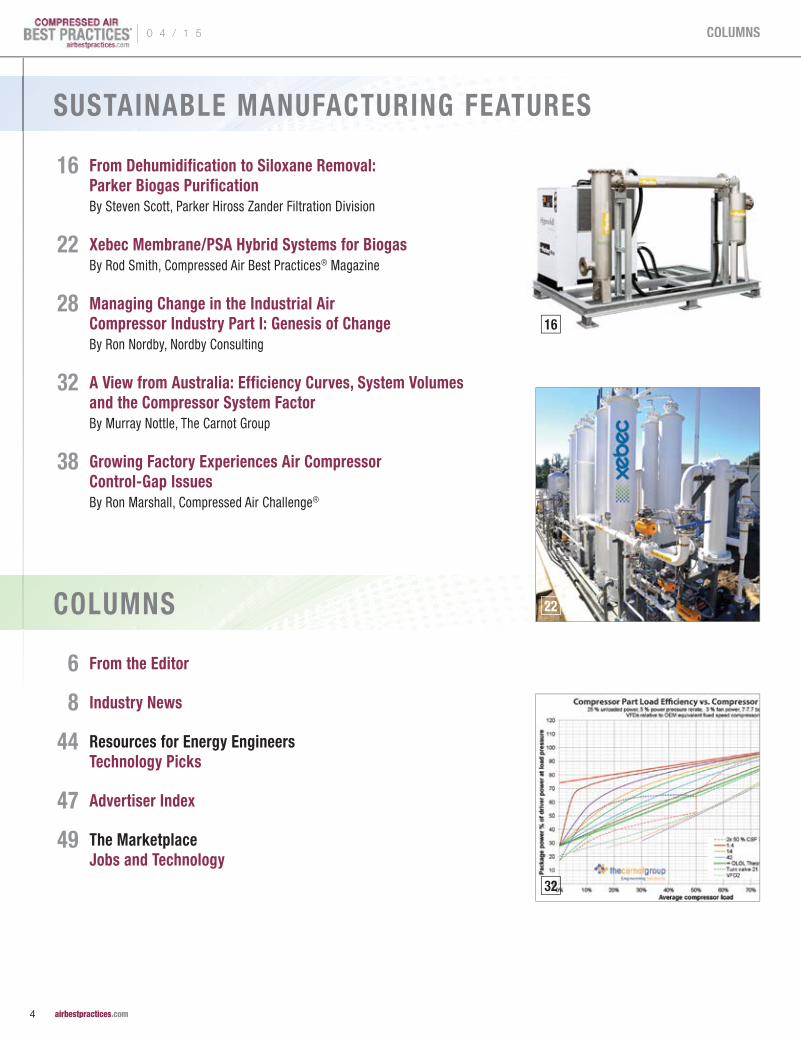
16 From Dehumidification to Siloxane Removal: Parker Biogas Purification
22 Xebec Membrane/PSA Hybrid Systems for Biogas
28 Managing Change in the Industrial Air Compressor Industry

Built BetterCONTACT US - 1-877-687-1982 - DVCOMPRESSORS.COM
BECOME A DV SYSTEMS DISTRIBUTORPERFORMANCE-DRIVEN, ENERGY-EFFICIENTINDUSTRIAL AIR COMPRESSORS
Quality ProductsDesigned for demanding industrialenvironments and built to last fordecades, we’re known for our rugged& reliable industrial air compressors.
Lasting RelationshipsWe not only build products to last, but are committed to building lasting relationships.
Innovation & ExpertiseWith over 125 years of manufacturingexcellence, we continue our commitmentand dedication to continuous innovationand precision engineering.
adDV_CABP 11_14_CABP 14-11-05 12:14 PM Page 1
COLUMNS
6 From the Editor
8 Industry News
44 Resources for Energy Engineers Technology Picks
47 Advertiser Index
49 The Marketplace Jobs and Technology
16 From Dehumidification to Siloxane Removal: Parker Biogas Purification By Steven Scott, Parker Hiross Zander Filtration Division
22 Xebec Membrane/PSA Hybrid Systems for Biogas By Rod Smith, Compressed Air Best Practices® Magazine
28 Managing Change in the Industrial Air Compressor Industry Part I: Genesis of Change By Ron Nordby, Nordby Consulting
32 A View from Australia: Efficiency Curves, System Volumes and the Compressor System Factor By Murray Nottle, The Carnot Group
38 Growing Factory Experiences Air Compressor Control-Gap Issues By Ron Marshall, Compressed Air Challenge®
SUSTAINABLE MANUFACTURING FEATURES
22
32
16
| 0 4 / 1 5
4 airbestpractices.com
COLUMNS
Thanks to our friends at Xebec and Parker, this issue inched my knowledge
forward a bit on biogas purification by clarifying the process differences
between raw gas purification and upgrading to biomethane. I hope it does the
same for some of our readers. These systems use blowers, vacuum pumps,
chillers, dryers and compressors – all of the technologies we cover. It made
me wonder if the gas utilities in the U.S. might increase the practice of
incentivizing factories to purchase renewable biogas?
Steven Scott, from Parker’s FAF Division, provides us with an excellent article reviewing
different kinds of raw biogas purification steps potentially required, depending upon the
site, before “upgrading” to biomethane can occur. His article reviews raw biogas particulate
prefiltration, dehumidification, and the removal of hydrogen sulfide (H2S), siloxanes and
volatile organic compounds.
A true entrepreneur, Kurt Sorschak from Xebec, got up at 5 AM in Shanghai to cheerfully conduct
a Skype interview with me on their new membrane/PSA hybrid systems for biogas upgrading,
hydrogen purification and helium recovery. The article contains some important news for the
Canadian compressed air industry (how’s that for a teaser) and also a very educational description
of the six stages in a typical large-scale biogas upgrading system.
Compressed air industry veteran, Ron Nordby, shares his thoughts in an interesting article reviewing
“Managing Change in the Industrial Air Compressor Industry.” Focusing on distributors and their
views, Ron walks through three steps in a process he believes can help distributors be proactive
in managing the forces of change that confront them.
Murray Nottle is an Engineer with The Carnot Group in Australia. His article proposes a
compressed air system parameter he calls the “CSF Compressor System Factor.” He defines CSF
as the percentage of a compressor’s capacity per minute stored and released by the system volume
during each load/unload cycle.
An underestimated challenge, to optimal compressed air system design, is the fact that the demands
placed upon them are always changing! Ron Marshall, on behalf of the Compressed Air Challenge®,
writes about a rapidly expanding factory and how a poor sizing decision was made when selecting
an additional air compressor. The compressor horsepower size selected created a control gap
difficult to overcome.
Thank you for investing your time and efforts into Compressed Air Best Practices®.
ROD SMITH Editor tel: 412-980-9901 [email protected]
FROM THE EDITORFROM THE EDITORFROM THE EDITOR Biogas Purification
COMPRESSED AIR BEST PRACTICES®
EDITORIAL ADVISORY BOARD
Indus
trial
Ener
gy M
anag
ers
Doug BarndtManager, Demand Side Energy-Sustainability
Ball Corporation
Eric Battino Productivity Senior Manager PepsiCo
Richard Feustel Senior Energy Advisor Leidos
Brad IkenberryEnergy Manager, North America
Michelin
William Jerald Energy Manager CalPortland
Jennifer MeierGlobal EH&S/ Plant Engineering Manager
Varroc Lighting Systems
Thomas Mort Chief Operating Officer
Mission Point Energy
Brad Reed Corporate Energy Team Leader Toyota
Brad Runda Global Director, Energy
Koch Industries
Don Sturtevant Corporate Energy Manager Simplot
Com
pres
sed
Air S
yste
m A
sses
smen
ts
Jay FrancisDirector, Global Product Management & Strategic Accounts
SPX Flow Industrial
Tilo Fruth President Beko USA
Chris Gordon President Blackhawk Equipment
Paul HumphreysCorporate Communications Manager
Atlas Copco
Paul Johnson Global Sales Manager
Parker Hannifin
Kurt Kondas PresidentUniversal Air & Gas Products
Mark Krisa Director Global Service Solutions Ingersoll Rand
Frank Langro Director Marketing / Product Management Festo
Pierre Noack President Aerzen USA
Wayne Perry Technical Director Kaeser Compressors
Andy Poplin Sales Manager Atlas Machine & Supply
Hank Van Ormer President Air Power USA
Compressed Air & Gas Institute, Compressed Air Challenge
2015 MEDIA PARTNERS
* April 2015 Cover Photo supplied courtesy of Parker FAF Division.
| 0 4 / 1 5
6 airbestpractices.com
COLUMNS
INDUSTRY NEWSINDUSTRY NEWSINDUSTRY NEWSXebec Adsorption Introduces Membrane Gas Purification Solutions
Xebec Adsorption Inc., a provider of gas
purification and filtration solutions for the
natural gas, field gas, biogas, helium, and
hydrogen markets, announced, it will be
integrating high efficiency membranes into
its gas purification and separation solutions.
Xebec has historically been offering gas
purification and conditioning solutions
solely based on adsorption technology.
After an in-depth evaluation of membrane
technologies, Xebec will now offer standalone
membrane solutions, as well as hybrid
(membrane + adsorption) solutions, which
are able to achieve recovery rates and purity
levels so far unobtainable with adsorption
technology alone.
For biogas upgrading applications, Xebec
membrane systems will achieve recovery
rates of up to 99.8%, while meeting stringent
product gas specifications. For biogas or
landfill gas applications containing nitrogen
(N2) and oxygen (O
2), Xebec offers advanced
fast cycle kinetic pressure swing adsorption
(kPSA) solutions that can handle nitrogen levels
of up to 30% with excellent recovery rates.
For hydrogen applications, Xebec now integrates
membranes into its overall system design, which
results in significantly higher overall recovery
rates, while still being able to meet extremely
stringent product gas specifications of up
to 99.9999% pure hydrogen.
Xebec has been designing advanced Helium
(He) recovery systems for several years, but
has just recently developed a hybrid helium
purification and conditioning system that will
take low helium concentrations from a gas
well, typically 0.6% to 2.5% of helium, and
purify the gas stream to 99.999% (5 nines)
pure helium, while achieving recovery rates
of up to 95+%. After the helium purification
step, the product helium gas can be liquefied
or compressed for further monetization.
Thanks to the fast cycle PSA technology of
Xebec and the utilization of high performance
membranes, these helium purification systems
have a relatively small footprint, and can
be deployed in remote areas.
About Xebec Adsorption Inc.
Xebec Adsorption Inc. is a global provider
of clean energy solutions to corporations and
governments looking to reduce their carbon
footprints. With more than 1,500 customers
worldwide, Xebec designs, engineers and
manufactures innovative products that
transform raw gases into marketable sources
of clean energy. Xebec’s strategy is focused
on establishing leadership positions in markets
where demand for gas purification, natural
gas dehydration, and filtration is growing.
Headquartered in Montreal (QC), Xebec
is a global company with two manufacturing
facilities in Montreal and Shanghai, as well
as a sales and distribution network in North
America and Asia.
For more information visit www.xebecinc.com
Ariel Corporation Developing New Production Facility
Ariel Corporation announced it is currently
developing a new production facility in the
Heath-Newark-Licking County Port Authority
business complex. The 50,000 square foot
building is the first phase of expansion and
calls for the hiring of machinists and support
personnel from the central Ohio region.
The Ariel-Newark facility will increase Ariel’s
manufacturing capacity in the production
of our reciprocating compressor product line.
| 0 4 / 1 5
8 airbestpractices.com
COLUMNS

BEKOKAT: the cost-effective, environmentally friendly emulsion processing
Catalysis technology is the basis on which BEKOKAT® generates not just oil-free, but bacteria free compressed air that meets or exceeds the ISO 8573-7 standard for germ free compressed air.
This is false sense of security...
Established in 1966 and headquartered
in Mount Vernon, Ohio, Ariel Corporation is
the world's largest manufacturer of separable
reciprocating gas compressors utilized
by the global energy industry. As a world-
class manufacturer, Ariel sets the industry
standard through industry-leading research &
development, expert design & manufacturing,
and unmatched customer support.
For more information visit www.arielcorp.com
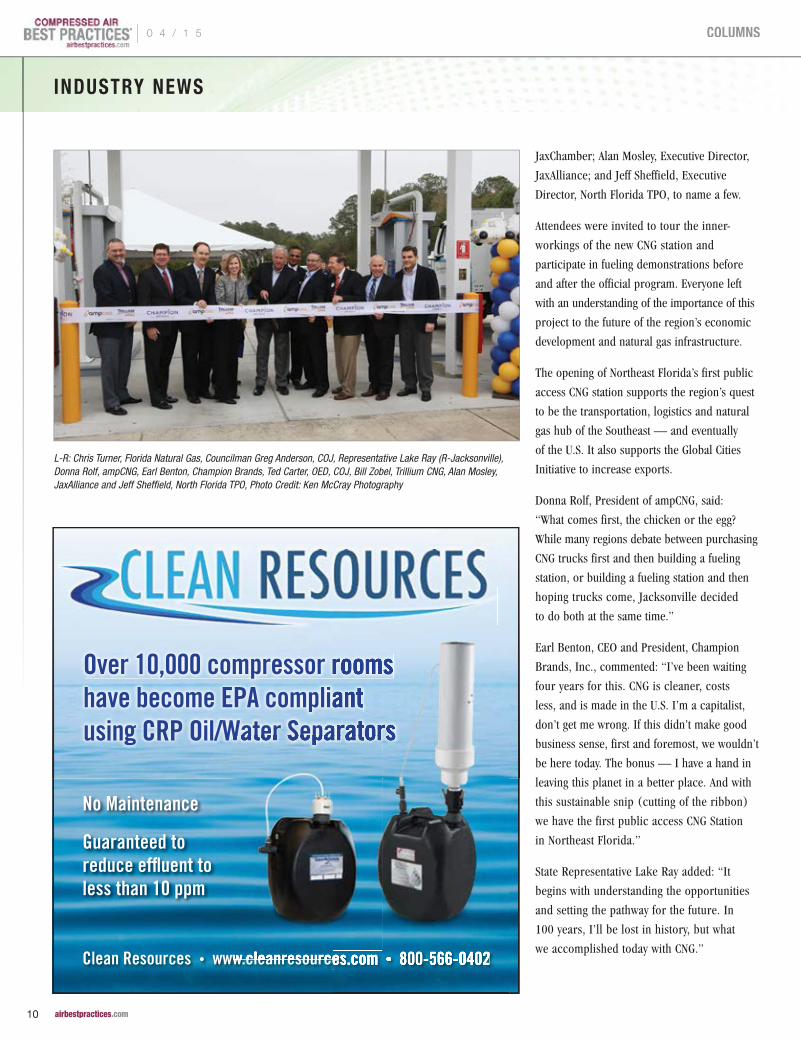
amp Trillium Holds Grand Opening for First Public Access CNG Station in Jacksonville, FL
amp Trillium LLC, the joint venture between
ampCNG and Trillium CNG, and Champion
Brands Incorporated (CBI) recently
celebrated the grand opening of Northeast
Florida’s first public access compressed
natural gas (CNG) refueling station. The
new station will be open 24 hours a day,
seven days a week, and features Trillium
CNG’s proprietary fast-fill hydraulic intensifier
compressor (HY-C).
Close to 100 people gathered to celebrate
and solidify Northeast Florida’s leadership
in the natural gas industry. Noted dignitaries
in attendance included: State Representative
Lake Ray (R-Jacksonville); City Councilmen Jim
Love and Greg Anderson; Ted Carter, Executive
Director, Office of Economic Development, City
of Jacksonville (COJ); Daniel Davis, President,
“CNG is cleaner, costs less, and is made in the U.S.”— Earl Benton, CEO and President, Champion Brands, Inc.
0 4 / 1 5 |
9 airbestpractices.com
COLUMNS
JaxChamber; Alan Mosley, Executive Director,
JaxAlliance; and Jeff Sheffield, Executive
Director, North Florida TPO, to name a few.
Attendees were invited to tour the inner-
workings of the new CNG station and
participate in fueling demonstrations before
and after the official program. Everyone left
with an understanding of the importance of this
project to the future of the region’s economic
development and natural gas infrastructure.
The opening of Northeast Florida’s first public
access CNG station supports the region’s quest
to be the transportation, logistics and natural
gas hub of the Southeast — and eventually
of the U.S. It also supports the Global Cities
Initiative to increase exports.
Donna Rolf, President of ampCNG, said:
“What comes first, the chicken or the egg?
While many regions debate between purchasing
CNG trucks first and then building a fueling
station, or building a fueling station and then
hoping trucks come, Jacksonville decided
to do both at the same time.”
Earl Benton, CEO and President, Champion
Brands, Inc., commented: “I’ve been waiting
four years for this. CNG is cleaner, costs
less, and is made in the U.S. I’m a capitalist,
don’t get me wrong. If this didn’t make good
business sense, first and foremost, we wouldn’t
be here today. The bonus — I have a hand in
leaving this planet in a better place. And with
this sustainable snip (cutting of the ribbon)
we have the first public access CNG Station
in Northeast Florida.”
State Representative Lake Ray added: “It
begins with understanding the opportunities
and setting the pathway for the future. In
100 years, I’ll be lost in history, but what
we accomplished today with CNG.”
Over 10,000 compressor rooms have become EPA compliant using CRP Oil/Water Separators
Clean Resources • www.cleanresources.com • 800-566-0402
No Maintenance
Guaranteed to reduce effluent to less than 10 ppm
using CRP Oil/Water Separators
www.cleanresources.com
Over 10,000 compressor rooms have become EPA compliant using CRP Oil/Water Separators
www.cleanresources.com • 800-566-0402
using CRP Oil/Water Separators
www.cleanresources.com
L-R: Chris Turner, Florida Natural Gas, Councilman Greg Anderson, COJ, Representative Lake Ray (R-Jacksonville), Donna Rolf, ampCNG, Earl Benton, Champion Brands, Ted Carter, OED, COJ, Bill Zobel, Trillium CNG, Alan Mosley, JaxAlliance and Jeff Sheffield, North Florida TPO, Photo Credit: Ken McCray Photography
INDUSTRY NEWS
| 0 4 / 1 5
10 airbestpractices.com
COLUMNS

The new station, which uses a public access
card reader, includes two dual hose dispensers,
enabling two semitrailers to fuel at the same
time. This station marks an important milestone
in host Champion Brands’ mission to replace
its entire fleet of trucks to CNG by July 2017.
For more information, visit www.ampcng.com
Ariel Compressors Installed in Ohio’s Largest Public CNG Station
The City of Columbus is gearing up to open the
second in a series of compressed natural gas
fueling stations in Ohio’s capital city.
The public station, located at 2333 Morse
Road, is comprised of nine dedicated CNG
fueling pumps and will be open to the public
once all testing of the facility is complete. The
station was financed by a city bond package
passed in November of 2013.
Columbus Mayor Michael Coleman was
on hand to celebrate the station dedication,
and was eager to discuss his views on bringing
this alternative fuel to the city. “When I think
about saving tax payers dollars, protecting
our environment and cutting edge technology
— I think about CNG stations in the city
of Columbus,” said Coleman.
Mayor Coleman and Councilwoman Priscilla
Tyson praised city employees for their passion
and drive to get the stations finished on time
and on budget. Councilwoman Tyson also took
the time to highlight the choice of equipment
for the newest station — Ariel compressors.
“By building this station we are lowering
the amount of harmful pollutants in the
air, reducing our dependence on foreign
oil and also creating jobs in Ohio. This
station represents a $6.4 investment into this
community which includes equipment made
in this state — like the Ariel compressors
that are made right here in Ohio,” said Tyson.
Columbus opened its first CNG fueling
station on the east side in 2012, and has saved
taxpayers over $600,000 in fuel costs for the
city’s CNG fleet. About 40 percent of the fuel
pumped has been sold for private vehicles.
By 2020, the city will have 440 CNG vehicles
0 4 / 1 5 |
11 airbestpractices.com
COLUMNS
INDUSTRY NEWS
in this fleet, which is estimated to save the city
around $1.9 million per year in fuel costs.
The Morse Road station is the second step in
a 10-year plan to promote CNG use and allow
for adequate fueling sites in central Ohio.
Preliminary designs for a third station, which
will be located on the west side of the city,
are currently underway.
“At one time there was a gas station on every
corner in America. In the future, there may
be a CNG station on the corner of every street
in Columbus. Imagine what that would do for
our economy,” said Coleman.
For more information regarding CNG, visit https://www.arielcorp.com/cng/ or http://www.ngvc.org/
National Waste Associations Comment on Proposed Revision to U.S. EPA Landfill Regulations
The Solid Waste Association of North America
(SWANA) and the National Waste & Recycling
Association (NW&RA) have jointly provided
comments to the U.S. Environmental Protection
Agency on its proposed rules to update the
Standards of Performance for Municipal
Solid Waste Landfills. The SWANA/NW&RA
joint comments are available at http://bit.ly/
NSPSComments.
SWANA and NW&RA represent the private
and municipal (public) sectors of the waste
and recycling industry in the United States
and share concerns about unnecessary new
regulations in EPA’s proposed rule. John H.
Skinner, Ph.D., SWANA executive director and
CEO, and Sharon H. Kneiss, NW&RA president
and CEO, cosigned the submission to EPA.
“EPA’s proposed new rule and cost analysis
substantially underestimates the number
of existing landfills that will be affected,”
Skinner said. “Significant investments have
already reduced methane emissions from
existing landfills by more than 30 percent
since 1996. Applying these new facility
requirements to existing landfills could
disrupt the progress already made and make
it more difficult and expensive to achieve
greater emission reductions.”
“Landfills are a critical component in
the spectrum of waste management options
in the United States, but the latest round
of regulations proposed by the EPA create
significant, undue burden that will prove
harmful to continued development of
renewable energy projects and efficient
management of America’s waste,” Kneiss said.
The joint comments express concern
that the proposed rule establishes several
unnecessary agency review processes and
reporting redundancies that will hamper
facility efficiency. These added processes and
redundancies will slow operational changes,
reduce efficiencies, increase costs and expose
landfills to potential violations while not
providing any environmental benefit.
Further, the comments note that the EPA
did not consider the financial impact of its
proposed rule on existing facilities that expand
or make site modifications, which are the vast
majority of those that will be affected, when
assessing programmatic costs. EPA’s cost
analysis considered only the projected impact
on landfills opening in 2014 or later, which
is a relatively small number.
FSD-A Series
For medium volume demand
COMPRESSED NATURAL GAS POWERED VEHICLES
The utilization of natural gas powered vehicles is increasing globally. To meet demand, Compressed Natural Gas (CNG) stake-holders have announced plans to expand fueling station infrastructures. SPX is committed to CNG fueling station development by continuously advancing its portfolio of dehydration solutions.
FUELING STATION REQUIREMENTS
Clean, moisture-free compressed natural gas is critical to protect fueling station equipment and for the effi cient operation of natural gas vehicles.
SPX offers three compressed natural gas purifi cation systems to meet customer specifi c requirements for low, medium and high volume demand.
To explore more SPX products and brands, call us at 352-873-5793 or visit www.spx.com.
Meet SPX at ACT 2015 in Dallas, TX. Booth #1223, May 4 - 7, 2015
WE DO MORE THAN JUST DRY COMPRESSED AIR...
| 0 4 / 1 5
12 airbestpractices.com
COLUMNS

FSD-A Series
For medium volume demand
COMPRESSED NATURAL GAS POWERED VEHICLES
The utilization of natural gas powered vehicles is increasing globally. To meet demand, Compressed Natural Gas (CNG) stake-holders have announced plans to expand fueling station infrastructures. SPX is committed to CNG fueling station development by continuously advancing its portfolio of dehydration solutions.
FUELING STATION REQUIREMENTS
Clean, moisture-free compressed natural gas is critical to protect fueling station equipment and for the effi cient operation of natural gas vehicles.
SPX offers three compressed natural gas purifi cation systems to meet customer specifi c requirements for low, medium and high volume demand.
To explore more SPX products and brands, call us at 352-873-5793 or visit www.spx.com.
Meet SPX at ACT 2015 in Dallas, TX. Booth #1223, May 4 - 7, 2015
WE DO MORE THAN JUST DRY COMPRESSED AIR...
The comments also warned that EPA’s
proposed treatment standards would require
highly expensive additions to and maintenance
of renewable energy infrastructure, potentially
damaging the momentum behind repurposing
America’s waste as a resource. These new
standards would dramatically increase costs
and administrative oversight at modified
waste facilities, possibly leading them to cease
operations and precluding new renewable
energy projects from being developed.
It is anticipated that EPA will publish the final
rule early next year after issuing its proposed
rule July 17 of this year.
About SWANA:
The Solid Waste Association of North America
(SWANA) is a professional association with
the mission of promoting environmentally
and economically sound management of
municipal solid waste in North America and
serves over 8,000 members from both the
public and private sectors. For more than 50
years, SWANA has been the leading association
in the solid waste management field. SWANA
serves industry professionals with technical
conferences, certifications, publications and
a large offering of technical training courses.
For more information, visit www.SWANA.org
About NWRA:
The National Waste & Recycling Association
is the trade association that represents the
private sector waste and recycling services
industry. Association members conduct
business in all 50 states and include
companies that collect and manage garbage,
recycling and medical waste, equipment
manufacturers and distributors and a variety
of other service providers.
For more information about NW&RA, visit www.wasterecycling.org
Spectronics Promotes Limin Chen to VP of Manufacturing
Spectronics Corporation has announced the
promotion of Limin Chen to the position of Vice
President of Manufacturing and Special Projects.
Limin began his career at Spectronics in
1993 as a Mechanical Product Development
Engineer, and has been the lead engineer for
the Pipe Freezer, UV EPROM/Wafer Eraser
and Grid Lamp products for more than 10
INDUSTRY NEWS
Register for this Free Webinar at airbestpractices.com
For over 35 years, Pete Rhoten from Hope Air Systems has been designing compressed air systems for the plastics industry. In this Free Webinar, he will share insights on what works (and what does not) for reducing compressed air pressure requirements and generating the associated energy savings.
LOWERING COMPRESSED AIR PRESSURE: WHAT WORKS FOR THE PLASTICS INDUSTRY?
Sponsored By: Kaeser Compressors
April 29th Webinar
| 0 4 / 1 5
14 airbestpractices.com
COLUMNS

years. He has also worked on fluorescent leak
detection products and been involved in other
areas as well.
Before joining Spectronics, Chen worked as a
Product Development Engineer at the Shanghai
General Machinery Corporation for 8 years. He
holds an Associate’s Degree in Manufacturing,
a Master’s Degree in Business Administration,
as well as Bachelor’s and Master’s Degrees
in Mechanical Engineering.
As part of his duties, Limin will direct and
guide Spectronics’ manufacturing/engineering
team in establishing procedures and all
required documents in the manufacturing
process from start to finish. The team will
also supply the production department with the
proper tools, equipment and machines needed
to fulfill orders on a timely basis, produce
products of the highest quality, and monitor
ongoing productivity improvements.
In addition, Limin will direct and guide
Spectronics’ plant engineering team, which
is responsible for the overall maintenance
of the manufacturing facility.
Spectronics Corporation is committed to
the same ideals today as when it was founded
60 years ago — to produce top-quality,
competitively priced products that are
on the cutting edge of today’s technology.
For more information, please visit www.spectroline.com
COMPRESSED AIR ALSO PRODUCES OILY CONDENSATE*
Help ensure it doesn’t impact ourENVIRONMENT.
JORC Zero Air-Loss Condensate Drains and Oil/Water Separators provide
SUSTAINABLE CONDENSATE MANAGEMENT
Zero Air-Loss Condensate Drains
Lock-Down Air Leaks
JORC Industrial LLC. • 1146 River Road • New Castle, DE 19720Phone: 302-395-0310 • Fax: 302-395-0312 • [email protected] • www.jorc.com
*A 250 hp compressor can produce 40,515 gallons of oily condensate per year.
Sepremium Oil/Water Separator
Air-Saver G2
Smart Guard Ultra
Electronic
No Electricity Required
Mag-11 - 230 psi POD-DC Non-Electric
Smart Guard
Limin Chen, VP of Manufacturing and Special Projects, Spectronics CorporationTo read more To read more To read more Industry NewsIndustry NewsIndustry News articles, articles, articles, Industry News articles, Industry NewsIndustry NewsIndustry News articles, Industry News articles, Industry News articles, Industry NewsIndustry NewsIndustry News articles, Industry News
please visit www.airbestpractices.com.please visit www.airbestpractices.com.please visit www.airbestpractices.com.
0 4 / 1 5 |
15 airbestpractices.com
COLUMNS

Biogas Production and Utilization
Biogas is an extremely valuable energy source. Originating from biomass,
sewage, plants and landfill sites, it is gaining ever-increasing worldwide
recognition as a premium source of renewable energy. It is also making a
major contribution to the global energy supply mix by replacing existing
fossil-fuel sources such as coal, oil and conventional natural gas.
In biogas production plants, anaerobic digestion is a process that
occurs when microorganisms decompose the organic content of
the feedstock in the absence of oxygen to generate raw biogas. The
principle constituents of raw biogas are methane and carbon dioxide,
with other trace gases also present in differing amounts depending
on the feedstock and digestion process.
The characteristics of biogas are comparable to natural gas in that
the methane concentration defines the energy content of the gas —
the higher the methane content, the higher the calorific energy value
of the gas.
The most common method of using biogas for energy production
is through combustion in a gas engine or turbine to generate a
combination of heat and electrical power (CHP). Biogas can also
be upgraded, which essentially entails the removal of CO2, to produce
biomethane (also known as renewable natural gas), which is
equivalent to conventional natural gas (CNG) and can be injected
into the gas grid or used as a vehicle fuel.
A Parker Regenerative Siloxane Removal System
From Dehumidification to Siloxane Removal:PARKER BIOGAS PURIFICATIONBy Steven Scott, Business Development Manager — Alternative Energies, Parker Hiross Zander Filtration Division
| 0 4 / 1 5
16 airbestpractices.com
SUSTAINABLE MANUFACTURING FEATURESSUSTAINABLE MANUFACTURING FEATURES

Raw Biogas Treatment
Most of today’s digestion processes produce biogas that is saturated
with water vapor and contains varying degrees of other impurities.
These impurities may cause corrosion, deposits and damage
to equipment, and they should be removed before biogas is used
to produce energy.
Gaseous constituents that should be removed (or reduced) along with
water vapor include hydrogen sulphide, halogen compounds (chlorides,
fluorides), ammonia, siloxanes and volatile organic compounds (VOCs).
Biogas also contains dust and dirt particles, which should also be
removed as part of the raw biogas treatment process.
The selection of an effective biogas treatment is therefore particularly
important, especially for optimizing the cogeneration of electrical and
thermal energy, making the most of the available renewable energy,
reducing energy consumption, and keeping operating costs to a minimum.
Biogas particulate prefilter and filter element
0 4 / 1 5 |
17 airbestpractices.com
SUSTAINABLE MANUFACTURING FEATURESSUSTAINABLE MANUFACTURING FEATURES

Biogas Particulate Prefiltration
Biogas produced in anaerobic digesters and landfills contain
foams, small solid particles in suspension, greases, particulates
and other contaminants that must be removed from the gas by
filtration prior to any downstream equipment or pipework. Failure
to remove these impurities may lead to a malfunction of devices
and processes downstream.
It is beneficial for all biogas production systems to install a coarse
particulate filter (around 25 micron is optimal) as a first line
of protection for all downstream equipment.
A well designed particulate filter for raw biogas should combine
particle retention efficiency with extremely low pressure-drop to
produce clean, ready-to-use biogas, while minimizing service costs.
It is also imperative that the materials of construction, principally
the housing and the filter element, are resistant to the aggressive
contaminants in the gas.
airbestpractices.com
ENERGY KAIZEN EVENTS
Get your FREE Subscription to Compressed Air Best Practices® Magazine to learn how to save energy.
Subscribe at
p Food Packaging Plant Saves $70,000 or 1.1 Million kWh per year. p Paper Mill Saves $207,000 or 4.5 Million kWh per year.
Particulate prefilters can prevent pipescale from fouling heat exchangers
FROM DEHUMIDIFICATION TO SILOXANE REMOVAL: PARKER BIOGAS PURIFICATION
| 0 4 / 1 5
18 airbestpractices.com
SUSTAINABLE MANUFACTURING FEATURES

Biogas Dehumidification
It is generally accepted that a reduction
in water content is beneficial to the CHP
system, however, traditional methods, such as
condensate traps and underground pipework,
cannot achieve low dew points, consequently
reducing the benefit of removing water. For
underground pipework alone to have any real
cooling effect, long runs of pipe are necessary,
which is often impractical, expensive, and
difficult to maintain and service.
It is also common to use “air conditioning”
type chillers for biogas cooling, but these units
are not designed to produce low-temperature
water. They either result in higher gas dew
points or end up operating well outside of
their design limits, resulting in higher energy
consumption and reduced service life.
It is therefore essential to use a cooling
system, such as those in the Parker BioEnergy
range, specifically designed to produce low
dew points and operate in aggressive ambient
conditions, such as those experienced in
biogas applications.
The 4 Major Benefits of Dehumidifying Biogas
There are four major benefits of dehumidifying
biogas. It will increase the energy content of
gas, prevent the corrosion of pipework and
system components, partially removes or
reduces concentrations of specific gases, and
complies with instructions from major gas
engine suppliers.
1. Increases Energy Content of Gas
Raw biogas usually has a very high water vapor
content (between 30 and 100 g water per m³
gas), which equates to between 4 and 8 percent
of the total gas composition and reduces the
calorific value of the gas. Drying biogas to a
dew point of 5 ˚C reduces the moisture content
to 1 percent, thus increasing the methane
content by around 5 percent. This, in turn,
increases the calorific value of the gas.
2. Prevents Corrosion of Pipework and System Components
When ambient temperature drops, the gas
cools, causing water vapor to condense in
the pipeline. Condensate can combine with
CO2, hydrogen sulfide (H
2S), etc. to form an
acidic compound that causes the accelerated
corrosion of machines, gas scrubbers,
pipelines, buffer vessels, sensors and
instruments. The combination of H2S and water
produces sulphuric acid and/or ionic hydrogen,
and the combination of CO2 and water produces
carbonic acid. The resulting acidic condensate
is highly corrosive and will cause a rapid drop
in the alkalinity of the engine oil. Drying the
gas to a low dew point ensures that water vapor
does not condense, thereby preventing the
production of these corrosive acids.
3. Partially Removes H2S, Ammonia, Siloxanes and Other Water-Soluble Gases
With efficient dehumidification, it is possible
not only to remove the water vapor, but also
to reduce the concentration of components,
such as H2S, siloxanes, ammonia and halogen
compounds, each of which dissolves in the
condensed water. The partial or complete
removal of these contaminants improves
the efficiency of the whole plant and greatly
reduces maintenance costs and plant downtime.
4. Complies with Technical Instruction of Major Gas Engine Suppliers
Unlike petrol and diesel fuels, gaseous fuels generally do not have to comply with strict
quality specifications. For this reason, the
1 855 587 [email protected]
www.parker.com/faf
Together, we can separate the bad from the good. Siloxane and VOC removal for landfill biogas, anaerobic digester gas for gas to power grid applications, and biomethane treatment for gas to vehicle.
• Automatic media regeneration• 5 year media life• Low operating costs• Non-carbon technology
• Water repelling media• Small footprint• Complete gas conditioning package• Global support
0 4 / 1 5 |
19 airbestpractices.com
SUSTAINABLE MANUFACTURING FEATURES

manufacturers of cogeneration engines
issue technical instructions to ensure the
fuel gas is of sufficient quality to prevent any
negative effects on engine performance and
service life.
In terms of water content, all of the major
engine manufacturers are clear in stating that
water condensate in the fuel gas pipes or engine
is NOT acceptable.
Installing a cooling system to dry the gas to
a low dew point will ensure that water vapor
does not condense in the gas pipe, which helps
meet the technical instructions of the major
gas engine suppliers.
Hydrogen Sulfide (H2S) Removal
Desulphurization of biogas is necessary to
prevent corrosion, avoid high toxicity levels,
reduce the frequency of engine oil changes,
and prevent problems in the combustion
process. Depending on the feedstock, H2S
levels can vary considerably, with typical
concentrations ranging from 100 to 3000 ppm.
There are various processes available for
the desulphurization of biogas, the most
common being:
1. Biological Oxidation (Bioscrubber) The simplest of the three processes uses air directly injected into the
fermenter and/or a bioscrubber to absorb the sulphur into the washing liquid. This process is often used for the bulk removal of H
2S.
2. Chemical Adsorption Based on chemical reaction of H
2S with iron oxide or iron salts,
this process can reduce high concentrations of H
2S to low levels,
but a balance against operating costs needs to be achieved.
3. Physical Adsorption The most common example of this method is the use of activated carbon, which can be untreated, impregnated or doped to improve efficiency. The high replacement costs make this process more suitable for fine desulphurization or polishing after a biological system.
Siloxanes and VOC Removal
Recent years have seen a marked increase
in the use of siloxane-containing products,
a substantial amount passing through to waste
products both in sewage and landfill sites.
As the gas produced from these sites is
used to power biogas-to-energy units, a
substantial increase in the effects of the
siloxane contamination will be seen in the
form of crystalline silicon dioxide (quartz/
sand) building up on the combustion surfaces
inside generating engines — if the process is
left untreated. In addition to damaged engine
components, affected engines run inefficiently
A Biogas dehumidification system
“In terms of water content, all of the major engine manufacturers are clear in stating that water condensate
in the fuel gas pipes or engine is NOT acceptable.”— Steven Scott, Parker Hiross Zander Filtration Division
FROM DEHUMIDIFICATION TO SILOXANE REMOVAL: PARKER BIOGAS PURIFICATION
| 0 4 / 1 5
20 airbestpractices.com
SUSTAINABLE MANUFACTURING FEATURES

and produce excessive emissions, particularly
carbon monoxide and mono-nitrogen
oxides (NOx).
The result is increased operating costs,
decreased electricity production and
increased pollutants.
There are various technologies commercially
available for the removal of siloxanes from
biogas. The most common are adsorption-
based systems that use media that can
be regenerative or non-regenerative.
For lower concentrations of siloxanes,
activated carbon is often used as an
adsorption media. Activated carbon can
remove siloxanes to very low levels, but
this method has high operation costs due
to the need for the frequent replacement
and disposal of hazardous spent media.
For medium to high concentrations of siloxanes,
the higher capital investment of a regenerative
system is often justified. Regenerative systems
can reduce siloxanes to low levels with
adsorption media lasting much longer than
carbon-based systems. For example, the PpTek
BGAK Siloxane Removal System manufactured
by Parker (Refer to Figure 4) can guarantee
media life of 5 years, during which time siloxane
concentrations will remain below 10 mg/m3.
“Upgrading” Biogas
Raw biogas can be “upgraded” to biomethane,
which essentially means it is refined to natural
gas quality and can be injected into a gas grid
or used as vehicle fuel. To reach pipeline
quality, the gas must be upgraded to the
correct composition for the gas distribution
network to accept.
Prior to upgrading, the gas should be
conditioned (see Raw Biogas Treatment)
and, in the case of landfill and sewage gas
applications, siloxanes and VOCs should
be removed (see Siloxane and VOC Removal).
The efficient removal of VOCs, such as
limonene and other terpenes, is particularly
important, as they can mask the odorants
added to the upgraded gas as a safety
requirement.
The Benefits of Purifying Biogas
The cleaning or purification of biogas
involves a complex mix of filtration and
separation technologies, but even the most
basic of installations can benefit from the
advantages of clean, dry gas. For power
generation, gas engines are a significant
investment in terms of capital and operating
costs, making the investment in effective
and efficient biogas purification an even more
important consideration. This applies even
more so for biogas upgrading applications
where the processing plants need a high
degree of protection from contaminants,
and the gas grid specifications strictly insist
on clean, dry biomethane before injection
can be permitted.
For more information, please contact Kevin Ray, Business Development Manager BioEnergy, Parker Hannifin Corporation, Finite Airtek Division, by phone at (716) 686-6582 or by email at [email protected]. Or, you can visit www.parker.com/hzd or www.parker.com/dhfns.
To read more about To read more about To read more about Biogas Treatment Biogas Treatment Biogas Treatment Technology,Technology,Technology, please visit www. please visit www. please visit www.
airbestpractices.com/industries/oil-gas.airbestpractices.com/industries/oil-gas.airbestpractices.com/industries/oil-gas.
0 4 / 1 5 |
21 airbestpractices.com
SUSTAINABLE MANUFACTURING FEATURES
Compressed Air Best Practices® Magazine spoke with Xebec Inc. President, Mr. Kurt Sorschak.
Good afternoon, or actually good morning to you. How are things in China?!
Good morning to you! Yes, I am visiting our factory in Shanghai and China continues to amaze me. Did you know that in rural China,
approximately 30 million households receive cooking fuel from super-small anaerobic underground digesters? China is just starting to look at industrial biogas upgrading in a serious manner. The market is in its’ infancy but we believe in five years it will be the biggest biogas market in the world. Incineration is not popular as it requires a lot of energy. Here we have many manure-based issues. Soil and water contamination in densely populated areas can lead towards anaerobic digester
projects. Today there are very few projects although we are doing one right now
in northern China.
Are infrastructure investments in China slowing down? Have they peaked?
I can’t comment on whether they’ve peaked or not. Depending upon the topic, I can tell you the scale of infrastructure investments is still astounding. China currently is building six thousand (6,000) wastewater treatment plants. Yes, six thousand! Compare this to the total of 16,000 wastewater treatment plants in the U.S.
Last week we flew to a city in northern China with 6.5 million inhabitants. We then took a 1 ½ hour train ride to another city with four million people. We had to take the train because they don’t have an airport there. This city is roughly the same size as the greater Montreal metropolitan area and has no airport! China currently has plans to build twenty major airports. We also believe biogas is part of the
next investment chapter for China.
Can you define landfill gas and digester gas for us?
Landfill gas (LFG) and Digester Gas (DG), also known as Biogas (BG), are generated by microorganisms metabolizing organic materials in an anaerobic (oxygen-free) environment. The largest components of LFG and DG are methane and carbon dioxide, but smaller amounts of water vapor, hydrogen sulfide (H
2S), ammonia (NH
3) and volatile organic
compounds (VOCs) can also be present in LFG and DG. Oxygen (O
2) and Nitrogen (N
2) are
The Malaysian government passed a law requiring every palm oil plantation to operate a digester by the year 2020.
XEBEC MEMBRANE/PSA HYBRID SYSTEMS FOR BIOGASBy Rod Smith, Compressed Air Best Practices® Magazine
| 0 4 / 1 5
22 airbestpractices.com
SUSTAINABLE MANUFACTURING FEATURESSUSTAINABLE MANUFACTURING FEATURES
sometimes found in low levels in LFG if there is in-leakage of air in the gas collection system at the landfill site.
LFG typically contains 45-55% methane (CH4) and 45-55% carbon
dioxide (CO2), while DG typically contains 50-60% CH
4 and 30-35% CO
2.
What kind of anaerobic digesters exist in southeast Asia?
It is clear the market is already here in southeast Asia. Here we have a very different situation with the huge palm oil plantations in countries like Malaysia and Indonesia. Some of these plantations cover hundreds of square kilometers. Palm tree fruit is pressed and the empty fruit pouches will either decompose and release harmful levels of methane and VOCs — or you put them into an anaerobic digester and produce biogas for electricity or fuel. The Malaysian government passed a law requiring every palm oil plantation to operate a digester by the year 2020.
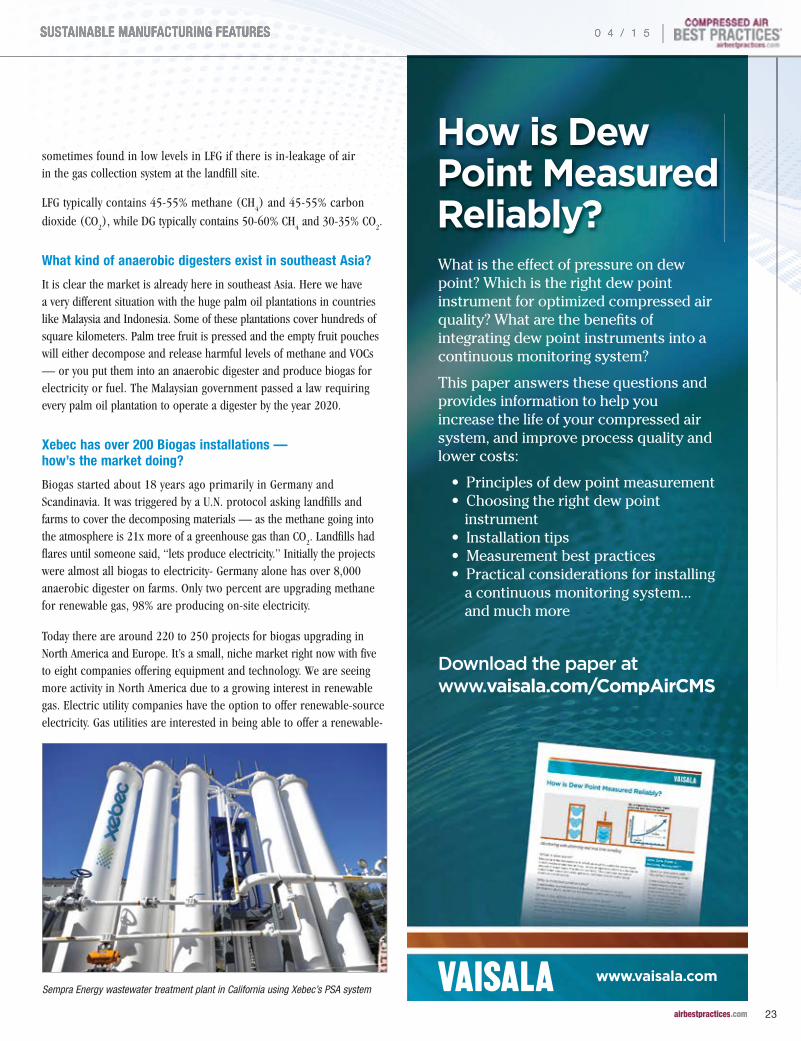
Xebec has over 200 Biogas installations — how’s the market doing?
Biogas started about 18 years ago primarily in Germany and Scandinavia. It was triggered by a U.N. protocol asking landfills and farms to cover the decomposing materials — as the methane going into the atmosphere is 21x more of a greenhouse gas than CO
2. Landfills had
flares until someone said, “lets produce electricity.” Initially the projects were almost all biogas to electricity- Germany alone has over 8,000 anaerobic digester on farms. Only two percent are upgrading methane for renewable gas, 98% are producing on-site electricity.
Today there are around 220 to 250 projects for biogas upgrading in North America and Europe. It’s a small, niche market right now with five to eight companies offering equipment and technology. We are seeing more activity in North America due to a growing interest in renewable gas. Electric utility companies have the option to offer renewable-source electricity. Gas utilities are interested in being able to offer a renewable-
Sempra Energy wastewater treatment plant in California using Xebec’s PSA system
0 4 / 1 5 |
23 airbestpractices.com
SUSTAINABLE MANUFACTURING FEATURESSUSTAINABLE MANUFACTURING FEATURES

XEBEC MEMBRANE/PSA HYBRID SYSTEMS FOR BIOGAS
source gas option. The biogas market has strong tailwinds and growth is accelerating,
particularly in Asia.
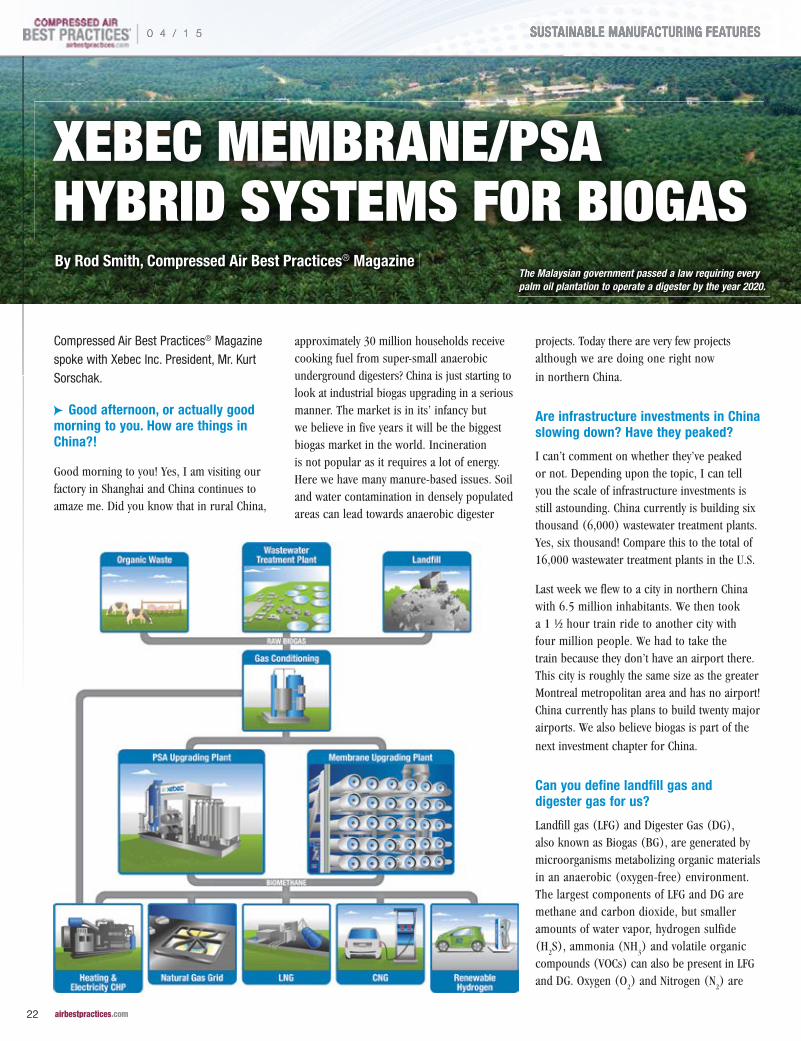
Can you describe a typical large-scale biogas upgrading system?
Sure. Please keep in mind that there are many different technologies and system designs. I’ll describe a typical six-stage system Xebec gets involved with. Readers can see these visually in an interactive process overview at www.xebecinc.com/biogas-plants.php
Stage 1: Feed Gas Blower Module: Raw landfill and digester gas are typically available at low pressure. A blower is used to draw the raw feed gas from the feed gas pipeline and increase its pressure in preparation for further pretreatment and compression. The feed biogas normally is saturated with moisture. A knock-
out drum, located on the low pressure side of the blower, removes entrained moisture. After passing through the blower, the heat of compression is removed in a heat exchanger. As the temperature is reduced, additional entrained moisture is formed. A coalescing filter is used to remove this moisture. The coalescing filter has a special media for the collection of free moisture, while allowing other components of the gas to pass through.
Stage 2: Hydrogen Sulfide Removal Module: In many cases landfill and digester gas contains hydrogen sulfide at a level above acceptable limits in the product gas. Hydrogen sulfide (H
2S) is formed by microbial
processes, is toxic and corrosive and can damage downstream equipment. Therefore it must be removed. There are a number of different technologies available to remove H
2S
from the feed biogas. One system uses two H2S
removal towers containing a media selectively removing H
2S to acceptable limits normally
in the 2 ppmv range. After passing through the towers, the feed gas passes through a particulate filter to remove any dust carryover from the media beds.
Stage 3: Feed Gas Compression Module: Feed gas compressors compress the feed biogas to 120-165 psia (8-11 bar) for downstream processing. A number of compressor designs can be used. Some compressor types introduce oil into the biogas stream to lubricate the compressor internals and to remove some of the heat of compression from the gas. In this case, the oil droplets are removed by a coalescing filter. The oil is collected and cooled in a heat exchanger. Once cooled, it is returned to the compressor
| 0 4 / 1 5
24 airbestpractices.com
SUSTAINABLE MANUFACTURING FEATURES

oil-circulating pump and sprayed into the compressor. The compressed feed gas, now at an elevated temperature, passes through a separate heat exchanger to remove the heat of compression and through another coalescing filter to remove any entrained moisture.
Stage 4: Feed Gas Drying Module: In some cases a feed gas drying module, upstream of the PSA drying system, is used to remove additional water vapor. A regenerative twin-tower desiccant dryer is one technology used. This drying step also removes siloxane compounds. Siloxanes are a silica based compound which can be harmful to downstream equipment and must be removed before the product gas can be injected into a natural gas pipeline or used as a vehicle fuel.
Stage 5: PSA CO2 Removal Module:
CO2 must be removed from LFG and DG
to meet the 1-2% allowable limits for most product gas specifications. CO
2 is removed
using Xebec’s proprietary pressure swing adsorption (PSA) technology utilizing a 9-vessel system employing a patented rotary valve. The vessels contain a media selectively adsorbing CO
2 while allowing the methane to
pass through. In some process configurations, there can be separate 1st and 2nd stage PSA modules. Methane purity is controlled by continuously monitoring the product gas using CO
2 and specific gravity monitors. If CO
2 rises
above the allowable limit, the PSA regeneration cycle is adjusted by changing the rotational speed of the rotary valve.
Stage 6: Product Gas Compression Module: In some cases, the pressure of the product gas leaving the PSA module is below the operating pressure of the natural gas pipeline and must be further compressed prior to injection into the pipeline. Product gas flow to the compressor inlet, is compressed and then cooled in a heat exchanger. The product gas is continuously analyzed to ensure it meets the customer’s required quality specification. Off-spec gas is recycled back to the beginning of the process or sent to a thermal oxidizer or enclosed ground flare. The final step is odorization. Pure methane has no odor and odorant is metered into the product gas
to serve as a warning in the event of a leak.
Let’s talk about your introduction of membrane technology.
Membrane technologies have made a lot of progress and are becoming better and better gas separators. For smaller flow rates, membranes are perfect as a stand-alone gas separation technology. We use membranes for flows of up to 1500 normal cubic meters and for the upgrading of biogas if there is no nitrogen and oxygen in the feed gas. We are using a special membrane polymer suited to separate CO
2 from CH
4. We use a PSA system
when nitrogen and oxygen are present.
Membranes are a great bulk separator and can be used efficiently. Having both PSA and membrane technology gives us great flexibility in design systems to optimize recovery rates (the amount of methane you can capture). Let’s assume a feed gas of 50% CH
4 and 50%
CO2, how much methane can we recover?
Membranes can recover 99.8% of the feed gas, for PSA systems it’s 96%. There is almost a 3%
difference, which over a 20-30 year time-frame can add up.
Membranes require a pre-treatment module and then gas compression to 16-18 bar (235-265 psi). A PSA system requires 6-8 bar (88-118 psi). As far as maintenance goes, PSA’s change adsorbants every 5-10 years. Every 2 ½ years an inspection is recommended. On membranes you look for degradation of performance. Normal membrane life is 7-10
years if you don’t contaminate them.
How do you use membranes on hydrogen applications?
We have a great reputation in the hydrogen market. Steam methane reforming (SMR) systems produce hydrogen. SMR systems produce hydrogen quality, however, that is not good enough for applications like fuel cells. The hydrogen needs to be purified to five or six 9’s (99.99999%). We do liquid projects, where our PSA systems purify hydrogen to these levels before it’s liquified.
Recovery rates are very important and impact the size of the liquifier. Hydrogen recovery rates are normally between 75-85%. With
Xebec’s Polymer Membrane provides High Selectivity, delivering pure biomethane with recoveries up to 99.8%
XEBEC MEMBRANE/PSA HYBRID SYSTEMS FOR BIOGAS
| 0 4 / 1 5
26 airbestpractices.com
SUSTAINABLE MANUFACTURING FEATURES

membranes, recovery rates can get to 90%. A membrane, however, can’t do it alone so we’ve created hybrid membrane/PSA systems. Membranes are used to pre-separate hydrogen and then it go into a smaller PSA system. The recovery rate can be improved by 7- 12%. Another benefit, of these hybrid systems, is the
SMR can be downsized and use less feed gas.
Please review your work with helium.
We’ve been purifying Helium for a long time. For a long time, helium was considered a strategic concern by the U.S. government. There was a gas field with 2-3% gas content. Helium comes out of the ground and is a finite resource. We don’t make it artificially. Helium was cheap because the government made it available at a low price. One year ago the debt (for the gas field) was paid off and the law said the government had to exit the market. Prices spiked and helium rationing began. Congress extended the supply for a couple of years to allow a transition to other helium sources. The helium reserve will be depleted in 10 years. Your party balloons today are probably no longer using helium!
With the higher prices, industries using helium (glass and microchips for example) deploy helium recovery/recycling systems. We have a hybrid membrane/PSA system where we can take a low helium concentration and purify it to five 99.99999% helium purity. We can
recover up to 95% of the helium.
Quickly and on a different topic, what’s happening with CNG refueling stations in the U.S. Are the air compressor distributors getting involved?
The waste company, Waste Management Inc., owns 400 landfills in the U.S. They announced they would convert their 19,000 trucks to CNG, so it makes sense for them to use the gas in their landfills. As municipalities seek to change their “footprint” they are also favoring trucking companies who have made the switch to CNG fleets.
The CNG industry forecast was for a little over 200 stations to be built in the U.S. in 2015. The drop in energy prices may cause a reduction in activity, so my number is 160 new stations. More and more air compressor people are getting interested in providing technical service to the now more than 1500 compressors out there. These companies are well suited to do the maintenance — it just requires looking at a new market.
As you know from our article with you in 2013, Xebec has natural gas desiccant dryers in roughly eighty percent (80%) of the CNG
refueling stations in North America. We have
launched a high-pressure filter line for up to
6000 psig for these stations. This year we are
launching onboard filters for vehicles. These
filters are rated for 3600 psig and fit right on
the engine.
Any other final news?
Yes, Xebec is going back into the business of manufacturing compressed air dryers. We have over 8,000 desiccant air dryers installed in the field and at one time had over 50% market share in Canada. We are re-launching our line of desiccant compressed air dryers because there is no Canadian dryer manufacturer and the 28% depreciation of the Canadian $ (vs. the U.S. $) has made things very difficult for customers importing equipment. We are also bringing out
a new filter line to accompany the dryers.
Thank you for your time.
For more information on Xebec, visit www.xebecinc.com
Interested in Becoming a Distributor?
For more articles on For more articles on For more articles on Biogas Purification,Biogas Purification,Biogas Purification,visit www.airbestpractices/industries/oil-gas.visit www.airbestpractices/industries/oil-gas.visit www.airbestpractices/industries/oil-gas.
0 4 / 1 5 |
27 airbestpractices.com
SUSTAINABLE MANUFACTURING FEATURES
There are many distributors in the
industrial air compressor industry that are very
concerned about the future role of distribution
— or, more specifically — if there even
is a role for distribution in the new business
environment. The industry has changed,
and doing business in the current environment
is very different from what distribution has
become accustomed to. You may describe it
as a “changing of the paradigm” or “moving
the cheese,” but make no mistake — it has
changed drastically. There are examples of
progressive distributors that have succeeded
in managing change and have adapted their
business strategy accordingly. This, however,
is the exception. For a variety of reasons,
many distributors have been unsuccessful
in making this transition. The reality of the
situation is that for distribution to remain
not only relevant, but also influential in the
industrial air compressor industry, it must
have the vision and commitment necessary
to successfully manage change and adapt
to the new business environment.
This vision and commitment must start with
a process by which distributors can become
proactive in managing the forces of change
that confront them. The three major steps
that are necessary to accomplish this include:
1. Recognition and acceptance of change
2. Understanding the genesis and catalysts for change
3. Development of business strategies to successfully manage change
The intent of this two part series of articles
is to apply this process to the industrial
air compressor industry. Hopefully, these
concepts will provide distribution with
an understanding of the current business
environment and inform companies on how
to align their business strategies to adapt
successfully. In part one of the series, Genesis
of Change, the recognition, acceptance and
understanding of change will be examined.
In the follow-up article, Business Strategies
to Manage Change, specific business
strategies for distribution will be presented.
Recognition and Acceptance of Change
The recognition and acceptance of change
is the critical first step. This recognition
and acceptance does not mean that you
have to agree with the direction of change;
you only need to recognize that change has
occurred. While this sounds very simple, this
step is essential for giving distribution the
ability to identify and take advantage of new
opportunities, embrace new technologies,
implement new business strategies, and allow
for profitable growth.
Understanding the Catalyst for Change
The second step is understanding the catalyst
for change. Max McKeown, a strategic business
adviser specializing in innovation strategy,
leadership and culture, is quoted as saying:
“To make improvements, you will have to make
changes. But to make successful change, you
GENESIS OF CHANGE
Managing Change in the Industrial Air Compressor Industry Part 1:
By Ron Nordby, Contributing Editor, Nordby Consulting
“Distribution in the industrial air compressor industry is very aware of the fact that they have not been in
alignment with the changes occurring in the industry.”— Ron Nordby, Contributing Editor, Nordby Consulting
| 0 4 / 1 5
28 airbestpractices.com
SUSTAINABLE MANUFACTURING FEATURESSUSTAINABLE MANUFACTURING FEATURES

have to understand the nature of change, why
it happens, how it starts, how it continues.”
Distribution in the industrial air compressor
industry is very aware of the fact that they
have not been in alignment with the changes
occurring in the industry, often citing the level
of conflict and distrust that currently exists
within the industry as a symptom of this
disconnect. Yet there seems to be a tendency for
distribution to focus on these symptoms rather
than, as Max McKeown stated, the nature, cause
and characteristics of the change. Focusing on
the symptoms of change and neglecting to gain
an understanding of the reasons behind change
undermines the ability of distribution to develop
the strategic business plans necessary to take
advantage of the changes that are occurring.
This can pose a threat to their position as a
major factor in the industry. Knowledge is a
powerful tool, and having the ability to not only
understand the nature and cause, but also the
direction of change, will enable distribution
to successfully control their future and be
proactive in that endeavor.
What Catalyzed Change in the Compressed Air Industry?
Identifying the catalyst for change and the effect
it had on distribution requires identifying both
internal and external events in the industry that
could have facilitated this change. While there
are a number of events that have affected the
industry over the last 25 years, only two have
had the potential to enable this level of change.
1. Evolving industry lifecycle
2. Manufacturers’ adaptation to the evolving industry lifecycle
During the process of examining the role
the above catalysts played as a force of change,
it became obvious that the evolving industry
lifecycle was the genesis of the change.
However, manufacturers’ adaptation to the
industry lifecycle by the development of new
WARNING!
To protect our environment for future generations we should dispose ofcompressor condensate in the proper manner. Not because it is againstthe law to pour it down the drain or on the ground without separating itfirst. We should do it because it’s the right thing to do. Summit IndustrialProducts offers you two ways to separate the oil from the water.
1. ThermaPhase uses high heat to evaporate the water from the oil. You only have to drain the oil from the unit for disposal.
2. ConDePhase® Plus is the most economical way to separate the oil and water. It is a gravity process that separates the oil from water by using a carbon filter.
For more information about these two great oil/water separators...Visit our website at www.klsummit.com/products/equipment
The Eco-Friendly Oil/Water Separators
800.749.5823Distributor Inquiries Welcomed
Compressor Condensate willKill Flowers and Plants
Dead Flower Ad CABP_Layout 1 11/10/2014 2:25 PM Page 1 0 4 / 1 5 |
29 airbestpractices.com
SUSTAINABLE MANUFACTURING FEATURESSUSTAINABLE MANUFACTURING FEATURES
business strategies also played a crucial role
from the perspective of distribution. Both of
these events are intimately related and need
to be a part of the discussion.
When discussing the effect of the industry
lifecycle as a catalyst for change, it is important
to have a basic understanding of what
an industry lifecycle is and how it affects
an industry. While definitions vary, in simplistic
terms the industry lifecycle can be defined
as a business concept relating to the different
stages an industry goes through during its life.
Versions of the industry lifecycle differ, but most
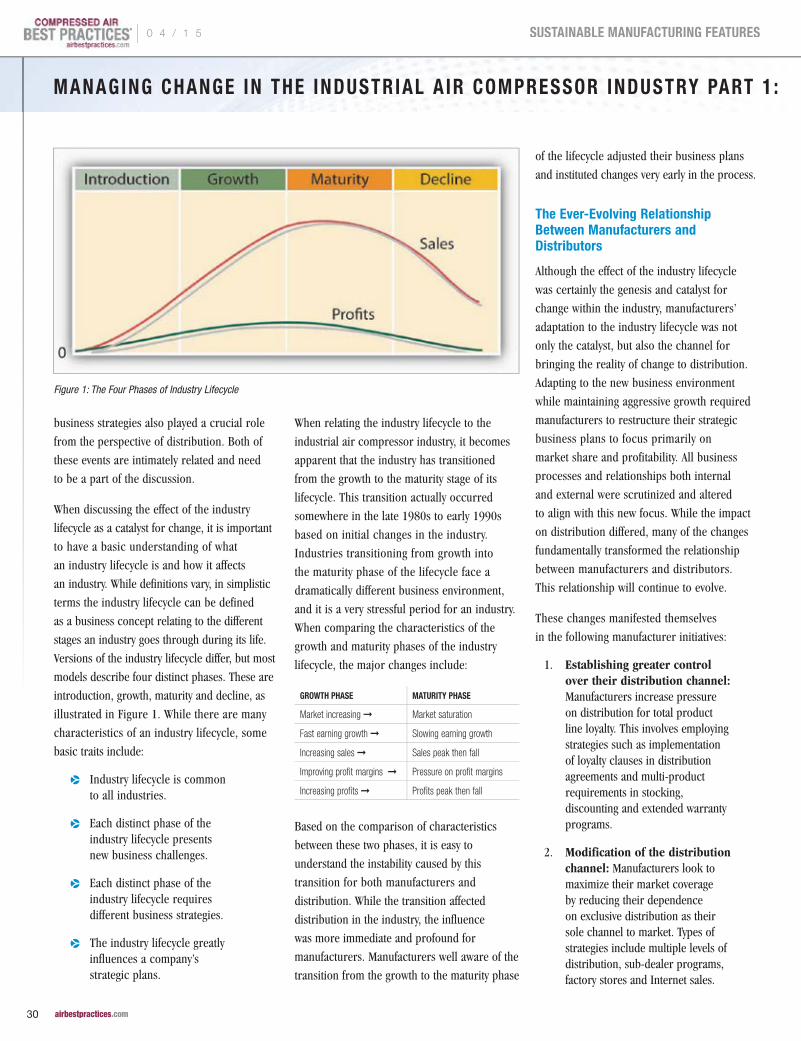
models describe four distinct phases. These are
introduction, growth, maturity and decline, as
illustrated in Figure 1. While there are many
characteristics of an industry lifecycle, some
basic traits include:
p Industry lifecycle is common to all industries.
p Each distinct phase of the industry lifecycle presents new business challenges.
p Each distinct phase of the industry lifecycle requires different business strategies.
p The industry lifecycle greatly influences a company’s strategic plans.
When relating the industry lifecycle to the
industrial air compressor industry, it becomes
apparent that the industry has transitioned
from the growth to the maturity stage of its
lifecycle. This transition actually occurred
somewhere in the late 1980s to early 1990s
based on initial changes in the industry.
Industries transitioning from growth into
the maturity phase of the lifecycle face a
dramatically different business environment,
and it is a very stressful period for an industry.
When comparing the characteristics of the
growth and maturity phases of the industry
lifecycle, the major changes include:
GROWTH PHASE MATURITY PHASE
Market increasing ➞ Market saturation
Fast earning growth ➞ Slowing earning growth
Increasing sales ➞ Sales peak then fall
Improving profit margins ➞ Pressure on profit margins
Increasing profits ➞ Profits peak then fall
Based on the comparison of characteristics
between these two phases, it is easy to
understand the instability caused by this
transition for both manufacturers and
distribution. While the transition affected
distribution in the industry, the influence
was more immediate and profound for
manufacturers. Manufacturers well aware of the
transition from the growth to the maturity phase
of the lifecycle adjusted their business plans
and instituted changes very early in the process.
The Ever-Evolving Relationship Between Manufacturers and Distributors
Although the effect of the industry lifecycle
was certainly the genesis and catalyst for
change within the industry, manufacturers’
adaptation to the industry lifecycle was not
only the catalyst, but also the channel for
bringing the reality of change to distribution.
Adapting to the new business environment
while maintaining aggressive growth required
manufacturers to restructure their strategic
business plans to focus primarily on
market share and profitability. All business
processes and relationships both internal
and external were scrutinized and altered
to align with this new focus. While the impact
on distribution differed, many of the changes
fundamentally transformed the relationship
between manufacturers and distributors.
This relationship will continue to evolve.
These changes manifested themselves
in the following manufacturer initiatives:
1. Establishing greater control over their distribution channel: Manufacturers increase pressure on distribution for total product line loyalty. This involves employing strategies such as implementation of loyalty clauses in distribution agreements and multi-product requirements in stocking, discounting and extended warranty programs.
2. Modification of the distribution channel: Manufacturers look to maximize their market coverage by reducing their dependence on exclusive distribution as their sole channel to market. Types of strategies include multiple levels of distribution, sub-dealer programs, factory stores and Internet sales.
Figure 1: The Four Phases of Industry Lifecycle
MANAGING CHANGE IN THE INDUSTRIAL A IR COMPRESSOR INDUSTRY PART 1 : GENESIS OF CHANGE
| 0 4 / 1 5
30 airbestpractices.com
SUSTAINABLE MANUFACTURING FEATURES

3. Diversification of product offerings: Manufacturers expand their product line offerings through internal development, acquisition or strategic partnering.
4. Consolidation of competition: Manufacturers look to increase market share and critical growth by focusing on inorganic means, such as mergers and acquisitions of competitors.
5. Reduction in channel costs: Strategies utilized by manufacturers include the use of more efficient channels to market (i.e. Internet sales), thereby increasing electronic processes for all channel transactions, and increasing controls on warranty programs. This helps reduce factory support personnel and shift traditional manufacturer responsibilities and costs to distribution.
6. Reducing manufacturing costs: Manufacturers employ cost reduction strategies, such as product standardization, parts rationalization, facility consolidation, value-added engineering of products, and moving manufacturing to less expensive labor areas.
7. Product line rationalization: Manufacturers focus on profitable products while eliminating or outsourcing marginal products.
8. Diversification into new markets: Manufacturers develop products and dedicated marketing initiatives to expand into niche markets that were ignored or underdeveloped during the growth phase of the industry lifecycle.
Certainly the list could go on, and clearly
these initiatives were designed to reflect the
direction of the new strategic business plans
of manufacturers. While the industry can
argue about the necessity and scope of the
initiatives, their implementation should
come as no surprise to distributors. From
a manufacturer’s perspective, they are
considered good business decisions tailored
to meet the challenges they face. While
these initiatives have increased the conflict
and distrust between some manufacturers
and distributors, this is the new reality the
industry faces.
Can Distributors Adapt to the New Paradigm?
Whether you are a manufacturer or a
distributor, there is a new a new paradigm,
the cheese has been moved, and change is
continuing to happen. While manufacturers
accepted and adapted to the new reality,
distribution is still struggling with their
response. They continue to underestimate
their power, influence and importance, and
they readily accept a subservient role in the
industry. For distributors that adapt only
to survive, the future will be very difficult
and uncertain. However, for progressive
distributors that embrace change and acquire
the knowledge to be proactive in adapting to
change, the future is very bright. Distribution
has an excellent opportunity to regain
control of their future. How they respond
will determine their success.
For more information, please contact Ron Nordby at tel: (651) 308-2740, email: [email protected].
To read more To read more To read more Air Compressor Technology Air Compressor Technology Air Compressor Technology articles, visit www.airbestpractices.com/articles, visit www.airbestpractices.com/articles, visit www.airbestpractices.com/
technology/air-compressors.technology/air-compressors.technology/air-compressors.
MANAGING CHANGE IN THE INDUSTRIAL A IR COMPRESSOR INDUSTRY PART 1 : GENESIS OF CHANGE
0 4 / 1 5 |
31 airbestpractices.com
SUSTAINABLE MANUFACTURING FEATURES

This article introduces a new and useful
compressed air system parameter called
the “Compressor System Factor,” or CSF. The
CSF of a given system defines the relationship
between an air compressor, its system, and
how the compressor is being operated. Knowing
the CSF of a system allows comparisons to be
made between existing operating characteristics
and the characteristics of a proposed system.
Changing a system by applying energy efficiency
measures like adding storage receiver capacity,
changing pressure bandwidth, or switching
to different compressor control modes also
changes the CSF. The results of the change
can be easily predicted using the CSF number.
The unit used for CSF is the percentage
of a minute, making the result useful and
compatible with any unit of measurement,
whether it is an SI base unit or a standard
unit used by North American manufacturers.
The calculation of the CSF is a simple yet
powerful tool that can:
p Provide insight into the state of a compressed air system
p Help identify low capital cost projects to improve the efficiency of compressed air systems
p Help assess the merits of supply side and demand side compressed air efficiency projects
The CSF of a given system:
p Largely governs the curve shape, and therefore the efficiency, of a compressor’s power versus flow characteristics for those compressors running in load/unload (online/offline, OLOL) mode
p Can be calculated during the design of a system to help predict system efficiency for different equipment choices
p Can be easily determined for an installed compressor using a stopwatch and a simple calculation
Compressor System Factor Basics
What CSF measures is not profound,
and it is not a hard concept to understand.
CSF is simply the percentage of a
compressor’s capacity per minute stored
and released by the system volume during
each load/unload cycle.
For example, if a 1000 cfm compressor has a
CSF of 10, its compressed air system will store
and then release 10 percent of 1000 cfm, or
100 cubic feet of air in each load/unload cycle.
A 25-cfm compressor could also have a CSF
of 10, but its system would only be storing
and releasing 2.5 cubic feet of air during each
Figure 1: Typical Power vs. Flow Graph for Load/Unload CompressorsSource: Compressed Air Challenge
A VIEW FROM AUSTRALIA: Efficiency Curves, System Volumes and the Compressor System FactorBy Murray Nottle, Working Air Systems Engineer, The Carnot Group
| 0 4 / 1 5
32 airbestpractices.com
SUSTAINABLE MANUFACTURING FEATURESSUSTAINABLE MANUFACTURING FEATURES

cycle. Compressors that have the same CSF
have the same cycle characteristics, regardless
of the size of the compressor. It is important to
note that the amount of air stored and released
in each cycle depends on the effective volume
of the storage receivers and the width of the
load/unload pressure band.
Many readers will recognize the percent
power versus percent capacity curves
found in the U.S. Department of Energy’s
guidebook “Improving Compressed Air System
Performance: A Sourcebook for Industry.”
These curves show how changing the system
volume affects the efficiency of a typical
lubricated screw compressor running
in load/unload mode. The curves shown in
Figure 1 are generated with a fixed load/unload
pressure bandwidth of 10 psi. For the graph to
be correct for compressors not operating with
a 10-psi pressure band, a new set of curves
would have to be generated. But, if each line on
the graph represented a given CSF, the curves
could become valid for any combination of
system storage and pressure bandwidth with
about the same middle pressure.
Knowing the pressure change used to construct
the original graph was 10 psi, the legend could
be changed from 1, 3, 5 and 10 gal/cfm to the
corresponding CSF values of 5.3, 15.9, 26.5
and 53.
How and Why Does the Volume Stored and Released for Each Cycle Affect Part Load Power?
The units of CSF are percentage of a minute
(i.e. time). This provides a clue as to how
it affects compressor efficiency. A large
CSF means the compressor cycles are longer
than those if the compressor had a small CSF.
If system storage is large, or the pressure
band is wide, it takes a longer time for the
compressor to increase the system pressure
from the load setting to the unload setting. It
also takes a longer time for the demand to use
up the stored air, causing the pressure to drop
to the load setting. If the compressor CSF is
very small, these same times would be short,
and the compressor would cycle quickly. This
may cause short cycling, which is known to
waste power.
Figure 2: Example Compressor Cycles Showing Power and Pressure
0 4 / 1 5 |
33 airbestpractices.com
SUSTAINABLE MANUFACTURING FEATURESSUSTAINABLE MANUFACTURING FEATURES
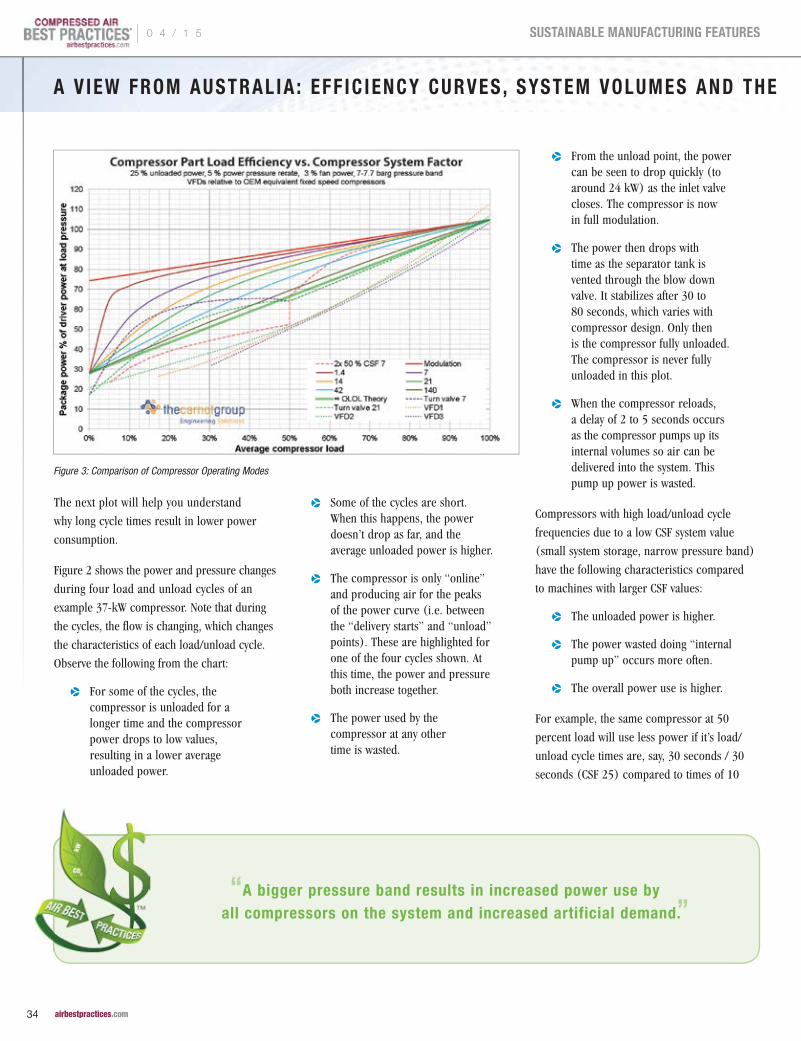
The next plot will help you understand
why long cycle times result in lower power
consumption.
Figure 2 shows the power and pressure changes
during four load and unload cycles of an
example 37-kW compressor. Note that during
the cycles, the flow is changing, which changes
the characteristics of each load/unload cycle.
Observe the following from the chart:
p For some of the cycles, the compressor is unloaded for a longer time and the compressor power drops to low values, resulting in a lower average unloaded power.
p Some of the cycles are short. When this happens, the power doesn’t drop as far, and the average unloaded power is higher.
p The compressor is only “online” and producing air for the peaks of the power curve (i.e. between the “delivery starts” and “unload” points). These are highlighted for one of the four cycles shown. At this time, the power and pressure both increase together.
p The power used by the compressor at any other time is wasted.
p From the unload point, the power can be seen to drop quickly (to around 24 kW) as the inlet valve closes. The compressor is now in full modulation.
p The power then drops with time as the separator tank is vented through the blow down valve. It stabilizes after 30 to 80 seconds, which varies with compressor design. Only then is the compressor fully unloaded. The compressor is never fully unloaded in this plot.
p When the compressor reloads, a delay of 2 to 5 seconds occurs as the compressor pumps up its internal volumes so air can be delivered into the system. This pump up power is wasted.
Compressors with high load/unload cycle
frequencies due to a low CSF system value
(small system storage, narrow pressure band)
have the following characteristics compared
to machines with larger CSF values:
p The unloaded power is higher.
p The power wasted doing “internal pump up” occurs more often.
p The overall power use is higher.
For example, the same compressor at 50
percent load will use less power if it’s load/
unload cycle times are, say, 30 seconds / 30
seconds (CSF 25) compared to times of 10
Figure 3: Comparison of Compressor Operating Modes
“A bigger pressure band results in increased power use by all compressors on the system and increased artificial demand.”
A V IEW F ROM A U STR A L I A : EFF IC IENC Y C URVES , SYST EM VOLUMES AND THE COMPRESSOR SYSTEM FACTOR
| 0 4 / 1 5
34 airbestpractices.com
SUSTAINABLE MANUFACTURING FEATURES

seconds /10 seconds for lower system values
(CSF 8).
At the same average load, longer cycle
times due to a bigger CSF value means
the compressor is unloaded for longer,
the average unloaded power will be less,
and the compressor more efficient than
if it had a smaller CSF value.
Figure 3 below shows typical percent power/
flow curves for the following:
p Fixed-speed load/unload compressors for different CSF values, including a curve for the same system but with two half-sized compressors (2 x 50 percent x CSF 7)
p Variable geometry-controlled compressors with different CSF values (Note that for capacities below the turn valve minimum output, the compressors operate load/unload like a fixed-capacity machine. Hence CSF affects these machines.)
p Different variable speed compressors scaled to fixed- speed compressors (where possible with the same air end) from the same OEM
Many people believe that the way to make a
compressor system more efficient is to make
the trim compressor load/unload pressure
band as narrow as possible. This is not the
case, as a small pressure band will store
little air per cycle, resulting in a CSF value
that is very small.
This is not to say that the pressure band
should be as big as possible. A bigger pressure
band results in increased power use by all
compressors on the system and increased
artificial demand. When these factors are
considered with CSF, it is no surprise that there
is an Optimal Pressure Band (OPB) for each
system and its operating conditions at any time.
How Can You Use CSF To Improve Your Compressed Air System Efficiency?
CSF values can be used in many ways to improve
the efficiency of a compressed air system:
p The concept of CSF provides insight on how the trimming compressor size, the operating mode, the system volume, and the wet-to-dry side pressure drop affect its part load efficiency.
p The equations used to calculate CSF from known and measured parameters can be used to find any of the parameters used in the equations. For example, CSF could be found from measured
values. If the compressor load and unload settings are also noted, the (effective) system volume (V
wu) can be calculated.
If the wet side volume and the dry side pressure changes are also known, the dry side volume can be estimated as well.
p The CSF value for a compressor can be used directly with efficiency curve data to estimate the power consumption of the compressor at a specific percentage load. This assists in the modelling of new or changed compressed system power consumption based on a known (measured or assumed) load profile.
p It allows the development of the Per Unit Power and savings Yield (PUP-Y) chart (Figure 4 shown below).
ACEDRAIN SeriesWe set the standard, because we make the best products. ACEDRAIN Interested in Becoming a Distributor?
- Zero air loss- No electrical power- See-through sightglass- 14.7 ~ 235 psig operating range.
- Alarm indicator- Test handle connecting ball valve- Resistant to large particles- Auto-cleaning system
Email : [email protected] web : m.acetrap.com
Features for Condensate Drains Features for Condensate Drains
www.acetrap.com
A V IEW FROM AUSTRAL IA : EFF IC IENC Y C UR VES , SYSTEM VO L UM ES AND THE COMPRE SSOR SYSTEM FA CTO R
0 4 / 1 5 |
35 airbestpractices.com
SUSTAINABLE MANUFACTURING FEATURES

Calculating CSF From Known Parameters
CSF can be calculated from the known parameters of compressor capacity, system volume, load pressure setting and unload pressure setting.
Value Imperial units, cfm, psi Metric Units, m3/min, bar
Vst, Volume stored per cycle = V
wv ×(P
u − P
L)
14.5 = V
wv × (P
u − P
L)
Vwv
, System (water) volume Cubic feet Cubic metres
Pu, Unload pressure setting psig barg = kPag /100
PL, Load pressure setting psig barg = kPag /100
CSF = 100 × V
st q = 100 ×
Vst q
q, Compressor flow rate cfm m3/min
Note that Vst is the effective system volume at the compressor outlet:
pp For a wet system or a system where the dry side volume is much smaller than the wet side volume, the wet system volume can be used for V
st.
pp Where there is a large dry side volume, the volume stored per cycle for each side of the system must be calculated.
pp For the wet side calculation, the equation in the table can be used directly. Note that the value of V
wv to use is for the
wet side volumes only.
pp For the dry side calculation, Vwv
must be for the dry side volumes only. The pressures to use are the dry side pressures when the compressor loads and when it unloads. Note that the downstream pressure will increase slightly after the compressor unloads as the pressure drop across the air treatment will drop slightly, and the wet side will transfer air to the dry side as well as supplying some of the demand. Hence the pressure to use is at the moment the compressor unloads.
Calculating CSF From Measured Values
The CSF value for a compressor can be calculated from measured
values. The unit of CSF is the percentage of a minute. It is not ft3 per
cfm, m3 per m3/min, or l per l/sec. Therefore, it doesn’t matter what
volume units are used, since the units of CSF are a universal, time-
based value.
As the units of CSF are time-based, the value for a given compressor
and its system can be found using a watch and a simple calculation.
CSF = 100 x (Td x Tu)
60 x (Td + Tu)
Where:
pp CSF is Compressor System Factor.
pp Td is the time the compressor is delivering air in seconds. This is roughly the time from hearing the compressor load to hearing it unload (but this does include the 2 to 3 seconds of pump up time).
pp Tu is the time spent unloaded (including pump up and blow down).
Note that CSF can change with load as air treatment pressure drop (which varies with load) alters the air stored in the dry side during each cycle.
A V IEW F ROM A U STR A L I A : EFF IC IENC Y C URVES , SYST EM VOLUMES AND THE COMPRESSOR SYSTEM FACTOR
| 0 4 / 1 5
36 airbestpractices.com
SUSTAINABLE MANUFACTURING FEATURES

The PUP-Y chart displays average Per Unit
Power and savings Yield for different CSF
values. The PUP trends are based on averaging
power values at specific loads (20, 40, 60
and 80 percent) for a CSF value. These power
values are compared to the power value at 100
percent load. Hence, the PUP curve provides
a means of estimating the average power
consumption of a trimming compressor.
The Yield trend of the chart is based on the
average slope between points on the percent
power/flow curve (80 to 60 percent, 80 to
40 percent, 80 to 20 percent) for different
CSF values. It is a ratio between the change in
percentage load of a compressor to the change
in average power use.
For example, based on the PUP-Y chart,
a compressor with CSF 10 will:
p Have an average specific power consumption 1.59 x that of its full-load specific power
p Have a Yield of 30 percent: For example, an average compressor
load reduction (e.g. from leak repairs) from 60 to 40 percent will result in a 6 percent reduction in average power use (i.e. 30 percent of 60 – 40 = 6).
p If the effective system volume is increased so that the resulting CSF is now 20:
p The trimming compressor average specific power becomes 1.5 x the full-load value, resulting in a 5.6 percent saving.
p The Yield becomes 38 percent, making the same load reduction from the previous example larger (60 to 40 percent now saves 7.6 percent in power).
Together the PUP-Y trends allow a quick
estimate of power consumption and savings.
Some other comments:
p The PUP-Y chart is based on the compressor spending equal time at all loads between 20 and 80 percent. This will not be the case
for all trimming compressors. Hence, the PUP-Y chart is only a guide to allow a quick estimate in a few minutes instead of hours of detailed modelling. If highly accurate values are required, then detailed modelling should be done.
p The PUP-Y chart shows that there are diminishing returns from increasing the CSF value.
p The PUP-Y chart allows modelling work to find the Optimal Pressure Band (i.e. the best choice of pressure bandwidth) when relative compressor sizes, leak and artificial demand loads, and the system volume are considered.
This article has introduced the compressor
system parameter CSF. It has shown how
to find the CSF value for a compressor
in its system. It has also shown how CSF can
be a powerful tool in improving the efficiency
of compressor systems and in evaluating
compressed air efficiency-related projects.
Future articles will further explore the
application of CSF. For example, by affecting
CSF value, one can find the Optimal Pressure
Band for a compressor and evaluate how air
treatment pressure drop affects power use.
Author Bio Murray Nottle is a university-qualified mechanical engineer based in Melbourne, Australia. He has worked in the compressed air industry for well over 15 years. Some of this time has been with pneumatics companies, however, most was with compressor companies. This included establishing the energy auditing abilities of one organization. Murray consults on compressed air productivity and efficiency with The Carnot Group. He can be contacted via email at [email protected] or visit www.carnot.com.au
To read more about To read more about To read more about Air Compressor Control Air Compressor Control Air Compressor Control Technology,Technology,Technology, visit www.airbestpractices.com/ visit www.airbestpractices.com/ visit www.airbestpractices.com/
technology/compressor-controlstechnology/compressor-controlstechnology/compressor-controls
Figure 4: Compressor PUP-Y Chart
A V IEW FROM AUSTRAL IA : EFF IC IENC Y C UR VES , SYSTEM VO L UM ES AND THE COMPRE SSOR SYSTEM FA CTO R
0 4 / 1 5 |
37 airbestpractices.com
SUSTAINABLE MANUFACTURING FEATURES

GROWING FACTORY EXPERIENCES AIR COMPRESSOR
CONTROL-GAP ISSUES
By Ron Marshall for the Compressed Air Challenge®
A factory expanded their production
facilities in response to a new product line being
introduced in their plant. The plant was to run
as a separate entity with its own utility services.
Because this company is very conscientious
about their energy consumption, they specified
top-of-the-line compressed air production
equipment to keep their costs low while
maintaining the very clean air quality required
by their product. This equipment should have
worked wonderfully. Unfortunately, events
transpired, and poor decisions were made
that pushed their system out of control, resulting
in unexpected inefficient compressor operation
and higher-than-desired energy consumption.
Initial Design
Like many systems, this installation was to
be designed from scratch with nothing but
the production machine specifications to go
on for sizing the compressed air equipment.
Based on engineering design calculations,
it was determined that the site needed two
75-hp compressors. The air dryers selected
were required to be desiccant-style to
maintain adequate dew point in cool areas
of the plant where the ambient temperatures
were maintained near 40 ˚F.
To ensure excellent efficiency, the plant
selected two 75-hp variable speed drive
(VSD) compressors, dew point-controlled
heatless desiccant dryers, oversized mist
eliminator-style filtering, large storage receiver
capacity, and a pressure/flow controller to
maintain constant lower regulated pressure in
the plant. Two VSD compressors were selected
so the compressor hours could be balanced by
alternating the operation, with one compressor
expected to run at a time, while the remaining
unit was to remain in standby duty.
An air compressor controller was installed
to orchestrate the compressor changeover,
while keeping compressor discharge pressures
low and saving power. This sizing was adequate
for the original production equipment that
was planned to operate in the plant, but plans
changed. By the time the final construction
was completed, additional plant production
equipment was installed that exceeded the
capacity of one compressor, so two units had
to run during peak periods. In fact, the load
grew so much from the planned levels that
peak flows were nearing the full capacity
of both compressors. This worried the plant
manager because if one compressor failed,
there wasn’t any backup capacity available
to carry over his daytime production levels.
Poor Sizing Decision
The concerned plant manager had to purchase
more air compressor and dryer capacity
in order to protect himself from production
shutdown if a compressor went down. Since
two 75-hp compressors were on the edge
of not being able to supply plant peaks, he
decided he needed a new compressor that
was larger than 75 hp. The next size larger
was chosen, but because project budgets
were stretched, and a VSD compressor was
significantly more expensive, he chose a fixed-
speed compressor.
| 0 4 / 1 5
38 airbestpractices.com
SUSTAINABLE MANUFACTURING FEATURESSUSTAINABLE MANUFACTURING FEATURES
Learn More About System Optimization
Join Compressed Air Challenge for the next session of
Fundamentals of Compressed Air Systems WE
(web-edition) coming soon. Led by our experienced
instructors, this web-based version of the popular
Fundamentals of Compressed Air Systems training uses
an interactive format that enables the instructor to diagram
examples, give pop quizzes and answer student questions
in real time. Participation is limited to 25 students. Please
visit www.compressedairchallenge.org, to access online
registration and for more information about the training.
If you have additional questions about the new web-based
training or other CAC training opportunities, please contact
the CAC at [email protected].
Fundamentals of Compressed Air Systems WE (web-edition)
979-862-8480
IETC2015
June 2-5New Orleans
INDUSTRIAL ENERGY TECHNOLOGY CONFERENCEThe 37th annual Industrial Engergy Technology Conference is the leading conference for industrial energy managers, corporate energy managers, and real-world industrial efficiency projects. Presenting technology and research for reducing waste and energy use in industry.
PAST ATTENDEES PRAISE“It is the best conference from an industry point of view.”“Good exposure. Good way to keep up to date about trends and the state of energy.”
HOSTED BYTexas A&M University and Louisiana Department of Natural Resources
0 4 / 1 5 |
39 airbestpractices.com
SUSTAINABLE MANUFACTURING FEATURESSUSTAINABLE MANUFACTURING FEATURES
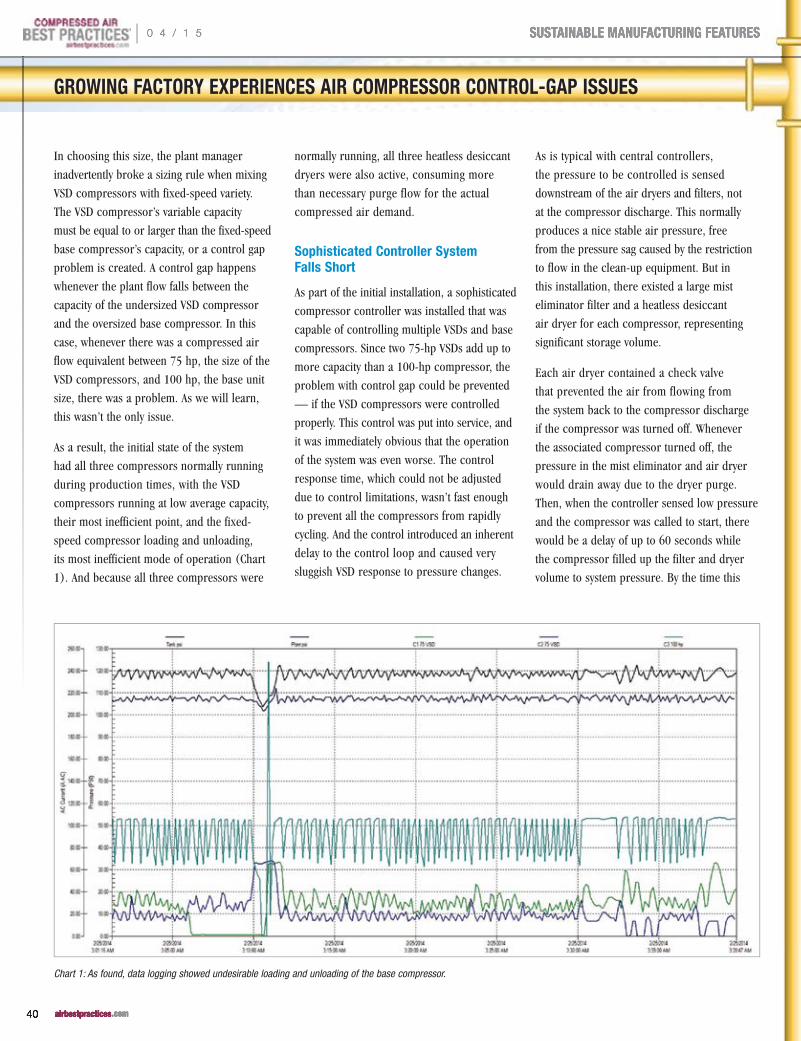
GROWING FACTORY EXPERIENCES AIR COMPRESSOR CONTROL-GAP ISSUES
In choosing this size, the plant manager
inadvertently broke a sizing rule when mixing
VSD compressors with fixed-speed variety.
The VSD compressor’s variable capacity
must be equal to or larger than the fixed-speed
base compressor’s capacity, or a control gap
problem is created. A control gap happens
whenever the plant flow falls between the
capacity of the undersized VSD compressor
and the oversized base compressor. In this
case, whenever there was a compressed air
flow equivalent between 75 hp, the size of the
VSD compressors, and 100 hp, the base unit
size, there was a problem. As we will learn,
this wasn’t the only issue.
As a result, the initial state of the system
had all three compressors normally running
during production times, with the VSD
compressors running at low average capacity,
their most inefficient point, and the fixed-
speed compressor loading and unloading,
its most inefficient mode of operation (Chart
1). And because all three compressors were
normally running, all three heatless desiccant
dryers were also active, consuming more
than necessary purge flow for the actual
compressed air demand.
Sophisticated Controller System Falls Short
As part of the initial installation, a sophisticated
compressor controller was installed that was
capable of controlling multiple VSDs and base
compressors. Since two 75-hp VSDs add up to
more capacity than a 100-hp compressor, the
problem with control gap could be prevented
— if the VSD compressors were controlled
properly. This control was put into service, and
it was immediately obvious that the operation
of the system was even worse. The control
response time, which could not be adjusted
due to control limitations, wasn’t fast enough
to prevent all the compressors from rapidly
cycling. And the control introduced an inherent
delay to the control loop and caused very
sluggish VSD response to pressure changes.
As is typical with central controllers,
the pressure to be controlled is sensed
downstream of the air dryers and filters, not
at the compressor discharge. This normally
produces a nice stable air pressure, free
from the pressure sag caused by the restriction
to flow in the clean-up equipment. But in
this installation, there existed a large mist
eliminator filter and a heatless desiccant
air dryer for each compressor, representing
significant storage volume.
Each air dryer contained a check valve
that prevented the air from flowing from
the system back to the compressor discharge
if the compressor was turned off. Whenever
the associated compressor turned off, the
pressure in the mist eliminator and air dryer
would drain away due to the dryer purge.
Then, when the controller sensed low pressure
and the compressor was called to start, there
would be a delay of up to 60 seconds while
the compressor filled up the filter and dryer
volume to system pressure. By the time this
Chart 1: As found, data logging showed undesirable loading and unloading of the base compressor.
| 0 4 / 1 5
40 airbestpractices.com
SUSTAINABLE MANUFACTURING FEATURES

GROWING FACTORY EXPERIENCES AIR COMPRESSOR CONTROL-GAP ISSUES
capacity filled up, the compressor sequencer
would call on another compressor to start,
resulting in too much running capacity.
This additional capacity caused the pressure
to rise at a very fast rate — too fast for the
controller to handle — and the system would
overshoot, causing an algorithm inside the
controller to unload the base compressor.
Once this happened, the system would go out
of control, with the base compressor loading
and unloading at the same time that the VSDs
would be speeding up to full speed or slowing
down to minimum speed (Chart 2).
To eliminate this delay due to the empty
mist eliminator and dryer storage capacity,
balancing lines were installed to allow a
small amount of dry compressed air back
past the check valve to keep the dryer and
mist eliminator charged, but this was not
enough to improve the system. The control
still introduced an undesirable delay in VSD
response time, which allowed the pressure
to swing above and below desirable limits.
Solving the Problem with Coordinated Compressor Set Points
The only way this problem could be prevented
was to take the compressors off the controller
and precisely coordinate the local compressor
controls manually. After some experimentation,
the local compressor controls were adjusted
so that the whole capacity of both VSD
compressors was utilized before the fixed-
speed base compressor was called to start.
Similarly, when unloading compressors, the
coordination was adjusted to ensure the total
VSD capacity was removed from the system
before the 100-hp base compressor was
unloaded. This was done be “bracketing” the
base compressor’s load and unload settings
above and below the set points of the two
VSDs. Care was taken to ensure the VSD set
Chart 2: Activating the compressor sequencing controller put the system out of control, making matters worse.
Learn More About System Controls
This 325 page manual begins with the considerations for analyzing existing systems or designing new ones, and continues through the compressor supply to the auxiliary equipment and distribution system to the end uses. Learn more about air quality, air dryers and the maintenance aspects of compressed air systems. Learn how to use measurements to audit your own system, calculate the cost of compressed air and even how to interpret utility electric bills. Best practice recommendations for selection, installation, maintenance and operation of all the equipment and components within the compressed air system are in bold font and are easily selected from each section.
Best Practices for Compressed Air Systems Second
Edition
0 4 / 1 5 |
41 airbestpractices.com
SUSTAINABLE MANUFACTURING FEATURES

GROWING FACTORY EXPERIENCES AIR COMPRESSOR CONTROL-GAP ISSUES
points were offset within the base control
band, so the two VSD compressors would
not run at minimum speed at the same
time, which is an undesirable condition.
The resulting pressure setup (Chart 3) is not
a standard arrangement, but it finally provided
some nice efficient compressor control and
stopped the base compressor from rapidly
loading and unloading.
What Went Wrong?
This case study illustrates the importance of
verifying the installation after the installation
by monitoring the system with data loggers.
Sometimes, even with the best intentions,
the conditions that exist and the limitations of
the control system can cause the system to run
inefficiently. The customer had no idea that the
premium system they had just purchased was
not running efficiently. They weren’t aware of
the sizing rule for base compressors. And, why
should they be? Their expertise was producing
their food product, not compressing air. The
sizing rule was something that the supplier
should have told them about. However, when
questioned about this, the supplier sheepishly
replied that they simply supplied what the
customer had requested and felt it was not
their place to ask questions, especially if it
might involve losing a sale.
The marketing literature of the compressor
controller promised efficient operation, but
due to its limitations (it was a low-end unit)
in this unique case, the controller was
inadequate for the job. As it turned out,
this large, multi-national supplier admitted
they had no controller that could do the job.
Monitoring and troubleshooting was used
to identify and correct poor system operation.
Future Improvements to the Compressed Air System
The plant is planning further changes to
the system to improve operation. Upgrades
to the inlet filters of the air dryers will reduce
pressure differential, giving the compressors
more pressure band to use to improve
compressor control response, and reducing
the required compressor discharge pressure.
Also, additional storage receiver capacity
is currently under consideration to slow
down pressure changes in the system, again
to improve compressor control.
After the control was improved, the system
operation became much more efficient.
The system improvements were enough to
trigger a significant energy efficiency incentive
from their local power utility to help pay
for the original equipment and the required
improvements.
For more information about the Compressed Air Challenge, please visit http://www.compressedairchallenge.org/.
Chart 3: Non-standard local pressure band settings were used to improve compressor control, and the controller was shut down.
To read more To read more To read more Air Compressor System Air Compressor System Air Compressor System AssessmentAssessmentAssessment articles, visit articles, visit articles, visit Assessment articles, visit AssessmentAssessmentAssessment articles, visit Assessment articles, visit Assessment articles, visit AssessmentAssessmentAssessment articles, visit Assessment
www.airbestpractices.com/system-www.airbestpractices.com/system-www.airbestpractices.com/system-assessments/compressor-controls.assessments/compressor-controls.assessments/compressor-controls.
| 0 4 / 1 5
42 airbestpractices.com
SUSTAINABLE MANUFACTURING FEATURES

GROWING FACTORY EXPERIENCES AIR COMPRESSOR CONTROL-GAP ISSUES
Subscribe at airbestpractices.com
2015 FOCUS INDUSTRIES:
F R E E S U B S C R I P T I O NDIGITAL EDITION FREE WORLDWIDE | PRINT EDITION FREE TO U.S. SUBSCRIBERS
Learn How To Save Energy & Improve Productivity In YOUR Industry!
p Poultry & Meat Packaging
p Plastic Extrusion & Molding
p Biogas & CNG Fuel & Power
p Chemical Plants & Refineries
p Energy-Efficiency System Assessments
p Bakery & Snacks, Dairy & Beverage Packaging
p Compressed Air Measurement
p Wastewater Aeration
p Metal Fabrication & Machining
p Air Compressor Controls
p Compressed Air Treatment
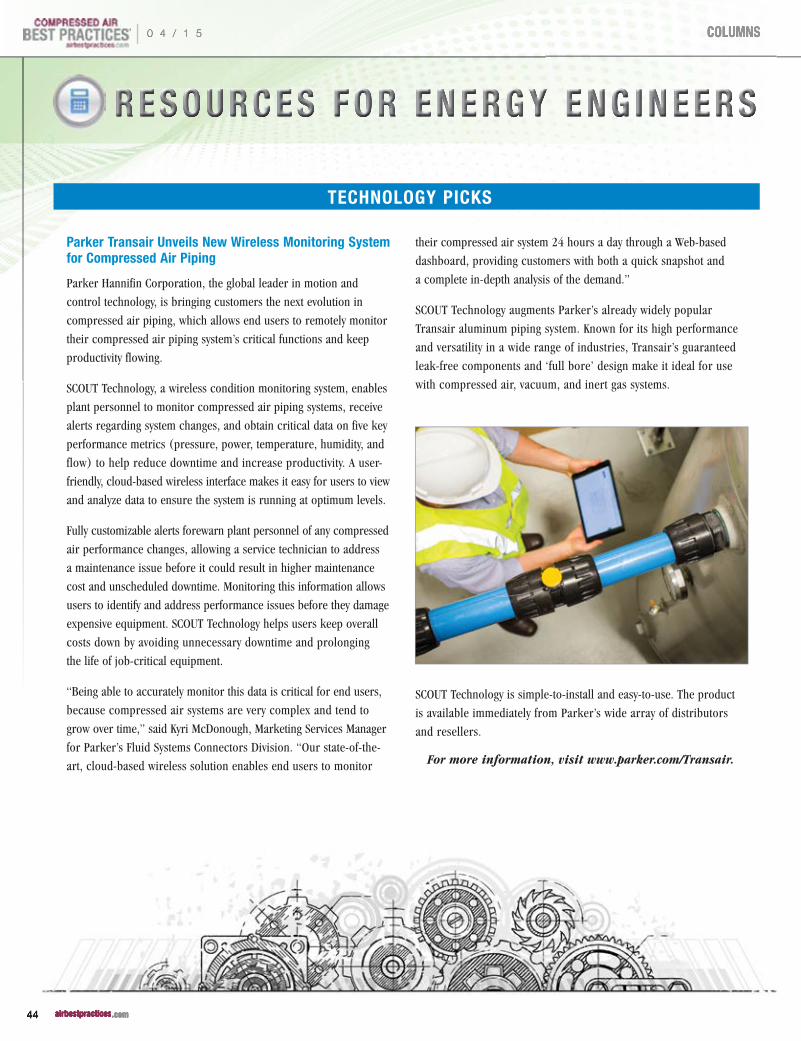
R E S O U R C E S F O R E N E R G Y E N G I N E E R SR E S O U R C E S F O R E N E R G Y E N G I N E E R SR E S O U R C E S F O R E N E R G Y E N G I N E E R S
TECHNOLOGY PICKS
Parker Transair Unveils New Wireless Monitoring System for Compressed Air Piping
Parker Hannifin Corporation, the global leader in motion and
control technology, is bringing customers the next evolution in
compressed air piping, which allows end users to remotely monitor
their compressed air piping system’s critical functions and keep
productivity flowing.
SCOUT Technology, a wireless condition monitoring system, enables
plant personnel to monitor compressed air piping systems, receive
alerts regarding system changes, and obtain critical data on five key
performance metrics (pressure, power, temperature, humidity, and
flow) to help reduce downtime and increase productivity. A user-
friendly, cloud-based wireless interface makes it easy for users to view
and analyze data to ensure the system is running at optimum levels.
Fully customizable alerts forewarn plant personnel of any compressed
air performance changes, allowing a service technician to address
a maintenance issue before it could result in higher maintenance
cost and unscheduled downtime. Monitoring this information allows
users to identify and address performance issues before they damage
expensive equipment. SCOUT Technology helps users keep overall
costs down by avoiding unnecessary downtime and prolonging
the life of job-critical equipment.
“Being able to accurately monitor this data is critical for end users,
because compressed air systems are very complex and tend to
grow over time,” said Kyri McDonough, Marketing Services Manager
for Parker’s Fluid Systems Connectors Division. “Our state-of-the-
art, cloud-based wireless solution enables end users to monitor
their compressed air system 24 hours a day through a Web-based
dashboard, providing customers with both a quick snapshot and
a complete in-depth analysis of the demand.”
SCOUT Technology augments Parker’s already widely popular
Transair aluminum piping system. Known for its high performance
and versatility in a wide range of industries, Transair’s guaranteed
leak-free components and ‘full bore’ design make it ideal for use
with compressed air, vacuum, and inert gas systems.
SCOUT Technology is simple-to-install and easy-to-use. The product
is available immediately from Parker’s wide array of distributors
and resellers.
For more information, visit www.parker.com/Transair.
| 0 4 / 1 5
44 airbestpractices.com
COLUMNS

TECHNOLOGY PICKS
Festo Introduces a New Generation of Durable, Low-Cost Valves
Festo recently introduced the new VS series of piston-spool solenoid
and pneumatic valves and valve manifolds. This new generation
of individually wired valves is designed to give years of dependable
service while helping OEMs lower the costs of acquisition, assembly
and inventory.
The high-flow rate VS series is ideal for simple clamping and
locking operations in semiautomatic assembly, end-of-line
packaging, conveying, painting, open-pit mining, woodworking
and other applications. The valves can be applied in explosive
environments and can be modified to meet the IP67 standard
for dust and immersion resistance.
The VS series comprises VUVS solenoid valves, VUWS pneumatic
valves, and the VTUS valve manifolds. VS series flow rate ranges
from 700 l/min to 2,000 l/min. Pressure ranges from 0 to 10 bar
and from 2.5 to 10 bar for internally piloted valves. Valve types
include 3/2, 5/2, and 5/3. Valve widths range from .79 inches (20
mm) to 1.2 inches (30 mm).
The extensive range of accessories, including a selection of DC and AC
voltage coils, contributes to lower inventory requirements and greater
flexibility. Rather than having to inventory a large selection of separate
valve/coil combinations, for example, OEMs can mount DC or AC coils
themselves or order valves pre-assembled. In addition to coils, other
accessories include seal kit for the IP67 standard, supply manifold,
compact and standard manifold rails, blanking plates, check valves
for manifold rails with exhaust air ducting, wall mounting plate,
foot mounting bracket, and ATEX variants. G and NPT port styles
are available in 1/8, 1/4, and 3/8 sizes respectively.
For more information, visit www.festo.com/us.
Leak Detection Kit From Spectronics Ideal for Finding Leaks in Oil-Based Fluid Systems
The OPK-441 Industrial Leak Detection Kit from Spectronics
Corporation is a starter kit designed to effectively pinpoint the exact
source of all leaks in hydraulic equipment, compressors, engines,
gearboxes and fuel systems.
The kit features the OPTIMAX 400 violet light LED flashlight, a
compact, high-intensity unit that quickly reveals all leaks in small-
to medium-sized industrial systems — even in cramped areas that
are inaccessible to larger lamps.
0 4 / 1 5 |
45 airbestpractices.com
COLUMNS

Also included is an 8-oz (237 ml) twin-neck bottle of patented OIL-
GLO 44 concentrated fluorescent oil dye, which is compatible with
all synthetic and petroleum-based fluids. When a leaking system
is scanned with the OPTIMAX 400 flashlight, the dye glows a bright
yellow/green at all leak sources to reveal the precise location of
each and every leak.
Rounding out the kit is an 8-oz (237 ml) spray bottle of GLO-AWAY
dye cleaner, dye treatment tags, and fluorescence-enhancing glasses.
All components are packed in a rugged carrying case.
For more information, visit www.spectroline.com.
KROHNE Announces New Vortex Flowmeter for Advanced Energy Measurement
KROHNE recently announced the availability of the new OPTISWIRL
4200 vortex flowmeter, ideal for advanced energy management
systems. Used to measure both conducting and non-conducting
liquids, gases and steam, the new OPTISWIRL 4200 vortex flowmeter
can be used for internal monitoring of energy flows for saturated
and superheated steam or hot water, and heat metering applications.
It is also a perfect choice for such applications as steam boiler
monitoring, burner consumption measurement, and compressed air
network monitoring, including free air delivery (FAD) applications.
Equipped with comprehensive communication options, and designed
in accordance with international IEC 61508 functional safety
standards, the OPTISWIRL 4200 is a major update to the original
OPTISWIRL 4070. With one temperature sensor integrated as
standard, the device can be installed as a heat meter in the feed line
directly connected with an external temperature sensor in the return
line. The gross and net heat calculation can be fed into a distributed
control system (DCS) to support advanced energy management.
The all-in-one solution features
integrated pressure and temperature
compensation, and can perform
both gross heat calculations for
steam and net heat calculation
for steam and condensate. The
OPTISWIRL 4200 is available in
a remote version equipped with
a field housing converter with a
connection cable up to 164 feet
(50 meters). Temperature and
pressure compensation options
are also available, which enable
calculation of standard flow volume
under fluctuating pressures and
temperatures. By measurement of flow, temperature, and pressure in
one 2-wire device, the line has to be opened only once for installation.
In addition to the standard sensor range, another available option
features an integrated reduction of nominal diameter up to two
sizes, ideal for space-saving installations and large measuring
spans. A dual version with two independent sensors and two signal
converters is also available for multiproduct pipelines, redundant
measurement, or increased safety demands.
The OPTISWIRL 4200 also includes a variety of electronics
enhancements. The device is now equipped with a new advanced
vortex frequency detection (AVFD) function, as well as a newly
developed signal converter (VFC 200), with advanced signal
processing and filtering that suppresses interferences and
disturbances in the pick-up signal and filters out signals other
than the relevant frequency band. Redundant data management
prevents loss of calibration and configuration data when changing
electronics or display.
For more information, visit www.us.krohne.com.
TECHNOLOGY PICKS
RESOURCES FOR ENERGY ENGINEERS
| 0 4 / 1 5
46 airbestpractices.com
COLUMNS

COMPRESSED AIR BEST PRACTICES®
w w w . a i r b e s t p r a c t i c e s . c o m
ADVERTISER INDEX
Company Page Web Site
Kaeser Compressors Outside Back Cover
www.kaeser.com/cabp
Atlas Copco Inside Front Cover
www.atlascopco.us
BOGE Compressors Inside Back Cover
www.boge.com
DV Systems 3 www.dvcompressors.com
ELGI Compressors 5 www.elgi.us
Sullair Compressors 7 www.sullair.com
Nano Purification Solutions
8 www.n-psi.com
BEKO Technologies 9 www.bekousa.com
Clean Resources 10 www.cleanresources.com
Hitachi Air Technologies 11 www.hitachi-america.us/airtech
VP Instruments 12 www.vpinstruments.com
SPX 13 www.spx.com
JORC Industrial 15 www.jorc.com
CDI Meters 17 www.cdimeters.com
Parker FAF Division 19 www.parker.com/faf
ConservAir 21 www.pneumatech.com/usen
Vaisala 23 www.vaisala.com/compaircms
ICS Rental Air 24 www.rentalair.com
Association of Energy Engineers
25 www.energyevent.com
Anest Iwata Compressors
27 www.anestiwata.com
Summit Industrial 29 www.klsummit.com/products/equipment
Isel Inc. 31 www.iselinc.com
Festo 33 www.festo.com/us/airquality
Ace Drains 35 www.acetrap.com
IETC 2015 39 www.ietc.tamu.edu
TECHNOLOGY PICKS
New Oxygen Analyzer From Michell Instruments Provides Cost Savings
Michell Instruments’ new XZR400BM oxygen analyzer is a small
and light transportable instrument capable of taking readings of both
trace and percentage oxygen levels. It has been introduced to meet
the demands of companies that wish to take routine readings from
multiple sample points, and is a highly cost-effective solution. The
instrument is capable of taking readings on a low flow rate — just
2 l/h — which means less waste of the sample gas from the process.
Based on Michell’s MSRS Zirconia oxygen sensor, the XZR400BM
gives fast readings — 11 seconds for T90 — saving the operator
working time when collecting field readings. As with all Michell’s
XZR range, the instrument is highly stable, giving reliable results
over a long time. A key benefit of the instrument is its low cost
of ownership. Unlike electro-chemical sensors, which require
regular replacement, the MSRS sensor of the XZR400BM should
last in excess of 7 years. Calibration is not needed as frequently
either (every 3 to 6 months), and can be carried out with just
one calibration gas, saving time and money.
The instrument also features an intuitive touch-screen interface to
enable fast and easy operation without the need to invest in extensive
training. This is useful when multiple operators work with the
instrument. It also has a switch-mode power supply, operating from
mains power between 90 and 264 V AC with an IEC cable. At just 13
lbs, and with a small footprint, the XZR400BM is easy-to-move and
takes up minimal bench space.
For more information, visit www.michell.com/us.
0 4 / 1 5 |
47 airbestpractices.com
COLUMNS

Compressed Air Best Practices® is a technical magazine dedicated to discovering Energy Savings in compressed air systems — estimated by the U.S. Department of Energy to represent 30% of industrial energy use. Each edition outlines Best Practice System Assessments for industrial compressed air users — particularly those managing energy costs in multi-factory companies.
“ Compressed air is very important to our manufacturing process and managing its reliability and energy-efficiency is critical.”
– Patrick Jackson, Director of Global Energy Management, Corning Inc. (feature article in June 2014 Issue)
“Compressed air is the #1 kW user across our 35 factories.”– Doug Barndt, Manager Demand-Side Energy & Sustainability,
Ball Corporation
“Demand Side” and “Supply Side” information on compressed air technologies and system assessments is delivered to readers to help them save energy. For this reason, we feature Best Practice articles on when/how to correctly apply air compressor, air treatment, piping, measurement and control, pneumatic, blower and vacuum technology.
Industrial energy managers, utility incentive program managers, and technology/system assessment providers are the three stakeholders in creating energy efficiency projects. Representatives of these readership groups guide our editorial content.
“Each of our 10 production plants has an Energy Coordinator who is part of the corporate energy team.”
– Michael Jones, Corporate Energy Team Leader, Intertape Polymer Group (feature article in July 2014 Issue)
F R E E S U B S C R I P T I O NDIGITAL EDITION FREE WORLDWIDE | PRINT EDITION FREE TO U.S. SUBSCRIBERS
2015 FOCUS INDUSTRIES!Poultry & Meat Packaging • Plastic Extrusion & Molding • Biogas & CNG Fuel & Power • Chemical Plants & Refi neries • Energy-Effi ciency System Assessments • Bakery & Snacks,
Dairy & Beverage Packaging • Compressed Air Measurement • Wastewater Aeration • Metal Fabrication & Machining • Air Compressor Controls • Compressed Air Treatment
Sustainable Energy Savings with Compressed Air Best Practices®
To subscribe visit airbestpractices.com

T H E M A R K E T P L A C ET H E M A R K E T P L A C ET H E M A R K E T P L A C E
ASSOCIATION OF INDEPENDENT COMPRESSOR DISTRIBUTORS
“The AICD is open to all independent compressor distributors and is committed to serving the compressed air industry through education, energy conservation, and best business practices.”
The 2015 annual meeting will be held at the spectacular Gaylord Texan Resort, in Grapevine, TX, May 17-19. Membership is up over 20% this year. Come and see why.
Membership Benefits Include:
• Annual meeting includes a business focused, practical, high value speaker program.
• Ford Motor Company Customer Association Incentive program offering fleet discount pricing on new vehicles.
• New members will receive 2 free registrations to attend the annual meeting.
Contact Kasey Gould, Administrator, at [email protected] or visit www.aicd.org
ACEDRAIN SeriesWe set the standard, because we make the best products. ACEDRAIN Interested in Becoming a Distributor?
- Zero air loss- No electrical power- See-through sightglass- 14.7 ~ 235 psig operating range.- Alarm indicator- Test handle connecting ball valve- Resistant to large particles- Auto-cleaning system
Email : [email protected] : www.acetrap.com
Features for Condensate Drains Features for Condensate Drains
TECHNOLOGY
Job & Product Marketplace Advertising Information
Reach 13,000+ readers of Compressed Air Best Practices® Magazine with Marketplace Ads every month!
Prices are $300.00 per Job Marketplace Ad and $350.00 per Product Marketplace Ad ($300 if 6 or more ads are placed).
Contact Rod Smith at [email protected] to schedule your Marketplace Ads.
Compressed Air Best Practices® is published monthly by Smith Onandia Communications LLC., 37 McMurray Rd. Suite 106, Pittsburgh, PA 15241. Phone 412-980-9902, email [email protected]. Compressed Air Best Practices® is a trademark of Smith Onandia Communications, LLC. Publisher cannot be held liable for non-delivery due to circumstances beyond its control. No refunds. Standard postage is paid at 100 W. Main Street, Senatobia, MS 38668. POSTMASTER: Send address changes to Compressed Air Best Practices,® 37 McMurray Rd. Suite 106, Pittsburgh, PA 15241. SUBSCRIPTIONS: Qualified reader subscriptions are accepted from compressed air professionals, plant managers, plant engineers, service and maintenance managers, operations managers, auditors, and energy engineers in manufacturing plants and engineering/consulting firms in the U.S. Contact Patricia Smith for subscription information at Tel: 412-980-9902 or email: [email protected]. REPRINTS: Reprints are available on a custom basis, contact Patricia Smith for a price quotation at Tel: 412-980-9902 or email: [email protected]. All rights are reserved. The contents of this publication may not be reproduced in whole or in part without consent of Smith Onandia Communications LLC. Smith Onandia Communications LLC. does not assume and hereby disclaims any liability to any person for any loss or damage caused by errors or omissions in the material contained herein, regardless of whether such errors result from negligence, accident, or any other cause whatsoever. Printed in the U.S.A.
COMPRESSED AIR BEST PRACTICES® w w w . a i r b e s t p r a c t i c e s . c o m
Advertising & : Editorial
Rod Smith [email protected] Tel: 412-980-9901
Subscriptions & : Administration
Patricia Smith [email protected] Tel: 412-980-9902
A Publication of : Smith Onandia Communications LLC 37 McMurray Rd. Suite 106 Pittsburgh, PA 15241
Contact Rod Smith for ad rates: [email protected], Tel: 412-980-9901
0 4 / 1 5 |
49 airbestpractices.com
COLUMNS

BOGE – a brand holding all the innovative promiseever needed by compressed air technology.www.boge.com
est
f
erman
ngineering
est
f
erman
ngineeringPhone +1 770 874-1570 [email protected]
Contact Scott Woodward (General Manager)
ww
w.b
oge.
com
T H E M A R K E T P L A C ET H E M A R K E T P L A C ET H E M A R K E T P L A C ETECHNOLOGY
“The preferred source for air compressor and pneumatic system components.”
www.midwest-control.com(800) 304-5599
Zero Air Loss?
Many Solutions.Wide Range of Energy-Saving
Zero Air Loss Condensate Drains In Stock. Same Day Shipment.
High Efficiency Compressor ControllersControl Rotary Screw, Vane, Scroll or Recip Compressors
Save Energy controlling up to FOUR compressors and qualify for Utility Rebates.
• Automatic Lead/Lag Control-up to FOUR Compressors
Accurate Pressure Control with Pressure Transducers
Compressors and Vacuum Pumps from 1 to 250 hp
Thousands of Installations Worldwide. Call for Application Engineering.
Standard Pneumatic Products, Inc. Tel: 203-270-1400 • Toll free: 800-979-9156 Email: [email protected]
www.stdpneumatics.com
Aluminum modular piping for compressed air, nitrogenand vacuum (¾ “- 4 ½”)compressed air, nitrogenand vacuum (¾ “- 4 ½”)
Heavy-duty 100%aluminum pipe & fi ttings
Seeking master distributors in uncovered regions in the Americas
Contact Paolo [email protected]
MTA USA, LLCIndustrial Process Chillers and Compressed Air Treatment Products
25 John Glenn Drive, Suite 104Amherst, New York 14228 USA(Tel.) +1 716 693 8651(Fax) +1 716 693 [email protected]
Another Innovative “Energy Saving Solution”
COMING SOON!
Think…
| 0 4 / 1 5
50 airbestpractices.com
COLUMNS

BOGE – a brand holding all the innovative promiseever needed by compressed air technology.www.boge.com
est
f
erman
ngineering
est
f
erman
ngineering
es
f
erma
ngineePhone +1 770 874-1570 [email protected]
Contact Scott Woodward (General Manager)
ww
w.b
oge.
com
BOGE is a leading German air compressor manufacturer with its North American headquarters located in Powder Springs, Georgia. BOGE has earned a strong reputation for building premium quality compressors in support of a large global distribution network located in more than 120 countries. Through our long heritage of being family-owned, since our founding more than a century ago, BOGE continues to focus on meeting customer expectations by offering the very finest in compressed air equipment through design, production and rigorous final testing.
BOGE does business the old fashioned way. We believe in forming strong partnerships with our distributors so both sides succeed. BOGE offers stability in an industry undergoing many changes that may not be in an independent distributors best interests. Come join the BOGE family of distributors and have a partner you can count on for the long term.