

Bioquali : tool for analyzing regulatory networks
Carito Guziolowski

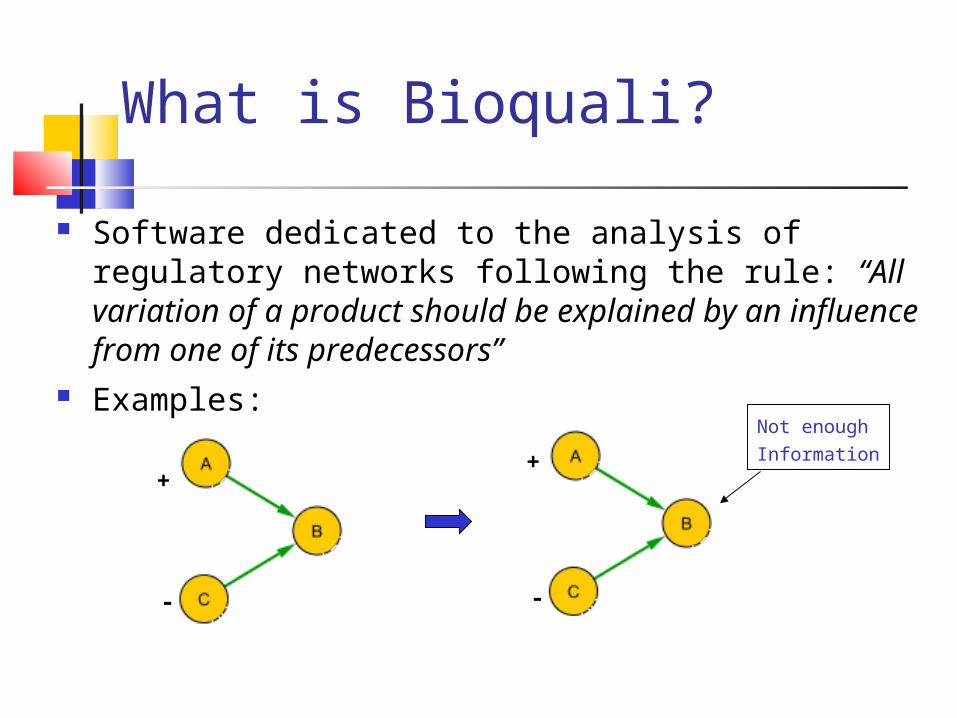
What is Bioquali?
Software dedicated to the analysis of regulatory networks following the rule: “All variation of a product should be explained by an influence from one of its predecessors”
Examples:
+
+ +
+

What is Bioquali?
Software dedicated to the analysis of regulatory networks following the rule: “All variation of a product should be explained by an influence from one of its predecessors”
Examples:
+
-
+
-
+
What is Bioquali?
Software dedicated to the analysis of regulatory networks following the rule: “All variation of a product should be explained by an influence from one of its predecessors”
Examples:
+
-
+
-
+
Not enough
Information

Regulatory network of an organism O
Experimental data associated to organism
O
Analysis

Which network analyse? Network:
Nodes: Proteins, complexes, signals
Edges - Influences: A is an activator [+] of C D is an inhibitor [-] of C A regulates B in a complex way [?]
As a file: A -> B ?
A -> C +
D -> C -
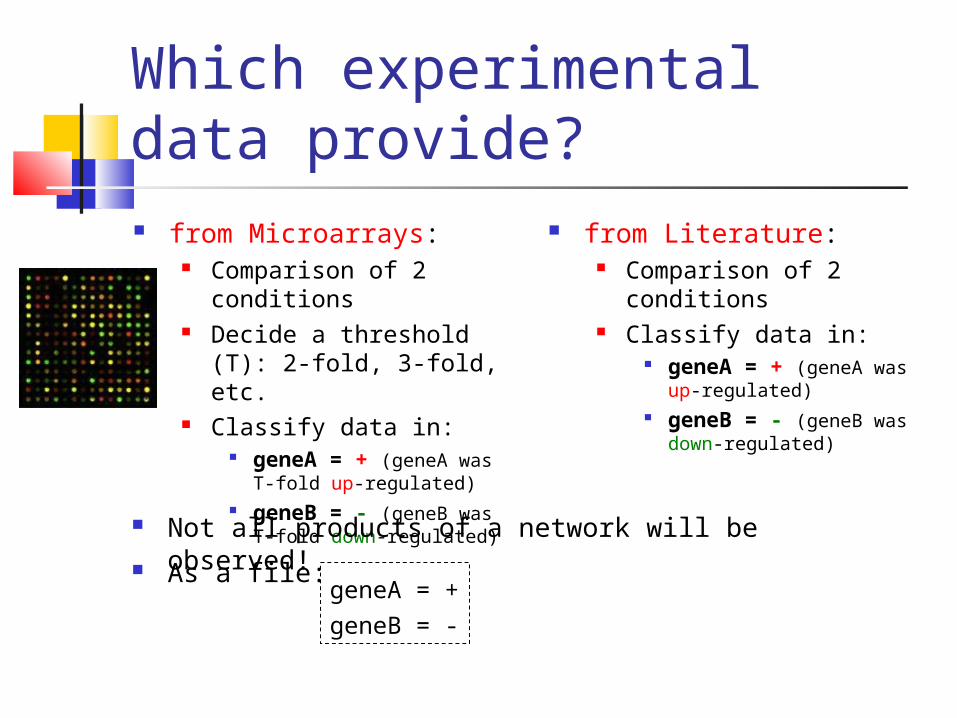
Which experimental data provide? from Microarrays:
Comparison of 2 conditions
Decide a threshold (T): 2-fold, 3-fold, etc.
Classify data in: geneA = + (geneA was
T-fold up-regulated) geneB = - (geneB was T-
fold down-regulated)
from Literature: Comparison of 2
conditions Classify data in:
geneA = + (geneA was up-regulated)
geneB = - (geneB was down-regulated)
Not all products of a network will be observed! As a file:
geneA = +
geneB = -

What can we do ? Consistency Rule: “An up/down
regulation of a product in a network should be at least explained by one of its predecessors”
Check consistencyDiagnostic if inconsistentPrediction of products’
variation if consistent
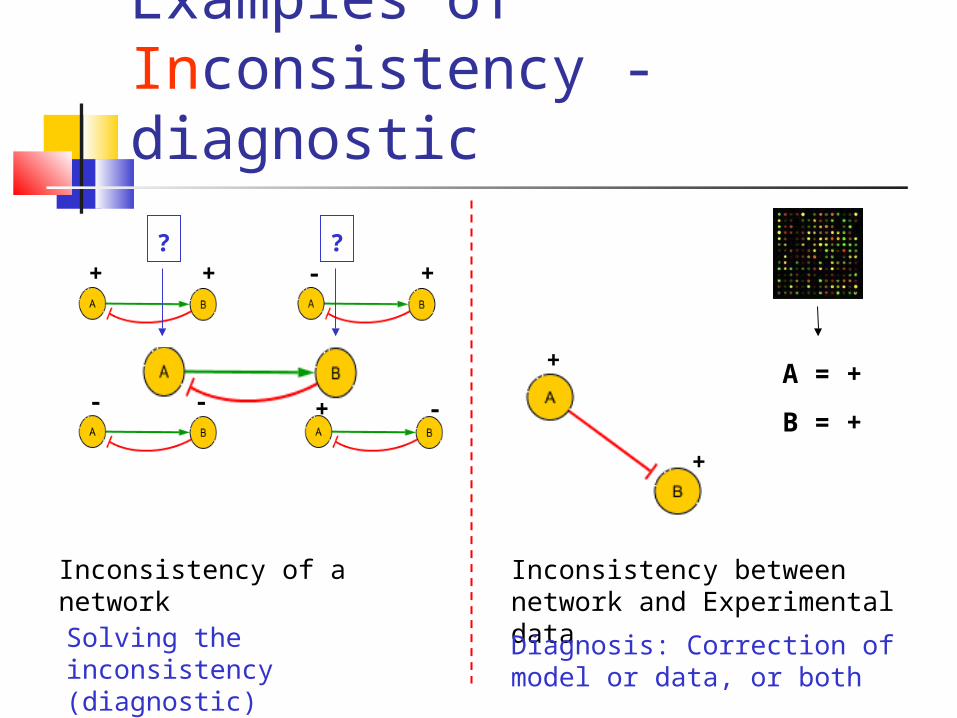
Examples of Inconsistency - diagnostic
A = +
B = +
Inconsistency between network and Experimental data
Inconsistency of a network
+ + - +
- - -+
Solving the inconsistency (diagnostic)
? ?
+
+
Diagnosis: Correction of model or data, or both

Predicting when consistent
A = +
D = -
B = +
C = +
+
-
+
-
+
+

How? Mathematics
Coding the network and experiment as qualitative equations: 1 equation per node
Solving the whole system using algebra among +,-,? values.
Informatics Whole system is coded as a decision diagram using
Python

Example: Escherichia Coli Obtained from RegulonDB 2007 Network
Interactions:
1763 nodes 4491 edges
Experimental data Growth phase: Stationary phase vs Log phase 50 products up/down regulated extracted from literature
Transcription factor – gene Formation of complexes Sigma factor – gene

Example: Escherichia Coli
Checking the consistency of E.Coli regulatory network

Example: Escherichia Coli
Testing Consitency of E.Coli regulatory network
1
2
acrR -> acrA -
acrR -> acrB -
acrR -> acrR -
ada -> ada ?
ada -> aidB +
. . .


Example: Escherichia Coli
Checking the consistency of E.Coli regulatory network with experimental data

Example: Escherichia Coli
1
2
3
acrR -> acrA -
acrR -> acrB -
acrR -> acrR -
ada -> ada ?
ada -> aidB +
. . .
acnA = +
acrA = +
acrR = +
adhE = +
appB = +
appC = +. . .


Example: Solving the problem
Is experimental data correct?
hns = +
appY = +
Induced upon entry to stationary phase
References: Dersch et al. 1993 „Synthesis of the Escherichia coli K-12 nucleoid-
associated DNA-binding protein H-NS is subjected to growth-phase control and autoregulation”
Atlung et al. 1996 „The histone-like protein H-NS acts as a transcriptional repressor for expression of the anaerobic and growth phase activator AppY of Escherichia coli”
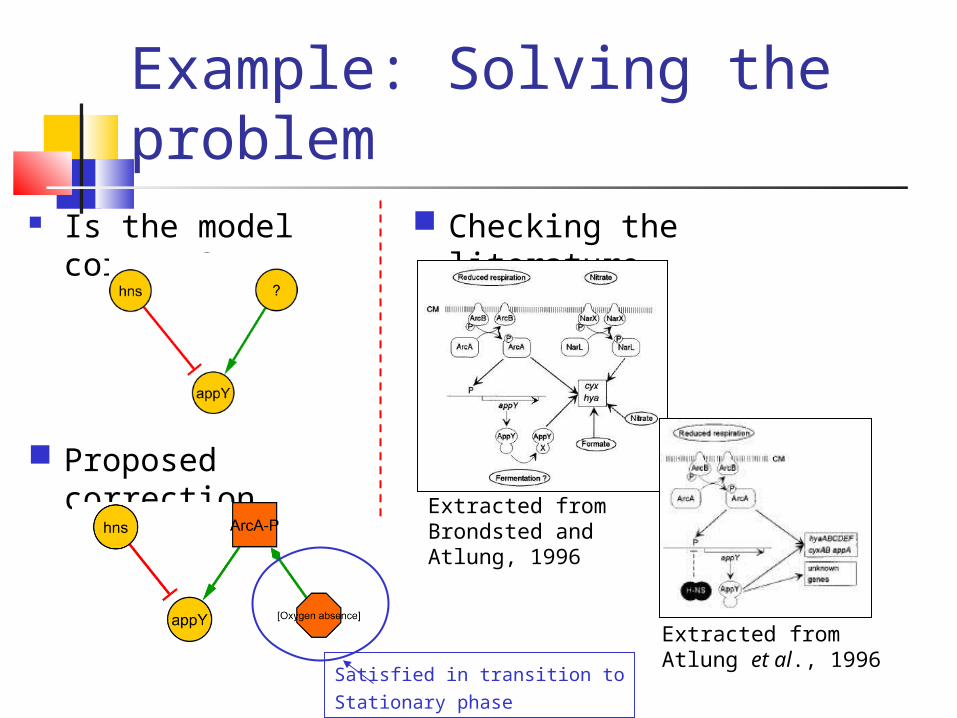
Example: Solving the problem
Is the model correct?
Checking the literature
Extracted from Brondsted and Atlung, 1996
Extracted from Atlung et al., 1996
Proposed correction
Satisfied in transition to
Stationary phase

…Example: Escherichia Coli
Testing Consistency of E.Coli regulatory network corrected with experimental data
acrR -> acrA -
acrR -> acrB -
acrR -> acrR -
ada -> ada ?
ada -> aidB +
. . .
acrR -> acrA -
acrR -> acrB -
acrR -> acrR -
ada -> ada ?
ada -> aidB +
. . .
arcA -> appY +
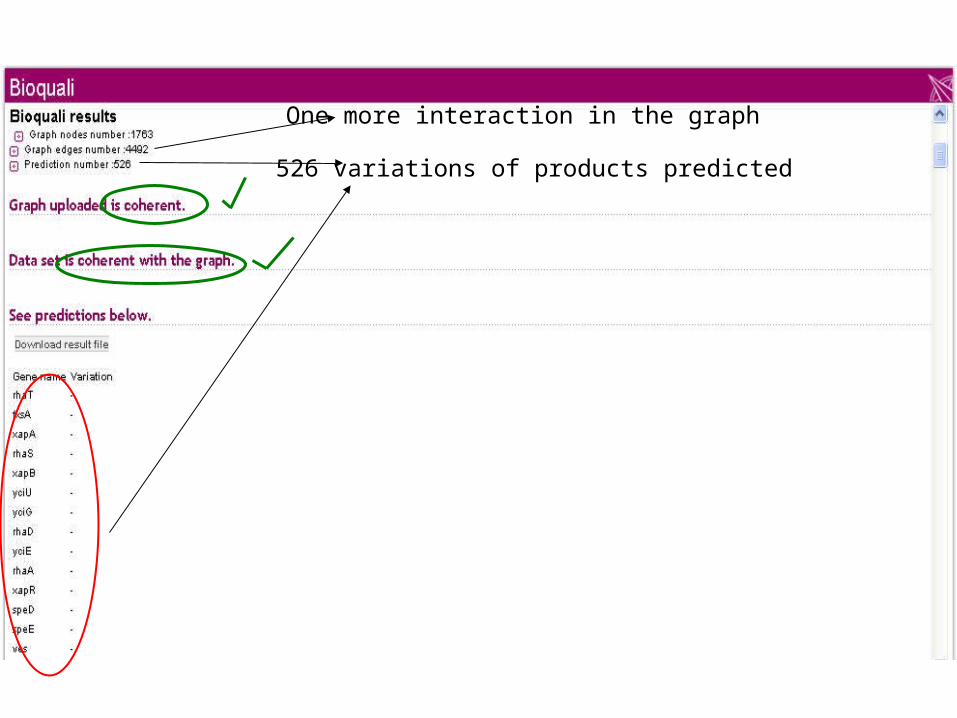
One more interaction in the graph
526 variations of products predicted

Validation of the Prediction• Microarray data set:
– from Faith et al. 2007 and Allen et al. 2003
– Condition: Stationary Phase after 720min vs log phase
– Threshold = 2-fold– 720 products
• 526 variations predicted
• Comparison between predictions and microarray
– 177 common observed products – 77% of them agreed
• Similar results with other experimental conditions
Number of product's variation
0
100
200
300
400
500
600
Stationary Phase Anaerobiosis
from
Predicted
Comparison with MA data sets
0
50
100
150
200
Stationary Phase Anaerobiosis
false positives
agreed

Conclusion
Bioquali allows to perform analysis, diagnostic and prediction in regulatory networks following the consistency rule
Large scale network analysis Future work:
Help in the diagnostic Experimental plan

Acknowledges
Mathematical modeling: Ovidiu Radulescu Anne Siegel
Algorithms and implementation: Michel Le Borgne Philippe Veber
Biological validation to E. Coli: Carito Guziolowski
Web development: Gregory Ranchy Annabel Bourdé

Thank you!


