

BLASTING HARMONICS ANDCONTROLLING PEAK PARTICLE VELOCITY
11th International Symposium on Rock Fragmentationby Blasting ‐ Sydney 2015
Adrian J MooreAlan B RichardsTony J Laing

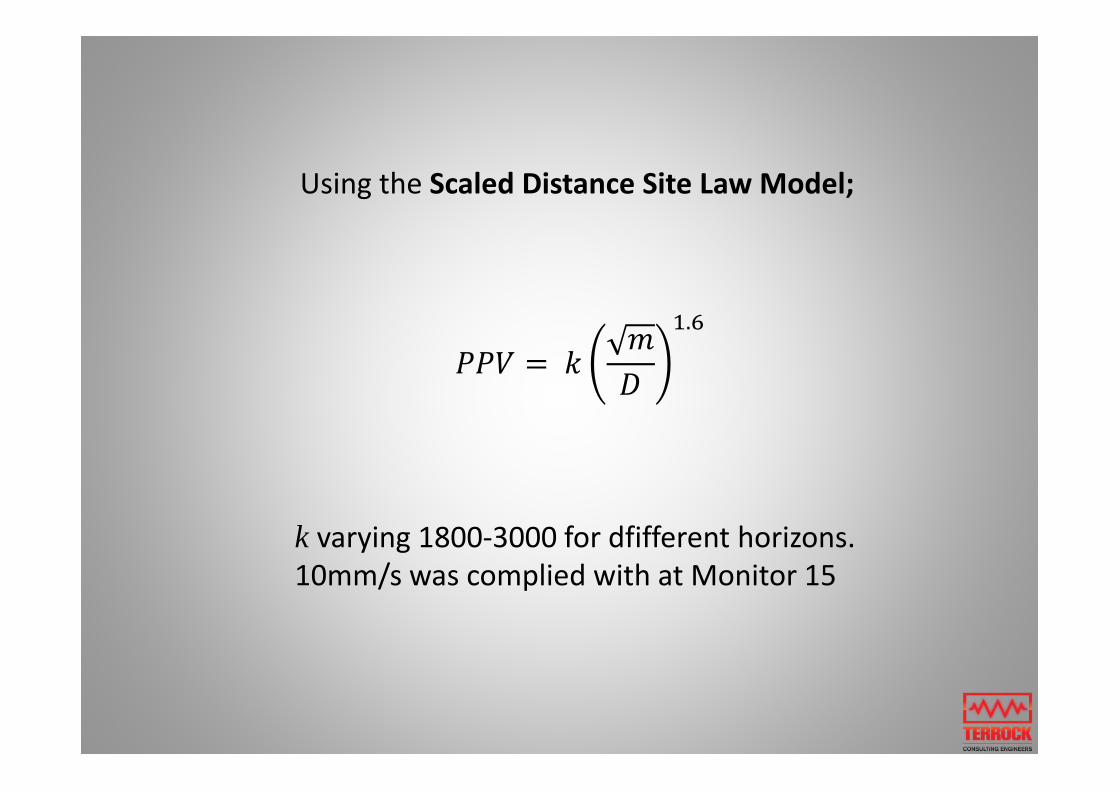
Using the Scaled Distance Site Law Model;
k varying 1800‐3000 for dfifferent horizons.10mm/s was complied with at Monitor 15
.

BLAST 1 – Table 1MIC = 90kg
Component PPV (mm/s)
Monitor Distance (m)
Measured PPV(mm/s)
Predicted PPV(k=2300)
k R T V
1 235 8.39 13.5 1429 6.51 6.26 6.04
10 250 9.27 12.3 1743 9.18 4.18 6.78
15 285 14.0 9.9 3247 13.72 6.18 7.88
16 215 13.55 15.6 2002 12.61 12.76 7.10

Blast 1 Wavetrace

BLAST 2 – Table 2MIC = 100kg
Component PPV (mm/s)
Monitor Distance (m)
Measured PPV(mm/s)
Predicted PPV(k=2300)
k R T V
1 280 10.7 11.1 2212 9.3 5.6 6.6
10 320 10.5 9.0 2688 7.4 8.5 6.8
15 350 21.2 8.2 6260 20.9 9.0 8.7
16 270 15.3 11.8 2984 14.1 8.4 10.5

Blast 2 Wavetrace
Note two peaks. Combined beats in Radial channel, minor beats in the other channels.

To comply with 10mm/s limit;
APPROACH 1. Reduce charge mass.
10 6260 350
.
∴m = 39kg
The charge mass to be reduced from 100kg to 39kg

Ground transmission characteristics
APPROACH 2. Understand ground vibration and beat generation
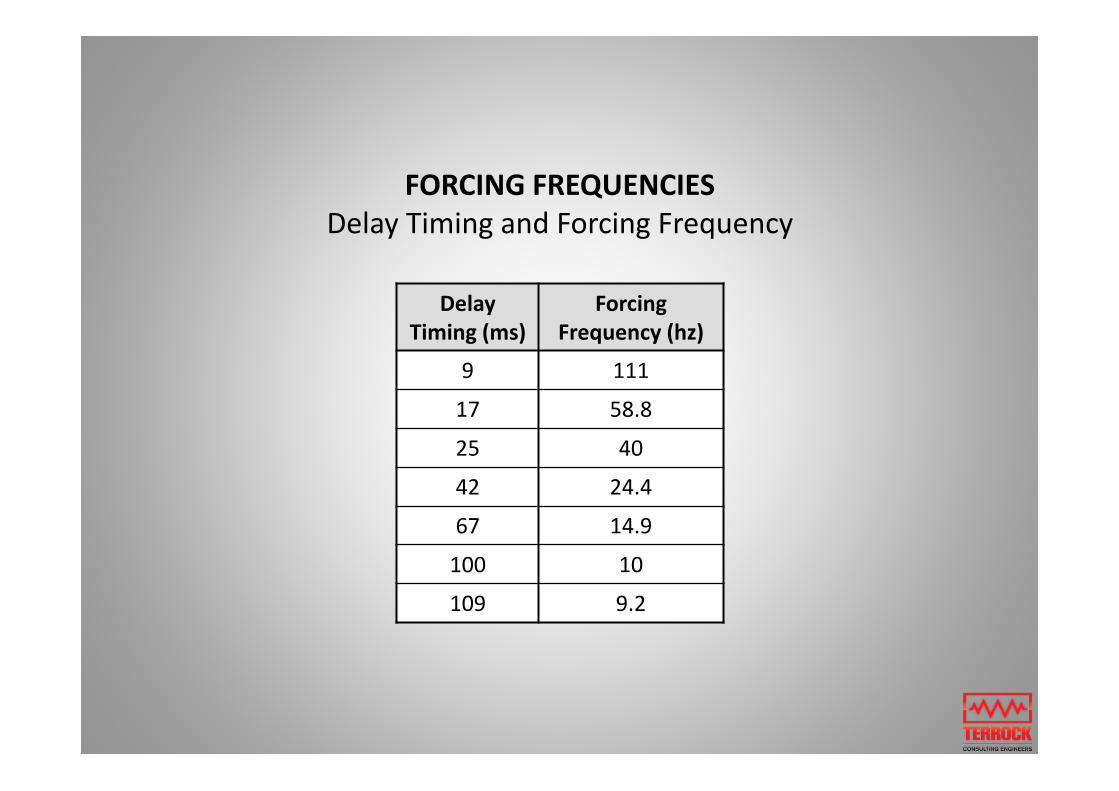
FORCING FREQUENCIESDelay Timing and Forcing Frequency
DelayTiming (ms)
Forcing Frequency (hz)
9 111
17 58.8
25 40
42 24.4
67 14.9
100 10
109 9.2

Doppler Effect/Frequency Ellipsoids
R Wave Frequency Ellipsoid
P Wave Frequency Ellipsoid

Sub harmonic split observations
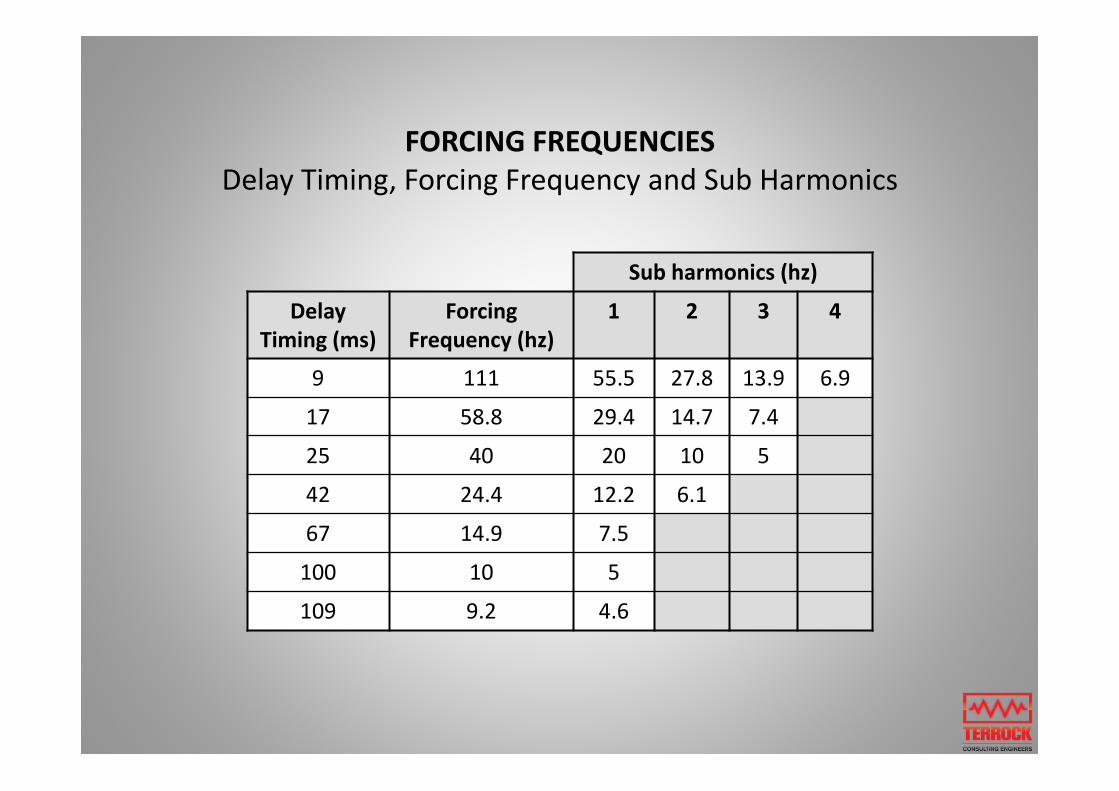
Sub harmonics (hz)
DelayTiming (ms)
Forcing Frequency (hz)
1 2 3 4
9 111 55.5 27.8 13.9 6.9
17 58.8 29.4 14.7 7.4
25 40 20 10 5
42 24.4 12.2 6.1
67 14.9 7.5
100 10 5
109 9.2 4.6
FORCING FREQUENCIESDelay Timing, Forcing Frequency and Sub Harmonics

Blast 2

Initiation sequence causing beats
(800 blast holes)
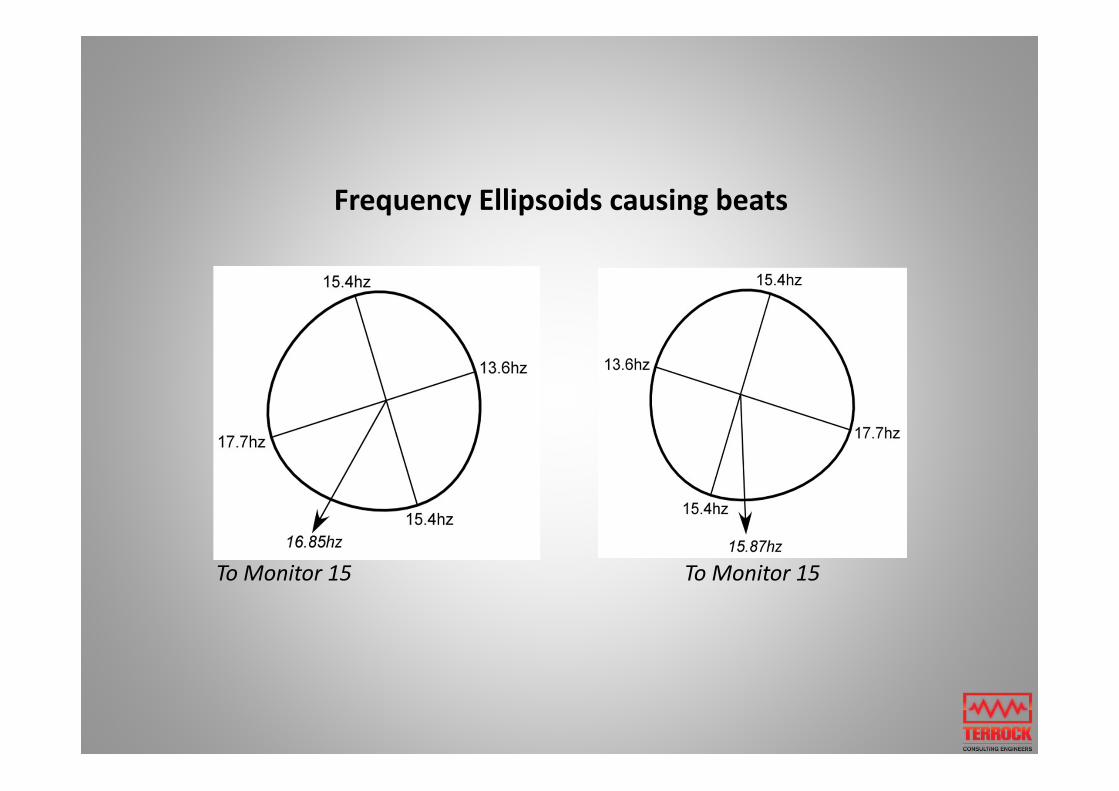
Frequency Ellipsoids causing beats
To Monitor 15 To Monitor 15

BEAT FORMATION

Measured and Theoretical Beats

BLAST 3 – Table 3
Component PPV (mm/s)
Monitor Distance (m)
Measured PPV(mm/s)
Predicted PPV(k=2300)
R T V
1 430 3.27 6.5 2.68 2.01 1.6
10 335 8.13 9.7 6.73 5.16 4.12
15 461 7.80 5.9 6.39 4.02 3.76
16 340 6.71 9.4 6.64 4.63 3.34

With non beat forming initiation sequence
Blast 3 wavetrace

BLAST 4 – Table 4
Component PPV (mm/s)
Monitor Distance (m)
Measured PPV(mm/s)
Predicted PPV(k=2300)
R T V
1 390 4.59 6.5 4.5 2.75 2.38
10 260 13.19 11.5 11.73 9.03 10.85
15 405 7.26 6.0 6.95 4.83 5.21
16 280 12.29 10.8 10.78 11.8 6.54


CONCLUSIONS
The ground vibration resulting from a blast is often influenced by factors other than charge mass and distance.
Controlling ground vibration by charge mass reduction alone has its limitations – a 50% charge mass reduction reduces the PPV by about 40%.
The initiation sequence produces forcing frequencies which may then be modified by Doppler Effect, Frequency ellipsoids nd sub harmonic splits.

Beats are formed when two or more generated frequencies are closely aligned,
e.g. 16.8 hz and 15.8 hz.
The beat frequency is the difference between the two requencies e.g. 16.8 hz and 15.8 hz – the beat frequency is 1 hz.
The beat wavelength is 1000 ÷ beat frequency.
Beats consisting of 3 frequencies may treble the PPV in the channel affected.
To reduce the PPV by destroying beats, first they have to be recognised and then the initiation sequence and direction of firing can be reviewed.
Forensic wave trace examination to identify the causes of the PPV is an essential part of the blasting review process, especially if the PPV levels are approaching regulatory limits.

BEATS ON FILE
Granite Quarry

Basalt Quarry


