

BlightSTAT March 29, 2011
BlightSTATMarch 29, 2011

Agenda
8:00-8:05 Intro & Announcements
8:05-8:20 Fight the Blight Day
8:25-8:55 Inspections
BlightSTAT March 29, 2011
8:25-8:55 Inspections
8:55-9:15 Hearings
9:15-9:30 Abatement & Disposition
BlightSTAT feedback form on back page of presentation

Increasing Access to City Blight Datawww.nola.gov/RESIDENTS/Code-Enforcement/Code-Enforcement-Document-Library
BlightSTAT March 29, 2011

Fight the Blight DaySaturday, March 19, 2011
237 Volunteers
62 Bags of Trash
6 Demolitions
8 Lots Cleaned
BlightSTAT March 29, 2011
82 Scheduled Lot Cleaning (March 20-31, 2011)
62 Gallons of Paint
30 Columns Painted
3 Benches Repaired
220 Tires Disposed
Source: Mayor’s Office, March 28, 2011

Highlights:
30 volunteers for litter
abatement
22 bags of debris
collected
Fight the Blight Day Results: District A
1 lot cleared by INAP
Source: Code Enforcement, March 24, 2011

Highlights:
49 volunteers for on-site
painting, off site litter
abatement & lot
clearing
16 plants were planted
Fight the Blight Day Results: District B
16 plants were planted
in 8 newly painted
bench planters
210 tires disposed
3 benches repaired
5 home demolitions
24 lots cleared or
scheduled for clearing
by INAP
Source: Code Enforcement, March 24, 2011

Highlights:
35 volunteers painted
the baseball field
fencing
12 gallons of paint used
Fight the Blight Day Results: District C
2 fences painted
5 bags of debris
collected
Source: Code Enforcement, March 24, 2011

Highlights:
69 volunteers for litter
abatement and painting
columns
underneath I-610
30 columns and the
Fight the Blight Day Results: District D
30 columns and the
benches under the
overpass were painted
15 bags of debris
collected
12 tires disposed
Source: Code Enforcement, March 24, 2011

Highlights:
54 volunteers for on-site
painting and litter
abatement
40 additional volunteers
from the City and the
Fight the Blight Day Results: District E
from the City and the
neighborhood
participated
20 bags of debris
collected
1 home demolished*
63 lots cleared or
scheduled for clearing
by INAP
*Note: Demolished structure outside of map inset boundary, thus not shown
Source: Code Enforcement, March 24, 2011

BlightSTATBi-weekly report
March 7th – 18th, 2011
BlightSTAT March 29, 2011
March 7th – 18th, 2011

INSPECTIONS
Code Enforcement Process Map
BlightSTAT March 29, 2011

800
1000
1200
1400
1600
Total Code Enforcement Inspections Short of Target
Inspections
Target
1178
BlightSTAT March 29, 2011Source: Code Enforcement, March 28, 2011
0
200
400
600
11/1-
11/12
11/15-
11/26
11/29 -
12/10
12/13-
12/24
12/27- 1/7 1/10- 1/21 1/24- 2/4 2/7- 2/18 2/21-3/4 3/7-3/18
Total
Completed
Inspections

Code Enforcement Inspections by Type
BlightSTAT March 29, 2011

253188
600
800
1000
1200Inspections Backlog Mar 7 – Mar 18, 2011
BlightSTAT March 29, 2011Note: Ending Backlog is equal to Beginning Backlog plus Inspections Scheduled
minus Inspections Completed.
Source: OPA (Office of Performance and Accountability) March 22, 2011
670735
0
200
400
. Beginning
3/7/2011
Inspections
Scheduled
Inspections
Completed
Ending 3/18/2011

459 452
349 233
500
600
700
800
900
1000
Reduction of Aged (in days) Properties in Inspections
Backlog
Over 180
91-180
61-90
0-60
670
735
882902
Inspection backlog reduced
BlightSTAT March 29, 2011Source: OPA (Office of Performance and Accountability) March 24, 2011
137 169240
34483 22
0
0223239 146
93
0
100
200
300
400
2.4.2011 2.18.2011 3.4.2011 3.18.2011
0-60

HEARINGSHEARINGSCode Enforcement Process Map
BlightSTAT March 29, 2011

250
300
350
400
450
500
Total Hearings remain below Target
Hearings
Target
BlightSTAT March 29, 2011Source: Code Enforcement, March 21, 2011
0
50
100
150
200
11/1-
11/12
11/15-
11/26
11/29 -
12/10
12/13-
12/24
12/27- 1/7 1/10- 1/21 1/24- 2/4 2/7- 2/18 2/21-3/4 3/7-3/18
Total
Completed
Hearings135

7
99
6
10
13
17% 18%
25%
19%20%
25%
30%
Decreasing Trend in Percentages of Compliance
Outcomes
Hearings
BlightSTAT March 29, 2011Source: Code Enforcement March 21, 2011
9%
5%
0%
5%
10%
15%
12/27- 1/7 1/10- 1/21 1/24- 2/4 2/7- 2/18 2/21-3/4 3/7-3/18
Hearings
Compliance
73426351720

7
99
6
10
13
35%
73%
40%
50%
60%
70%
80%
Percentages of Guilty Outcomes
Hearings Guilty
BlightSTAT March 29, 2011Source: Code Enforcement March 21, 2011
18%
33% 34%
22%
35%
0%
10%
20%
30%
40%
12/27- 1/7 1/10- 1/21 1/24- 2/4 2/7- 2/18 2/21-3/4 3/7-3/18
Hearings Guilty
996223676521

7
99
6
10
13
25%
16%
15%
20%
25%
30%
Encouraging Downward Trend in Proportion of
Undesirable Resets
BlightSTAT March 29, 2011
13%
6%
13%
7%
0%
5%
10%
15%
12/27- 1/7 1/10- 1/21 1/24- 2/4 2/7- 2/18 2/21-3/4 3/7-3/18
Undesirable Resets
102813112529
Note: Includes all resets with the exception of those made because of Work in
Progress to the structure, the Property Owner is in a State-Run Housing
Rehabilitation Program, or there is a legal issue requiring a reset.
Source: Code Enforcement March 21, 201111

ABATEMENT & DISPOSITION
Code Enforcement Process Map
BlightSTAT March 29, 2011

1330
44
20
25
30
35
40
45
50
Reduction in Total Demolitions by Program
NORA
Strategic
Demolition
BlightSTAT March 29, 2011Source: NORA March 21, 2011 and Code Enforcement March 24, 2011
2
11
30 2
13
7
4
3
11
8
30
1
0
5
10
15
20
1/10- 1/21 1/24- 2/4 2/7- 2/18 2/21-3/4 3/7-3/18
Imminent
Danger

Code Enforcement Demolitions Program
BlightSTAT March 29, 2011
Note: Addresses not provided for the two properties demolished through
Imminent Danger of Collapse Program.
Source: NORA March 21, 2011 and Code Enforcement March 24, 2011

As of
3/1/2011
As of
3/21/2011Change
Total Strategic Demo Candidates** 580 589 9
Do Not Demolish 232 235 3
Candidates denied under historical review (SHPO, NCDC, HDLC) 64 53 -11
Change in Ownership 18 24 6
Strategic Demo Candidates Approved 266 277 11
Demolitions Completed by Contractor (Properties) 88 99 11
Demolitions Completed by Owner 30 31 1
Status of Strategic Demolition Program March 1, 2011 and March 21, 2011
BlightSTAT March 29, 2011
Demolitions Completed by Owner 30 31 1
Work in Process (City and Contractors) 166 147 -19
Returned to Code Enforcement 9 33 24
Demos on Hold by Contractor 10 13 3
Demos on Hold - Utilities 0 6 6
Demos in Process by Contractor 21 10 -11
Files under Review by SDER 58 26 -32
Law Department Review 10 40 30
Work In Process 40 19 -21
Total 580 589 9

Code Enforcement Department is
enforcing action with all remaining
residents of FEMA trailers.
42 cases will go to adjudication
hearing on March 28. Target is 50
cases at adjudicated hearing every
two weeks until cases are heard
BlightSTAT March 29, 2011Source: FEMA, March 22, 2011
two weeks until cases are heard
FEMA has notified all residents
that starting on May 1, 2011, they
will have to pay rent for living in
trailers.

Total Lot Clearings, March 7- March 18, 2011
BlightSTAT March 29, 2011
Total Lots
Cleared: 67
Lots in
Compliance: 7
Source: Code Enforcement, March 23, 2011

40
50
60
70
80
90Trend of Illegal Dumping Sites Cleared
Illegal
Dumping
Sites
Cleared
BlightSTAT March 29, 2011Source: Sanitation Department March 23, 2011
0
10
20
30
11/1-
11/12
11/15-
11/26
11/29 -
12/10
12/13-
12/24
12/27-
1/7
1/10-
1/21
1/24- 2/4 2/7- 2/18 2/21-3/4 3/7-3/18
Moving
average
35

178
202
287
245
200
250
300
350
Sheriff’s Sales Files Reviewed and Accepted
Target
Files
Reviewed
Files
BlightSTAT March 29, 2011Source: Law Department March 21, 2011
137
8677 79
43
84
12 11 13 17 13 1528
5771
60
0
50
100
150
11/1- 11/12 11/15- 11/26 11/29 -
12/10
12/13- 12/24 12/27- 1/7 1/10- 1/21 1/24- 2/4 2/7- 2/18 2/21-3/4 3/7-3/18
Files
Accepted
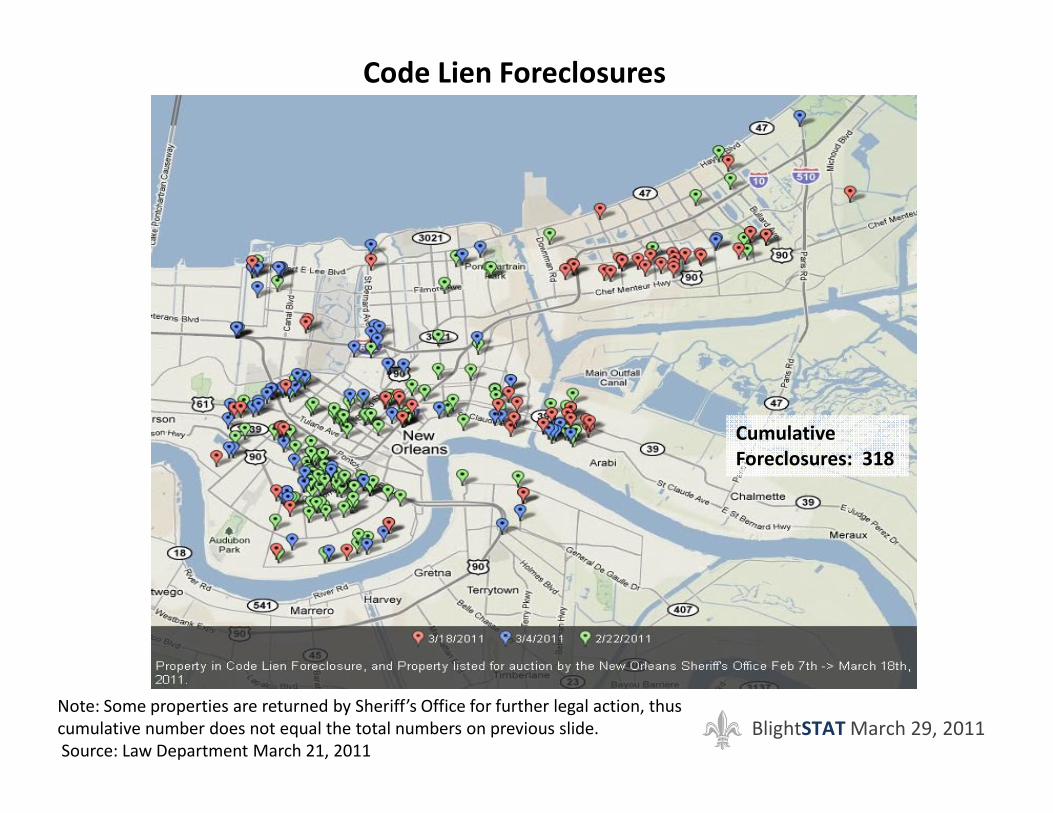
Code Lien Foreclosures
BlightSTAT March 29, 2011Note: Some properties are returned by Sheriff’s Office for further legal action, thus
cumulative number does not equal the total numbers on previous slide.
Source: Law Department March 21, 2011
Cumulative
Foreclosures: 318

50
60
70
80
90
100
NORA Total Closings down but Moving Average
remains above Target
Closings
Target
Moving
Average
BlightSTAT March 29, 2011Source: NORA (New Orleans Redevelopment Authority) March 22, 2011
0
10
20
30
40
1/10- 1/21 1/24- 2/4 2/7- 2/18 2/21-3/4 3/7-3/18
Total
NORA
Closings
25

11
15
10 0
3900
3910
3920
3930
3940
3950
NORA Inventory Reductions in Backlog
BlightSTAT March 29, 2011Note: Beginning Backlog minus Lot Next Door, Individual Sales, and
Development equals Ending Backlog
Source: NORA (New Orleans Redevelopment Authority) March 22, 2011
3904
3929
3850
3860
3870
3880
3890
Beginning 3/7/2011 New Closings Lot Next Door Individual Sales Development Ending 3/18/2011

20,000 13,000 1200 1000 1000
50%
60%
70%
80%
90%
100%
Blight Program Performance
Oct 2010- Mar 2011 vs End of Year 2011 Target
BlightSTAT March 29, 2011Source: Blight Strategy Report 9-30-2010
Bi-Weekly Blight Stat Meetings 10-1-2010 through 3-29-2011
11,242
3,340476 318 361
0%
10%
20%
30%
40%
Inspections Hearings Demolitions Code Lien
Foreclosures
NORA Closings

Evaluation Form
Are you a city employee or a member of the
public?
On a scale 1-5, how useful was this meeting to
you (1= least useful and 5= most useful)?
BlightSTAT March 29, 2011
you (1= least useful and 5= most useful)?
What’s working?
What’s not working?


