

Presented on AIAA/CEAS Aeroacoustics Conference Lyon 2016
1
Bodies in the flow: an analogy with rotating instability in
turbomachinery
Kameier, F. 1, Heinze, R.
2 and Biedermann, T.
3
Duesseldorf University of Applied Sciences, D-40476 Duesseldorf, Germany
Paschereit C.O.4
Berlin Technical University, D-10623 Berlin, Germany
The unsteady flow field in the blade tip region of axial flow machines can be neither
measured nor numerically calculated with all relevant details for noise generation and blade
vibration inception. The visualization of vortex structures to confirm the generation
mechanisms for sound and vibration in rotating machinery is difficult with respect to both
the geometrical and the temporal resolution. This article presents new results from very
basic experimental investigations and numerical simulations (URANS, predominantly in 2-
D) for considering an analogy between the rotating instability phenomena in axial
turbomachines and the flow over a cylinder with downstream interference bodies.
Suggestions about the physics involved in noise generation and amplification, as well as
details of flow-induced vibrations, will be given by using the example of the cylinder
configuration with an interference body placed downstream.
Nomenclature
cVortex
c
dCyl
fVortex
g
L
Lp
n
Re
Sr
= vortex propagation velocity
= flow velocity
= cylinder diameter
= vortex frequency
= cylinder-plate distance
= wave length
= plate length
= sound pressure level
= integer number
= Reynolds-Number, non-dimensional velocity
= Strouhal-number, non-dimensional frequency
I. Introduction
ownstream from cylinder in cross flow, a Kármán vortex street occurs: a regular, periodic shedding starts at a
Reynolds number range from 102 up to 10
7 with an average Strouhal number ( d/(2 U) of 0.21. This vortex
shedding can also cause an oscillation of the cylinder itself. With an additional interference body downstream from
the cylinder, noise and oscillation amplitude can be significantly increased. These effects are explained here in the
context of acoustic resonances and rotating instabilities in axial flow machines. In axial flow machines, a resonance
effect, with the blade pitch as the characteristic length, increases the noise level, and intensive blade vibrations, at a
blade eigenfrequency, are induced due to vortex shedding, whose circumferential mode number is equal to the
number of rotor blades.
A main goal of this work is to explain the active physical principle of the aerodynamic and acoustic
enhancement of the interference body together with its interaction from the downstream to the upstream flow
separation. In particular, the shape, the size, and the position of the interference body required for large oscillation
amplitudes and maximum increased noise emission will be explained. The starting point was the acoustical
1 Professor, Institute of Sound and Vibration Engineering ISAVE, Duesseldorf, [email protected].
2 Project Manager, getAir GmbH & Co. KG, D-41066 Mönchengladbach, [email protected].
3 Research Assistant and PhD Student, ISAVE, Duesseldorf, [email protected].
4 Professor, Chair of Fluid Dynamics, Müller-Breslau-Str.8, D-10623 Berlin, [email protected]
D

Presented on AIAA/CEAS Aeroacoustics Conference Lyon 2016
2
Figure 1. Schematic representation of vortex
separation from the blade tip, = blade pitch, with an
analogy to the cylinder-plate configuration.
Multi Stage High-Speed Compressor N2=83 % (Off-design conditions)
110
130
150
170
190
0 2000 4000 6000 8000 10000 12000 14000 16000
f [ Hz ]
Lp [dB]
1.BPF
2.BPF
RI
1.BPF + RI
1.BPF - RI
DLR Low-Speed Compressor n =1400 /min
(Point of maximum efficiency)
50
70
90
110
130
150
0 200 400 600 800 1000 1200
f [ Hz ]
Lp [dB]
1.BPF
2.BPF
RI
1.BPF + RI
1.BPF - RI
Figure 2. Pressure spectra at the casing wall,
upstream from the leading edge of the rotor; left
diagram: low-speed compressor (Kameier 1994); right
diagram: first stage of a multi-stage high-speed
compressor (Baumgartner et al. 1995).
amplification phenomenon. This investigation will show that the flow topology of the acoustical phenomenon is
completely different from the cause of the vibration effect. The increase of the flow-induced vibrations cannot be
explained with the acoustical phenomenon. The upstream reaction of the flow from the stagnation point is
responsible for the enhancement of the oscillation, which causes stabilization and maximization of the alternating
forces on the body in the flow.
II. The origin of the investigations on axial flow machines
Figure 1 presents the hypothesis of a large scaled
vortex wavelength in a blade pitch, which
generates tonal noise in an axial low-pressure
compressor (Kameier 1994, Kameier & Neise
1997). This phenomenon has also been explained
as “rotating instability”, due to the slipped rotation
of the vortex system in the circumferential
direction with the occurrence of Doppler
frequencies as sum and difference frequencies in
the source region. These characteristics occur both
in low-pressure ventilators and in high-pressure
compressors (Baumgartner et al. 1995) as well as
in steam turbines operating under ventilation
conditions (Truckenmüller 1999). In 2013, Zhang,
He & Stüer used the results of Truckenmüller to
perform further numerical simulation (3-D
URANS; Denton code, partly with 2-D
configurations). The modal characteristic was
found for the turbine stage in the ventilation
condition, but neither the complete structure of the
unsteady flow field nor the associated vortex and
separation topology could be reproduced; this will
now be explained in more detail. The similarity of
the wall pressure signatures of completely different
machines is shown in Figure 2, with a low-pressure
compressor on the left, n = 1400 rpm, and a high-
pressure compressor on the right, with n = 13200
rpm. Close to the half of the blade passing
frequency (BPF), a hump occurs that comprises
sum and difference frequencies. This is a typical
characteristic for slip conditions between the rotor
and the rotating unsteady flow structure. The high-
pressure compressor has blade vibration problems
in this operating range. The low-pressure
compressor generates high sound pressure levels
with a strong tonal component. Haukap (2006)
investigated the low-pressure compressor under
these aerodynamic conditions with unrealistically
smooth blades, to demonstrate the blade vibrations.
A few years later, at the Duesseldorf University of
Applies Science, a tonal aerodynamic noise
generator was found in a simple test configuration
that emitted sound spectra similar to the fan or
blower tip clearance noise. Winkler (2012)
investigated the cylinder-plate configuration, with a
focus on noise generation and noise amplitude amplification, in accordance with the wavelength hypothesis of
Kameier (1994) for axial fans. The observation of flow-induced vibrations with this configuration resulted in an
extensive investigation of the oscillation effects (Heinze 2015). These investigations were also driven by a

Presented on AIAA/CEAS Aeroacoustics Conference Lyon 2016
3
Figure 3. Periodical unsteady flow field inside the blade
passages of rotor 3, vorticity contours and perturbation velocity
vectors, near blade tip (r*=97.9%), design point; (Mailach
2007).
publication from the University of Michigan on energy harvesting with flow-induced vibration, termed VIVACE
(Bernitsas 2010, Raghavan 2007). It was assumed that the explanation for the acoustic amplification in a cylinder-
plate configuration could be used one-to-one for the vibrating system, similar to the explanation for blade vibrations
in high-pressure compressors (Baumgartner et al. 1995). The present work demonstrates that the acoustic
amplification and the vibration effect, more appropriately named a lock-in, have a completely different physical
background with respect to the visualized vortex topology.
Previously, the blade vibration problem was solved with a reduction of the aerodynamic blade loading in the
blade tip region. Further progress was achieved with the design of the so-called “Bladed integrated Disk = Blisk”,
i.e., fixed blades on the rotor disc. Such Blisk have been manufactured for several years for the front stages of high
speed compressors by milling from the solid block (Rolls Royce 2003). The predisposition for blade vibrations
changed completely with the Blisk technology and could be reduced significantly. The industrial interest in
understanding all of the reasons for the appearance of rotating instability did not continue after the investigations
reported by Haukap (2006).
In short Mailach et al. (2007)
describe the source mechanism of the
rotating instability as the periodical
pulsating tip clearance vortices. The very
meaningful films of Mailach (2007)
demonstrated more a periodic vortex
separation in the relative frame of
reference measured with the 2-D LDA in a
multi-stage low speed compressor (Fig. 3).
A survey of several completely different
interpretation of the rotating instability
origin are given by van Rennings (2015).
The flow over the blade tip in
circumferential direction is not responsible
for rotating instability. This can be
demonstrated with a shrouded impeller, for
a better understanding more explainations
will be given below in the conclusions of
this paper.
The upstream flow in the blade tip
region – its size in the radial direction is
larger than the clearance gap removes the vortex formation upstream from the rotor. A possible interpretation is that
the vortex forms a modal circumferential structure. The mode number corresponds to the number of blades and
generates tonal pressure fluctuations. The aerodynamic blade loading and the blade incidence are primarily
influenced by this return flow region. In the blade tip region, a radial zone exists whose flow is more or less only in
the circumferential direction. Truckenmüller’s turbine configuration under ventilation conditions, which was
simulated by Zhang, He & Stüer with URANS, shows these modal structures with a number of 19. Calculated with
the given frequency values for the rotating frame of reference (1870 Hz) and with the fixed frame of reference value
(2264 Hz), the mode number is 20 at a rotor speed of 210 Hz. The blade passing frequency of 12500 Hz indicates
that the rotor blade number of this turbine is 60. Division of the blade number by the mode number yields the factor
3, which represents a rotating instability with a wavelength of 3 blade passages or along 3 blades. A periodic
unsteady flow separation of one blade interacts and is in resonance with a blade three passages away, probably with
the blade’s leading edge in the return flow region of these ventilation conditions. It is possible that the flow
separation only occurs on each third blade, but this could not be clarified in the investigation of Zhang, He & Stüer
(2013). This process corresponds, from a demonstrative point of view, with the cylinder-plate configuration shown
in the present work with respect to both unsteady aerodynamics and oscillation.
III. State-of-the-art concerning interference effects
In the literature, the causes and effects, i.e., the influences of geometry and several other parameters, of the
complex flow topology for sound amplification with interference bodies in the flow has not been covered very
extensively. Additionally, for vortex-induced vibrations (VIV), a literature review does not reveal concrete
knowledge on why oscillation levels and the range of lock-in increases.
Presented on AIAA/CEAS Aeroacoustics Conference Lyon 2016
4
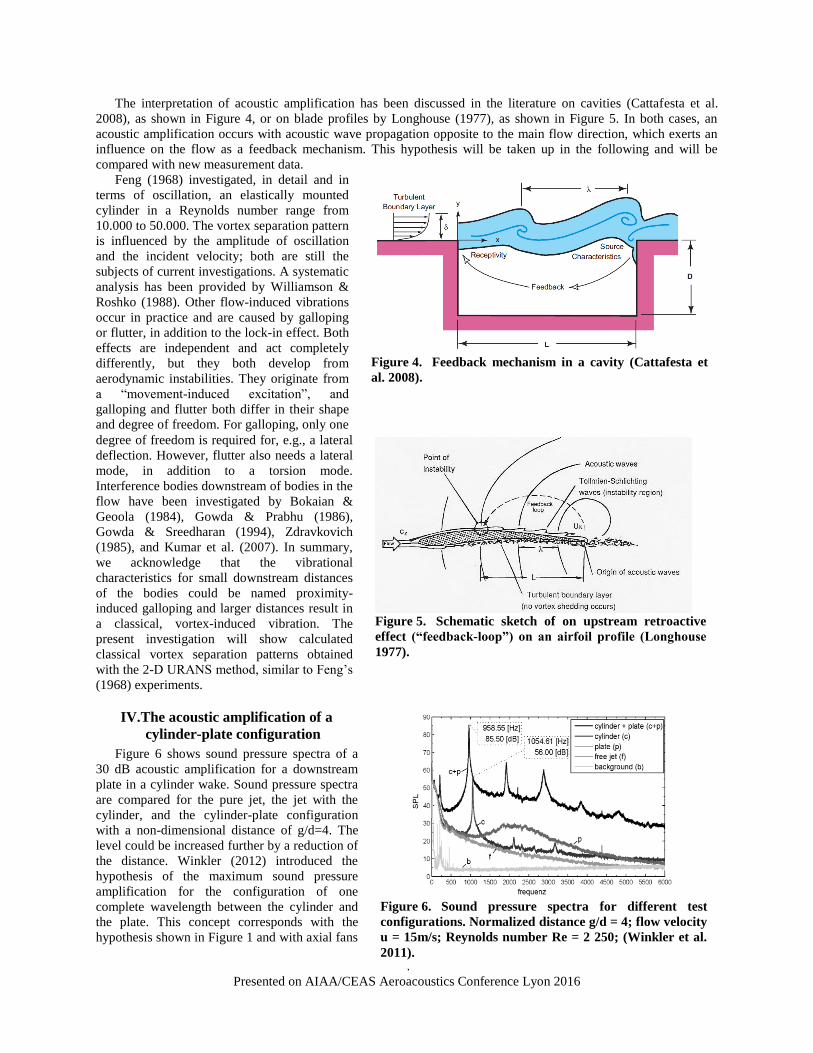
Figure 4. Feedback mechanism in a cavity (Cattafesta et
al. 2008).
Figure 5. Schematic sketch of on upstream retroactive
effect (“feedback-loop”) on an airfoil profile (Longhouse
1977).
Figure 6. Sound pressure spectra for different test
configurations. Normalized distance g/d = 4; flow velocity
u = 15m/s; Reynolds number Re = 2 250; (Winkler et al.
2011).
The interpretation of acoustic amplification has been discussed in the literature on cavities (Cattafesta et al.
2008), as shown in Figure 4, or on blade profiles by Longhouse (1977), as shown in Figure 5. In both cases, an
acoustic amplification occurs with acoustic wave propagation opposite to the main flow direction, which exerts an
influence on the flow as a feedback mechanism. This hypothesis will be taken up in the following and will be
compared with new measurement data.
Feng (1968) investigated, in detail and in
terms of oscillation, an elastically mounted
cylinder in a Reynolds number range from
10.000 to 50.000. The vortex separation pattern
is influenced by the amplitude of oscillation
and the incident velocity; both are still the
subjects of current investigations. A systematic
analysis has been provided by Williamson &
Roshko (1988). Other flow-induced vibrations
occur in practice and are caused by galloping
or flutter, in addition to the lock-in effect. Both
effects are independent and act completely
differently, but they both develop from
aerodynamic instabilities. They originate from
a “movement-induced excitation”, and
galloping and flutter both differ in their shape
and degree of freedom. For galloping, only one
degree of freedom is required for, e.g., a lateral
deflection. However, flutter also needs a lateral
mode, in addition to a torsion mode.
Interference bodies downstream of bodies in the
flow have been investigated by Bokaian &
Geoola (1984), Gowda & Prabhu (1986),
Gowda & Sreedharan (1994), Zdravkovich
(1985), and Kumar et al. (2007). In summary,
we acknowledge that the vibrational
characteristics for small downstream distances
of the bodies could be named proximity-
induced galloping and larger distances result in
a classical, vortex-induced vibration. The
present investigation will show calculated
classical vortex separation patterns obtained
with the 2-D URANS method, similar to Feng’s
(1968) experiments.
IV. The acoustic amplification of a
cylinder-plate configuration
Figure 6 shows sound pressure spectra of a
30 dB acoustic amplification for a downstream
plate in a cylinder wake. Sound pressure spectra
are compared for the pure jet, the jet with the
cylinder, and the cylinder-plate configuration
with a non-dimensional distance of g/d=4. The
level could be increased further by a reduction of
the distance. Winkler (2012) introduced the
hypothesis of the maximum sound pressure
amplification for the configuration of one
complete wavelength between the cylinder and
the plate. This concept corresponds with the
hypothesis shown in Figure 1 and with axial fans

Presented on AIAA/CEAS Aeroacoustics Conference Lyon 2016
5
Figure 7. Test stand “silent jet flow” in an anechoic
terminated room; front view of the jet outlet.
Cylinder with endplates
and Scruton volute
Plate Microphone
Figure 8. Sound pressure level at varying plate distances.
A correction of the change in distance to the plate’s
leading edge with a dipole property is also shown.
or blowers (Figure 2, left). The following
discussion will deal with the distance and the
aerodynamic wavelength in greater detail. Heinze
(2015) determined that, with the maximum sound
pressure amplification, a global instability or
acoustic resonance occurs. Just one wavelength
fits between the cylinder and plate, whereby the
impact of the vortex on the plate’s leading edge is
in the phase condition. The non-dimensional
distance g/d is reduced with increasing turbulence
intensity. Sound pressure amplification leads to an
increase in the Reynolds number and the plate
thickness. The reduction of the separation
frequency can be attributed to the increasing
influence of the two parameters. A reduction of
the separation frequency results in an increased
aerodynamic wavelength and an increased
distance between the bodies. This means that, for
axial machines, closely staggered rotor rows (compressors or high-pressure axial fans and blowers) are more
sensitive than rotor configurations with fewer blades, e.g., automotive cooling fans (Na et al. 2016).
Figure 7 shows the test stand used in the present
investigation of the acoustic amplification effect for
variable cylinder/plate distances. The maximum
sound pressure amplification occurs for integer
numbers of the aerodynamic wavelength between
the cylinder and the plate’s leading edge. The
aerodynamic wavelength is calculated by the vortex
transport velocity and the corresponding frequency.
The vortex transport velocity can be determined, in
accordance with the theory of Bendat & Piersol
(1980), from a phase spectrum (Figure 9) of signals
from two hot-wires located close to each other in
the direction of flow propagation.
In terms of physics, the largest sound pressure amplification occurs for one wavelength between the cylinder and
plate, because a short propagation time results in a high intensity of the impact on the plate. A comparison of the
three amplifications in the curve progression (Fig. 8) suggests that the first amplification already had a higher level
than that which was measured. In the experiment, the first amplification occurs with a negative gradient in the
progression shown in Figure 8. A theoretical sound pressure maximum may occur at a smaller distance; this
theoretical trend is shown as a dashed line. Additionally, with this assumption, a higher overall sound pressure level
would occur than the one with two wavelengths between the bodies in the flow. Generally, the amplification
phenomenon of the sound pressure caused by adding a plate can be explained as a phase condition of an acoustic
resonance or, alternatively, as a global instability and therefore, in accordance with the hypotheses of Longhouse
(Fig. 4) and Cattafesta (Fig. 5), as a feedback mechanism with a similar chain of reactions for a cavity and an airfoil
profile:
1. The separated shear flow of the upstream edge impinges on the trailing edge of the cavity. Pressure
fluctuations arise with the impact. They propagate upstream in the direction of the leading edge.
According to the theory of Longhouse, Tollmien-Schlichting waves are responsible for the flow around
the airfoil and the trailing edge reflects them.
2. Stronger flow instabilities are separated by the feedback from downstream to upstream in the direction of
the trailing edge.
3. The amplification of the instabilities increases progressively and it induces the formation of vortex
structures that are further strengthened by viscosity effects and convective transport.
4. This vortex formation impacts continuously on the trailing edge (only for the cavity) and induces pressure
disturbances that are propagated upstream to close the circuit of the feedback mechanism.

Presented on AIAA/CEAS Aeroacoustics Conference Lyon 2016
6
Figure 9. (a) Spectrum of the velocity fluctuation
(CFD with two monitor points) (b); Phase of the
cross-spectrum between these two monitor points and
the linear phase shift in the range of the vortex
separation frequency.
0 500 1000 1500 2000 2500 3000 3500 4000
10-4
10-3
10-2
10-1
100
101
f [Hz]
u´2
[m
2/s
2]
0 500 1000 1500 2000 2500 3000 3500 40000
0.1
0.2
0.3
0.4
0.5
0.6
0.7
0.8
0.9
1
f [Hz]
co
he
ren
ce
0 500 1000 1500 2000 2500 3000 3500 4000-200
-150
-100
-50
0
50
100
150
200
f [Hz]
f[°]
There is an essential difference between a cavity
and the cylinder-plate configuration: the acoustic
event of a cavity only exists with exactly one or an
integer multiple of the wavelength. A specific event
occurs only under exactly these conditions. In
contrast, the cylinder-plate configuration always
results in a specific tone whose intensity differs due
to the continuous vortex separation and the
interaction with the plate’s leading edge. A tone
occurs if a minimum distance between cylinder and
plate is exceeded. If the plate is too close to the
cylinder, it functions like a splitter plate and the
vortex separation is eliminated.
From the results of Biedermann (2014), the
amplification distance and the corresponding
separation frequency for n = 1 … 3 cylinder
diameters is known. The convective transport
velocity of the vortex propagation can be calculated
with
𝑐𝑉𝑜𝑟𝑡𝑒𝑥 =𝑔
𝑑∙ 𝑓𝑉𝑜𝑟𝑡𝑒𝑥 ∙ 𝑑𝐶𝑦𝑙 ∙
1
𝑛
For the three detected maximal sound pressure
levels of Figure 8, with an incident velocity of
20 m/s, the non-dimensional convective vortex
velocity is:
c_(Vortex,norm_1)= 0.46,
with f_Vortex = 1100 Hz,
c_(Vortex,norm_2 )= 0.52,
with f_Vortex = 1228 Hz,
c_(Vortex,norm_3)= 0.55,
with f_Vortex = 1284 Hz.
These results show that the vortex formation is
slowly accelerated by the mean flow as the plate
distance increases. In other words, it approaches the
Strouhal relation of Sr = 0.21 for a Kármán vortex
street.
Numerical simulations confirm the wavelength
hypothesis qualitatively. With the fitted wavelength
between the cylinder and the plate, the pressure
fluctuation reaches high levels. In order to make
interpretations with the Q-criterion possible
(Kameier et al. 2009), 2-D simulations (URANS)
were then performed (Fig. 10). 3-D calculations are
often not clear enough for interpretation of the vortex
structures; cf. Figure 11. A clear definition of the wavelength is already difficult for the 2-D simulation case. The
question is how to determine the start of the wavelength: at the separation point at 85° of the cylinder axis, as in
Figure 12, or only between the cylinder and the plate, as in Figure 10.
The numerical simulation shows a strong deviation of the vortex intensity with increasing distances between the
cylinder and the plate, as shown in Figure 13 with the Q-criterion. Figures 14 and 15, finally, show the influence of
plate thickness and plate length on amplification. A thin plate results in a strong amplification of the sound pressure
level. Furthermore, with a very short plate, there is no amplification and lengthening over a certain limit also does
not lead to amplification; cf. Figure 15.

Presented on AIAA/CEAS Aeroacoustics Conference Lyon 2016
7
Figure 10. Exemplary result of a 2-D URANS
calculation with a display of the Q-criterion,
cylinder/plate configuration, dCyl = 3 mm, c_∞= 15 m/s,
Re=35000.
Figure 11. 3-D URANS calculations show a non-
interpretable vortex structure displayed with the Q-
criterion.
Figure 12. Potential start of the vortex
wavelength.
Figure 13. Example of a 2-D URANS simulation, of a
cylinder-plate configuration, dCyl=3 mm, c_∞= 15 m/s; Q-
criterion is shown.
Vortex decrease
Figure 15. Sound pressure level versus plate
length g/d=max. Lp, c_∞= 29 m/s; (Biedermann
2014).
92
94
96
98
100
102
104
0 5 10 15
Lp [
dB
]
lplate [mm]
Figure 14. Sound pressure level versus plate
thickness, g/d=max. Lp, c_∞= 16 m/s;
(Biedermann 2014).
82
83
84
85
86
87
88
0 2 4 6
Lp [
dB
]
d [mm]

Presented on AIAA/CEAS Aeroacoustics Conference Lyon 2016
8
Figure 16. Scheme of the test set-up for the elastically mounted cylinder..
Wind tunnel
Ø = 600 mm
x
y
z
Spring
Cylinder
Ø = 75 mm
Figure 17. Test set-up of the elastically mounted cylinder in the wind tunnel.
V. Interference effects concerning vibration with cylinder-ashlar configurations
A cylinder mounted with 4 springs in the wind tunnel forms an elastic system with an individual vibrational
eigenfrequency (Fig. 16 and 17). The body in the wake is fixed. These investigations were carried out in an open
wind tunnel for flow velocities up to 20 m/s or Reynolds numbers up to 100000.
For an elastically mounted cylinder in the flow, it is well known that the region of oscillation is restricted to a
small range of the flow velocity. The vortex separation frequency has to be the same as the eigenfrequency of the
system; this is named a lock-in condition (Fig. 18). With a body in the wake of the cylinder, this region of induced
vibration can be enlarged and it results in much higher amplitudes that can increase by up to 30 % (Fig. 18).

Presented on AIAA/CEAS Aeroacoustics Conference Lyon 2016
9
Figure 18. Investigation of the oscillation amplitude versus flow velocity by varying the distance
between cylinder and ashlar.
0,0
0,2
0,4
0,6
0,8
4 6 8 10 12 14 16 18 20 22
A/d
vr (=v/fndCyl)
Cylinder g/d = 8.0
g/d = 4.0 g/d = 2.0
g/d = 1.6 g/d = 1.2
g/d = 1.0 g/d= 0.8
g/d = 0.5 g/d = 0.1
Figure 19. Flow around the cylinder, dCyl = 75 mm, Re = 52632 (on the left) and Re = 78947 (on
the right), on top without the ashlar as an interference body, on the bottom with the ashlar, g/dCyl =
1, non-dimensional velocity vectors from PIV measurements; (Wahl 2013).

Presented on AIAA/CEAS Aeroacoustics Conference Lyon 2016
10
Figure 20. PIV measurements for the conditions of the
smallest separation angle versus incident velocity,
cylinder/ashlar g/dZyl = 1.0 (gray), cylinder(black).
73
75
77
79
81
83
85
87
89
0 5 10 15 20
φ
vr (=v/fndCyl)
PIV-Measurement -- Cylinder
PIV-Measurement -- g/d=1
Figure 21. Determination of the point of separation,
principle procedure to show the first negative velocity
component that occurred on the cylinder surface; 2-D
simulation.
Point of flow separation
Figure 22. Comparison of PIV measurements and numerical simulation of the separation angle for
the cylinder/ashlar configuration; Re = 49.000.
The influence of the body in the wake on
the separation mechanism on the cylinder
surface was investigated with PIV
measurements on a non-vibrating cylinder, to
explain this phenomenology. Figure 19 shows
non-dimensional velocity vectors calculated
with the averaged incident velocity. It is
evident that the wake body increases the
widening of the stream lines in the area
downstream from the cylinder. The turbulent
mixture in the wake region also increases in the
configuration with the interference body and,
within this region, higher velocity components
occur. Quantifying the exact separation angle as
a function of the Reynolds number with and
without the interference body yields the
signatures that are shown in Figure 20. The
distance g/d=1 has been chosen to investigate a
separation angle that is as small as possible.
Even smaller distances would have limited the
size of the region for this flow visualization
with the PIV system. The non-dimensional
distance was investigated for g/d from 1 up to
8. The investigation under the vibration
condition has been realized for a non-
dimensional distance as far as g/d = 0.1. It is
shown that, for increasing incident velocities,
the separation point moves downstream in the
measurements without the interference body in
the wake. With an ashlar in the cylinder wake,
the signature changes significantly. Within the
region of 40000<Re<60000, an abrupt decline
of the separation angle occurs, down to 76° –
the lowest value recorded to date. From the
perspective of vibration, this reduction results
in a kind of stabilization of the oscillating
system.
For the comparison of the PIV
measurements with 2-D URANS simulations, the first occurrence of a negative velocity component was used for the
definition of the position of the separation point on the cylinder surface (Fig. 21).

Presented on AIAA/CEAS Aeroacoustics Conference Lyon 2016
11
Figure 23. 2-D URANS simulation of the flow separation with fixed bodies without oscillation
visualized by the Q-criterion; cylinder/ashlar configuration at g/dCyl = 0.8.
cylinder -a- cylinder/ashlar -e-
Separation gradient
Opposite rotating vortex
cuts main vortex
Intermediate vortex
destroys separation
Upper
vortex
cropped by
lower one
cylinder -b- -f-
cylinder -c-
cylinder -d-
-g-
-h-
Separation gradient
The signatures of the numerically calculated separation angles shown in Figure 22 lie above the experimental
results, because of the 2-D simulation. In 3-D simulations calculated with a laminar-to-turbulent transition model,
the measured and numerically calculated signatures can move closer together. These calculations have not been
performed for the complete parameter variation, due to the long calculation time required. Heinze (2015) has shown
that the force expression does not change from a 2-D to the transition model and a 3-D calculation. The extensive
evaluation in 2-D demonstrates the vortex topology precisely enough for a qualitative analysis. As shown in Figure
11, a demonstrative interpretation of the vortex formation is nearly impossible for the 3-D case.
The topology of the vortex formation with and without the interference body is shown step by step in Figure 23
(2-D URANS simulation). On the left, the cylinder without an interference body in the wake is shown (Figs. a, b, c,
d). It is obvious that the ashlar functions as a flow barrier that compresses the main upstream vortex. This main
vortex is located next to the cylinder, shown in (e), and is caused by the shear flow of the boundary layer interacting
with this main vortex. This generates a new, smaller vortex on the right (f, g). This “intermediate” vortex has an
opposite rotational direction and it cuts or separates the main vortex from the cylinder surface. Subsequently, the
main vortex propagates in the direction of the cylinder’s lower surface and, after it reaches a certain distance (h in
Fig, 23), it attracts the next emerging main vortex from the cylinder’s lower surface.

Presented on AIAA/CEAS Aeroacoustics Conference Lyon 2016
12
Figure 24. Comparison of the vortex separation pattern for cylinder/ashlar and cylinder. With the
ashlar, the maximum lift conditions are displayed; at the top, Q-criterion, in the middle, velocity, at the
bottom, pressure distributions are shown.
p+
shear flow angle shear flow angle
In a next step, FSI simulations with a moving mesh were carried out. In Figure 24, the Q-criterion, the magnitude
of the velocity, and the pressure show the difference between the configurations with a moving cylinder in the flow:
on the left side with, and on the right side without, an interference body in the cylinder wake. With the ashlar in the
wake of the cylinder, a much steeper shear flow angle is visible on the cylinder surface. Finally, this causes a more
intensive and amplified oscillation. The ashlar has a clear upstream effect on the vortex formation, caused by the
separation process at the cylinder surface that has been designated as p+ in Figure 24, bottom left.
In order to explain the amplification mechanism of the cylinder-ashlar configuration as descriptively and
precisely as possible, several findings from the numerical simulations and the experimental results make it possible
to state the following (c.f. Heinze 2015), whereby E represents experimental origin and S simulation origin:
a) E+S: As soon as the vortex separation frequency corresponds with the eigenfrequency of the elastic
cylinder system, the cylinder will oscillate. Possibly, a lock-in effect can be observed, i.e., the
oscillation level increases over a specific range, despite the further increase of the flow velocity. This
range of the flow velocity is characterized by a non-valid Strouhal expression (Sr = 0.21); instead, it is a
relatively stable oscillation of the cylinder with the system’s eigenfrequency.
b) E+S: Ashlar distances smaller than g/dCyl = 4.0 amplify the cylinder oscillation. The amplification
relates to the amplitude as well as to the range of the reduced velocity with lock-in conditions.
c) E: Beginning with the critical ashlar distance of g/dCyl = 0.1 and g/dCyl < 0.5, the amplification
converts to a damping.

Presented on AIAA/CEAS Aeroacoustics Conference Lyon 2016
13
d) E: There is a significant influence that depends on whether the flow velocity increases or decreases (in
the present documentation, the hysteresis effect is not been discussed; cf. Winkler (2012) or Heinze
(2015) for further information). The history of the oscillation is relevant. Amplitude and lock-in range
show their maximum by an acceleration in speed.
e) E: Investigations starting with a non-oscillating cylinder have shown that the cylinder in the wake,
especially for g/dCyl = 1.0, has a positive effect on the maximum of amplitude. For example, a
configuration without the ashlar has a much smaller amplitude when the speed increases.
f) S+E: The maximum of the lift coefficient is approx. 2 for both configurations with and without an
interference body. With the interference body, the amplitude and the range of lock-in increases.
g) S: The vortex formations will be structured in a specific way when the ashlar is located in the cylinder
wake. They move in the gap between cylinder and interference body (plate); this causes slow changes
of the separation structure with increasing flow velocity or increasing oscillation amplitude. This also
results in a stabilization of the phase shift between lift force and the movement of the cylinder.
h) S: For the case of a cylinder-ashlar configuration, the lift coefficient decreases slowly with an increase
in flow speed, because the relationship of high and low pressure on the cylinder surface makes the
oscillation more intensive.
VI. Conclusion
In order to elucidate the basic principles of noise generation in the blade tip region and for a fundamental
explanation of flow-induced vibration in axial flow machines, extensive experiments, several simple numerical
simulation (URANS), and manageable FSI investigations were performed. The analogy of a cylinder-plate or a
cylinder-ashlar configuration for axial flow machines is given by a wavelength that is calculated with the convective
vortex transport velocity.
The acoustic amplification effect can be explained by the wavelength hypothesis in the following way: If integer
number multiples of the wavelength are fitted between the cylinder and the body in the wake, the sound radiation is
amplified significantly – the flow separation point on the cylinder surface has to be calculated as the start of the
wavelength. A thin plate as a wake body results in particularly high sound pressure fluctuations with a minimum
length similar to those in high-pressure axial fans or blowers. If the plate length exceeds a certain limit, the noise
amplification does not continue. The plate has to be thin for the distinct acoustic amplification, whereby it should
not be thinner than a certain limit. The leading edge cannot generate a fluctuating pressure field for a very thin plate.
It is assumed that this effect has an analogy with the tip clearance noise of axial flow machines.
Previous numerical investigations with sufficiently high resolution in time and space have not been carried out
for flow machines. This could be due to their high complexity and the limited prospect of the interpretation options
for such 3-D calculations. Generally, 3-D effects cover vortex formations that are clearly visible and interpretable
with 2-D calculations.
The greatest vibration enhancement of an elastic mounted cylinder occurs with a rectangular body in the
dimensions of the upstream cylinder. The body in the wake of the cylinder influences the vortex separation on the
surface of the cylinder. The point of separation is shifted upstream, which has a positive effect on the cylinder
movement. Beyond the amplification (up to 30%), the body in the wake enlarges the incident velocity region within
which the cylinder is subjected to lock-in conditions. Also for the oscillating system of the cylinder-ashlar
configuration, there is an analogy with the blade vibration in axial flow machines under lock-in conditions caused by
vortex separation.
However, the vortex topology of a vibration induction is generally different from the vortex formation that
causes noise or noise amplification (acoustic resonance). In the present investigation, this was indicated by 2-D
URANS calculations: the vibration or oscillation effect changes with the upstream influence from the vortex
separation of the interference body. This is mostly relevant for highly staggered bodies or blade rows. The
convective vortex velocity causes resonance and sound pressure amplification when there is a match between the
aerodynamic wavelength and the distance between the interference bodies or between two rotor blades in the tip
region of an axial machine.
There undoubtedly exists an up-rolled vortex (gap or bag vortex) in the blade tip region of an axial flow
machine; cf. 3-D URANS simulations, Q-criterion and meridional component of the velocity in Fig. 25, (Na et al.
2016). This vortex cannot be responsible for the rotating instability or the tip clearance noise because it does not
occur with a shrouded rotor; cf. Fig. 26: 3-D URANS simulations, Q-criterion and meridional component of the
velocity, (Na et al. 2016).

Presented on AIAA/CEAS Aeroacoustics Conference Lyon 2016
14
Figure 26. 3-D URANS, Q-criterion and
meridional component of the velocity,
shrouded configuration, vortex structure in
and upstream of the blade passage (Na et al.
2016).
Figure 25. Q-criterion and the meridional
component of the velocity, formation of the blade
tip vortex that is not responsible for rotating
instability, non-shrouded configuration (Na et al.
2016).
Figure 27. Observed near-field characteristics for various blade loadings at 1800 1/min: Averaged auto
power spectra are measured both for the standard rotor (left) as well as for the shrouded rotor configuration
(right); (Pardowitz 2015).
Figure 28. Incidence in the blade tip
region that results in periodic vortex
separation – shown in analogy to a
cylinder-plate configuration with an axial
blade row.
w
u
The rotating instabilities shown in Figure 2 will not be
reduced by a shroud on the blade tip. This was experimentally
proven by Padowitz et al. in 2015 and by Kameier in 1994; cf.
Fig. 27. In an axial flow machine, the effects of an existing
rotating instability will probably be dominated by a return flow
opposite to the meridional velocity component; cf. Fig. 28. Figure
28 shows only one compressor blade row – the corresponding
configuration also exists in turbine blade rows under ventilation
conditions. The flow around the aerodynamic profile is in
accordance with a high aerodynamic load on the blade and the
separation of a vortex system from the suction side, caused by an
angle of incidence that is too large. The vortex system is
transported upstream of the rotor where it forms a circumferential
mode structure that interacts with the rotor, in accordance with the
theory of Tyler und Sofrin (1962). The vortex separation is seen
in analogy to the cylinder-plate interaction shown in Figure 28.
For a precise numerical visualization of the 3-D vortex
system, further investigations are necessary. Only numerical
results allow a demonstrative insight and will provide more
knowledge about the complete generation mechanism of rotating
instabilities in axial flow machines.

Presented on AIAA/CEAS Aeroacoustics Conference Lyon 2016
15
References
Baumgartner M., Kameier F., Hourmouziadis J.: Non-Engine Order Blade Vibration in a High-Pressure
Compressor. ISABE, Melbourne, Australia, 1995.
Bendat, J. S., Piersol, A. G.: Engineering applications of correlation and spectral analysis, New York, 1980.
Bernitsas, M., Fluid passing over objects can set up vorticities, vortex power, Mechanical Engineering, ASME
4/2010.
Biedermann, T., Aeroakustische Untersuchung einer Zylinder/Platte-Konfiguration unter Verwendung der
statistischen Design-of-Experiments-Methodik, B.Thesis, Duesseldorf University of Applied Sciences, 2014.
Bokaian, A., Geoola, F., Proximity-induced galloping of two interfering circu-lar cylinders, J. Fluid Mech., Britain,
Vol. 146: S. 417-449, 1984.
Cattafesta, L.N., Song, Q., Williams, D.R., Rowley, C.W., Calvi, F.S.: Active Control of Flow-Induced Cavity
Oscillations. Progress in Aerospace Sciences, No. 44, Page 479–502, 2008.
Gowda Lakshmana, B.H., Deshkulkarni, K.P., Interference effects on the flow induced vibrations of a circular
cylinder in side-by-side and staggered arrangement, Journal of Sound and Vibration, 122(3): S. 465-478, 1986.
Gowda Lakshmana, B.H., Some measurements on the phenomenom of vortex shedding and induced vibrations of
circular cylinders, Institut für Thermo- und Fluiddynamik, TU Berlin, Rep. DLR-FB 75-01, 1975.
Gowda Lakshmana, B.H., Prabhu, D.R., Interference effects on the flow- induced vibrations of a circular cylinder.
Journal of Sound and Vibration, 112(3): S. 487-502, 1986.
Gowda Lakshmana, B.H., Sreedharan, V., Flow- induced oscillations of a circular cylinder due to interference
effects. Journal of Sound and Vibration, 176(4): S. 497-514, 1994.
Haukap, C., Zur Korrelation von Schaufelschwingungen und rotierenden Strömungsphänomenen in
Axialverdichtern, PhD-Thesis, Munich Technical University, 2006.
Heinze, R., Experimentelle und numerische Untersuchung von Interferenzeffekten bei Zylinderumströmungen, PhD-
Thesis, Berlin Technical University, 2015.
Kameier F.: Experimentelle Untersuchungen zur Entstehung und Minderung des Blattspitzen–Wirbellärms axialer
Strömungsmaschinen. PhD-Thesis, VDI Reihe 7 Nr. 342, VDI–Verlag, Düsseldorf, 1994.
Kameier, F., Neise, W., Rotating Blade Flow Instability as a Source of Noise in Axial Turbomachines, Journal of
Sound and Vibration, 203 (5), p.833-853, 1997.
Kameier, F., Horvat, I., Wagner, T., Ullrich, F., Experimental and numerical investigation of the air dam
aeroacoustics, ATZ, p.55-59 Volume 111, 07-08, 2009.
Kumar, A.R., GOWDA, B.H.L., Sohn, C.H,, Interference excitation of a square section cylinder, Journal of
Mechanical Science and Technology, 22, 599-607, 2007.
Longhouse, R.E., Vortex shedding noise of low tip speed, axial flow fans, Journal of Sound and Vibration, 53(1),
25-46, 1977.
Mailach, R., Lehmann, I., Vogeler, K., Periodical unsteady flow within a rotor blade row of an axial compressor –
Part II: Wake – tip clearance vortex interaction, Proceedings of ASME Turbo Expo, GT2007-2711, 2007
Mailach, R. Movies of the timeresolved flow field within the third rotor blade row of the four-stage Dresden Low-
Speed Research Compressor, two-component Laser-Doppler-Anemometer measurements, private communication,
2007.
Na, G., Springer, N., Mauß, M., Kameier, F., Numerical Simulations of unsteady aerodynamic effects in the blade
tip region of cooling fans, ASME Turbo Expo GT2016-57786, Seoul, South Korea, 2016.
Pardowitz, B., Moreau, A., Tapken, U., Enghardt, L., Experimental identification of rotating instability of an axial
fan with shrouded rotor, J Power and Energy, Vol. 229(5) 520–528, 2015.
Raghavan, K., Energy Extraction from a Steady Flow Using Vortex Induced Vibration. In: Dissertation, University
of Michigan, 2007.

Presented on AIAA/CEAS Aeroacoustics Conference Lyon 2016
16
Rennings, Ruben van, Numerical simulation and modelling of sound generated by rotating instabilities in an annular
compressor cascade, PhD-Thesis, Berlin Technical University, 2015.
Rolls-Royce plc, Rolls-Royce has produced its first Lift Fan BLISK, March 31, 2003.
Truckenmueller F., Gerschuetz W., Stetter H., Hosenfeld H.-G.: Examination of the dynamic stress in the moving
blades of the last stage in a low-pressure model turbine during windage. C557/024/99, pp 757-768, ImechE, London,
1999.
Tyler, J.M., Sofrin, T.G.:Axial flow compressor noise studies, SAE Transaction 70, S.309-332, 1962.
Wahl, T., Simulation und experimentelle Untersuchung von Fluid-Struktur-Interaktionen am Beispiel der
Umströmung eines Zylinders sowie einer Zylinder/Quader-Konfiguration, Master-Thesis, Duesseldorf University of
Applied Sciences, 2013.
Winkler, M., Becker K., Doolan,C., Kameier, F., Paschereit, C.O., Aeroacoustic effects of a cylinder/plate-
configuration, AIAA Journal, Volume 50, No.7, 1614-1620, 2011.
Winkler, M.M.: Experimentelle Untersuchung aeroakustischer und strukturdynamischer Effekte an einer
Zylinder/Platte-Konfiguration. PhD-Thesis, Berlin Technical University, 2012.
Zhang, L.Y., He, L., Stüer, H., A Numerical Investigation of Rotating Instability in Steam Turbine Last Stage,
Journal of Turbomachinery, Vol. 135, Jan. 2013.
Zdravkovich, M.M., Flow induced oscillations of two interfering circular cylinders, Journal of Sound and Vibration,
101(4), S. 511-521, 1985.


