
March 2017 Cambridge Community Foundation 1
Boomtown/HometownWhat the numbers say about income, housing
and education in Cambridge today
March 2017 Report

2 Boomtown/Hometown
About Cambridge Community FoundationCambridge Community Foundation is committed to the
power of philanthropy and civic leadership. Sparked into
existence by a visionary gift in 1916, this public charity,
the only foundation with all of Cambridge in its purview,
has grown through the generosity of donors who seek
to make a difference in people’s lives.
In return the Foundation has developed as a grantmaker,
providing well over $1 million annually to nonprofit
organizations serving the people of Cambridge. In addition,
it has expanded through the years as a civic leader, a
convener and a catalyst for change.
In all it does, the Foundation seeks to connect people,
knowledge and resources to realize a vibrant, diverse
and inclusive Cambridge with a culture of giving and
opportunity for all.
As a civic leader and as a grantmaker, the Foundation seeks
to nurture strong families through programs that support
early childhood and promote ideas of equality, and to honor
the arts and the spirit of innovation they fuel.
The Possible Project works to resolve the opportunity gap by
preparing students to succeed in the 21st century innovation economy.
The Cambridge-based organization taps the power of entrepreneurship
to inspire students to achieve, using mentors and a focus on meaningful
employment and fulfilling careers. (Photo provided by The Possible Project)
Cover photos provided by Cambridge Nonprofit Coalition

1
Preface 2
CHAPTER ONE: Twenty Thousand Cups of Coffee 4
CHAPTER TWO: The People’s City 9
CHAPTER THREE: The Downside of the Upside 11
Where Do We Go from Here? 24
Boomtown/HometownWhat the numbers say about income, housing and education in Cambridge today
Principal Writers, Patricia Brady, Geeta Pradhan
Project Director, Keri-Nicole Dillman, PhD
Data Partners, Metropolitan Area Planning Council (MAPC), City of Cambridge
Design, One Visual Mind
March 2017 Report

2 Boomtown/Hometown
The city of Cambridge has arrived at a critical moment in
its long and celebrated history. The community we value—
for its richness and variety, its commitment to the life of the
mind, its compassionate and egalitarian political vision, and
its spirit of openness—faces new challenges.
Like many cities, Cambridge today is experiencing devel-
opments that are transforming the way Americans work
and live. A recent Brookings Institution report describes the
“rise of urban innovation hubs,” the result of profound eco-
nomic and demographic forces that thrive on the “proximity
and density” that cities have historically offered. It is in such
environments that new ideas are generated, exchanged,
altered and transformed into new products and new ways
of thinking. What is new is that people are not only working
but living in and around these hubs, as “the growing pref-
erence of young talented workers to congregate in vibrant
neighborhoods that offer choices in housing, transporta-
tion and amenities has made urban and urbanizing areas
increasingly attractive.”1
These trends pulsate through our city’s physical and
economic infrastructure as old neighborhoods take on new
identities and change the face of the city. Cambridge is one
of the hot spots of the nation’s innovation economy, and
like other hubs of innovation across the river and around
the country, its popularity and appeal contribute to rising
rents and housing prices. Long-time Cambridge residents
wonder if the children they raised here can afford to stay
as adults. What does this mean for our community?
Cambridge is a racially, ethnically and economically
diverse city—full of students, young working people,
working-class families, entrepreneurs, inventors, tech-
nology experts, college professors, researchers, artists,
writers, small business owners, immigrants, CEOs of
major corporations, and social activists—a lively mix that
yields a unique cultural environment. As our city’s booming
economy creates new wealth and exacerbates existing
social distances between members of the community,
Preface
1 Bruce Katz and Julie Wagner, The Rise of Innovation Districts: A New Geography of Innovation in America (Washington, D.C.: Metropolitan Policy Program, Brookings Institution, 2014).
Photo
provid
ed b
y Ag
enda fo
r Child
ren
Cambridge’s Agenda For Children weaves adults who work with young people in Cambridge into a literal network of caregivers.

March 2017 Cambridge Community Foundation 3
will this rich combination of backgrounds and perspectives survive? Will Cambridge continue to be the vital and interesting place valued by so many members of its community? Will it remain a city known for its compassion and its commitment to diversity? Or will Cambridge become a city that is less varied, less vital, less special?
Cambridge must answer these questions.
We are convinced at the Cambridge Community Founda-
tion that the future is not a set of inevitabilities but a set
of decisions, of choices made by thoughtful individuals.
It is our belief that, with its economic resources, its intellec-
tual capacity, its compassion, and its historic concern with
the human individual, Cambridge can find ways to tackle
the increasing inequality and inequities—the downside
of a brilliantly successful economic upside—and develop
new ways to share the prosperity of the present moment
among all members of our community.
For a century the Cambridge Community Foundation,
which includes in its purview the well-being of the entire
city, has quietly supported those most in need through
thousands of grants to nonprofit organizations providing
assistance for young children, youth, seniors, and those
struggling with homelessness, hunger and food security,
while also supplying nourishment for the city’s arts and
culture. Through its work with so many organizations so
close to the pulse of the community, the Foundation has
gained a citywide perspective that can be of value in
dealing with today’s problems.
That is why we now call together Cambridge leaders,
thinkers, community-based organizations, and concerned
individuals to take a hard look at where we are today and
how we got here, to share our insights and our experience,
and to think together about how we can shape a future that
matches our traditions, our ideals and our hopes.
This report represents a snapshot of specific aspects
of our city at the present time: aspects that reflect our
strengths, our challenges, and the reasons we need to
act now if we are to move in the direction of our dreams.
It establishes an initial set of indicators that define our
current status and can help us to shape our future.
Cambridge is at an inflection point, a moment when the
energy driving our economy toward greater heights is in full
swing—and when the bonds that unite our community are
being stretched. We must act, and act now. We ask you to
join a conversation that will guide our future; we offer this
report as a foundation for reflection and reaction.
Today’s booming economy is changing Cambridge. Will the city find creative ways to share its new prosperity among all members of the community? Will Cambridge remain a city known for compassion, openness and diversity?
4 Boomtown/Hometown
CHAPTER ONE:Twenty Thousand Cups of Coffee
2 Michelle Jamrisko and Wei Lu, “Here are The Most Innovative States in America,” Bloomberg Markets, January 7, 2016. 3 U.S. Census Bureau, American Community Survey, 2011-2015 Five-Year Estimates.4 “Analysis of U.S. Census Bureau’s 2015 MCD-Level Population Estimates,” MassBenchmarks, published May 5, 2017, http://www.massbenchmarks.org/stateda-
ta/news.htm.5 MAPC analysis of Executive Office of Labor and Workforce Development data, 2015.6 Richard Florida and Karen King, Rise of The Urban Startup Neighborhood: Mapping Micro-Clusters of Venture Capital-Backed Startups (Toronto, Ontario: Martin
Prosperity Institute, 2016). 7 Cambridge Innovation Center, website, http://www.cic.us.
Once known for mills, museums and transcendentalism,
Massachusetts today is famed for its rapidly growing
and hugely successful innovation economy. The state
has become one of the principal places on earth where
the future is being imagined, researched, developed and
exported. A Bloomberg survey in 2016 ranked the state’s
innovation economy as number one nationwide.2
At the epicenter of this economic explosion is the historic
city of Cambridge. Just over six square miles in size (com-
pared to Boston’s 48 square miles), and with a population
of 108,000,3 Cambridge is the state’s fifth most populous
city.4 Yet this comparatively small city generates more than
116,000 jobs5 and draws tens of thousands of people a day
to work in booming Kendall Square. This former industrial
area is now home to gleaming buildings sporting signage
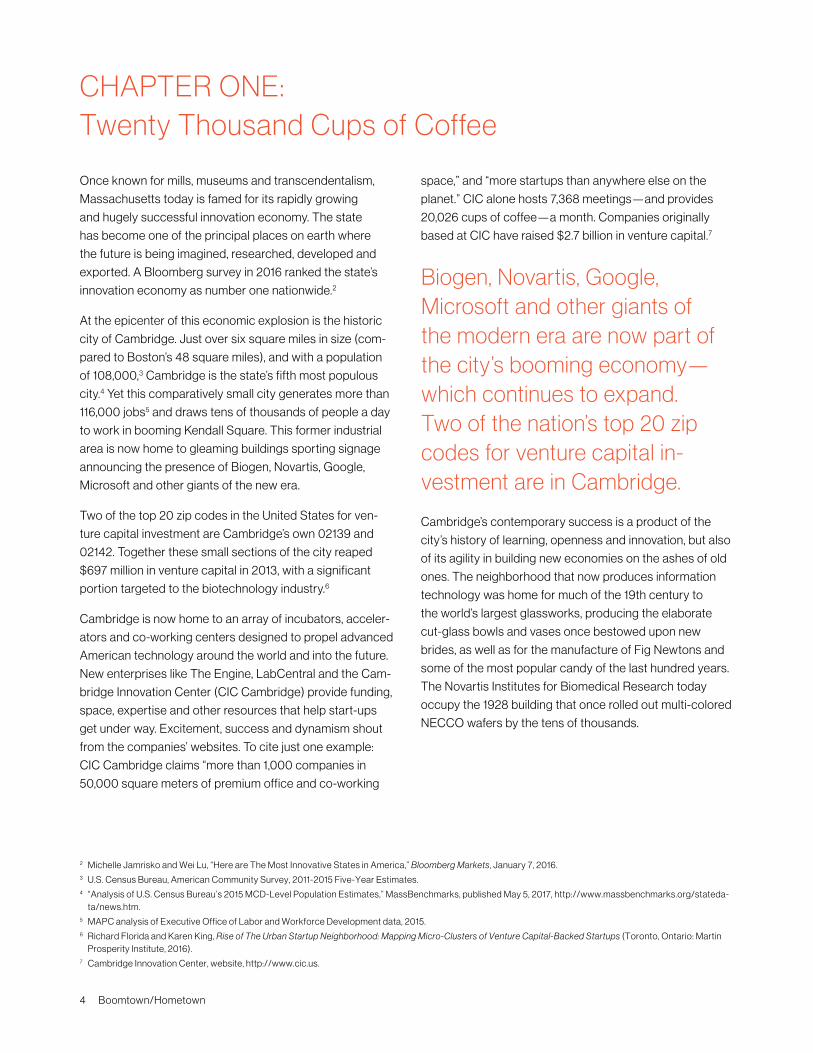
announcing the presence of Biogen, Novartis, Google,
Microsoft and other giants of the new era.
Two of the top 20 zip codes in the United States for ven-
ture capital investment are Cambridge’s own 02139 and
02142. Together these small sections of the city reaped
$697 million in venture capital in 2013, with a significant
portion targeted to the biotechnology industry.6
Cambridge is now home to an array of incubators, acceler-
ators and co-working centers designed to propel advanced
American technology around the world and into the future.
New enterprises like The Engine, LabCentral and the Cam-
bridge Innovation Center (CIC Cambridge) provide funding,
space, expertise and other resources that help start-ups
get under way. Excitement, success and dynamism shout
from the companies’ websites. To cite just one example:
CIC Cambridge claims “more than 1,000 companies in
50,000 square meters of premium office and co-working
space,” and “more startups than anywhere else on the
planet.” CIC alone hosts 7,368 meetings—and provides
20,026 cups of coffee—a month. Companies originally
based at CIC have raised $2.7 billion in venture capital.7
Cambridge’s contemporary success is a product of the
city’s history of learning, openness and innovation, but also
of its agility in building new economies on the ashes of old
ones. The neighborhood that now produces information
technology was home for much of the 19th century to
the world’s largest glassworks, producing the elaborate
cut-glass bowls and vases once bestowed upon new
brides, as well as for the manufacture of Fig Newtons and
some of the most popular candy of the last hundred years.
The Novartis Institutes for Biomedical Research today
occupy the 1928 building that once rolled out multi-colored
NECCO wafers by the tens of thousands.
Biogen, Novartis, Google, Microsoft and other giants of the modern era are now part of the city’s booming economy—which continues to expand. Two of the nation’s top 20 zip codes for venture capital in-vestment are in Cambridge.
March 2017 Cambridge Community Foundation 5
CHAPTER ONE: Twenty Thousand Cups of Coffee
Cambridge is a city of innovators and entrepreneurs
supported by a well-run and fiscally responsible local
government, which holds a Triple A bond rating.8 After
World War II, as much of the city’s industrial base eroded,
Cambridge began a journey toward its new economy.
A turning point came in the 1970s, when local laboratories
began experiments involving recombinant DNA, a move
that aroused fears that scientists were interfering—
perhaps irrevocably—in the evolution of the human
species. The city government stepped into the
controversy and Cambridge became the first city in the
country to regulate the manipulation of genetic material.
The city established oversight of the labs and created
an environment in which research could go forward.
In the 21st century, local government continues to
be supportive.
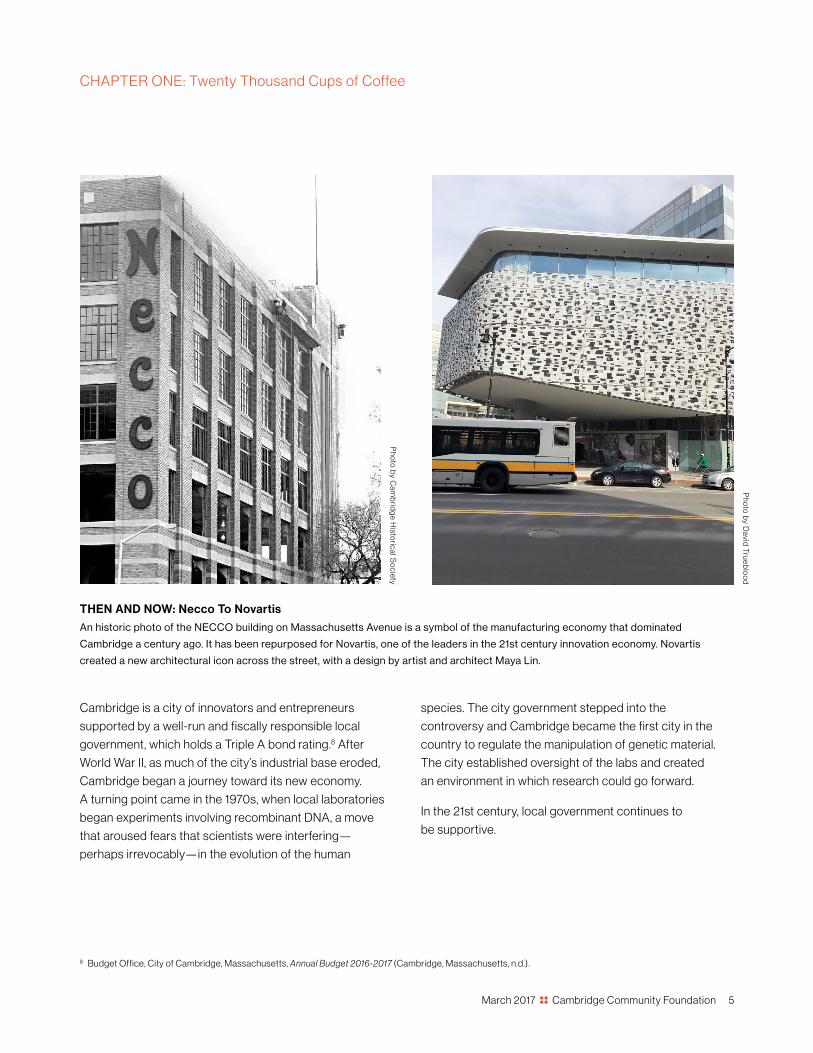
THEN AND NOW: Necco To Novartis
An historic photo of the NECCO building on Massachusetts Avenue is a symbol of the manufacturing economy that dominated
Cambridge a century ago. It has been repurposed for Novartis, one of the leaders in the 21st century innovation economy. Novartis
created a new architectural icon across the street, with a design by artist and architect Maya Lin.
8 Budget Office, City of Cambridge, Massachusetts, Annual Budget 2016-2017 (Cambridge, Massachusetts, n.d.).
Photo
by C
amb
ridg
e Histo
rical So
ciety
Photo
by D
avid Trueb
loo
d

6 Boomtown/Hometown
Kendall/MIT
Ringe Ave
Garden St
Concord Ave
Memorial Dr
JFK
St
Brattl
e St
Mount Auburn St
Broadway
Prospect S
t
Harvard St
Mount Auburn St
Beacon St
Massachusetts Ave
Massachusetts Ave
Massachusetts Ave
Cambridge St
Monsignor O’Brien Hwy
Hampshire St
Main St
Western Ave
River St
Kirkland S
t
Alew
ife Brook P
kwy
Lechmere
Central
Harvard
Porter
Alewife
FIGURE 1 – THE INNOVATION ECONOMY ECOSYSTEM:
Life Sciences, High Tech and Clean Energy Companies, Universities— Centers of Study, Research & Innovation Harvard University and the Massachusetts Institute of Technology, two of the city’s largest employers, are among the world’s
great institutions of higher education. As long-standing institutions, they form the bedrock of the community, its history,
its economy and its values. As talent producers and centers for research and innovation, they are fundamental drivers of
Cambridge’s innovation ecosystem.
Map adapted from Cambridge Community Development Department
INDU STRY CATEGORIES
Life Science (192)
Academic/Nonprofit (20)
High Tech (58)
Clean Energy (19)
Incubator/Coworking Space (12)

March 2017 Cambridge Community Foundation 7
Kendall/MIT
Ringe Ave
Garden St
Concord Ave
Memorial Dr
JFK
St
Brattl
e St
Mount Auburn St
Broadway
Prospect S
t
Harvard St
Mount Auburn St
Beacon St
Massachusetts Ave
Massachusetts Ave
Massachusetts Ave
Cambridge St
Monsignor O’Brien Hwy
Hampshire St
Main St
Western Ave
River St
Kirkland S
t
Alew
ife Brook P
kwy
Lechmere
Central
Harvard
Porter
Alewife
PARCEL OWNERSHIP T YPE AND TAX STATU S BY INSTITUTION
Harvard University Non-Taxable Properties Owned
Taxable Properties Owned
Non-Taxable Condominium Units Owned
Taxable Ground Lease
MIT Non-Taxable Properties Owned
Taxable Properties Owned
Non-Taxable Condominium Units Owned
Taxable Ground Lease
Cambridge College Taxable Properties Owned
Lesley University Non-Taxable Properties Owned
Taxable Properties Owned
Episcopal Divinity School Non-Taxable Properties Owned
00 .250
Miles
.5
8 Boomtown/Hometown
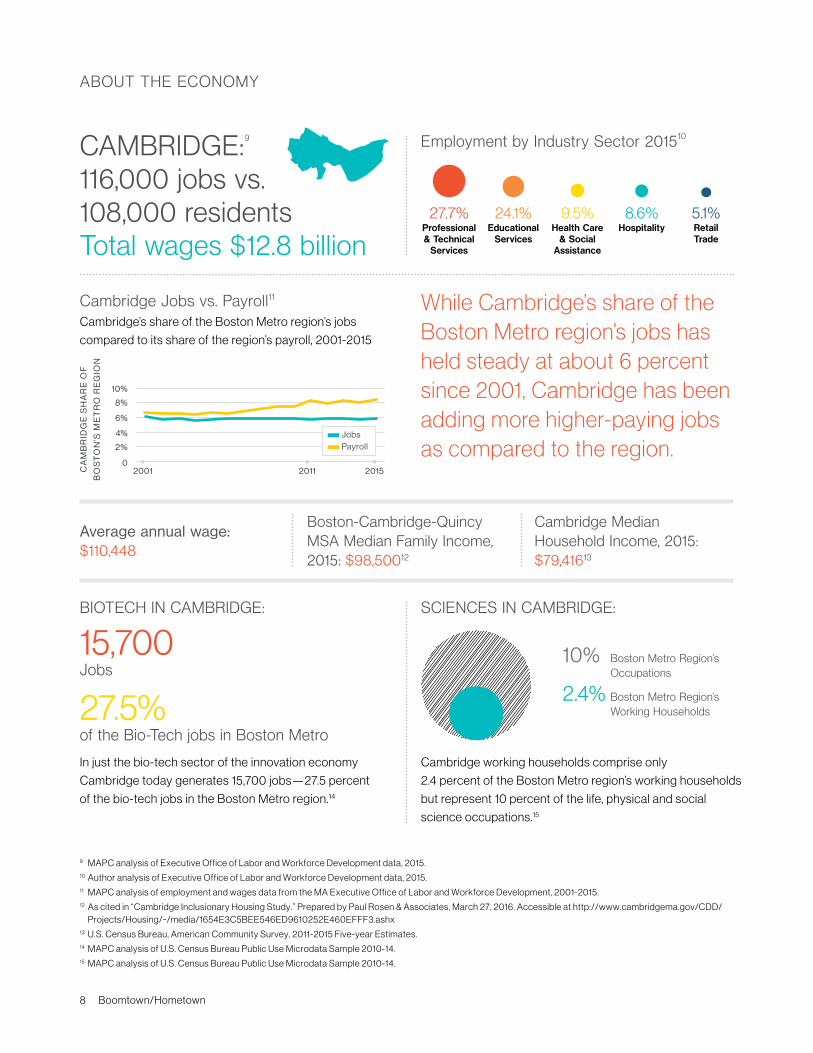
ABOUT THE ECONOMY
CAMBRIDGE:9
116,000 jobs vs. 108,000 residents Total wages $12.8 billion
BIOTECH IN CAMBRIDGE:
15,700Jobs
10% Boston Metro Region’s Occupations
2.4% Boston Metro Region’s Working Households
SCIENCES IN CAMBRIDGE:
27.5%of the Bio-Tech jobs in Boston Metro
In just the bio-tech sector of the innovation economy
Cambridge today generates 15,700 jobs—27.5 percent
of the bio-tech jobs in the Boston Metro region.14
Cambridge working households comprise only
2.4 percent of the Boston Metro region’s working households
but represent 10 percent of the life, physical and social
science occupations.15
9 MAPC analysis of Executive Office of Labor and Workforce Development data, 2015.10 Author analysis of Executive Office of Labor and Workforce Development data, 2015.11 MAPC analysis of employment and wages data from the MA Executive Office of Labor and Workforce Development, 2001-2015.12 As cited in “Cambridge Inclusionary Housing Study.” Prepared by Paul Rosen & Associates, March 27, 2016. Accessible at http://www.cambridgema.gov/CDD/
Projects/Housing/~/media/1654E3C5BEE546ED9610252E460EFFF3.ashx13 U.S. Census Bureau, American Community Survey, 2011-2015 Five-year Estimates.14 MAPC analysis of U.S. Census Bureau Public Use Microdata Sample 2010-14.15 MAPC analysis of U.S. Census Bureau Public Use Microdata Sample 2010-14.
While Cambridge’s share of the Boston Metro region’s jobs has held steady at about 6 percent since 2001, Cambridge has been adding more higher-paying jobs as compared to the region.
Employment by Industry Sector 201510
Average annual wage: $110,448
Boston-Cambridge-Quincy MSA Median Family Income, 2015: $98,50012
Cambridge Median Household Income, 2015: $79,41613
Cambridge Jobs vs. Payroll11
Cambridge’s share of the Boston Metro region’s jobs
compared to its share of the region’s payroll, 2001-2015
0
2%
4%
6%
8%
10%
CA
MB
RID
GE
SH
AR
E O
F
BO
ST
ON
’S M
ET
RO
RE
GIO
N
2001 2011 2015
Jobs Payroll
27.7%Professional & Technical
Services
9.5%Health Care
& Social Assistance
24.1%Educational
Services
8.6%Hospitality
5.1%Retail Trade

March 2017 Cambridge Community Foundation 9
CHAPTER TWO: The People’s City
Throughout its history, Cambridge has been prized for
its quality of life, the result of a sustained commitment
to a particular set of values, perhaps first among them
an openness to new ideas and diverse perspectives.
Cambridge honors not only excellence but inclusiveness,
as evidenced by desegregation of the city’s schools in
the early 19th century. This value has been extended to
newcomers from around the world (public school students
speak 64 languages), and to people exploring a range
of gender identities.11
The city that has built this dynamic ecosystem to nurture
the future has become a magnet for technology students,
employees and entrepreneurs. They are drawn not only to
the advanced jobs and supportive institutions but to a lively
city of coffee shops, open-air restaurants with cuisines
from around the world, small family-owned businesses,
and leafy side streets lined with elegant old housing. They
chat with friends in the attractive pocket parks, flock to the
city’s many festivals and boat races and outdoor concerts.
They enjoy the palpable presence of a rich and remarkable
past—and the possibilities such a past represents.
Cambridge Public Library is a True Community Center
More than 2,000 people a day visit the city’s main library, a center of opportunity, recreation and study, where new residents study
English, job seekers update their résumés, parents read to their children, students do their homework, and booklovers find the books
they love. The newly expanded library, a $90 million investment, earned a major award as the single most beautiful structure built in
Greater Boston in a decade.
Pho
to b
y Richard
Ho
ward
UPDATED PHOTO TO COME
10 Boomtown/Hometown
12 Natalie Handy, “545 Ideas Submitted on How to Spend $700K in Cambridge’s Participatory Budget,” Cambridge Wicked Local, August 16, 2016. Accessible at http://cambridge.wickedlocal.com/news/20160816/545-ideas-submitted-on-how-to-spend-700k-in-cambridges-participatory-budget.
13 While this group of 400 Cambridge residents varies on important dimensions including length of time lived in the city, area of the city, tenure, and gender – the majority who were willing to provide their household income had incomes greater than $75,000 per year, suggesting that these impressions may not be repre-sentative of all of our neighbors. City Manager’s Office, Cambridge, Massachusetts, Cambridge Biennial Citizen Survey 2014 (Cambridge, Massachusetts: n.d.).
14 Chris Tausanovitch and Chris Warshaw, “Representation in Municipal Government,” American Political Science Review 108, no. 3 (2014): 605-641.15 Massachusetts Department of Elementary and Secondary Education, 2014-15 Per Pupil Expenditure Report (Boston, Massachusetts: n.d.). 16 Author analysis of National Center for Charitable Statistics Data. Accessible at http://nccsweb.urban.org/PubApps/geoSearch.php.
The city enjoys a high level of civic engagement and of
satisfaction with life in Cambridge. Thousands of residents
joined in the city’s participatory budgeting process last
year—submitting more than 500 ideas, acting as volunteer
delegates to refine project proposals, and voting for capital
projects to be funded with $700,000.12 The City Council
actively seeks out the judgments and opinions of the com-
munity by conducting an annual survey of residents. In a
2014 survey, 89 percent described the overall quality of life
in Cambridge as good or excellent, 88 percent felt that the
welcome offered to diverse races was good or excellent,
and 78 percent held the sense of community in Cambridge
to be good or excellent.13
The city’s liberal political tradition is well known—and
sometimes captured humorously in its designation as the
People’s Republic of Cambridge. A recent examination
of city policy preferences among constituents of cities in
Massachusetts finds that Cambridge is the most liberal city
in the state.14 Cambridge offers a notable breadth of human
service programs for residents of all ages, and spending
for public amenities is impressive. The city’s investment in
education, at $27,500 per pupil, is among the highest of
all cities and towns in the state, where per pupil expendi-
tures range from $10,400 to $30,505.15 The city recently
invested $90 million to expand the main library with an
award-winning building that itself represents a high-level of
commitment to the community’s civic and intellectual life.
The nonprofit sector’s investment in the community is
similarly generous. According to the National Center
for Charitable Statistics, there were more than 1,000
registered nonprofit organizations in 2013 for this city’s
105,000 people at the time. These nonprofits range from
universities and research centers to safety net organiza-
tions providing essential supports and services, to social
clubs. Of the 500 public charities that report to the IRS
every year, 19 percent support the arts, 21 percent support
education, and 21 percent support human services.16
They all enrich the community by contributing to the arts,
education and recreation as well as the needs of the
elderly, young children, the ill, the poor and those in need
of food assistance in Cambridge and beyond.
There is a homeless man who appears from time to time
in Harvard Square asking passers-by for money. He sits
on a crate near Out of Town News. Knowingly or not, he
has stationed himself at the center of the historic town of
Cambridge. He holds a sign that reads “Seeking Human
Kindness.” His appeal might not touch the members of
every community, but Cambridge is a place that con-
sciously values kindness and concern for others. The
concern may not always be practiced, but it is part of the
place’s traditions, customs, DNA. It is how the people
here think about themselves and their city, and the man
seems to know he can rely on it.
Students, employees, and entrepreneurs are drawn to Cambridge’s lively coffee shops, restaurants with cuisines from around the world, family-owned businesses, and leafy side streets lined with elegant old housing.
CHAPTER TWO: The People’s City

March 2017 Cambridge Community Foundation 11
FIGURE 2. Cambridge Demographic Profile
1990 2000 2010 2015
Population 95,802 101,355 105,162 107,916
Household Population 81,769 86,692 88,060 90,786
Group Quarters Population 14,033 14,663 17,102 17,130
Household Composition (% all Households)
Family Households 44.6% 41.3% 39.6% 42.2%
Married Couples 31.5% 29.1% 28.9% 31.4%
Single Parent 6.6% 6.3% 5.2% 8.3%
Nonfamily Households 55.4% 58.7% 60.4% 57.8%
Single Person Alone 42.3% 41.4% 40.7% 39.6%
Roommates 13.1% 17.3% 19.7% 18.2%
Student Households 14.7% 15.7%*
Age
0-9 8.7% 7.6% 7.2% 7.5%
10-19 11.1% 11.0% 9.2% 10.4%
20-39 48.1% 48.1% 51.4% 49.0%
40-59 18.4% 21.3% 18.4% 18.0%
60 and above 13.8% 12.0% 13.8% 15.1%
Race and Ethnicity
White, non-Latino 71.6% 64.6% 62.1%
Black, non-Latino 12.7% 11.5% 11.0%
Asian or Pacific Islander 8.4% 11.9% 15.1%
Latino (Any Race) 6.8% 7.4% 7.6%
Other Non-Latino 0.4% 4.5% 4.1%
Nativity
Foreign born as % of total population 22.3% 25.9% 27.2% 27.1%
Speaking Language other than English at home (Ages 5 and above) 26.2% 31.2% 31.4% 32.0%
Highest Educational Attainment (% of Adults aged 25 and older)
No High School Diploma 15.6% 10.5% 5.9% 6.1%*
High School Diploma or Equivalent 15.8% 12.2% 11.2% 9.3%*
Less than 4 Years of College (incl. both persons with an Associate degree and persons with a partially completed Bachelor's degree)
14.3% 12.2% 10.7% 9.9%*
Bachelor's Degree or Higher 54.2% 65.1% 72.1% 74.7%*
Asterisk (*) indicates data is for 2014. SOURCES: Community Development Department, City of Cambridge, Massachusetts. 2011 Statistical Profile. MAPC analysis of U.S. Census Bureau
Public Use Microdata Sample 2010-14. U.S. Census Bureau, American Community Survey, Five-Year Estimates, 2006-2010, 2010-2014, 2011-2015.

12 Boomtown/Hometown
With its new economy, its many amenities and its extensive
educational infrastructure, Cambridge today is a wealthy,
thriving and beautiful city. As in many other cities with
burgeoning economies based on technological innovation,
however, the question is whether and to what extent the
new prosperity benefits the city as a whole—whether the
new economy enhances Cambridge as a place to live,
work and raise children.
This chapter sets the stage for a discussion of that ques-
tion. It begins with Cambridge’s demographic changes
from 1990 to 2015 and then examines the status of income,
housing affordability and public school education.17 This
report strives for the most up-to-date, accurate data and
employs measures from either 2014 or 2015, depending
on the source.
Demographic statistics reflect a changing city. Cambridge’s
population grew from 95,802 in 1990 to 107,916 in 2015,
with a 6.5 percent increase between 2000 and 2015.
While the past 15 years have seen small declines in the
elementary school-aged and high school-aged youth, the
“millennial” population, aged 20 to 39, has expanded. In
the same years, the population of those aged 40 to 59
has declined.
The white population, still by far the largest racial group,
decreased by almost 10 percentage points over the period
1990 to 2010, while the Asian or Pacific Islander population
grew by almost 7 percentage points over the same period.
Among the most significant demographic changes is the
growth of the city’s foreign-born population from 22.3 per-
cent of the total population in 1990 to 27.1 percent in 2015;
a full 32 percent of the city’s population over the age of 5
now speaks a language other than English at home.
The data in this report also reveal a city that is far wealthier than the average U.S. city—and quite unequal. Also revealed is the fact that this wealthy city has
considerable poverty, which grew in the years of the boom-
ing economy, according to the federal poverty threshold
($24,250 for a family of four).18 The federal threshold likely
underestimates the need among our families because it
is defined for the whole country and fails to account for
local costs of living. Estimates suggest that a two-parent,
two-child household in the Boston-Cambridge-Newton
metropolitan area (in 2014) actually needs $85,793 annu-
ally for a secure if modest standard of living—a difference
of more than $60,000.19
In addition, the numbers show the increasing difficulty of
low- and middle-income residents to afford housing in the
city. Just 4 percent of the city’s rental housing with two or
more bedrooms in 2015 was affordable to a family with two
workers making $75,000 annually. Also of concern is
17 While the City of Cambridge and the Metropolitan Area Planning Council provided the bulk of the statistical data in this document, much more information is available from both of these sources. The Cambridge Needs Assessment study, co-funded by the Cambridge Community Foundation and the City of Cambridge, provides a more detailed picture of these and other relevant indicators of the city’s current status; the Assessment is available on the City’s website (https://www.cambridgema.gov/CDD/Projects/Planning/cambridgeneedsassessment).
18 U.S. Department of Health and Human Services, Office of the Assistant Secretary for Planning and Evaluation, 2015 Federal Poverty Guidelines (Washington, D.C.: n.d.).
19 Economic Policy Institute’s Family Budget Calculator for the Boston/Cambridge/Quincy, Mass. Metro Area measures the income needs to attain a secure yet modest standard of living. This measure is based on 2014 data, and dollars are adjusted to 2015. Accessible at http://www.epi.org/resources/budget/budget-factsheets/#/245.
A Cambridge mother attends a meeting of the Family Independence Initiative
at the main branch of the Cambridge Public Library.
CHAPTER THREE:The Downside of the Upside
Photo
by R
ichard H
oward

March 2017 Cambridge Community Foundation 13
CHAPTER THREE: The Downside of the Upside
the future employability of the city’s children. Although
Cambridge is a highly educated city, where 75 percent of
adults held college degrees in 2015, the public schools
lag behind a comparable district in the metropolitan area
in sending students seamlessly on to college graduation.20
These realities foreshadow increasing economic and
racial equity gaps even as Cambridge enters a new era—
one filled with the promise of unprecedented prosperity.
Broad access to our thriving economy is part of Cam-
bridge’s ethos and is critical to our continued economic
growth. Research, internationally and across regions in the
U.S., indicates that inequality can be a drag on an economic
boom.21 In the whirlwind of success that has engulfed the
city, can Cambridge make a commitment to greater equity
and the ideal of shared prosperity?
20 The Massachusetts Department of Elementary and Secondary Education provides data on the portion of students who started their careers at the Cambridge Rindge and Latin School (CRLS) in 2004 who moved seamlessly toward any kind of college degree within six years of their high school graduation (whether from CRLS or elsewhere). These data do not have separate measures for students based on whether they received their high school diploma from their 9th grade school or elsewhere. This suggests care when enlisting these data as an absolute measure of CRLS performance.
21 For example, Ugo Panizza, “Income Inequality and Economic Growth: Evidence from American Data,” Journal of Economic Growth 7, no. 1 (2002): 25–41.
New construction in Kendall Square offers tangible evidence of a red-hot innovation economy.
Photo
by D
avid Trueb
loo
d
Cambridge is significantly wealthier than the average U.S. city, but poverty remains—and has deepened during the years of the new economic boom.

14 Boomtown/Hometown
CHAPTER THREE: The Downside of the Upside
IncomeCambridge’s thriving economy affords impressive heights.
The city’s $79,416 median household income in 2015
was more than $25,000 greater than the median for all
urban households in the country.22 However, as the data
below demonstrate, the city’s economic success has not
stemmed poverty among us—and may be threatening
the economic and cultural richness of the community.
POVERT YCambridge’s poverty grows. Poverty remains a
reality in Cambridge despite our prosperity. As shown
in FIGURE 3, well over 10 percent of all Cambridge
families with children live in poverty. Close to 2,000
children and youth lived in poverty in Cambridge in 2015—
close to 15 percent of all Cambridge residents under 18.
Of families headed by single women, nearly a third
(32.8 percent) are living in poverty today, an increase
of more than 8 percentage points since 2010.
Poverty cuts across all racial and ethnic groups in
Cambridge. Those living in poverty in 2015 included
26.4 percent of black residents, 26.3 percent of
Latino residents, 16.9 percent of Asian residents and
10.7 percent of white residents.23
INCOME INEQUALIT Y Income inequality is evident in dramatic disparities between upper and lower Cambridge households.24 Cambridge today reflects the income inequality that
marks many prosperous American cities. The numbers
are striking: Nearly a thousand working households make
more than $500,000 a year, while nearly 5,000 working
households bring in less than $40,000.25, 26
As shown in FIGURE 4, Cambridge has a smaller
portion of low-income and middle-income households as
compared to the larger Metro Boston region, while having
a larger portion of high-income households.
22 U.S. Census Bureau, American Community Survey, 2011-2015 Five-Year Estimates. Alemayehu Bishaw and Kirby G. Posey, “A Comparison of Rural and Urban America: Household Income and Poverty,” Random Samplings: The official blog of the U.S. Census Bureau, December 8, 2016, http://blogs.census.gov/2016/12/08/a-comparison-of-rural-and-urban-america-household-income-and-poverty/.
23 U.S. Census Bureau, American Community Survey, 2011-2015 Five-Year Estimates.24 Income groups are defined relative to the median income for the metropolitan area, and adjusted by household size. A low-income 4-person working
household has an income of less than $67,750. A middle-income 4-person working household has an income greater than $67,750, but less than $112,920. A high-income 4-person working household has an income greater than $112,920.
25 Because of the temporary and atypical earning patterns of students, the focus of MAPC’s income and occupational analysis is on the nearly 80 percent of all households that are working (defined by having at least one wage earner and a principal earner who is not enrolled in school). MAPC analysis of U.S. Census Bureau Public Use Microdata Sample, 2010-14.
26 Figure 4 shows the relative portions of Cambridge households in each income group. It also provides a comparison between Cambridge and the inner core of the larger Boston metropolitan region. The inner core region (defined by the Metropolitan Area Planning Council in 2008) includes the set of 16 cities and towns that are the high density “urban communities”: Boston, Cambridge, Chelsea, Everett, Malden, Revere, Somerville, Arlington, Belmont, Brookline, Medford, Melrose, Newton, Waltham, Watertown, and Winthrop.
FIGURE 3. Poverty Status in Cambridge 2000 and 2011-2015
Persons in Poverty 2000 2011-2015
All Persons 12.9% 14.0%
Under 18 15.6% 14.9%
65 and Over 12.9% 12.5%
All Families 8.7% 9.0%
Families with Related Children
12.6% 13.2%
Female Single Parent
24.3% 32.8%
SOURCES: 2000 estimates from Cambridge Community Development Department
analysis of Decennial Census Summary File 3, 2000 as reported in Community Develop-
ment Department, City of Cambridge, Massachusetts. 2011 Statistical Profile. 2011-2015
FIGURE 4. Household Income, Cambridge and Inner Core Region
% O
F H
OU
SE
HO
LD
S
0
20
40
60
80
100
High-incomeMiddle-incomeLow-income
The portion of all working households in each income group (see footnote 24). See footnote 26 for definition of “inner core” region. SOURCE: MAPC Analysis of U.S. Census Bureau Public Use Microdata Sample 2010-2014.
Cambridge Inner Core Region

March 2017 Cambridge Community Foundation 15
CHAPTER THREE: The Downside of the Upside
Household income among Cambridge’s working house-
holds varies across race. As shown in FIGURE 5, it is far
more likely for a black or Latino Cambridge household to
be in the low-income group than for a white household.
Cambridge’s middle class is shrinking. A December
2015 report, The American Middle Class is Losing Ground
by the Pew Research Center indicates a national trend in
the loss of the middle class, which has declined steadily to
50 percent of households in 2015. As shown in FIGURE 6,
in 2014 less than a quarter, or 23 percent, of the working
households in Cambridge were middle-income (while
nearly half were high income). This represents a decline
over the past 15 years of about 1 percentage point. While
not dramatic, this continued shift is concerning particularly
in light of rising income inequality and the housing market
which, as discussed below, provides few affordable
options for such households.
The city’s high-income population continues to grow.
As shown in FIGURE 6, the share of high-income working
households in Cambridge increased by 14 percent over
the last 15 years, while the inner core of the Boston Metro
region, as a whole, experienced a 1 percent decline.
Over the same period, the share of low-income working
households declined by 12 percent while this nearby region
experienced a 20 percent increase. It is not known what
explains this changing share of low-income households—
whether low-income workers increased their incomes
or left the city because they found better-paying jobs, or
because of other factors such as housing affordability.
Income inequality is altering the Cambridge community,
as the city’s share of high-income households grows and
its share of low-income households declines. As shown
later in this chapter, the great equalizers of education and
homeownership are constrained in Cambridge. These
changes raise the question whether Cambridge of the
future will lack the rich diversity, in terms of race, ethnicity
and income, of the past, and whether Cambridge’s historic
commitment to social justice will continue to define the city.
FIGURE 6. Cambridge Household Income Composition Over Time
% O
F H
OU
SE
HO
LD
S
0
20
40
60
80
100
High-incomeMiddle-incomeLow-income
The portion of all working households in each income group. See income definitions above. SOURCE: MAPC Analysis of U.S. Census Bureau Public Use Microdata Sample 2000, 2010-2014.
2000 2010-2014
FIGURE 5. Income in Cambridge by Race and Ethnicity of Household
% O
F H
OU
SE
HO
LD
S
0
20
40
60
80
100
White, Non-Latino
Black, Non-Latino
Latino Asian, Non-Latino
The portion of all Cambridge working households in each income group (defined above), for each racial/ethnic group. SOURCE: MAPC Analysis of U.S. Census Bureau Public Use Microdata Sample 2000-2014.
Low-income Middle-income High-income
The city’s economic success may be threatening the economic and cultural richness of the community.

16 Boomtown/Hometown
CHAPTER THREE: The Downside of the Upside
27 Cambridge Community Development Department, 2010 Housing Profile (Cambridge, Massachusetts: n.d.).28 MAPC analysis of U.S. Census Bureau, American Community Survey, 2010-2014 Five-Year Estimates.29 Cambridge Community Development Department, Affordable Housing Distribution by Neighborhood as of June 30, 2016 (unpublished data). This stock includes
nonprofit housing and scattered-site homeownership, public housing, inclusionary housing, and private housing. 30 As cited in “Cambridge Inclusionary Housing Study,” prepared by Paul Rosen & Associates, March 27, 2016. Accessible at http://www.cambridgema.gov/CDD/
Projects/Housing/~/media/1654E3C5BEE546ED9610252E460EFFF3.ashx.
Portion of All Units Among Types of Properties 2010
Owner Occupied vs. Rental 201428
Average Sales Price 201430
Median Market-Rate Asking Rent 2014
7.5%Single-Family
26.9%2-3 Unit
15.8%4-12 Unit
14.5%13-50 Unit
35.2%51+ Unit
Properties: 11,108 Units: 49,53027
36%Owners
$1,200,000Single-Family
$2,950/mo.Two-Bedroom
$575,000Condominium
$3,400/mo.Three-Bedroom
57.8%Renters 14.7%
Subsidized Housing Inventory Units 201629
HOUSING

March 2017 Cambridge Community Foundation 17
CHAPTER THREE: The Downside of the Upside
HousingCambridge’s vigorous economy has had a major influence
on the city’s housing market. As the discussion below
indicates, the cost of housing creates heavy burdens on
households as they strive to raise their families, remain
in the community, and build wealth. Across racial, ethnic
and income lines, concerns about housing choice and
affordability emerged as a leading issue in surveys and
comments in Envision Cambridge, the initiative created
to help plan for the future.31
As of 2016, an impressive 15 percent of the city’s housing stock (more than 7,500 units) is in low- income or mixed-income developments eligible for the state’s Subsidized Housing Inventory.32, 33 Never-
theless, housing affordability remains a key challenge, a
long-term problem stemming from the discontinuation of
rent control in the 1990s. The problem is now exacerbated
by Cambridge’s current desirability as a place to live and
by the growing demand for housing among high-income
households with jobs in our innovation economy.
HOUSING COST BURDENHousing costs are burdening Cambridge’s low- and middle-income households. The city’s hot housing
market has had a profound impact on rental affordability.
According to the City’s annual rent survey, the median
asking rent for a three-bedroom apartment in 2014 was
$3,400.34 In Cambridge, just 4 percent of rental listings with
two or more bedrooms over the 2014-2015 period were
affordable to a family with two workers making $75,000.
In Boston, over the same period, 10 percent were afford-
able. Given that more than two-thirds of our occupied
units are home to renters, these high rates represent a
real challenge for many Cambridge residents. Moreover,
when low-income renter households benefit from our
local economy with a better job and higher income they
have few affordable options.
As the cost of housing rises, both renters and homeowners
experience heavier housing cost burdens. The U.S. Depart-
ment of Housing and Urban Development has long defined
cost-burdened households as those paying more than
30 percent of their income for housing. Today, a substantial
number of households are experiencing extreme cost
burdens, dedicating more than 50 percent of their income
to housing.
FIGURE 7 indicates the housing cost burden across
income groups. The rate of housing burden among
low-income working households is greatest and has grown
over the past 15 years. More than 78 percent of low-income
working households in Cambridge are cost-burdened
(over the 2010-2014 period), and more than half of those
households are putting more than 50 percent of their
income toward housing costs. Perhaps more striking is
that over the same period more than 40 percent of the
city’s middle-income households are also housing-cost
burdened. In the past 15 years, this portion of our neighbors
has experienced the greatest increase in the rate of rent
burden—up by 13 percentage points.
31 Cambridge Community Development Department, Envision Cambridge: Public Participation Summary, Listening Phase (Cambridge, Massachusetts, Spring 2016).
32 Cambridge Community Development Department, Affordable Housing Distribution by Neighborhood as of June 30, 2016 (unpublished data). This stock includes nonprofit housing and scattered-site homeownership, public housing, inclusionary housing, and private housing.
33 Within Cambridge 1,169 households are renting with support of Federal and state tenant-based housing vouchers. Cambridge Public Housing Authority, unpublished data.
34 As cited in “Cambridge Inclusionary Housing Study,” prepared by Paul Rosen & Associates, March 27, 2016. Accessible at http://www.cambridgema.gov/CDD/Projects/Housing/~/media/1654E3C5BEE546ED9610252E460EFFF3.ashx.
FIGURE 7. Housing Cost Burdens for Low-, Middle-, and High-Income Cambridge Households
% O
F W
OR
KIN
G H
OU
SE
HO
LD
S
0
10
20
30
40
50
60
70
80
90
100
Low-Income Middle-Income High-Income
2000 2000 20002010-14 2010-14 2010-14
The portion of all working households in each income group experiencing housing cost burden. See income definitions above. SOURCE: MAPC Analysis of U.S. Census Bureau Public Use Microdata Sample 2000, 2010-2014.
Severely Cost Burdened (50% or more household income spent on housing)
Moderately Cost Burdened (30%-49% of household income spent on housing)

18 Boomtown/Hometown
After spending a significant share of their income on
housing, cost-burdened households are forced to cut
back spending on other vital needs. The high cost of
living in the Boston area exacerbates this difficulty.
According to the 2014 Consumer Expenditure Survey,
severely cost-burdened households spent 41 percent
less on food and 74 percent less on healthcare than
their counterparts living in housing they could afford.35
Severe housing cost burdens also leave families more
vulnerable to unexpected financial shocks such as a
car breakdown or sudden illness.
HOMEOWNERSHIP RATES High housing costs keep the city’s rate of home-ownership low. In recent years, property sales have continued to be rare and prices have been high.
The average sales price for a single-family home in 2014
was $1,200,000, and for a condominium, $575,000.36
And prices continue to climb.
About a third (36 percent) of Cambridge housing units
are owner-occupied, compared to 57.8 percent in the
entire Boston metropolitan region.37, 38 Most of the city’s
working household homeowners—71 percent—are in
the high-income bracket, 12 percentage points more
than the 59 percent of metropolitan Boston’s working
household homeowners who are high-income.39
CHAPTER THREE: The Downside of the Upside
35 Joint Center for Housing Studies, The State of the Nation’s Housing 2016 (Cambridge, Massachusetts: Harvard University, 2016).36 City of Cambridge Community Development Department data as cited in “Cambridge Inclusionary Housing Study,” prepared by Paul Rosen & Associates,
March 27, 2016. Accessible at http://www.cambridgema.gov/CDD/Projects/Housing/~/media/1654E3C5BEE546ED9610252E460EFFF3.ashx.37 MAPC analysis of U.S. Census Bureau, American Community Survey, 2010-2014 Five-Year Estimates.38 The Boston metropolitan region is composed of 101 cities and towns including and surrounding Boston, roughly bordered by Interstate 495 to the west,
Ipswich to the north, and Duxbury to the south.39 MAPC analysis of U.S. Census Bureau, Public Use Microdata, 2010-14.
Photo
by R
ichard H
oward
Small neighborhoods in Cambridge with a strong sense of community invite residents to come out and connect—here by way of an impromptu concert.

March 2017 Cambridge Community Foundation 19
CHAPTER THREE: The Downside of the Upside
Among transactions in Cambridge from 2014 to 2015,
just 2 percent of single-family homes and 9 percent of
condominiums were affordable to a family with two work-
ers earning $75,000 annually, compared to the Boston
metropolitan region, where 22 percent of single family
homes and 39 percent of condos were affordable to such
a family. Given the scarcity of affordable properties, only
17 percent of working household homeowners are mid-
dle-income. This is nearly 3 percentage points lower than
the rate of homeownership for middle-income working
households in the Boston metropolitan region.40 An even
smaller portion of Cambridge’s working household home-
owners—just 12 percent—are low-income. Across the
entire Boston metropolitan region, the portion of working
household homeowners that are low-income is 16 percent.
There are considerable racial disparities in home- ownership, affecting asset and wealth building. FIGURE 8 shows that forty-three percent of non-Latino
whites own their homes, while only 18 percent of black
non-Latinos do, and an even smaller portion of Latinos
(13.2 percent) are homeowners.
These figures have long-term implications, as home own-
ership is the primary way Americans accumulate wealth.
Household wealth is also an important predictor of college
completion. These gaps in household wealth will make it
hard to close the college completion gaps among Latino,
black and white households.41
40 MAPC analysis of U.S. Census Bureau, Public Use Microdata, 2010-14.41 Laura Sullivan, Tatjana Meschede, Lars Dietrich, Thomas Shapiro, Amy Traub, Catherine Ruetschlin, and Tamara Draut,
The Racial Wealth Gap: Why Policy Matters (New York, NY: Demos, 2015).
FIGURE 8. Home Ownership in Cambridge by Race and Ethnicity
% O
F H
OU
SE
HO
LD
S
010
203040506070
White, Non-Latino
Black, Non-Latino
Asian, Non-Latino
Latino
For each racial or ethnic group, the portion of households that are homeowners. For the City of Cambridge and the Boston Metro region. SOURCE: MAPC analysis of U.S. Census Bureau American Community Survey Five-Year Estimates, 2011-2014.
Cambridge Boston Metro Region
Long-time Cambridge resident William Cobham, remembered for his many
contributions to the Cambridge community, stands in front of the house his
parents bought in 1947, home to multiple generations of his family.
Photo
by R
om
ana Vysatova
The cost of housing creates a heavy burden on low- and middle-income households as they strive to raise their families, remain in the community, and build wealth.
20 Boomtown/Hometown
CHAPTER THREE: The Downside of the Upside
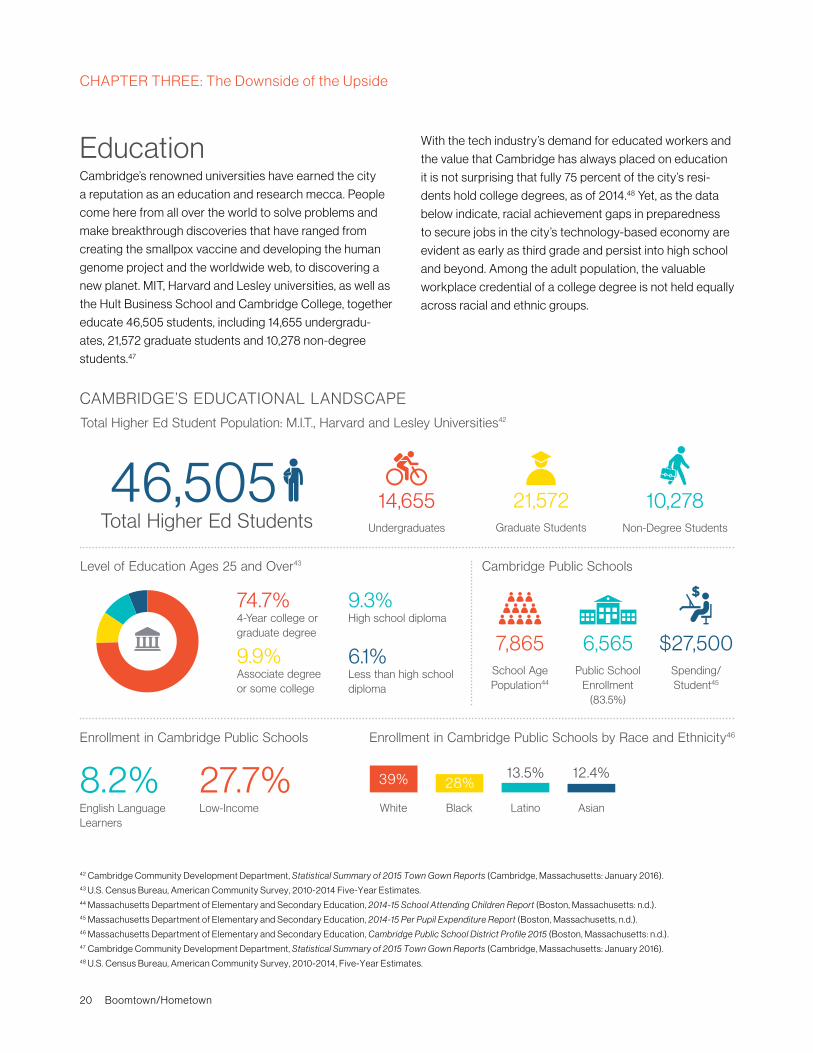
EducationCambridge’s renowned universities have earned the city
a reputation as an education and research mecca. People
come here from all over the world to solve problems and
make breakthrough discoveries that have ranged from
creating the smallpox vaccine and developing the human
genome project and the worldwide web, to discovering a
new planet. MIT, Harvard and Lesley universities, as well as
the Hult Business School and Cambridge College, together
educate 46,505 students, including 14,655 undergradu-
ates, 21,572 graduate students and 10,278 non-degree
students.47
With the tech industry’s demand for educated workers and
the value that Cambridge has always placed on education
it is not surprising that fully 75 percent of the city’s resi-
dents hold college degrees, as of 2014.48 Yet, as the data
below indicate, racial achievement gaps in preparedness
to secure jobs in the city’s technology-based economy are
evident as early as third grade and persist into high school
and beyond. Among the adult population, the valuable
workplace credential of a college degree is not held equally
across racial and ethnic groups.
42 Cambridge Community Development Department, Statistical Summary of 2015 Town Gown Reports (Cambridge, Massachusetts: January 2016).43 U.S. Census Bureau, American Community Survey, 2010-2014 Five-Year Estimates.44 Massachusetts Department of Elementary and Secondary Education, 2014-15 School Attending Children Report (Boston, Massachusetts: n.d.). 45 Massachusetts Department of Elementary and Secondary Education, 2014-15 Per Pupil Expenditure Report (Boston, Massachusetts, n.d.).46 Massachusetts Department of Elementary and Secondary Education, Cambridge Public School District Profile 2015 (Boston, Massachusetts: n.d.).47 Cambridge Community Development Department, Statistical Summary of 2015 Town Gown Reports (Cambridge, Massachusetts: January 2016).48 U.S. Census Bureau, American Community Survey, 2010-2014, Five-Year Estimates.
CAMBRIDGE’S EDUCATIONAL LANDSCAPE
Level of Education Ages 25 and Over43 Cambridge Public Schools
Total Higher Ed Student Population: M.I.T., Harvard and Lesley Universities42
14,655Undergraduates
21,572Graduate Students
7,865School Age Population44
6,565Public School
Enrollment (83.5%)
$27,500Spending/ Student45
10,278Non-Degree Students
46,505 Total Higher Ed Students
8.2%English Language Learners
27.7%Low-Income
74.7% 4-Year college or graduate degree
9.9% Associate degree or some college
9.3% High school diploma
6.1% Less than high school diploma
Enrollment in Cambridge Public Schools by Race and Ethnicity46Enrollment in Cambridge Public Schools
White Black Latino Asian
39% 28%13.5% 12.4%
March 2017 Cambridge Community Foundation 21
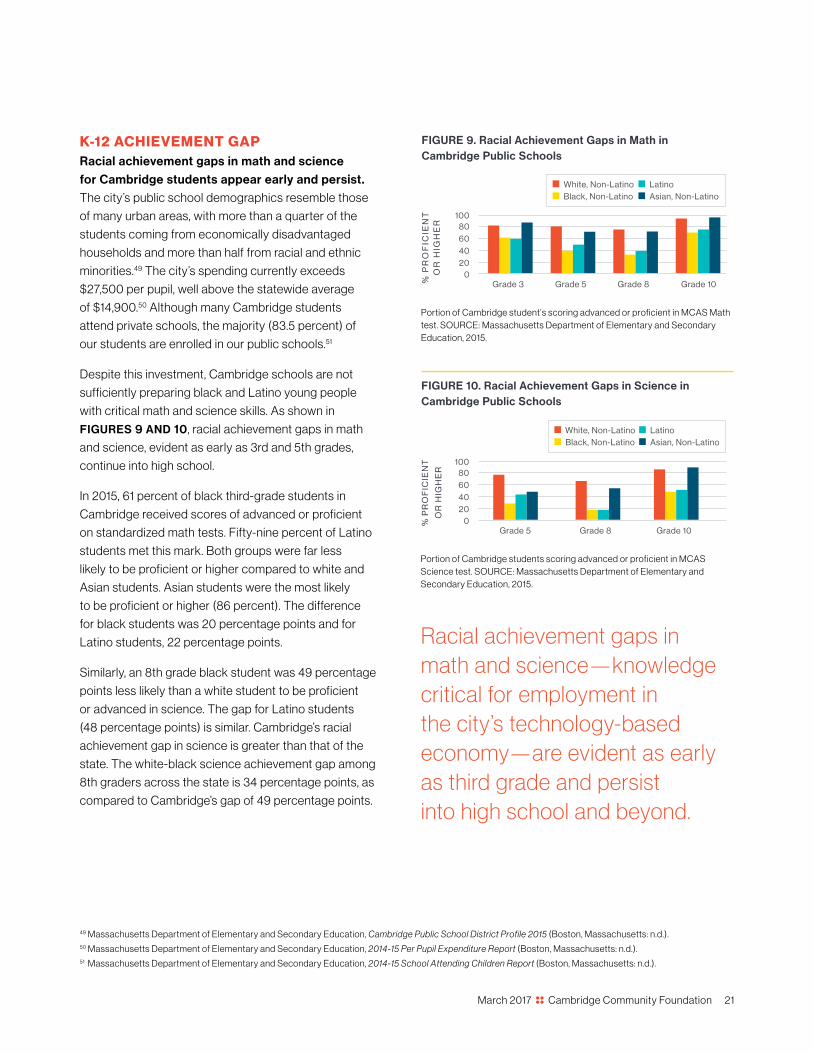
K-12 ACHIEVEMENT GAPRacial achievement gaps in math and science for Cambridge students appear early and persist.
The city’s public school demographics resemble those
of many urban areas, with more than a quarter of the
students coming from economically disadvantaged
households and more than half from racial and ethnic
minorities.49 The city’s spending currently exceeds
$27,500 per pupil, well above the statewide average
of $14,900.50 Although many Cambridge students
attend private schools, the majority (83.5 percent) of
our students are enrolled in our public schools.51
Despite this investment, Cambridge schools are not
sufficiently preparing black and Latino young people
with critical math and science skills. As shown in
FIGURES 9 AND 10, racial achievement gaps in math
and science, evident as early as 3rd and 5th grades,
continue into high school.
In 2015, 61 percent of black third-grade students in
Cambridge received scores of advanced or proficient
on standardized math tests. Fifty-nine percent of Latino
students met this mark. Both groups were far less
likely to be proficient or higher compared to white and
Asian students. Asian students were the most likely
to be proficient or higher (86 percent). The difference
for black students was 20 percentage points and for
Latino students, 22 percentage points.
Similarly, an 8th grade black student was 49 percentage
points less likely than a white student to be proficient
or advanced in science. The gap for Latino students
(48 percentage points) is similar. Cambridge’s racial
achievement gap in science is greater than that of the
state. The white-black science achievement gap among
8th graders across the state is 34 percentage points, as
compared to Cambridge’s gap of 49 percentage points.
49 Massachusetts Department of Elementary and Secondary Education, Cambridge Public School District Profile 2015 (Boston, Massachusetts: n.d.).50 Massachusetts Department of Elementary and Secondary Education, 2014-15 Per Pupil Expenditure Report (Boston, Massachusetts: n.d.).51 Massachusetts Department of Elementary and Secondary Education, 2014-15 School Attending Children Report (Boston, Massachusetts: n.d.).
Racial achievement gaps in math and science—knowledge critical for employment in the city’s technology-based economy—are evident as early as third grade and persist into high school and beyond.
FIGURE 9. Racial Achievement Gaps in Math in Cambridge Public Schools
% P
RO
FIC
IEN
T
OR
HIG
HE
R
020406080
100
Grade 3 Grade 5 Grade 8 Grade 10
Portion of Cambridge student’s scoring advanced or proficient in MCAS Math test. SOURCE: Massachusetts Department of Elementary and Secondary Education, 2015.
White, Non-Latino Black, Non-Latino
Latino Asian, Non-Latino
FIGURE 10. Racial Achievement Gaps in Science in Cambridge Public Schools
020406080
100
Grade 5 Grade 8 Grade 10
Portion of Cambridge students scoring advanced or proficient in MCAS Science test. SOURCE: Massachusetts Department of Elementary and Secondary Education, 2015.
White, Non-Latino Black, Non-Latino
Latino Asian, Non-Latino
% P
RO
FIC
IEN
T
OR
HIG
HE
R

22 Boomtown/Hometown
COLLEGE SUCCESSCambridge’s racial achievement gaps persist into college success, and are greater than those of comparable districts. The city’s racial achievement gaps
continue into higher education. According to the most
recent data available, only 29 percent of Cambridge’s black
9th graders move seamlessly toward any kind of college
degree within six years of graduating from high school.52 For
Latino students, 14 percent have such post-secondary suc-
cess. Both are less likely to seamlessly secure degrees than
their white and Asian classmates. The difference between
white and black students is 9 percentage points, and
between white and Latino students, 24 percentage points.
By contrast, Asian and white students have more compara-
ble degrees of success (35 percent of Asian students and
38 percent of white students achieve this standard).
Based on characteristics of enrolled students, the Framing-
ham district is a good point of comparison with Cambridge.
While 30 percent of Framingham’s black students and 16
percent of its Latino students move seamlessly toward a
college degree within six years of high school graduation,
in Cambridge those figures stand at 29 percent for black
students and 14 percent for Latinos.53 In fact, Framingham’s
overall success in moving its students seamlessly toward
college degrees in six years stands at 38 percent, com-
pared to Cambridge’s 31 percent.
ADULT DEGREE AT TAINMENTCambridge’s racial achievement gaps in primary and secondary school echo adult degree attainment. As shown in FIGURE 11, more than 80 percent of the
city’s white and Asian residents over the age of 25 have
bachelor’s degrees or higher. However, black and Latino
adults lag behind both white and Asian adults in possess-
ing bachelor’s degrees or higher. In 2014, less than a
third (31 percent) of black adults held at least a bachelor’s
degree; nearly 60 percent of Latino adults held at least
such a degree. There is nearly a 50 percentage-point
difference between white and black adults with at least a
bachelor’s degree. The portion of adults with some college
or an associate degree is also low in light of job market
demands, with a low of 8 percent for white adults to just
25 percent for blacks.
Racial achievement gaps are a concern nationwide.
Research shows that even the earliest learning and devel-
opment affects health, education, quality of life and civic
engagement in adulthood.54 Such gaps are even more nota-
ble in Cambridge given the significant investment in public
education and an economy hungry for skilled workers.
FIGURE 11. Degree Attainment Among Cambridge Adults
PE
RC
EN
T
0
20
406080
100
Some College or Associate Degree
Bachelor’s Degree or Higher
The portion of all Cambridge adults, aged 25 and above, with some college or an associate degree and the portion with at least a bachelor’s degree over the period 2010-2014. SOURCE: MAPC analysis of U.S. Census Bureau American Community Survey, 2010-2014 Five-Year Estimates.
White, Non-Latino Black, Non-Latino
Latino Asian, Non-Latino
CHAPTER THREE: The Downside of the Upside
52 The Massachusetts Department of Elementary and Secondary Education provides data on the portion of students who started their careers at the Cambridge Rindge and Latin School (CRLS) in 2004 who moved seamlessly toward any kind of college degree within six years of their high school graduation (whether from CRLS or elsewhere). These data do not have separate measures for students based on whether they received their high school diploma from their 9th grade school or elsewhere. This suggests care when enlisting these data as an absolute measure of CRLS performance.
53 The Massachusetts Department of Elementary and Secondary Education provide data on Success After High School for comparable districts based on the total enrollment (size), percentage of low income students, English Language Learners, and special education students enrolled, and district or school type (e.g., elementary school, middle school). DESE determined that Framingham is the highest performing of Cambridge’s comparable districts.
54 James Heckman, “The Economics of Inequality: The Value of Early Childhood Education,” American Educator, Spring 2000.

March 2017 Cambridge Community Foundation 23
CHAPTER THREE: The Downside of the Upside
The data presented in this chapter on demographics,
income, housing and education paint a picture of a suc-
cessful city and a dynamic economy. With jobs to spare in
the knowledge industry, Cambridge is attractive to young
educated workers—almost half of the city is 20 to 39
years old, and 75 percent of the city’s adults have college
degrees. The booming economy is helping to expand the
city’s high-income population.
In a city of highly educated adults, public education,
regarded by Americans as the great equalizer, is not
keeping pace with the region in terms of sending the city’s
students seamlessly to a college degree, and the racial
and ethnic achievement gaps common to urban settings
are seen in Cambridge as well. A large proportion of
students do not speak English at home. And poverty, too,
reflects the realities of other cities: a significant percentage
of Cambridge’s children are poor.
As in other cities with thriving innovation economies,
income inequality is growing, the cost of housing is rising
dramatically, and long-time residents are wondering if
their children can afford to live in Cambridge. The city’s
low home ownership impedes one of the principal ways
for households to accumulate wealth to pass on to the
next generation.
Cambridge is a wealthy city—with poverty in the midst
of plenty. However, as pointed out in the previous chap-
ters, the city is rich in resources, and the private sector’s
immense investment in new industries, the public sector’s
generous support of education, the nonprofit sector’s
long tradition of providing assistance to the low-income
people, the presence of great institutions of higher educa-
tion, and the commitment of so many in the city to social
justice represent powerful tools in any effort to share the
city’s new prosperity.
Engineering for the Whole Family
Ingenuity reigns supreme at the annual MIT event called
FAT—for Friday after Thanksgiving—as Cambridge students
create a chain reaction that propels a single golf ball through
a maze of ingenious home-made contraptions to the rousing
cheers of parents and friends. The brainchild of Arthur Ganson,
a star of the MIT Museum, and Discovery Channel host
Jeff Lieberman, FAT is one of those experiences that make
Cambridge Cambridge.
Photo
by S
amara V
ise/Co
urtesy Mit M
useum
Public education, regarded by Americans as the great equalizer, is not keeping pace with the region in terms of sending the city’s students seamlessly to a college degree,

24 Boomtown/Hometown
Where Do We Go from Here?
This report opens with a description of Cambridge’s
current economic boom, attributable to the city’s historic
stress on education, a culture of openness to innovation,
and a well-run city government as well as to the massive
private investment in new technologies. While acknowl-
edging a broad range of changes in Cambridge in the last
several years, the report focuses on three aspects of the
city’s life: income, housing and education, highlighting
issues in each of these areas that have long-term implica-
tions for the city’s residents and their children.
These aspects of the city’s communal life are most urgently
in need of addressing by the full community. As stated in
the Preface, we bring together this information in the hope
of generating a new action agenda to address growing
concerns—concerns that represent both a moral and an
economic imperative in this privileged city.
As Cambridge’s community foundation, we urge a partic-
ular focus in examining and acting upon the data in the
report: that of equity. Our city is booming, but it is clear
that the prosperity of the new era is being shared very
unequally across the full community. As inequality grows
in Cambridge and around the country, the importance of
addressing these issues and considering new approaches
to solving long-standing problems becomes more urgent.
Income inequality is a defining issue of our times. In
Cambridge, the gap between wealth and poverty is
dramatic—with some high-income households bringing
in more than $500,000 a year, while nearly 5,000 working
households earn less than $40,000. This disparity, which
breaks down dramatically in terms of race and ethnicity,
threatens to polarize our community not only in terms
of wealth and poverty, but along racial and ethnic lines.
The rapid rise of housing costs is making it difficult for
low- and middle-income households to live in Cambridge.
An increasing number of low-income households in
Cambridge now spend half or more of their income on
housing, and a growing portion of middle-income Can-
tabrigians spends between 30 and 49 percent of their
household income on housing. The housing cost burden,
too, breaks down along racial/ethnic lines, with a heavier
burden on black and Latino households than on white
and Asian households.
In addition, the future is clouded for the city’s black
and Latino children by persistent racial achievement
gaps in the city’s public schools. We must prepare our
children more adequately to participate in the city’s
knowledge-based economy.
The disparities in income, housing and education captured
in these data raise a number of questions for Cambridge
residents and other local stakeholders. Is there a way for a
community’s increasing prosperity to be accessible to the
full breadth of its citizens? Cambridge has grappled suc-
cessfully with social inequalities in the past. Can it develop
an answer to this question, which is becoming a question
for many communities in our country?
Photo
by R
om
ana Vysatova
March 2017 Cambridge Community Foundation 25
Perhaps the answer to these larger questions lies
in developing smaller, more practical questions:
• What would it take to build connections and develop
systems into the innovation economy for our children,
youth and adults?
• What can be done to build income, assets and
wealth equity? How might we retain our middle class
working households, who so often form the glue of a
community?
• How might we deal with the linked issues of housing
and transportation that enable housing choice in the
city and the region to feed the needs of the economy
and provide access to opportunity?
• How can the city’s nonprofit sector work with city
government, universities, and the private sector in
new partnerships that would build the skills of the local
workforce to benefit both workers and employers?
These are important considerations. We are a small
city, and our problems are manageable. While some of
the challenges we face may require a regional response,
Cambridge’s dominant position in the new technology
economy requires that we engage with the cities and
towns beyond our borders to find solutions. We have the
opportunity to create a community where prosperity is
shared and to become a model for the dozens of cities
across the country facing the unexpected challenges
of success.
If Cambridge is to take the lead in tackling the issues
now affecting our community, it needs to begin with a
shared understanding of the challenges and opportunities.
With the assistance of the City of Cambridge and the
Metropolitan Area Planning Council, this report seeks to
set out the key indicators of our current situation. These
will serve as a basis for discussion and as the foundation
of a new, shared action agenda.
The Cambridge Community Foundation has deep-rooted
relationships and a long history as a key stakeholder in
this community. It is our belief that this city has the civic
capacity and the generosity of spirit to confront the down-
side of the great upside that is carrying the city’s creativity
to new heights. It has the resources, the brainpower, the
belief in social justice, and the activist tradition to develop
solutions to today’s problems. Please join us in a discussion
to shape our community’s future.
Examining income, housing and education in Cambridge
today, this report reveals a city facing critical questions about
equality and opportunity. The answers to these questions
will shape the city’s future.

26 Boomtown/Hometown
A rich and complex urban mix defines Cambridge’s appeal. The flavors of the world are available in cafés and restaurants, and shops draw foot traffic.
Central Square is a cultural hub and a flourishing business district.
Photo
by R
ichard H
ow
ard

March 2017 Cambridge Community Foundation 27
Acknowledgements
The Cambridge Community Foundation wishes to thank the donors who make the work of the Foundation possible.
We also wish to thank the special advisory panel whose members gave so generously of their time and expertise in
developing this report. Their many thoughtful insights and suggestions are reflected throughout the text, although
final responsibility for content rests with the Foundation.
Dennis Benzan
Attorney; former Cambridge City Councilor
Clifford Cook
Planning Information Manager, City of Cambridge
Susan Flannery
Board Member, Cambridge Public Library
Lee Gianetti
Director of Communications, City of Cambridge
Richard A. Harriman
Chairman of the Board, Cambridge Community Foundation
Lori Lander
Overseer, Cambridge Community Foundation; Artist, Activist
David Luberoff
Associate Director, Joint Center for Housing Studies, Harvard University
Ceasar McDowell
Professor of the Practice of Community Development, MIT Department of Urban Planning
Ana Patricia Muñoz
Assistant Vice President, Community Development Research, Federal Reserve Bank of Boston
Mina Reddy
Overseer, Cambridge Community Foundation; former Executive Director, Community Learning Center
Denis K. Sheahan
Trustee, Cambridge Community Foundation; President and CEO Cambridge Trust Company
Nan Stone
Overseer, Cambridge Community Foundation
We are also grateful to the Cambridge Nonprofit Coalition, Kendall Square Association and the City of Cambridge for their comments and contributions. We are indepted to Jessie Partridge and Tim Reardon of MAPC for their data analysis and expertise.
Photo
provid
ed b
y Cam
brid
ge N
onp
rofit N
etwo
rk
Learning about volcanoes is awesome!

28 Boomtown/Hometown
CCF Trustees and Overseers
Cambridge Community Foundation is governed by a Board of Overseers. Four overseers, identified as trustees,
represent the Bank of America and the Cambridge Trust Company, which are responsible for the investment of
the Foundation’s principal.
Richard Harriman, Chairman
Elizabeth Reid, Treasurer
Linda Chin
Lauren Cosulich
Michael Duca, Trustee
C. Fritz Foley
Melville Hodder
Bob Hower
Phil Johnson
Rosemarie Torres Johnson
Lori Lander
Dora Lewin, Trustee
Martha McKenna
Beth Milkovits
Paul Parravano
Mary Power
Mina Reddy
Gail Roberts
James Roosevelt Jr., Esq., Trustee
Denis Sheahan, Trustee
Nan Stone
Rev. Lorraine Thornhill
Senior AdviserWilliam Polk
Honorary OverseersBetty Bardige
Helen Moulton
Patricia Pratt
The Possible Project in Central Square brings young people together, trains them to be entrepreneurial-minded problem solvers and helps them cultivate the
skills and mindset needed to thrive in the innovation economy.
Photo
pro
vided
by T
he Po
ssible P
roject

Our city is booming, but it is clear that the prosperity of the new
era is being shared very unequally across the full community.
We believe that Cambridge is a city with the resources, the
brainpower, the belief in social justice, and the activist tradition
to develop solutions to today’s problems. Please join us in a
discussion to shape our community’s future.
Ph
oto
by
Ro
man
a V
ysat
ova


