

Border’s Group, Inc. Data
Border’s Group, Inc. Data StoreInfo table (tblStoreInfo) TitleInfo table (tblTitleInfo) SalesInventoryInfo table (tblSalesInventoryInfo)
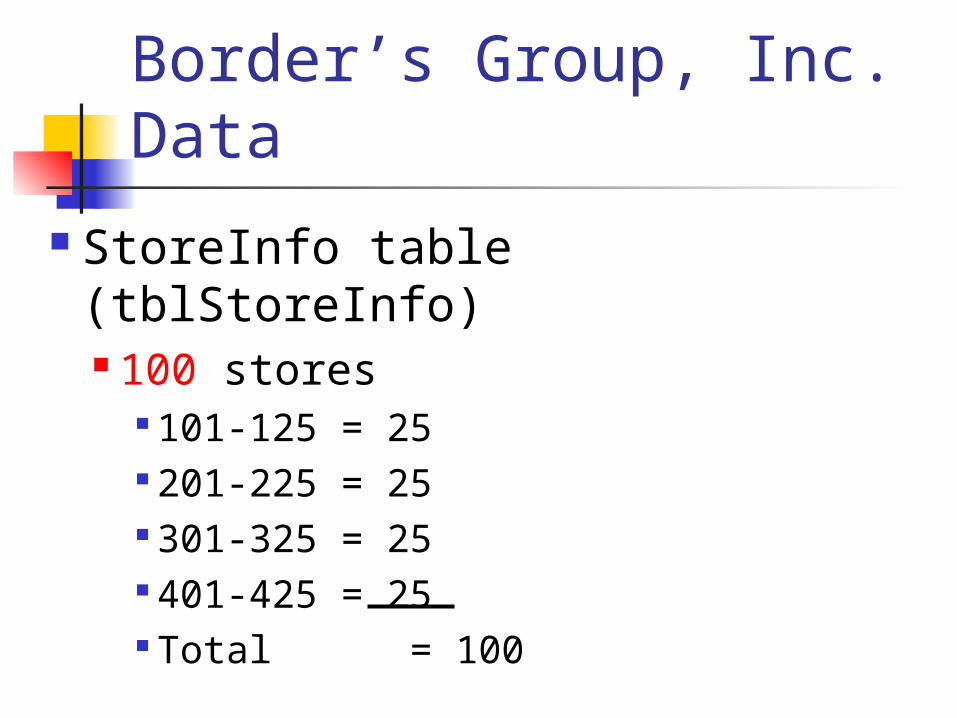
Border’s Group, Inc. Data
StoreInfo table (tblStoreInfo) 100 stores
101-125 = 25 201-225 = 25 301-325 = 25 401-425 = 25 Total = 100

Border’s Group, Inc. Data
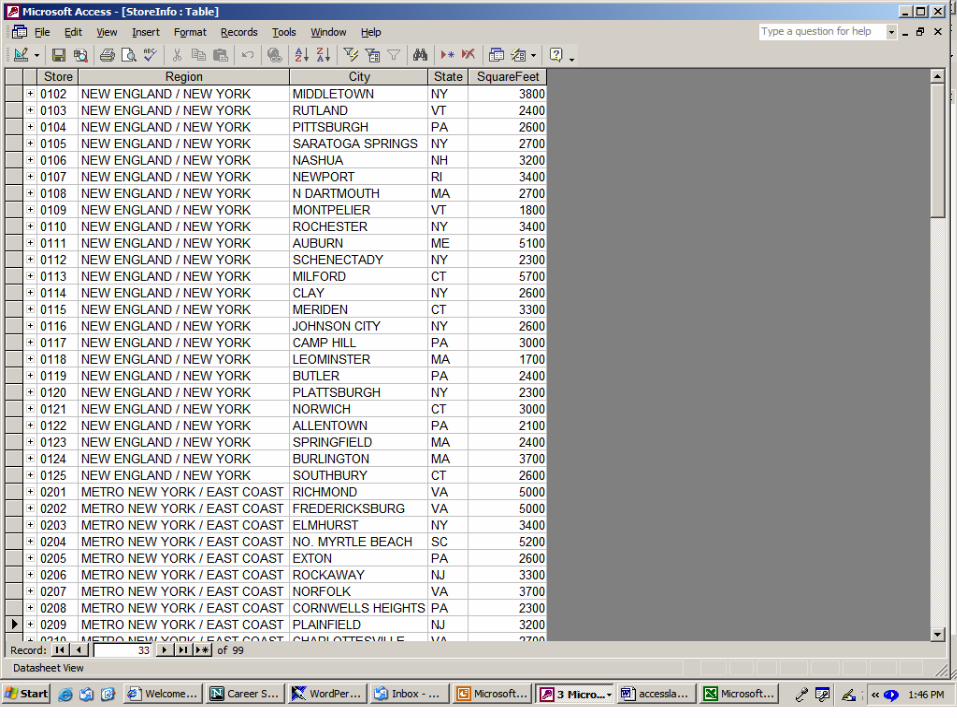
Stores are classified into 4 regions New England/New York Metro New York/East Coast North West/Big Sky West Coast/Southwest
Each store # also has as city/state East store # has a size (sq. ft.)

Border’s Group, Inc. Data
TitleInfo Table 100 book titles
SKUAuthorCost price Initial Retail


Border’s Group, Inc. Data
SalesInventoryInfo Table 4 Weeks beginning 12/11 to 1/7
12/11 – 12/17 = Week #112/18 – 12/24 = Week #212/25 – 12/31 = Week #31/1 – 1/7 = Week #4

Border’s Group, Inc. Data
SalesInventoryInfo Table Each SKU listed by store and week For any given SKU in a particular store for each of the 4 weeks:
UnitsInventoryUnitSalesNetDollarSales

Access
What is a query? A question represented in a way Access can understand
Can be developed in Design View or Wizard

Access
Criteria Conditions that records must meet for selection in a query
Query for all stores in the state of Michigan (tblStoreInfo)
None……try California Sort by Sq. feet

Access
Design view query – adding fields to the query Double click Click and drag Select from drop down box

Access
Wizard – select Select table to query Select fields, continue View in design view Define criteria Query


