

1
Brazil Beyond the
International Crisis
October 2009
Henrique de Campos Meirelles
2
Economic Fundamentals and
Anti-Crisis Measures

3
Inflation
Source: Central Bank of Brazil
Jan 04
Jan 05
Jan 06
Jan 07
Jan 08
Jan 09
Jan 10
Sep 09
4,34% 2009
4,30%
% a
.a.
0
2
4
6
8
10 IPCA (12-month cumulative) market
expectation

4
Real Interest Rate
Sources: BM&F Bovespa and Central Bank of Brazil (Focus)
4
6
8
10
12
14
16
18
Jan
03
Jan
04
Jan
05
Jan
06
Jan
07
Jan
08
%
Aug 08
8.9%

5Sources: Central Bank of Brazil
% o
f G
DP
Net Public Debt
02 03 04 05 06 07 08
22
27
32
37
42
47
5251,3
53,5
48,2 48,045,9
43,9
38,8
6Source: Central Bank of Brazil
50
100
150
200
US
$ b
llio
n
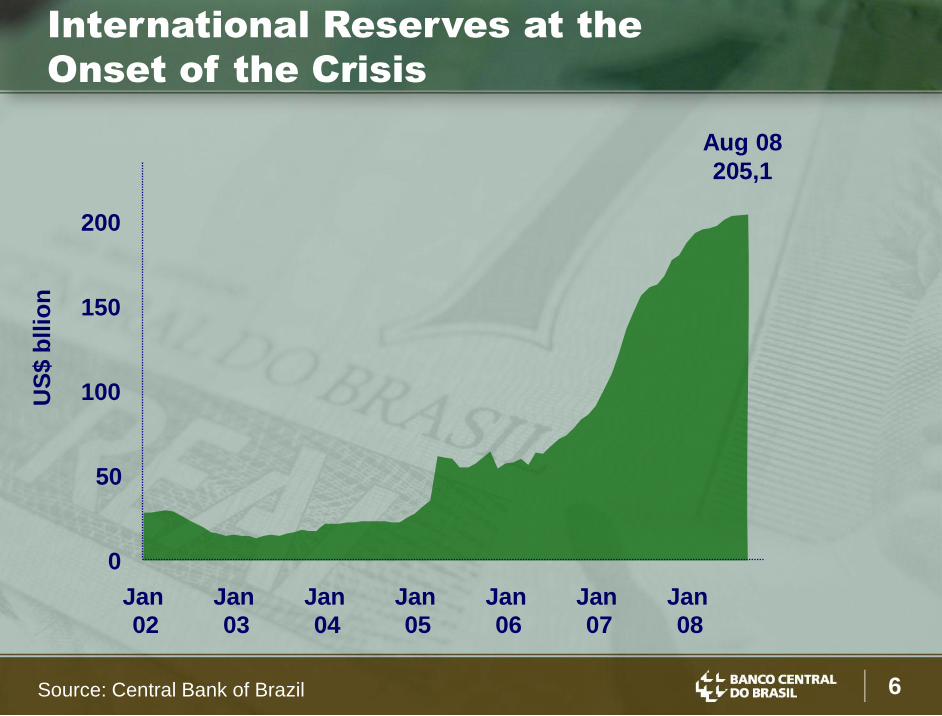
Aug 08
205,1
0
Jan
02
Jan
03
Jan
04
Jan
05
Jan
06
Jan
07
Jan
08
International Reserves at the
Onset of the Crisis

7
0
1
2
3
4
5
-2.0
-1.5
-1.0
-0.5
0.0
0.5
1.0
% p
.a.
avg. 90’s avg. 2004-2008
GDP growth Current Account Balance
avg. 90’s avg. 2004-2008
% o
f G
DP
Brazil
Brazil at the Onset of the Crisis:
Better Prepared than in the Past
Source: Central Bank of Brazil
0
5
10
15
20
25
% o
f G
DP
Net External Debt
avg. 90’s avg. 2004-2008
(-1.8% in 2008)

8
Domestic Demand and Supply
Source: IBGE
%
9.3
domestic demand GDP
change year-over-year
-4.5
-3.0
-1.5
0.0
1.5
3.0
4.5
6.0
7.5
9.0
1Q03
3Q03
1Q04
3Q04
1Q05
3Q05
1Q06
3Q06
1Q07
3Q07
1Q08
3Q08
6.8

9
Correct Diagnosis
1) credit became scarce
About 20% of the total credit had external funding
2) crowding out of credit
Domestic companies which were funded in the foreign market
started to be funded by domestic banks
3) Companies in derivative markets helped to deteriorate credit
conditions
4) Lack of liquidity in the interbank market

10
Correct Diagnosis: Consequences
1) Liquidity squeeze in local and foreign currencies
2) Contraction of credit to exporters
3) Slowdown of economic activity in industries dependent on
credit
4) Severe stress of small and medium banks
5) Large banks’ exposure with companies exposed to
exchange rates derivates
11
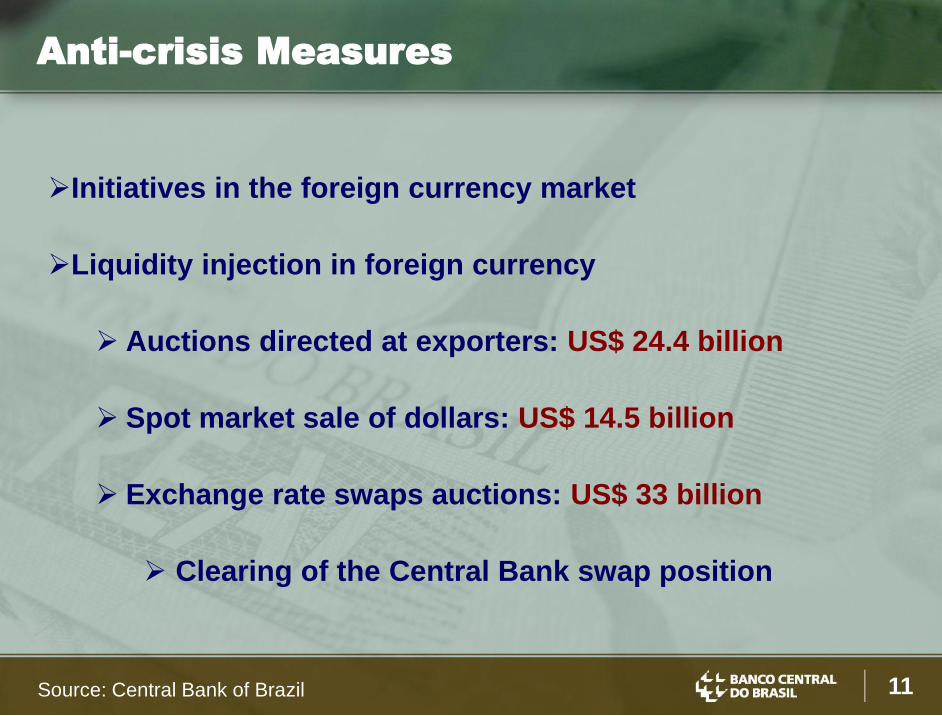
Initiatives in the foreign currency market
Liquidity injection in foreign currency
Auctions directed at exporters: US$ 24.4 billion
Spot market sale of dollars: US$ 14.5 billion
Exchange rate swaps auctions: US$ 33 billion
Clearing of the Central Bank swap position
Anti-crisis Measures
Source: Central Bank of Brazil
12
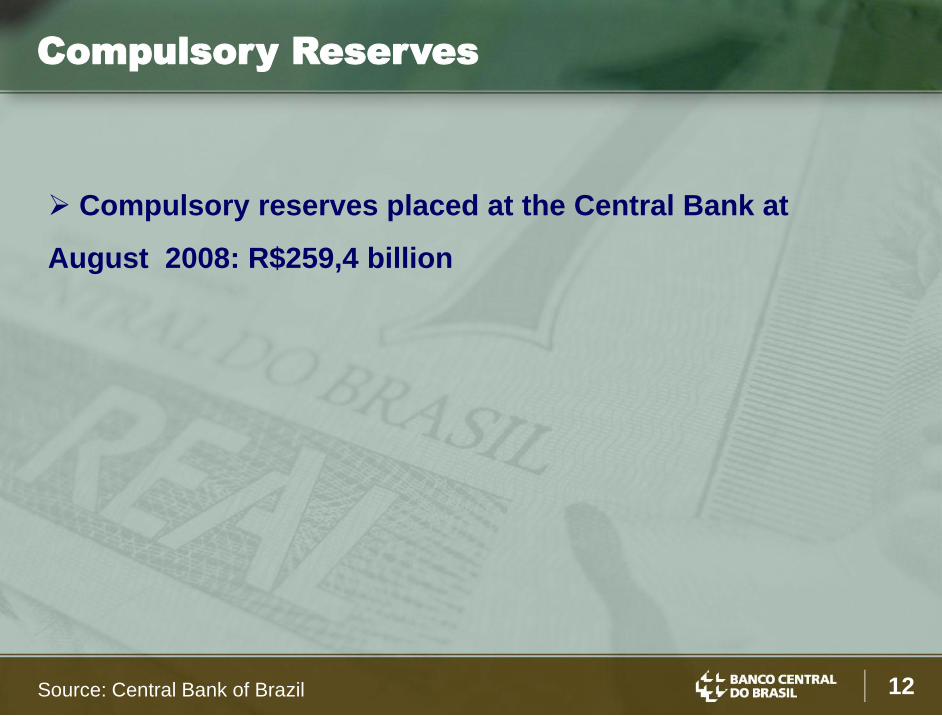
Compulsory reserves placed at the Central Bank at
August 2008: R$259,4 billion
Compulsory Reserves
Source: Central Bank of Brazil

13
Liquidity injection in local currency
Compulsory reserves reduction: R$ 99.8 billion
Liquidity for smaller institutions: R$ 42.2 billion
Authorization of Bank Deposit Receipt with up to a
R$20 million guarantee by FGC, the national private
deposit insurance institution
Anti-crisis Measures
Source: Central Bank of Brazil

14
Credit Granting (Daily Average)R
$ b
illi
on
average Jan-Sep 08
7.1 7,3
5.5
5.9
6.3
6.7
7.1
7.5
Jan08
Mar08
May08
Jul08
Sep08
Nov08
Jan09
Mar09
May09
Jul*09
Sep09
average Mar-Sep 09
7.1
Source: Central Bank of Brazil
15
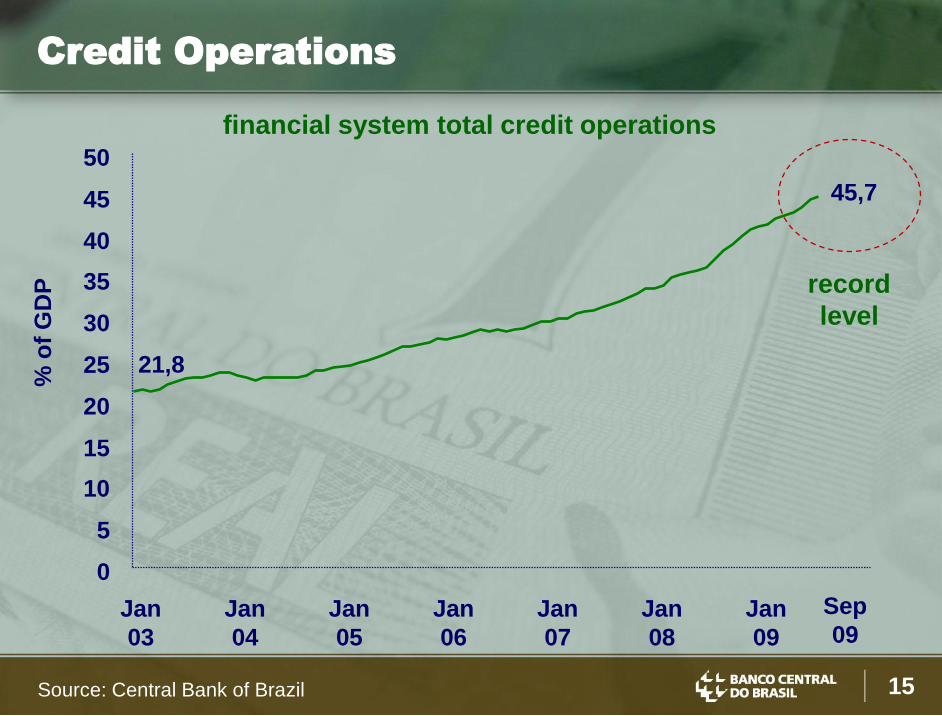
financial system total credit operations
21,8
0
5
10
15
20
25
30
35
40
45
50
Jan
03
Jan
04
Jan
05
Jan
06
Jan
07
Jan
08
Sep
09
% o
f G
DP
Jan
09
Credit Operations
45,7
record
level
Source: Central Bank of Brazil

16
0
50
100
150
200
Jan
02
Jan
03
Jan
04
Jan
05
Jan
06
Jan
07
Jan
08
Jan
09
US
$ b
illi
on
Nov 4th 09
233.2Aug 08
205.1highest
level
International Reserves
Source: Central Bank of Brazil
17
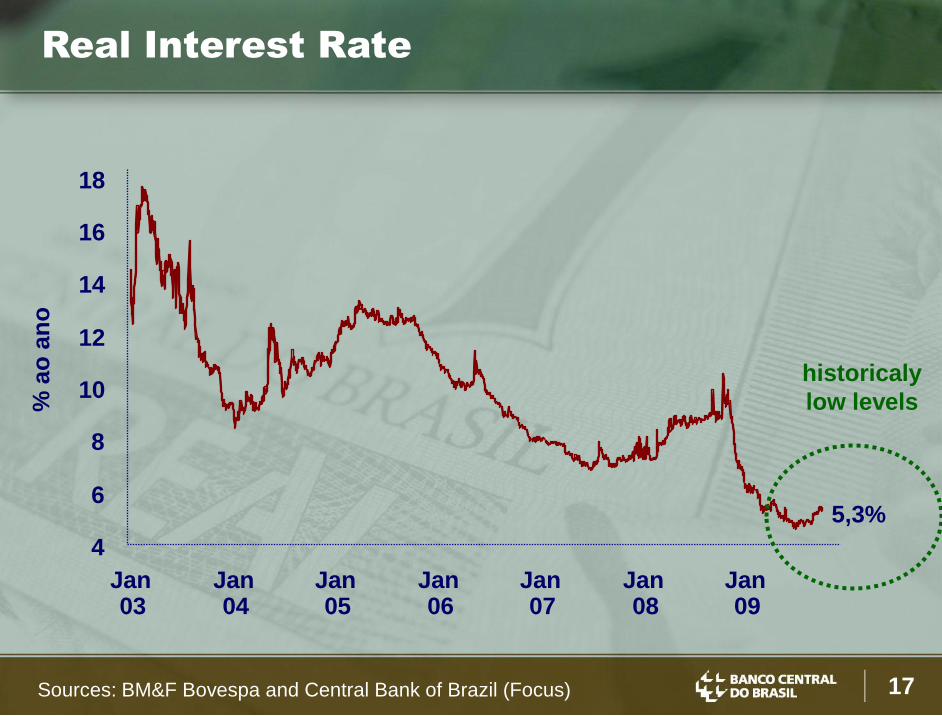
Real Interest Rate
4
6
8
10
12
14
16
18
Jan03
Jan04
Jan05
Jan06
Jan07
Jan08
Jan09
% a
o a
no
5,3%
historicaly
low levels
Sources: BM&F Bovespa and Central Bank of Brazil (Focus)

18Sources: Central Bank of Brazil
22
27
32
37
42
47
52
02 03 04 05 06 07 08 09 10 11 12 13
% o
f G
DP
forecast
Net Public Debt
51,3
53,5
48,2 48,045,9
43,9
38,8
44,042,0
39,438,0
36,0

19
Banking System Soundness and
Capital Markets

20
18.5 17.4 17.8 17.3
16.4 17.2
0
4
8
12
16
20
2004 2005 2006 2007 2008 Jul 09
international
standard (8%)
regulatory
minimum (11%)
%Bank-Capital Adequacy: Basel Index
relation between capital and risk weighted assets
Source: Central Bank of Brazil

21
Central Bank of Brazil Comprehensive
Approach
Source: Central Bank of Brazil
financial
regulation
monetary
policy
financial
supervision
Comprehensive approach strengthens financial stability

22
Broad regulation: 21 modalities of financial institutions supervised by
the Central Bank of Brazil
11. Security Distribution Companies;
12. Real Estate Credit Companies;
13. Savings and Loan Associations;
14. Mortgage Companies;
15. Cooperative Companies;
16. Caixa Econômica Federal;
17. Savings Banks;
18. National Social and Economic Development
Bank (BNDES);
19. Consórcio Management and their groups;
20. Foreign Exchange Bank;
21. Financial institutions in liquidation process.
1. Multiple Banks;
2. Commercial Banks;
3. Development Banks;
4. Development Agencies;
5. Investment Banks;
6. Credit, Finance and Investment
Companies;
7. Microcredit Companies;
8. Leasing Companies;
9. Stock and Bond Brokerage
Companies;
10. Exchange Brokerage Companies;
Financial System Supervision
Source: Central Bank of Brazil

23
Bad-debt provisions take into consideration expected
losses, and not only the possible payment in arrears;
Capital requirements are applied in consolidated terms,
including off-balance sheet exposures;
Daily monitoring of both liquidity and market risk.
Financial System Supervision
24
The Central Bank monitors over-the-counter operations
performed by financial institutions;
The Central Bank receives information from all Clearing
Houses.
Financial System Supervision:
OTC Operations
25
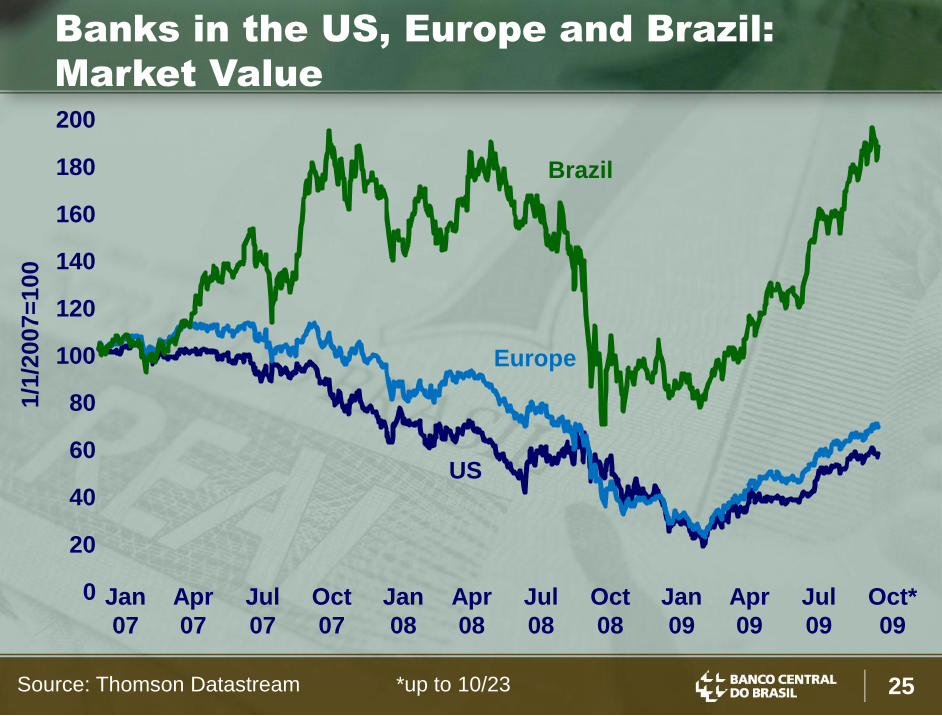
Banks in the US, Europe and Brazil:
Market Value
Source: Thomson Datastream *up to 10/23
1/1
/2007=
100
0
20
40
60
80
100
120
140
160
180
200
Jan
07
Apr
07
Jul
07
Oct
07
Jan
08
Apr
08
Jul
08
Oct
08
Jan
09
Apr
09
Jul
09
Oct*
09
Brazil
Europe
US

26
Capital Markets
Source: CVM *in the year through September
**in the year through Oct 23
R$ b
illi
on
primary issues of securities
equities** debentures others
0
20
40
60
80
100
2000 2001 2002 2003 2004 2005 2006 2007 2008 2009*
secondary market
2009 through Oct 23:
Redecard R$2.2 bi
Visanet R$8.4 bi
MRV R$0.1 bi
BR Malls Part. R$0.4 bi
Light R$0.8 bi
Hypermarcas R$0.2 bi
Natura R$1.5 bi
Tivit R$0.7 bi
PDG Realty R$0.3 bi
Gol R$0.4 bi
Brookfield Inc. R$0.1 bi
Total R$15.1 bi

27
Stock of Foreign InvestmentU
S$ b
illi
on
Sources: BCB and CVM
international
reserves
equities
(Bovespa)0
30
60
90
120
150
180
210
240
270
Jan
07
Apr
07
Jul
07
Oct
07
Jan
08
Apr
08
Jul
08
Oct
08
Jan
09
Apr
09
Aug
09
fixed income
investment

28
The New Macroprudential Approach
The Basel Committee for Bank Supervision established a five
key points strategy:
o Strengthening the regulatory capital framework
o Increasing banks’ liquidity buffers
o Enhancing bank governance, risk management and
supervision
o Improving market transparency
o Cross-border supervisory cooperation for internationally
active banks
The objective is to promote a banking sector that is more
resilient to future periods of economic and financial stress and
help reduce systemic risk
29
Industrial Production, Sales and
Employment
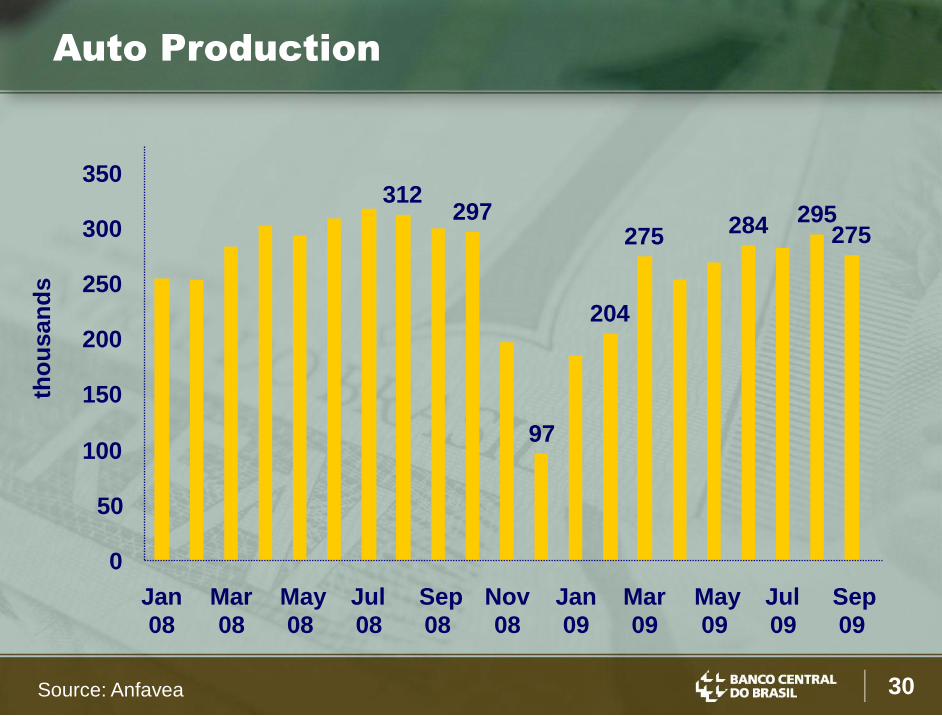
30
312297
97
204
275 284 295275
0
50
100
150
200
250
300
350
Jan
08
Mar
08
May
08
Jul
08
Sep
08
Nov
08
Jan
09
Mar
09
May
09
Jul
09
Sep
09
Auto Production
Source: Anfavea
tho
usan
ds

31
Jan
07 =
100
50
60
70
80
90
100
110
120
130
Jan 08
Mar 08
Mai 08
Jul 08
Set 08
Nov 08
Jan 09
Mar 09
Mai 09
Jul 09
Set 09
Sources: IBGE and Central Bank of Brazil (Focus)
Industrial Production
seasonally adjustedforecast

32Source: IBGE
índ
ice d
e 0
a 1
00
58,5
54,4
60,159,4 60,462,0
58,1
52,5
47,4
58,2
65,9
25
30
35
40
45
50
55
60
65
1T
06
2T
06
3T
06
4T
06
1T
07
2T
07
3T
07
4T
07
1T
08
2T
08
3T
08
4T
08
1T
09
2T
09
3T
09
4T
09
49,4
Oct 08: all
sectors with
indexes
above 50
seasonally adjusted
Industrial Confidence
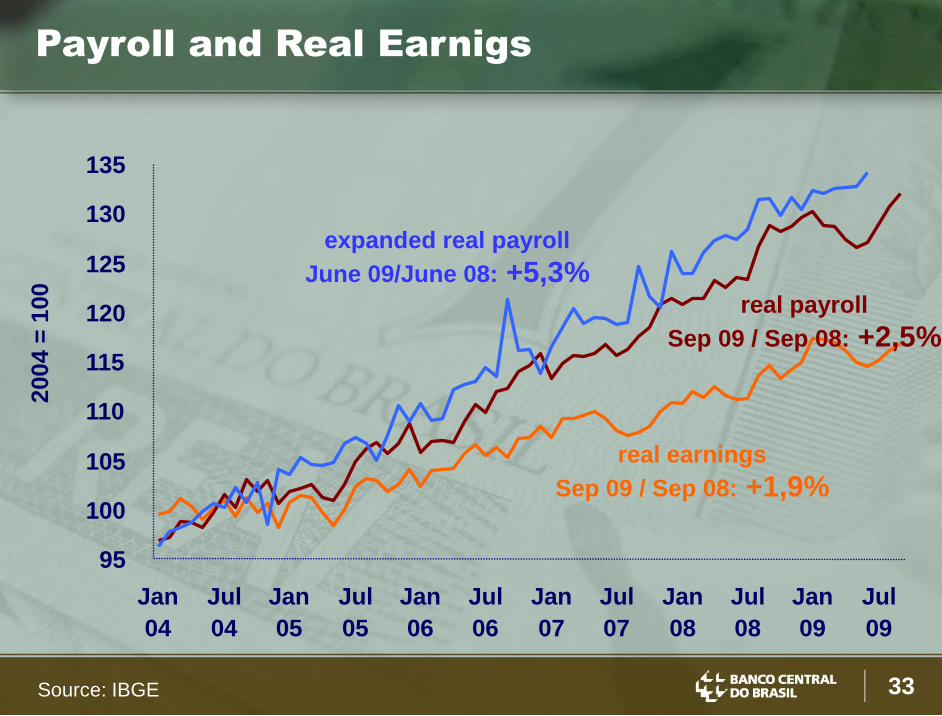
33Source: IBGE
95
100
105
110
115
120
125
130
135
Jan
04
Jul
04
Jan
05
Jul
05
Jan
06
Jul
06
Jan
07
Jul
07
Jan
08
Jul
08
Jan
09
Jul
09
200
4 =
100
real earnings
Sep 09 / Sep 08: +1,9%
real payroll
Sep 09 / Sep 08: +2,5%
Payroll and Real Earnigs
expanded real payroll
June 09/June 08: +5,3%

34
95
100
105
110
115
120
Jan
06
Jul
06
Jan
07
Jul
07
Jan
08
Jul
08
Jan
09
Jul
09
200
6 =
100
Expanded Real Payroll and
Supermarket Sales
expanded real
payroll
supermarket
sales
Sources: ABRAS and IBGE (seasoonally adjusted)
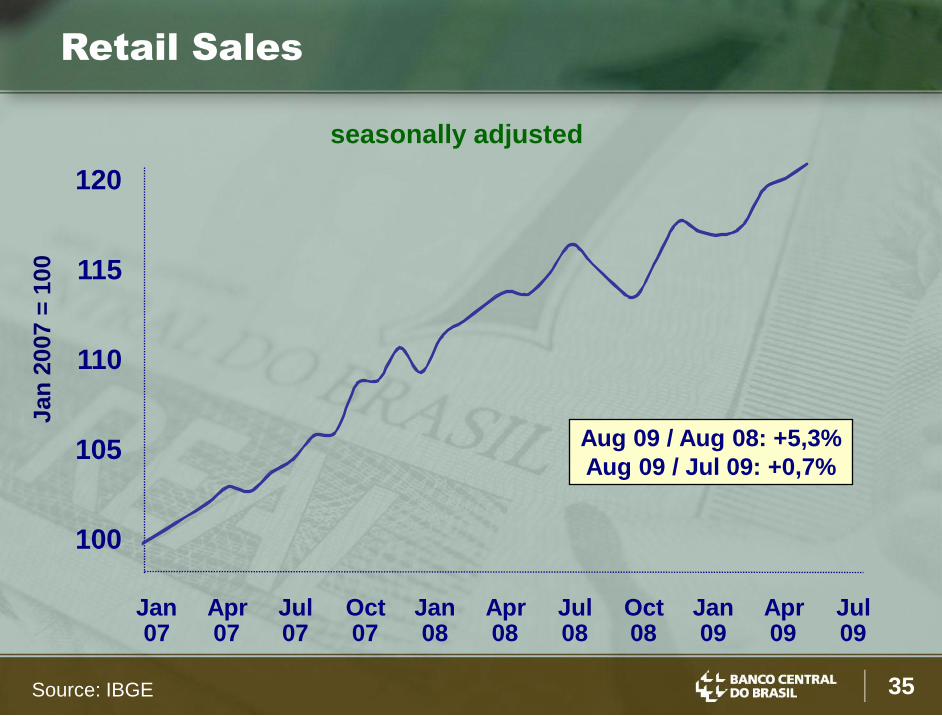
35Source: IBGE
seasonally adjusted
Retail Sales
Jan07
Apr07
Jul07
Oct07
Jan08
Apr08
Jul08
Oct08
Jan09
Apr09
Jul09
Aug 09 / Aug 08: +5,3%
Aug 09 / Jul 09: +0,7%
Jan
2007 =
100
100
105
110
115
120

36Source : IBGE
%
7,7
6
7
8
9
10
11
12
13
Jan Fev Mar Abr Mai Jun Jul Ago Set Out Nov Dez
2004
2005
2006
2007
2008
2009
Unemployment Rate
37
Job Creation
Source: MTE (CAGED)
8.7 million formal jobs created since January 2003
800 thousand jobs lost during the crisis
1 million jobs created since February

38Source: CNI (INEC)
Consumer Confidence
116.0
114.7
111.4 111.0111.5
109.8
115.6
109.8
106.3
110.3
115.4
100
102
104
106
108
110
112
114
116
3Q
2006
4Q 1Q
2007
2Q 3Q 4Q 1Q
2008
2Q 3Q 4Q 1Q
2009
2Q 3Q
2001 =
100

39
GDP Recovery

40
GDP Growth
85
87
89
91
93
95
97
99
101
103
105
1st Q
2008
2nd Q 3rd Q 4th Q 1st Q
2009
2nd Q
United States
Euro Area
Japan
Brazil
South Korea
quarterly GDP seasonally adjusted
4th
Qu
art
er
2008 =
100
Source: Bloomberg

41
Growth with Social Inclusion

42
Lower Income and Middle Class
Source: FGV; lower = E class, middle = C class.
42.4 41.644.1 45.5
48.250.2
52.3 53.2
29.2 30.427.9
24.4 23.020.8
18.4 18.3
0
10
20
30
40
50
60
Jun
02
Jun
03
Jun
04
Jun
05
Jun
06
Jun
07
Jun
08
Jun
09
middle income
lower level income
% o
f p
op
ula
tio
n

43Fonte: FGV-CPS
Income Inequality
0,6001
0,5937 0,5947 0,5957
0,58860,5829
0,57170,5680
0,5620
0,5546
0,50
0,52
0,54
0,56
0,58
0,60
98 99 00 01 02 03 04 05 06 07
Gini coefficient
44
November 2009
Henrique de Campos Meirelles


