

Detections of illegal border crossings
Frontex, the EU border surveillance agency, collects inter alia data on detections of illegal crossings of the EU’s external borders by national border-control authorities. External borders are borders between Member States and third countries as well as between Schengen Associated Countries (e.g. Norway, Iceland and Switzerland) and third countries. EU law does not provide for the regulated arrival of asylum-seekers, so their entry into EU territory is in most cases irregular, as they travel without the necessary documen-tation and/or use unauthorised border-crossing points. Il-legal border crossings therefore include both categories, irregular immigrants and possible future asylum-seekers.
The bar chart shows the illegal border crossings by third-country citizens via sea or land routes. In 2014 there was an increase almost three fold, in com-parison with 2013, due to a large in-crease in border crossings by citizens of Syria, Afghanistan and Eritrea. The map shows the routes of illegal entries in the year 2014. The Central Mediterranean route (Italy and Malta) is the most used, with 171 000 detec-tions - an increase of more than four times compared to 2013. The line chart within each box shows the trend over the period 2009 - 2014.276
AfricaWestern
Mediterranean
170 757Central
50 831Mediterranean
Eastern
7 842Mediterranean
Western
1 270BorderEastern
43 357BalkansWestern
8 336Albania - Greece
Circular route
Routes of illegal border crossings (2014)
0
50000
100000
150000
200000
250000
300000Sea borders
Land borders
2014201320122011201020090
50
100
150
200
250
300
2009 2010 2011 2012 2013 201457 90 70 49 47 38
47 1471
2360
245In 1 000sSea bordersLand borders
Irregular immigrants are third-country nationals who do not fulfil, or no longer fulfil, the conditions of entry as set out in Article 5 of the Schengen Borders Code or other conditions for entry, stay or residence in that Member State. In contrast, asylum-seekers are persons claiming international protection due to the risk of persecution in their home country. For data on asylum-seekers in the EU, please see our Info-graphic Asylum in the EU: Facts and Figures. The EU’s legal framework for irregular immigration is scattered over many legal instruments. Those which apply at the point of a migrant’s arrival focus on border management, and prevention of irregular immi-gration through cooperation with countries of origin and transit. For further information, please see our Briefing EU legal framework on asylum and irregular immigration ‘on arrival’.
Irregular immigration in the EU: Facts and Figures
EPRS | European Parliamentary Research ServiceAuthor: Giulio Sabbati and Eva-Maria PoptchevaMembers’ Research ServicePE 554.202
BriefingApril 2015

Number of persons refused entry at the EU’s external borders (2014)
Persons refused entry to the EU are third-country citizens who have been formally refused entry to the territory of a Member State. Each person is counted only once, no matter the number of refusals issued to that person. The reasons of refusal can be different, inter alia, having a false or invalid visa, residence permit or travel document; purpose and condition of stay not justified, or other reasons established in the Schengen Borders Code. The bar chart shows the number of persons refused entry by Member States in 2014. The pie chart divides the refus-als according to border type. Spain has the highest number of entry refusals, with 97% of the citizens refused entry being Moroccans coming over the land border. Data for Poland, Finland, Portugal and Sweden are missing and this is reflected in the total EU num-ber. For 2013, Poland reported 40 385 persons refused entry. It ranked second after Spain in entry refusals, with a large number of people coming from Russia, Ukraine and Georgia, accounting for 87% of the total refusals in Poland. The EU total for the year 2013 was 326 320 persons.
0
5000
10000
15000
20000
LUDKNLMTCZCYSKATEEBELVBGIELTRODESIELITHRFRHUUKES
0
50000
100000
150000
200000
LUDKNLMTCZCYSKATEEBELVBGIELTRODESIELITHRFRHUUKES
0
5 000
10 000
15 000
150 000
ES UK
HU FR HR IT EL SI DE RO LT IE BG LV BE EE AT SK CY CZ MT NL
DK LU
200 000
172
185
15 9
05
13 1
95
11 3
65
8 64
5
7 00
5
6 44
5
4 41
0 3 60
5
3 58
0
3 45
0
2 47
5
1 93
0
1 82
5
1 53
5
695
455
455
425
330
275
95 85 5
Provisional total number of persons refused entry to the EU in 2014: 260 375
Land borderAir borderSea border
Sea border
Air border
Land border
81%
16%3%
Top 10 nationalities of persons refused entry in the EU (2014)
Sea border
Air border
Land border
OtherFormer Yugoslav Republic of Macedonia, theUnited StatesAlgeriaTurkeyRussiaUkraineBosnia and HerzegovinaSerbiaAlbaniaMorocco
Morocco Albania Serbia Bosniaand
Herzegovina
Ukraine Russia Turkey Algeria US Former Yugoslav
Republic of Macedonia
Others
168 680 14 145 9 315 4 895 4 850 4 535 3 525 2 760 2 640 2 465 42 565
The following infographic shows the top 10 countries of nationality of persons refused entry to the EU28 in 2014. 65% of all third-country nationals refused entry were Moroccan. As mentioned above, data for Poland for 2014 is missing. In 2013, some 28 000 Russian and Ukranian nationals were refused entry to Poland.
Members’ Research Service Page 2 of 4
Irregular immigration in the EU: Facts and FiguresEPRS

Number of persons found to be illegally present in EU Member States (2014)
Persons found to be illegally present on EU territory are third-country nationals who have been detected by Member States’ authorities and have been determined not to fulfil the conditions for entry, stay or residence in that Member State. These persons could have entered the EU avoiding immigration control or with false documents, or they may have entered legitimately but have stayed there on an illegal basis (for example by staying longer than the author-ised period). As the number refers only to ‘detected’ irregular immigrants, it does not give the overall number of irregular immigrants in the Member States which is estimated to be much higher.The bar chart shows the number of persons found to be illegally present in the EU28, split by Member State. No data are available for Sweden, Finland, Netherlands and Lithuania. The breakdown by age group at EU level is also presented.
0
30000
60000
90000
120000
150000
LVLUDKEEIEMTSISKROHRCZPTCYPLHUBGBEITATESUKELFRDE
0
30 000
60 000
90 000
120 000
150 000
DE FR EL UK ES AT IT BE BG HU PL CY PT CZ HR RO SK SI MT IE EE DK LU LV
128
290
96 3
75
73 6
70
65 3
65
47 8
85
33 0
55 25 3
00
15 5
40
12 8
70
12 1
60
12 0
50
4 98
0
4 53
0
4 43
0
2 50
0
2 33
5
1 15
5
1 02
5
990
900
720
515
440
265
Provisional total number of persons illegally present in the EU in 2014: 547 335
< 14
35 years or overFrom 18 to 34 yearsFrom 14 to 17 years
Less than 14 years64% 26%6%4%
14 - 17 18 - 34 > 34
Age group
H
M
L
LL
HH
Very high (more than 35 000)High (15 001 - 35 000)Medium (5 001 - 16 000)Low (1 000 - 5 000)Very low (less than 1 000)
EU28
Top 15 citizenshipsSyria
EritreaAfghanistan
MoroccoAlbania
PakistanIndia
TunisiaNigeria
UkraineAlgeriaSerbia
KosovoBangladesh
Somalia
84 55539 625
36 65030 92030 430
23 25517 14015 75515 55515 23514 80012 79010 4309 7109 300
(52 530)(29 545)(12 900)
(4 140)(3 395)
(-1 135)(1 330)(3 205)(1 715)(3 175)
(575)(2 295)(2 505)
(220)(725)
0 20000 40000 60000 80000 100000
Somalia
Bangladesh
Kosovo (under United Nations Security Council Resolution 1244/99)
Serbia
Algeria
Ukraine
Nigeria
Tunisia
India
Pakistan
Albania
Morocco
Afghanistan
Eritrea
Syria
Nationality of persons found to be illegally present in the EU (2014)
Most citizens found to be illegally present in the EU are from Syria, Eritrea and Afghanistan, with citizens from these countries representing one third of the total. The top 10 altogether represents more than 50%.
Members’ Research Service Page 3 of 4
Irregular immigration in the EU: Facts and FiguresEPRS
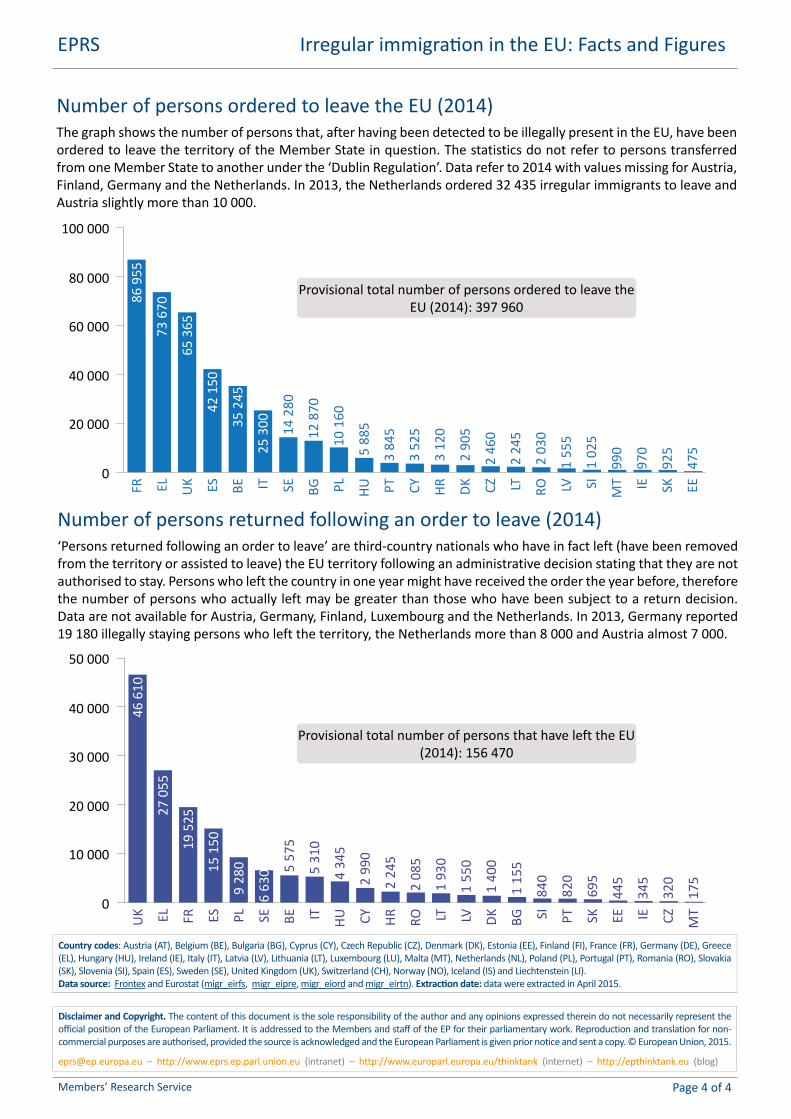
Number of persons returned following an order to leave (2014)‘Persons returned following an order to leave’ are third-country nationals who have in fact left (have been removed from the territory or assisted to leave) the EU territory following an administrative decision stating that they are not authorised to stay. Persons who left the country in one year might have received the order the year before, therefore the number of persons who actually left may be greater than those who have been subject to a return decision. Data are not available for Austria, Germany, Finland, Luxembourg and the Netherlands. In 2013, Germany reported 19 180 illegally staying persons who left the territory, the Netherlands more than 8 000 and Austria almost 7 000.
0
10000
20000
30000
40000
50000
MTCZIEEESKPTSIBGDKLVLTROHRCYHUITBESEPLESFRELUK
0
10 000
20 000
30 000
40 000
50 000
UK EL FR ES PL SE BE IT HU CY HR RO LT LV DK BG SI PT SK EE IE CZ MT
46 6
10
27 0
55
19 5
25
15 1
50
9 28
0
6 63
0 5 57
5
5 31
0
4 34
5
2 99
0
2 24
5
2 08
5
1 93
0
1 55
0
1 40
0
1 15
5
840
820
695
445
345
320
175
Provisional total number of persons that have left the EU (2014): 156 470
Number of persons ordered to leave the EU (2014)The graph shows the number of persons that, after having been detected to be illegally present in the EU, have been ordered to leave the territory of the Member State in question. The statistics do not refer to persons transferred from one Member State to another under the ‘Dublin Regulation’. Data refer to 2014 with values missing for Austria, Finland, Germany and the Netherlands. In 2013, the Netherlands ordered 32 435 irregular immigrants to leave and Austria slightly more than 10 000.
0
20000
40000
60000
80000
100000
EESKIEMTSILVROLTCZDKHRCYPTHUPLBGSEITBEESUKELFR
0
20 000
40 000
60 000
80 000
100 000
FR EL UK ES BE IT SE BG PL HU PT CY HR DK CZ LT RO LV SI MT IE SK EE
86 9
55
73 6
70
65 3
65
42 1
50
35 2
45
25 3
00 14 2
80
12 8
70
10 1
60
5 88
5
3 84
5
3 52
5
3 12
0
2 90
5
2 46
0
2 24
5
2 03
0
1 55
5
1 02
5
990
970
925
475
Provisional total number of persons ordered to leave the EU (2014): 397 960
Country codes: Austria (AT), Belgium (BE), Bulgaria (BG), Cyprus (CY), Czech Republic (CZ), Denmark (DK), Estonia (EE), Finland (FI), France (FR), Germany (DE), Greece (EL), Hungary (HU), Ireland (IE), Italy (IT), Latvia (LV), Lithuania (LT), Luxembourg (LU), Malta (MT), Netherlands (NL), Poland (PL), Portugal (PT), Romania (RO), Slovakia (SK), Slovenia (SI), Spain (ES), Sweden (SE), United Kingdom (UK), Switzerland (CH), Norway (NO), Iceland (IS) and Liechtenstein (LI).Data source: Frontex and Eurostat (migr_eirfs, migr_eipre, migr_eiord and migr_eirtn). Extraction date: data were extracted in April 2015.
Disclaimer and Copyright. The content of this document is the sole responsibility of the author and any opinions expressed therein do not necessarily represent the official position of the European Parliament. It is addressed to the Members and staff of the EP for their parliamentary work. Reproduction and translation for non-commercial purposes are authorised, provided the source is acknowledged and the European Parliament is given prior notice and sent a copy. © European Union, 2015.
[email protected] – http://www.eprs.ep.parl.union.eu (intranet) – http://www.europarl.europa.eu/thinktank (internet) – http://epthinktank.eu (blog)
Members’ Research Service Page 4 of 4
Irregular immigration in the EU: Facts and FiguresEPRS


